Annual Report 2001 - Chubb Group of Insurance Companies
Annual Report 2001 - Chubb Group of Insurance Companies
Annual Report 2001 - Chubb Group of Insurance Companies

You also want an ePaper? Increase the reach of your titles
YUMPU automatically turns print PDFs into web optimized ePapers that Google loves.
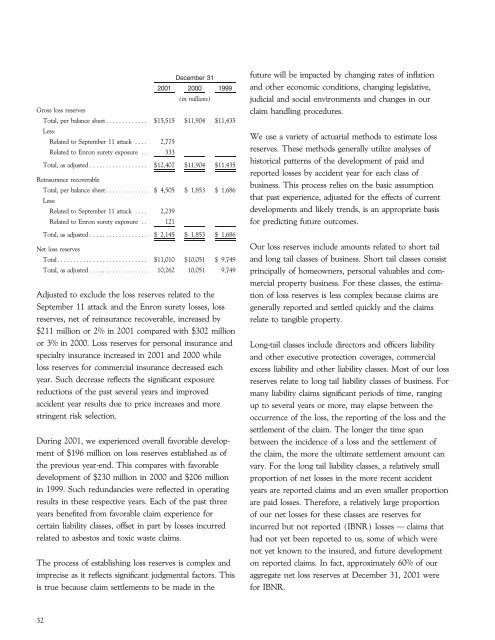
Gross loss reserves<br />
December 31<br />
<strong>2001</strong> 2000 1999<br />
(in millions)<br />
Total, per balance sheetÏÏÏÏÏÏÏÏÏÏÏÏÏ $15,515 $11,904 $11,435<br />
Less:<br />
future will be impacted by changing rates <strong>of</strong> inÖation<br />
and other economic conditions, changing legislative,<br />
judicial and social environments and changes in our<br />
claim handling procedures.<br />
We use a variety <strong>of</strong> actuarial methods to estimate loss<br />
Related to September 11 attack ÏÏÏÏ 2,775<br />
Related to Enron surety exposure ÏÏ 333<br />
reserves. These methods generally utilize analyses <strong>of</strong><br />
historical patterns <strong>of</strong> the development <strong>of</strong> paid and<br />
reported losses by accident year for each class <strong>of</strong><br />
business. This process relies on the basic assumption<br />
that past experience, adjusted for the eÅects <strong>of</strong> current<br />
Related to September 11 attack ÏÏÏÏ 2,239<br />
developments and likely trends, is an appropriate basis<br />
Related to Enron surety exposure ÏÏ 121 for predicting future outcomes.<br />
Total, as adjusted ÏÏÏÏÏÏÏÏÏÏÏÏÏÏÏÏÏÏ $12,407 $11,904 $11,435<br />
Reinsurance recoverable<br />
Total, per balance sheetÏÏÏÏÏÏÏÏÏÏÏÏÏ $ 4,505 $ 1,853 $ 1,686<br />
Less:<br />
Total, as adjusted ÏÏÏÏÏÏÏÏÏÏÏÏÏÏÏÏÏÏ $ 2,145 $ 1,853 $ 1,686<br />
Net loss reserves<br />
Our loss reserves include amounts related to short tail<br />
TotalÏÏÏÏÏÏÏÏÏÏÏÏÏÏÏÏÏÏÏÏÏÏÏÏÏÏÏÏ $11,010 $10,051 $ 9,749 and long tail classes <strong>of</strong> business. Short tail classes consist<br />
Total, as adjusted ÏÏÏÏÏÏÏÏÏÏÏÏÏÏÏÏÏÏ 10,262 10,051 9,749 principally <strong>of</strong> homeowners, personal valuables and commercial<br />
property business. For these classes, the estima-<br />
Adjusted to exclude the loss reserves related to the tion <strong>of</strong> loss reserves is less complex because claims are<br />
September 11 attack and the Enron surety losses, loss generally reported and settled quickly and the claims<br />
reserves, net <strong>of</strong> reinsurance recoverable, increased by relate to tangible property.<br />
$211 million or 2% in <strong>2001</strong> compared with $302 million<br />
or 3% in 2000. Loss reserves for personal insurance and Long-tail classes include directors and oÇcers liability<br />
specialty insurance increased in <strong>2001</strong> and 2000 while and other executive protection coverages, commercial<br />
loss reserves for commercial insurance decreased each excess liability and other liability classes. Most <strong>of</strong> our loss<br />
year. Such decrease reÖects the signiÑcant exposure reserves relate to long tail liability classes <strong>of</strong> business. For<br />
reductions <strong>of</strong> the past several years and improved many liability claims signiÑcant periods <strong>of</strong> time, ranging<br />
accident year results due to price increases and more up to several years or more, may elapse between the<br />
stringent risk selection.<br />
occurrence <strong>of</strong> the loss, the reporting <strong>of</strong> the loss and the<br />
settlement <strong>of</strong> the claim. The longer the time span<br />
During <strong>2001</strong>, we experienced overall favorable develop- between the incidence <strong>of</strong> a loss and the settlement <strong>of</strong><br />
ment <strong>of</strong> $196 million on loss reserves established as <strong>of</strong> the claim, the more the ultimate settlement amount can<br />
the previous year-end. This compares with favorable vary. For the long tail liability classes, a relatively small<br />
development <strong>of</strong> $230 million in 2000 and $206 million proportion <strong>of</strong> net losses in the more recent accident<br />
in 1999. Such redundancies were reÖected in operating years are reported claims and an even smaller proportion<br />
results in these respective years. Each <strong>of</strong> the past three are paid losses. Therefore, a relatively large proportion<br />
years beneÑted from favorable claim experience for <strong>of</strong> our net losses for these classes are reserves for<br />
certain liability classes, oÅset in part by losses incurred incurred but not reported (IBNR) losses Ì claims that<br />
related to asbestos and toxic waste claims.<br />
had not yet been reported to us, some <strong>of</strong> which were<br />
not yet known to the insured, and future development<br />
The process <strong>of</strong> establishing loss reserves is complex and on reported claims. In fact, approximately 60% <strong>of</strong> our<br />
imprecise as it reÖects signiÑcant judgmental factors. This aggregate net loss reserves at December 31, <strong>2001</strong> were<br />
is true because claim settlements to be made in the for IBNR.<br />
32