Annual Report 2001 - Chubb Group of Insurance Companies
Annual Report 2001 - Chubb Group of Insurance Companies
Annual Report 2001 - Chubb Group of Insurance Companies

Create successful ePaper yourself
Turn your PDF publications into a flip-book with our unique Google optimized e-Paper software.
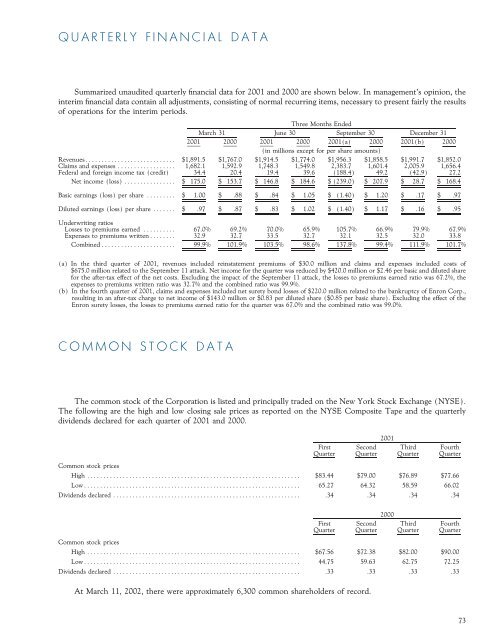
QUARTERLY FINANCIAL DATA<br />
Summarized unaudited quarterly Ñnancial data for <strong>2001</strong> and 2000 are shown below. In management's opinion, the<br />
interim Ñnancial data contain all adjustments, consisting <strong>of</strong> normal recurring items, necessary to present fairly the results<br />
<strong>of</strong> operations for the interim periods.<br />
Three Months Ended<br />
March 31 June 30 September 30 December 31<br />
<strong>2001</strong> 2000 <strong>2001</strong> 2000 <strong>2001</strong>(a) 2000 <strong>2001</strong>(b) 2000<br />
(in millions except for per share amounts)<br />
RevenuesÏÏÏÏÏÏÏÏÏÏÏÏÏÏÏÏÏÏÏÏÏÏÏÏÏÏÏÏ $1,891.5 $1,767.0 $1,914.5 $1,774.0 $1,956.3 $1,858.5 $1,991.7 $1,852.0<br />
Claims and expenses ÏÏÏÏÏÏÏÏÏÏÏÏÏÏÏÏÏÏ 1,682.1 1,592.9 1,748.3 1,549.8 2,383.7 1,601.4 2,005.9 1,656.4<br />
Federal and foreign income tax (credit) 34.4 20.4 19.4 39.6 (188.4) 49.2 (42.9) 27.2<br />
Net income (loss) ÏÏÏÏÏÏÏÏÏÏÏÏÏÏÏÏ $ 175.0 $ 153.7 $ 146.8 $ 184.6 $ (239.0) $ 207.9 $ 28.7 $ 168.4<br />
Basic earnings (loss) per share ÏÏÏÏÏÏÏÏÏ $ 1.00 $ .88 $ .84 $ 1.05 $ (1.40) $ 1.20 $ .17 $ .97<br />
Diluted earnings (loss) per share ÏÏÏÏÏÏÏ $ .97 $ .87 $ .83 $ 1.02 $ (1.40) $ 1.17 $ .16 $ .95<br />
Underwriting ratios<br />
Losses to premiums earned ÏÏÏÏÏÏÏÏÏÏ 67.0% 69.2% 70.0% 65.9% 105.7% 66.9% 79.9% 67.9%<br />
Expenses to premiums writtenÏÏÏÏÏÏÏÏ 32.9 32.7 33.5 32.7 32.1 32.5 32.0 33.8<br />
Combined ÏÏÏÏÏÏÏÏÏÏÏÏÏÏÏÏÏÏÏÏÏÏÏ 99.9% 101.9% 103.5% 98.6% 137.8% 99.4% 111.9% 101.7%<br />
(a) In the third quarter <strong>of</strong> <strong>2001</strong>, revenues included reinstatement premiums <strong>of</strong> $30.0 million and claims and expenses included costs <strong>of</strong><br />
$675.0 million related to the September 11 attack. Net income for the quarter was reduced by $420.0 million or $2.46 per basic and diluted share<br />
for the after-tax eÅect <strong>of</strong> the net costs. Excluding the impact <strong>of</strong> the September 11 attack, the losses to premiums earned ratio was 67.2%, the<br />
expenses to premiums written ratio was 32.7% and the combined ratio was 99.9%.<br />
(b) In the fourth quarter <strong>of</strong> <strong>2001</strong>, claims and expenses included net surety bond losses <strong>of</strong> $220.0 million related to the bankruptcy <strong>of</strong> Enron Corp.,<br />
resulting in an after-tax charge to net income <strong>of</strong> $143.0 million or $0.83 per diluted share ($0.85 per basic share). Excluding the eÅect <strong>of</strong> the<br />
Enron surety losses, the losses to premiums earned ratio for the quarter was 67.0% and the combined ratio was 99.0%.<br />
COMMON STOCK DATA<br />
The common stock <strong>of</strong> the Corporation is listed and principally traded on the New York Stock Exchange (NYSE).<br />
The following are the high and low closing sale prices as reported on the NYSE Composite Tape and the quarterly<br />
dividends declared for each quarter <strong>of</strong> <strong>2001</strong> and 2000.<br />
<strong>2001</strong><br />
First Second Third Fourth<br />
Quarter Quarter Quarter Quarter<br />
Common stock prices<br />
High ÏÏÏÏÏÏÏÏÏÏÏÏÏÏÏÏÏÏÏÏÏÏÏÏÏÏÏÏÏÏÏÏÏÏÏÏÏÏÏÏÏÏÏÏÏÏÏÏÏÏÏÏÏÏÏÏÏÏÏÏÏÏÏÏÏÏ $83.44 $79.00 $76.89 $77.66<br />
LowÏÏÏÏÏÏÏÏÏÏÏÏÏÏÏÏÏÏÏÏÏÏÏÏÏÏÏÏÏÏÏÏÏÏÏÏÏÏÏÏÏÏÏÏÏÏÏÏÏÏÏÏÏÏÏÏÏÏÏÏÏÏÏÏÏÏÏ 65.27 64.32 58.59 66.02<br />
Dividends declared ÏÏÏÏÏÏÏÏÏÏÏÏÏÏÏÏÏÏÏÏÏÏÏÏÏÏÏÏÏÏÏÏÏÏÏÏÏÏÏÏÏÏÏÏÏÏÏÏÏÏÏÏÏÏÏÏÏÏ .34 .34 .34 .34<br />
2000<br />
First Second Third Fourth<br />
Quarter Quarter Quarter Quarter<br />
Common stock prices<br />
High ÏÏÏÏÏÏÏÏÏÏÏÏÏÏÏÏÏÏÏÏÏÏÏÏÏÏÏÏÏÏÏÏÏÏÏÏÏÏÏÏÏÏÏÏÏÏÏÏÏÏÏÏÏÏÏÏÏÏÏÏÏÏÏÏÏÏ $67.56 $72.38 $82.00 $90.00<br />
LowÏÏÏÏÏÏÏÏÏÏÏÏÏÏÏÏÏÏÏÏÏÏÏÏÏÏÏÏÏÏÏÏÏÏÏÏÏÏÏÏÏÏÏÏÏÏÏÏÏÏÏÏÏÏÏÏÏÏÏÏÏÏÏÏÏÏÏ 44.75 59.63 62.75 72.25<br />
Dividends declared ÏÏÏÏÏÏÏÏÏÏÏÏÏÏÏÏÏÏÏÏÏÏÏÏÏÏÏÏÏÏÏÏÏÏÏÏÏÏÏÏÏÏÏÏÏÏÏÏÏÏÏÏÏÏÏÏÏÏ .33 .33 .33 .33<br />
At March 11, 2002, there were approximately 6,300 common shareholders <strong>of</strong> record.<br />
73