Comprehensive Annual Financial Report for FY 2012 - Omnitrans
Comprehensive Annual Financial Report for FY 2012 - Omnitrans
Comprehensive Annual Financial Report for FY 2012 - Omnitrans

You also want an ePaper? Increase the reach of your titles
YUMPU automatically turns print PDFs into web optimized ePapers that Google loves.
CONNECTING OUR COMMUNITY<br />
OMNITRANS, San Bernardino, Cali<strong>for</strong>nia<br />
COMPREHENSIVE ANNUAL REPORT
COMPREHENSIVE ANNUAL FINANCIAL REPORT<br />
Be<strong>for</strong>e I came to <strong>Omnitrans</strong>, I always thought <strong>Omnitrans</strong> was a good organization. Now, having been <strong>Omnitrans</strong>’<br />
CEO/General Manager <strong>for</strong> two-and-a-half years, I know it is a great organization. <strong>Omnitrans</strong> only has one true<br />
purpose – to safely transport people from point A to point B. The difference we make in people’s lives each<br />
day is an experience our coach operators are <strong>for</strong>tunate to witness as passengers make their way from home<br />
to work, school, the store, medical centers, and back home again. It’s all about acknowledging the people that<br />
make <strong>Omnitrans</strong> a great organization – our passengers, our employees, and our business partners.<br />
<strong>Omnitrans</strong> is currently in the midst of a <strong>Comprehensive</strong> Operational Analysis (COA), one of the most extensive<br />
ever to be conducted of <strong>Omnitrans</strong> by San Bernardino Associated Governments (SANBAG). According to the<br />
objective of the COA, there is the potential <strong>for</strong> numerous changes in our organizational structure and service<br />
delivery model. The challenge ahead will be to focus on what must be done to successfully implement the<br />
recommendation(s) of the COA adopted by the Board of Directors, while maintaining the highest sustainable<br />
quality of service. The completion of the COA is essential to charting the path <strong>for</strong>ward <strong>for</strong> <strong>Omnitrans</strong> and reinventing<br />
the Agency to meet the growing demand <strong>for</strong> public transit services in our community.<br />
MILO VICTORIA<br />
CEO/General Manager<br />
MISSION:<br />
To provide the San Bernardino Valley with comprehensive mass transportation services,<br />
which maximize customer use, com<strong>for</strong>t, safety, and satisfaction while efficiently using<br />
financial and other resources, in an environmentally sensitive manner.
OMNITRANS<br />
San Bernardino, Cali<strong>for</strong>nia<br />
COMPREHENSIVE ANNUAL FINANCIAL REPORT<br />
Fiscal Year Ended June 30, <strong>2012</strong><br />
(With Independent Auditor’s <strong>Report</strong> Thereon)<br />
Prepared by the Finance Department<br />
DONALD WALKER<br />
Director of Finance
TABLE OF CONTENTS<br />
INTRODUCTORY SECTION<br />
Letter of Transmittal<br />
Organizational Chart<br />
List of Elected and Appointed Officials<br />
GFOA Certificate of Achievement<br />
General In<strong>for</strong>mation<br />
i<br />
iii<br />
iv<br />
vii<br />
viii<br />
FINANCIAL SECTION<br />
Independent Auditorș <strong>Report</strong> 1<br />
Management’s Discussion and Analysis (required supplementary in<strong>for</strong>mation) 3<br />
<strong>Financial</strong> Highlights 3<br />
Overview of the <strong>Financial</strong> Statements 3<br />
Net Position 8<br />
Changes in Net Position 9<br />
Basic <strong>Financial</strong> Statements 12<br />
Statement of Net Position 12<br />
Statement of Revenues, Expenses and Changes in Net Assets 13<br />
Statement of Cash Flows 14<br />
Notes to Basic <strong>Financial</strong> Statements 16<br />
STATISTICAL SECTION<br />
<strong>Financial</strong> Trends 32<br />
Net Position by Component 32<br />
Changes in Net Position 33<br />
Revenue Capacity 34<br />
Revenue Source 34<br />
Demographic and Economic In<strong>for</strong>mation 35<br />
Demographics and Statistics of San Bernardino County 35<br />
Principal Employers of San Bernardino County 35<br />
Industry Employment and Labor Force 36<br />
Operating In<strong>for</strong>mation 40<br />
Number of Employees 40<br />
Operating Expenses by Category 41<br />
Operating Expenses by Function 41<br />
Capital Assets by Function 42
INTRODUCTORY SECTION<br />
CONNECTING<br />
OUR<br />
COMMUNITY
INTRODUCTORY SECTION<br />
CONNECTING<br />
OUR<br />
COMMUNITY
January 9, 2013<br />
To the Members of the <strong>Omnitrans</strong> Board of Directors, CEO/General Manager and Citizens of the County of San Bernardino.<br />
INTRODUCTORY SECTION<br />
Cali<strong>for</strong>nia Government Code sections 25250 and 25253 require that every general-purpose local government publish<br />
within six months of the close of each fiscal year a complete set of audited financial statements. This report is published in<br />
fulfillment of that requirement <strong>for</strong> the fiscal year ended June 30, <strong>2012</strong>.<br />
The <strong>Comprehensive</strong> <strong>Annual</strong> <strong>Financial</strong> <strong>Report</strong> (CAFR) is a valuable tool that enables <strong>Omnitrans</strong>’ officials to make sound financial<br />
decisions. This report provides an independently audited account of the financial condition of the Agency. The financial statements,<br />
supplemental schedules, and statistical in<strong>for</strong>mation are the representations of <strong>Omnitrans</strong>’ management. Consequently,<br />
management assumes full responsibility <strong>for</strong> their accuracy, completeness and fairness. To provide a reasonable basis <strong>for</strong><br />
making these representations, management has established a comprehensive internal-control framework that is designed both to<br />
protect the Agency’s assets from loss, theft or misuse, and to compile sufficient reliable in<strong>for</strong>mation <strong>for</strong> the preparation of the<br />
Agency’s financial statements in con<strong>for</strong>mity with generally accepted accounting principles. In con<strong>for</strong>mance with these principles,<br />
this report was developed on the accrual basis of accounting, treating <strong>Omnitrans</strong> as a single enterprise fund.<br />
Mayer Hoffman McCann LLP, a firm of licensed certified public accountants, audited <strong>Omnitrans</strong>’ financial statements. The<br />
goal of the independent audit is to provide reasonable assurance that the financial statements of the Agency <strong>for</strong> the fiscal<br />
year ended June 30, <strong>2012</strong> are free of material misstatement. The independent audit involves examining, on a test basis,<br />
evidence supporting the amounts and disclosures in the financial statements; assessing the accounting principles used and<br />
significant estimates made by management; and evaluating the overall financial statement presentation. The independent<br />
auditor concluded, based upon the audit, that there was a reasonable basis <strong>for</strong> rendering an unqualified opinion that<br />
<strong>Omnitrans</strong>’ financial statements <strong>for</strong> the fiscal year ended June 30, <strong>2012</strong> are fairly represented in con<strong>for</strong>mity with Generally<br />
Accepted Accounting Principles (GAAP). The independent auditor’s report is presented as the first component of the financial<br />
section of this report.<br />
Management’s Discussion and Analysis (MD&A) immediately follows the independent auditor’s report and provides a narrative<br />
introduction, overview and analysis of the basic financial statements. MD&A complement this letter of transmittal and should be<br />
read in conjunction with it.<br />
The independent audit of the financial statements of <strong>Omnitrans</strong> was part of a broader, federally mandated “Single Audit” designed<br />
to meet the special needs of federal grantor agencies. The standards governing Single Audit engagements require the independent<br />
auditor to report on the fair presentation of the financial statements, with special emphasis on internal controls and legal<br />
requirements involving the administration of federal awards. These reports are included in a separate Single Audit report.<br />
continued on next page<br />
<strong>Omnitrans</strong> • 1700 West Fifth Street • San Bernardino, CA 92411<br />
Phone: 909-379-7100 • Web site: www.omnitrans.org • Fax 909-889-5779<br />
Serving the communities of Chino Hills, Colton, County of San Bernardino, Fontana, Grand Terrace, Highland, Loma Linda,<br />
Montclair, Ontario, Rancho Cucamonga, Redlands, Rialto, San Bernardino, Upland and Yucaipa.<br />
<strong>2012</strong> <strong>Comprehensive</strong> <strong>Annual</strong> <strong>Financial</strong> <strong>Report</strong><br />
i
As stewards of the taxpayer’s money, <strong>Omnitrans</strong> continues to achieve its primary objective of safeguarding the funds<br />
entrusted to us. Our primary focus is the planning, securing and controlling of <strong>Omnitrans</strong>’ financial resources. This includes:<br />
INTRODUCTORY SECTION<br />
•Developing an Accurate Budget<br />
Develop a realistic budget that clearly indicates what expenditures <strong>Omnitrans</strong> will incur during the fiscal year. In<br />
doing so, the finance department assists all departments of the agency in planning their activities. The budget<br />
clearly shows how much departments can spend on each particular activity.<br />
•Coordinating Activities With Other Departments<br />
Strive to coordinate the flow of funds with the agency's activities, using long-range planning while preparing<br />
<strong>for</strong> short-term needs. This involves timing, making sure <strong>Omnitrans</strong> has sufficient funds <strong>for</strong> its activities when needed.<br />
•Secure Funding<br />
Research, apply and secure all available funding opportunities to ensure adequate cash flow to support the<br />
construction, operation and maintenance of <strong>Omnitrans</strong>’ transportation system. This includes the day-to-day<br />
operations as well as long-term goals.<br />
•Maintaining Transparency<br />
Provide transparency in our operations to all the stakeholders of <strong>Omnitrans</strong> to instill a sense of trust by consistent<br />
actions that show we are reliable, cooperative and committed to the success of <strong>Omnitrans</strong>. This includes providing<br />
thorough and accurate financial in<strong>for</strong>mation to all stakeholders.<br />
<strong>Omnitrans</strong> takes great pride in the fact that previously issued CAFRs have been awarded a prestigious award by the<br />
Government Finance Officers Association (GFOA) in the <strong>for</strong>m of its Certificate of Achievement <strong>for</strong> Excellence in <strong>Financial</strong><br />
<strong>Report</strong>ing. <strong>Omnitrans</strong> has received the GFOA “Certificate of Achievement <strong>for</strong> Excellence in Finance <strong>Report</strong>ing” a total of<br />
nine times. These prior awards and the one that we are currently seeking this year evidence the significant improvements<br />
regarding the strengthening of internal controls and our compliance with stringent GFOA standards <strong>for</strong> professional<br />
financial reporting. <strong>Omnitrans</strong>’ system of internal control is supported by written policies and procedures and is<br />
continually reviewed, evaluated and modified to meet current needs.<br />
ii<br />
<strong>2012</strong> <strong>Comprehensive</strong> <strong>Annual</strong> <strong>Financial</strong> <strong>Report</strong>
ORGANIZATIONAL CHART<br />
BOARD OF<br />
DIRECTORS<br />
CHIEF EXECUTIVE<br />
OFFICER / GENERAL<br />
MANAGER<br />
INTRODUCTORY SECTION<br />
CHIEF FINANCIAL<br />
OFFICER<br />
MANAGER<br />
INTEGRATED<br />
PROJECT<br />
MANAGEMENT<br />
DIRECTOR OF<br />
FINANCE<br />
DIRECTOR OF<br />
PROCUREMENT<br />
ASSISTANT TO<br />
CEO/GENERAL<br />
MANAGER<br />
DIRECTOR OF<br />
INFORMATION<br />
TECHNOLOGY<br />
ADMINISTRATIVE<br />
SECRETARY<br />
DIRECTOR OF<br />
SAFETY &<br />
REGULATORY<br />
COMPLIANCE<br />
DIRECTOR OF<br />
OPERATIONS<br />
DIRECTOR OF<br />
MAINTENANCE<br />
DIRECTOR OF<br />
PLANNING &<br />
DEVELOPMENT<br />
SERVICES<br />
DIRECTOR OF<br />
HUMAN<br />
RESOURCES<br />
DIRECTOR OF<br />
MARKETING<br />
DIRECTOR OF<br />
INTERNAL<br />
AUDIT<br />
SERVICES<br />
<strong>2012</strong> <strong>Comprehensive</strong> <strong>Annual</strong> <strong>Financial</strong> <strong>Report</strong><br />
iii
OMNITRANS SENIOR LEADERSHIP TEAM<br />
INTRODUCTORY SECTION<br />
Milo Victoria<br />
CEO/General Manager<br />
Robert L. Miller<br />
Chief <strong>Financial</strong> Officer<br />
Donald Walker<br />
Director of Finance<br />
Marjorie Ewing<br />
Director of Human Resources<br />
William Tsuei<br />
Director of In<strong>for</strong>mation Technology<br />
Milind Joshi<br />
Manager of Integrated Project Management Office<br />
Samuel J. Gibbs<br />
Director of Internal Audit Services<br />
Jack Dooley<br />
Director of Maintenance<br />
Wendy S. Williams<br />
Director of Marketing<br />
P. Scott Graham<br />
Director of Operations<br />
Rohan Kuruppu<br />
Director of Planning and Development Services<br />
Jennifer Sims<br />
Director of Procurement<br />
Ray Lopez<br />
Director of Safety and Regulatory Compliance<br />
iv<br />
<strong>2012</strong> <strong>Comprehensive</strong> <strong>Annual</strong> <strong>Financial</strong> <strong>Report</strong>
OMNITRANS BOARD OF DIRECTORS<br />
INTRODUCTORY SECTION<br />
Chair<br />
Dick Riddell<br />
- Yucaipa -<br />
Vice Chair<br />
Alan D. Wapner<br />
- Ontario -<br />
Supervisor<br />
Gary Ovitt<br />
- County -<br />
Supervisor<br />
Brad Mitzelfelt<br />
- County -<br />
Supervisor<br />
Neil Derry<br />
- County -<br />
Supervisor<br />
Josie Gonzales<br />
- County -<br />
Supervisor<br />
Janice Ruther<strong>for</strong>d<br />
- County -<br />
Dennis Yates<br />
- Chino -<br />
<strong>2012</strong> <strong>Comprehensive</strong> <strong>Annual</strong> <strong>Financial</strong> <strong>Report</strong><br />
v
INTRODUCTORY SECTION<br />
Ed Graham<br />
- Chino Hills -<br />
Frank Gonzales<br />
- Colton -<br />
John B. Roberts, Jr<br />
- Fontana -<br />
Lee Ann Garcia<br />
- Grand Terrace -<br />
Ron Dailey<br />
- Loma Linda -<br />
Paul Eaton<br />
- Montclair -<br />
Penny Liburn<br />
- Highland -<br />
Sam Spagnolo<br />
- Rancho Cucamonga -<br />
Paul Foster<br />
- Redlands -<br />
Edward M. Palmer<br />
- Rialto -<br />
Pat Morris<br />
- San Bernardino -<br />
Ray Musser<br />
- Upland -<br />
vi<br />
<strong>2012</strong> <strong>Comprehensive</strong> <strong>Annual</strong> <strong>Financial</strong> <strong>Report</strong>
INTRODUCTORY SECTION<br />
<strong>2012</strong> <strong>Comprehensive</strong> <strong>Annual</strong> <strong>Financial</strong> <strong>Report</strong><br />
vii
INTRODUCTORY SECTION<br />
PROFILE OF OMNITRANS<br />
<strong>Omnitrans</strong> was founded in 1976 under a Joint Powers<br />
Agreement to provide transportation service to the<br />
San Bernardino Valley. <strong>Omnitrans</strong> is the major public<br />
transportation provider in the San Bernardino Valley, with<br />
a service area of approximately 456 square miles, serving<br />
15 municipalities, and many unincorporated areas of San<br />
Bernardino County. <strong>Omnitrans</strong> also travels beyond the<br />
service area to Pomona and Riverside, to provide links to<br />
neighboring transit agencies. The service area is bordered<br />
by the Los Angeles County line to the west, the San Gabriel<br />
and San Bernardino Mountains to the north, Yucaipa in the<br />
east and the Riverside County line to the south. The map<br />
below shows the <strong>Omnitrans</strong> service area. Employees work<br />
out of two locations: East Valley (San Bernardino) and<br />
West Valley (Montclair).<br />
The Board of Directors, made up of elected officials from<br />
each of the member jurisdictions, governs the Agency.<br />
The member jurisdictions include the following:<br />
City of Chino<br />
City of Chino Hills<br />
City of Colton<br />
City of Fontana<br />
City of Grand Terrace<br />
City of Highland<br />
City of Loma Linda<br />
City of Montclair<br />
City of Ontario<br />
City of Rancho Cucamonga<br />
County of San Bernardino<br />
City of Redlands<br />
City of Rialto<br />
City of San Bernardino<br />
City of Upland<br />
City of Yucaipa<br />
Three Board committees oversee specific functional<br />
areas of the Agency with the provision to create ad-hoc<br />
committees as needed. These subcommittees are:<br />
1. Executive Committee<br />
2. Administrative and Finance Committee<br />
3. Plans and Programs Committee<br />
As of June 30, <strong>2012</strong>, <strong>Omnitrans</strong> had a staff of 635 employees<br />
to provide its services. The CEO/General Manager is<br />
responsible <strong>for</strong> the day-to-day management of the Agency<br />
and acts as the liaison to the Board of Directors and each<br />
of the committees. <strong>Report</strong>ing to the CEO/General Manager<br />
are the following departments:<br />
1. Administration<br />
2. Human Resources<br />
3. Maintenance<br />
4. Marketing<br />
5. Operations<br />
6. Planning<br />
7. Safety and Security<br />
8. Integrated Project Management Office<br />
<strong>Report</strong>ing to the Chief <strong>Financial</strong> Officer are the<br />
following departments:<br />
1. Finance<br />
2. In<strong>for</strong>mation Technology<br />
3. Procurement<br />
As cited in its Joint Powers Agreement (JPA), <strong>Omnitrans</strong><br />
was created as a single umbrella agency to serve the bus<br />
transit needs of the San Bernardino Valley. Provisions were<br />
made in the JPA to: 1) Establish a uni<strong>for</strong>m fare policy within<br />
the service area; 2) To coordinate a region-wide bus transit<br />
marketing program; and 3) To consolidate bus transit<br />
operating and administrative functions in order to achieve<br />
increased economies of scale.<br />
Each city has one member and the County of San<br />
Bernardino has five members on the Board, who represent<br />
their respective County Districts. The Board is responsible<br />
<strong>for</strong> all policy, regulatory and budgetary decisions of<br />
the Agency.<br />
RANCHO<br />
SAN BERNARDINO<br />
MONTCLAIR CUCAMONGA<br />
RIALTO<br />
UPLAND<br />
HIGHLAND<br />
FONTANA<br />
ONTARIO<br />
COLTON<br />
YUCAIPA<br />
GRAND LOMA<br />
TERRACE LINDA REDLANDS<br />
CHINO<br />
CHINO<br />
HILLS<br />
To meet the bus transportation service demands efficiently<br />
and effectively, <strong>Omnitrans</strong> uses a multimodal approach to<br />
the provisions of service. The types of services presently<br />
offered are summarized below:<br />
LOCAL FIXED-ROUTE SERVICE<br />
• In accordance with the Operational Standards <strong>for</strong> the<br />
provision of service, <strong>Omnitrans</strong> operates 27 fixed routes<br />
and five OmniGo local circulator routes.<br />
• Routes operate at 15- to 60-minute intervals.<br />
• All routes operate Monday through Friday with service<br />
beginning at 3:48 AM and ending at 11:13 PM. On Saturdays,<br />
there are 25 routes and four OmniGo circulators in operation<br />
viii<br />
<strong>2012</strong> <strong>Comprehensive</strong> <strong>Annual</strong> <strong>Financial</strong> <strong>Report</strong>
with service beginning at 5:13 AM and ending at 10:16 PM.<br />
On Sundays, there are 23 routes and four OmniGo circulators<br />
in service, which begin at 5:52 AM and end at 7:54 PM.<br />
• Coordinated local fixed-route service with Orange County<br />
Transit Authority, Foothill Transit, Los Angeles County<br />
Metropolitan Transportation Authority (limited), Riverside<br />
Transit Agency, and Mountain Area Regional Transit Authority;<br />
operated under Cooperative and/or Joint Service Agreements<br />
between <strong>Omnitrans</strong> and neighboring transit operators.<br />
OMNIGO CIRCULATOR SERVICE<br />
• OmniGo is a new fixed-route community circulator service<br />
that operates in the cities of Chino Hills, Grand Terrace<br />
and Yucaipa.<br />
• Implemented in September of 2010, it connects points<br />
of interest within each city and provides connectivity to<br />
<strong>Omnitrans</strong> fixed-route bus services.<br />
• All OmniGo services are contracted out by <strong>Omnitrans</strong> and<br />
operated by a private contractor.<br />
• The vehicles used are the 16-passenger cutaway<br />
vehicles similar to those used by OmniLink and Access;<br />
this ensures that the service can both navigate the narrow<br />
residential streets and serve the residents of the city more<br />
cost-effectively.<br />
• OmniGo routes operate all week long with the following<br />
spans: <strong>for</strong> Yucaipa Routes 308 and 309, Weekdays: 6:11 AM<br />
to 8:55 PM, Saturdays: 7:00 AM to 8:25 PM, Sundays: 7:30<br />
AM to 6:39 PM; <strong>for</strong> Yucaipa Route 310, Weekdays: 6:00 AM<br />
to 7:52 PM; <strong>for</strong> Grand Terrace Route 325, Weekdays: 5:17<br />
AM to 8:19 PM, Saturdays: 7:17 AM to 6:14 PM, Sundays:<br />
8:27 AM to 6:14 PM; <strong>for</strong> Chino Hills Route 365, Weekdays:<br />
5:05 AM to 10:00 PM, Saturdays: 6:05 AM to 7:00 PM, and<br />
Sundays: 6:05 AM to 6:00 PM.<br />
• OmniGo fares are the same as those <strong>for</strong> other <strong>Omnitrans</strong><br />
fixed-route bus services.<br />
REGIONAL FIXED-ROUTE SERVICE<br />
• Route 215 is a cross-county service provided by<br />
<strong>Omnitrans</strong>. This route provides service between the<br />
<strong>Omnitrans</strong> 4th Street Transit Mall and Riverside Transit<br />
Agency’s Downtown Terminal.<br />
• This route operates on 20-/30-minute and<br />
60-minute frequencies.<br />
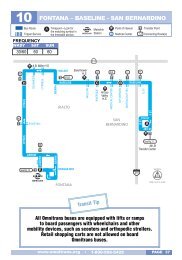
<strong>FY</strong> 12 FIXED-ROUTE SERVICE<br />
FREQUENCY BY ROUTE<br />
Route<br />
Service Days/Frequency<br />
Count Route Route Name Weekday Saturday Sunday<br />
1 1 ARMC-San Bernardino-Del Rosa 15/30 30 30<br />
2 2 Cal State-E Street-Loma Linda 15/30 20 20/30<br />
3 3 Baseline-Highland-San Bernardino CCW 15/20 20 20<br />
4 4 Baseline-Highland-San Bernardino CW 15/20 20 20<br />
5 5 San Bernardino-Del Rosa-Cal State 30/35 60 60<br />
6 7 N. San Bernardino-Sierra Way-San Bernardino 30/60 60 60<br />
7 8 San Bernardino-Mentone-Yucaipa 60 60 120<br />
8 9 San Bernardino-Redlands-Yucaipa 60 60 120<br />
9 10 Fontana-Baseline-San Bernardino 30/60 60 60<br />
10 11 San Bernardino-Muscoy-Cal State 30/60 60 60<br />
11 14 Fontana-Foothill-San Bernardino 15 15/30 15<br />
12 15 Fontana-San Bndo/Highland-Redlands 30 60 60<br />
13 19 Fontana-Colton-Redlands 30 60 60<br />
14 20 Fontana Metrolink-Via Hemlock-Kaiser 30 60 60<br />
15 22 North Rialto-Riverside Ave-ARMC 30 60 60<br />
16 29 Bloomington-Valley Blvd-Kaiser 60 60 *<br />
17 308/309 OmniGo: Yucaipa 30/60 30 60<br />
18 310 OmniGo: Yucaipa 30/60 * *<br />
19 325 OmniGo: Grand Terrace 70 70 70<br />
20 215 San Bernardino-Riverside 20/30 60 60<br />
21 61 Fontana-Ontario Mills-Pomona 15 15 15<br />
22 63 Chino-Ontario-Upland 60 60 60<br />
23 65 Montclair-Chino Hills 60 60 60<br />
24 66 Fontana-Foothill Blvd.-Montclair 15/30 30 30<br />
25 67 Montclair-Baseline-Fontana 60 * *<br />
26 68 Chino-Montclair-Chaffey College 20/40 60 *<br />
27 80 Montclair-OntConvCntr-Chaffey College 60 60 60<br />
28 81 Ontario-Ontario Mills-Chaffey College 60 * *<br />
29 82 Rancho Cucamonga-Fontana-Sierra Lakes 60 60 60<br />
30 83 Upland-Euclid-Chino 60 60 60<br />
31 365 OmniGo: Chino Hills 60 60 60<br />
METROLINK REGIONAL COMMUTER<br />
RAIL FEEDER SERVICE<br />
• Metrolink service is provided between <strong>Omnitrans</strong> service<br />
area, Los Angeles, Riverside, Orange, Ventura and San Diego<br />
Counties by Southern Cali<strong>for</strong>nia Regional Rail Authority.<br />
• <strong>Omnitrans</strong> provides feeder bus service to seven Metrolink<br />
Stations located in San Bernardino, Rialto, Fontana, Rancho<br />
Cucamonga, Upland, Montclair and East Ontario.<br />
• Metrolink ticket/pass is good <strong>for</strong> one free ride going to<br />
or leaving from any Metrolink Station that an <strong>Omnitrans</strong> bus<br />
serves. Tickets must be valid <strong>for</strong> the date on which you’re<br />
riding the bus.<br />
INTRODUCTORY SECTION<br />
<strong>2012</strong> <strong>Comprehensive</strong> <strong>Annual</strong> <strong>Financial</strong> <strong>Report</strong><br />
ix
INTRODUCTORY SECTION<br />
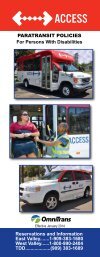
ACCESS<br />
• In accordance with the Americans with Disabilities Act<br />
(ADA), <strong>Omnitrans</strong> provides wheelchair-lift-equipped vans<br />
<strong>for</strong> curb-to-curb transportation services.<br />
• Reservations <strong>for</strong> service must be made one day in<br />
advance of your travel needs, with the option to call up<br />
to seven days in advance.<br />
• Access operates during the same days and hours<br />
as fixed route buses within a ¾-mile range of routes.<br />
• Who can ride Access? – Those persons with an <strong>Omnitrans</strong><br />
(or other transit agency) ADA certification ID card. Persons<br />
with an <strong>Omnitrans</strong> Disability card. Personal Care Attendants<br />
providing personal care to an ADA certified rider. Companions<br />
(Adult accompanying person with a disability) and/or Children<br />
of a qualified Adult ADA certified rider. (Maximum of two<br />
children 46” tall and under may ride free. Children under<br />
age 6 and/or under 60 pounds must travel in a rider-supplied,<br />
child-restraint device).<br />
OMNILINK<br />
• Omnilink is a general public demand response van service<br />
in the cities of Chino Hills and Yucaipa.<br />
• Reservations can be made <strong>for</strong> same-day service on a<br />
space-available basis. Reservations can also be made up<br />
to three days in advance.<br />
• Operates 7:00 AM to 6:00 PM, Monday through Friday.<br />
• Omnilink is available to the general public on a<br />
first-come, first-service basis.<br />
LOCAL ECONOMY<br />
The leading industries in San Bernardino County are<br />
government, retail and service industries. Light<br />
manufacturing and warehouses dominate portions of<br />
the County, particularly near Cali<strong>for</strong>nia State University<br />
and San Bernardino International Airport. <strong>Omnitrans</strong><br />
operates within the greater San Bernardino-Riverside<br />
County, commonly referred to as the Inland Empire (IE).<br />
San Bernardino-Riverside County residents can expect<br />
to see some growth in the area according to a recently<br />
released economic <strong>for</strong>ecast. The <strong>for</strong>ecast was authored<br />
by Beacon Economics and released in partnership with<br />
the University of Cali<strong>for</strong>nia, Riverside’s School of Business<br />
Administration. It will be several years be<strong>for</strong>e the IE<br />
experiences a return to peak employment levels, but<br />
employment is a lagging indicator, and the leading<br />
indicators show signs of continued growth, according<br />
to the report. The report’s key findings include:<br />
• The economic recovery in Inland Southern Cali<strong>for</strong>nia has<br />
been slow, but the recovery is moving in the right direction<br />
and the region has made significant progress.<br />
• The San Bernardino-Riverside metropolitan area has<br />
added 30,800 new jobs to its employment base since<br />
hitting bottom at the end of 2009, which is a slower rate<br />
of growth than seen in the state overall, but represents a<br />
recovery nonetheless.<br />
• The second quarter of <strong>2012</strong> marked the 12th consecutive<br />
quarter of rising taxable sales in Inland Southern Cali<strong>for</strong>nia.<br />
• The region’s hotels and restaurants are starting to thrive<br />
again, and sales tax receipts at restaurants and hotels across<br />
San Bernardino-Riverside are up by nearly nine percent on a<br />
year-to-date basis. This is the third fasted rate of growth by<br />
spending category.<br />
• Inland areas are pulling ahead of the pack in home<br />
prices and new residential and non-residential construction.<br />
Rising employment, af<strong>for</strong>dability and low interest rates<br />
are all helping to increase activity in the local economy,<br />
with 2013 expected to be even better.<br />
Other advantages of the region include newer facilities<br />
at lower lease rates than competing markets, superior<br />
transportation infrastructure, and access to a market of 23<br />
million people within three hours of driving. Significant<br />
speculative industrial construction activity has returned to<br />
the region, and with trade volumes expected to increase, the<br />
economic outlook <strong>for</strong> San Bernardino County continues to<br />
be optimistic.<br />
The crowded coastal areas and resistance to densification<br />
signifies the IE as the final frontier <strong>for</strong> Southern Cali<strong>for</strong>nia.<br />
Dissected by passes and freeways, San Bernardino County<br />
patiently waits on economic recovery to position itself as the<br />
intermodal logistics hub of Southern Cali<strong>for</strong>nia. Inexpensive<br />
land prices (compared to Los Angeles and Orange Counties),<br />
a large supply of vacant land, and a transport network<br />
where many highways and railroads intersect have made<br />
the San Bernardino County a major shipping hub. Some of<br />
the nation's largest manufacturing companies continue to<br />
choose the County <strong>for</strong> their distribution facilities. The region<br />
serves as a critical link in the global supply chain <strong>for</strong> many<br />
international businesses. It is also the best location <strong>for</strong><br />
companies looking <strong>for</strong> a regional distribution hub to serve<br />
the southwestern U.S.<br />
LONG-TERM FINANCIAL PLANNING<br />
<strong>Omnitrans</strong> continually plans <strong>for</strong> both the short-term and<br />
the long-term. The short-term planning rarely looks further<br />
ahead than the 12 months in the fiscal year. It seeks to<br />
ensure that the Agency has enough cash to pay its bills.<br />
In the long-term planning, the planning horizon is typically<br />
2 to 5 years. The long-term financial planning focuses on<br />
the Agency’s long-term goals and the funding that must<br />
be secured prior to project implementation.<br />
Like many medium-size public transit agencies, <strong>Omnitrans</strong>’<br />
approach to long-term financial planning is very conservative.<br />
x<br />
<strong>2012</strong> <strong>Comprehensive</strong> <strong>Annual</strong> <strong>Financial</strong> <strong>Report</strong>
The focus is centered on sustainability of current operations<br />
and the availability of federal, state and local funding<br />
opportunities. Primarily all major capital projects are<br />
not implemented until the necessary funding has been<br />
dedicated and secured. <strong>Omnitrans</strong> does not issue debt<br />
of any kind to secure funding <strong>for</strong> its capital projects.<br />
Under the direction of the Chief <strong>Financial</strong> Officer, the Finance<br />
Department administers the financial affairs of <strong>Omnitrans</strong>.<br />
The department manages revenues, expenditures,<br />
investments, cash management, accounting, grants and<br />
budgeting. The Finance Department is responsible <strong>for</strong> keeping<br />
abreast of current federal, state and local grant funding<br />
opportunities to support the operations and long-term capital<br />
investment goals of <strong>Omnitrans</strong>.<br />
The remaining 10.3 miles of the route will be in mixed<br />
traffic, with transit priority signals at key intersections.<br />
The East Valley Maintenance Facility Remodel Project is the<br />
remodeling of the current facility to accommodate and service<br />
the buses that will be used in providing the sbX service. The<br />
sbX buses are 60-foot articulated buses that will require<br />
modification and replacement of facility and shop equipment.<br />
The Transcenter is the transfer point <strong>for</strong> bus routes serving<br />
the downtown area, with future connections to the sbX BRT<br />
system, proposed downtown San Bernardino Passenger Rail<br />
Project, which is a one-mile Metrolink extension from the<br />
Santa Fe Depot, and the proposed Redlands Passenger Rail<br />
Project with stops on route to the University of Redlands.<br />
INTRODUCTORY SECTION<br />
There are two types of federal grant programs. Formula<br />
grant programs are funded to States based on <strong>for</strong>mulas<br />
of population. Discretionary grant programs are awarded<br />
based on meeting application requirements and selected<br />
based on selected criteria specific to each. Each grant<br />
program is referred to by name and most also by a number<br />
that correlates to the section number of Title 49 of the United<br />
States Code.<br />
In collaboration with the other departments, the Finance<br />
Department recently submitted discretionary grant<br />
applications and was awarded the following:<br />
• 8.3 million – 5309 Bus and Bus Facilities<br />
(San Bernardino Transcenter)<br />
• $5.0 million – 5309 Bus and Bus Facilities<br />
(Fixed-Route Vehicle Replacement)<br />
• $1.1 million – 5310 Transportation <strong>for</strong> Elderly<br />
Persons and Persons with Disabilities (Access<br />
Van Replacement)<br />
• $850 thousand – 5339 Alternatives Analysis<br />
(Holt Boulevard Alternative Analysis)<br />
There are several capital projects <strong>for</strong> which funding has<br />
been secured that are currently in progress with completion<br />
dates in the near future. The Agency’s main focus is centered<br />
on sustainability of current operations and on the challenges<br />
and opportunities associated with the following:<br />
• San Bernardino Express (sbX) E Street Corridor<br />
Bus Rapid Transit (BRT) Project<br />
• East Valley Maintenance Facility Remodel Project<br />
• Intermodal Transit Station (Transcenter) Project<br />
• Rolling Stock Replacement Project<br />
The sbX route is 15.7 miles along the E Street corridor. With<br />
16 stations, sbX stops at the major activity centers where<br />
we live, work, shop, learn and play. The current route features<br />
5.4 miles of exclusive lanes, separated from normal traffic.<br />
The Rolling Stock Replacement Project is the Agency’s<br />
ongoing bus replacement program to maintain the service<br />
reliability of its fleet and maintaining capital assets in<br />
a State of Good Repair (SGR) as required by the Federal<br />
Transit Administration (FTA). This is essential if public<br />
transportation systems are to provide safe and reliable<br />
service to its customers.<br />
RELEVANT FINANCIAL POLICIES<br />
<strong>Omnitrans</strong> is required by its Board of Directors to develop a<br />
balanced annual operating and capital expenditure budget<br />
within the prescribed limits to meet the objectives of the<br />
subsequent fiscal year. The annual operating and capital<br />
budgets show in detail the estimated revenues and expenses<br />
necessary to operate <strong>Omnitrans</strong>’ service <strong>for</strong> the upcoming<br />
year. The annual budget serves as the foundation <strong>for</strong><br />
<strong>Omnitrans</strong> financial planning and control of expenditures.<br />
Cali<strong>for</strong>nia Government Code, Section 53646, requires that<br />
each legislative body review and adopt an Investment Policy<br />
Statement on an annual basis. It is the policy of <strong>Omnitrans</strong><br />
to invest public funds in a manner which will provide<br />
maximum security with the highest investment return<br />
while meeting the daily cash flow demands of the Agency<br />
and con<strong>for</strong>ming to all state and local statutes governing<br />
the investment of public funds.<br />
The investment policy applies to the cash funds of the<br />
Agency, except <strong>for</strong> its employees’ retirement system fund,<br />
which is administered separately by the Cali<strong>for</strong>nia Public<br />
Employees’ Retirement System (PERS) and the 457<br />
Deferred Compensation Fund, administered separately<br />
by the International City/County Management Association<br />
Retirement Corporation.<br />
<strong>Omnitrans</strong> initially implemented a Forward Fuel Purchasing<br />
policy, which is an amended agreement with a liquefied<br />
natural gas (LNG) supplier to fix the price of up to 60%<br />
<strong>2012</strong> <strong>Comprehensive</strong> <strong>Annual</strong> <strong>Financial</strong> <strong>Report</strong><br />
xi
INTRODUCTORY SECTION<br />
of <strong>Omnitrans</strong>’ LNG requirements or 180,000 gallons per<br />
month. The agreement expired on January 31, <strong>2012</strong>. A new<br />
hedge was established on January 17, <strong>2012</strong>; fixing the price<br />
of 150,000 gallons of fuel per month <strong>for</strong> <strong>Omnitrans</strong><br />
beginning in February <strong>2012</strong> through June 2014. The Chief<br />
<strong>Financial</strong> Officer acts as the Trade Officer in the agreement.<br />
MAJOR INITIATIVES<br />
On the federal level, the Federal Transit Administration (FTA)<br />
sponsors an array of initiatives and programs to support<br />
research, coordination and development of public<br />
transportation. Some of the FTA initiatives and programs<br />
that are of particular interest to <strong>Omnitrans</strong> include:<br />
• Moving Ahead <strong>for</strong> Progress in the 21st Century Act<br />
(MAP-21) - The new two-year surface transportation<br />
authority that provides FTA an authorization level of<br />
$10.6 billion in <strong>FY</strong> 2013 and $10.7 billion in <strong>FY</strong><br />
2014. MAP-21 consolidates certain transit programs<br />
to improve their efficiency and provides significant<br />
funding increases specifically <strong>for</strong> improving the<br />
state of good repair of the nation’s transit systems.<br />
The law grants FTA authority to strengthen the<br />
safety of public transportation systems throughout<br />
the United States. It also streamlines the New Start<br />
process to expedite project delivery and provides <strong>for</strong><br />
core capacity project eligibility. MAP-21 took effect<br />
on October 1, <strong>2012</strong>.<br />
• State of Good Repair (SGR) - State of Good Repair<br />
includes sharing ideas on recapitalization and<br />
maintenance issues, asset management practices,<br />
and innovative financing strategies. It also includes<br />
issues related to measuring the condition of transit<br />
capital assets, prioritizing local transit re-investment<br />
decisions and preventive maintenance practices.<br />
Finally, research and the identification of the tools<br />
needed to address this problem are vital. The FTA<br />
will lead the nation's ef<strong>for</strong>t to address the State of<br />
Good Repair by collaborating with the industry to<br />
bring the nation's transit infrastructure into the<br />
21st century.<br />
• Job Access and Reverse Commute (JARC) - The Job<br />
Access and Reverse Commute (JARC) program<br />
addresses the unique transportation challenges<br />
faced by welfare recipients and low-income persons<br />
seeking to obtain and maintain employment. Many<br />
new entry-level jobs are located in suburban areas,<br />
and low-income individuals have difficulty accessing<br />
these jobs from their inner city, urban or rural<br />
neighborhoods. In addition, many entry-level jobs<br />
require working late at night or on weekends when<br />
conventional transit services are either reduced or<br />
non-existent. Finally, many employment-related trips<br />
are complex and involve multiple destinations,<br />
including reaching childcare facilities or other services.<br />
• New Freedom - The New Freedom <strong>for</strong>mula grant<br />
program aims to provide additional tools to overcome<br />
existing barriers facing Americans with disabilities<br />
seeking integration into the work<strong>for</strong>ce and full<br />
participation in society. Lack of adequate<br />
transportation is a primary barrier to work <strong>for</strong><br />
individuals with disabilities. The 2000 Census<br />
showed that only 60 percent of people between the<br />
ages of 16 and 64 with disabilities are employed.<br />
The New Freedom <strong>for</strong>mula grant program seeks to<br />
reduce barriers to transportation services and expand<br />
the transportation mobility options available to people<br />
with disabilities beyond the requirements of the<br />
Americans with Disabilities Act (ADA) of 1990.<br />
• United We Ride - A federal interagency initiative<br />
aimed at improving the availability, quality and<br />
efficient delivery of transportation services <strong>for</strong> older<br />
adults, people with disabilities and individuals with<br />
lower incomes.<br />
• Livable and Sustainable Communities - Enhancing<br />
economic and social well-being of all Americans by<br />
creating and maintaining a safe, reliable integrated<br />
and accessible transportation network that enhances<br />
choices <strong>for</strong> transportation users, provides easy<br />
access to employment opportunities and other<br />
destinations, and promotes positive effects on the<br />
surrounding community.<br />
Each year the federal government funds numerous public<br />
transit initiatives through an array of programs. Although<br />
the need <strong>for</strong> federal money to fund these initiatives has<br />
continued to grow, the federal budget increasingly has<br />
been strained by other competing funding priorities. To<br />
help finance major projects and achieve program goals,<br />
<strong>Omnitrans</strong> systematically “leverages” FTA funds with other<br />
state and local resources. An integral part of <strong>Omnitrans</strong>’<br />
long-term strategy of sustainability is leveraging federal<br />
funding whenever possible.<br />
xii<br />
<strong>2012</strong> <strong>Comprehensive</strong> <strong>Annual</strong> <strong>Financial</strong> <strong>Report</strong>
AWARDS AND ACKNOWLEDGEMENTS<br />
The Government Finance Officers Association (GFOA)<br />
awarded a Certificate of Achievement <strong>for</strong> Excellence in<br />
<strong>Financial</strong> <strong>Report</strong>ing to <strong>Omnitrans</strong> <strong>for</strong> its <strong>Comprehensive</strong><br />
<strong>Annual</strong> <strong>Financial</strong> <strong>Report</strong> (CAFR) <strong>for</strong> the fiscal year ended<br />
June 30, 2011. The Certificate of Achievement is a prestigious<br />
national award, recognizing con<strong>for</strong>mance with the highest<br />
standards <strong>for</strong> preparation of a state or local government<br />
financial report. This was the ninth time <strong>Omnitrans</strong> has<br />
received this award. In order to be awarded a Certificate of<br />
Achievement, a government unit must publish an easily<br />
readable and efficiently organized CAFR. This report must<br />
satisfy both GAAP and applicable legal requirements.<br />
A Certificate of Achievement is valid <strong>for</strong> a period of one year<br />
only. We believe that our current CAFR continues to meet<br />
the Certificate of Achievement Program’s requirements<br />
and we are submitting it to the GFOA to determine its<br />
eligibility <strong>for</strong> another certificate.<br />
<strong>Omnitrans</strong> was honored with the Cali<strong>for</strong>nia Challenge Award<br />
in May <strong>2012</strong>. The award, which is patterned on the national<br />
Malcolm Baldrige Award, is one of the highest honors an<br />
organization can achieve in the state of Cali<strong>for</strong>nia. Evaluation<br />
criteria are based on seven categories: leadership, strategic<br />
planning, work<strong>for</strong>ce focus, customer focus, measurement,<br />
analysis and knowledge management, and outcome focus.<br />
Additionally, the Go Smart digital ad received the grand prize<br />
from among all first-place winners in the electronic media<br />
category. The annual AdWheel Awards competition honors<br />
APTA member organizations <strong>for</strong> excellence in advertising,<br />
marketing, promotion and communications. Each year, APTA<br />
members submit their very best advertising, marketing,<br />
promotion, and communications materials in the media<br />
categories of print, electronic, campaigns and special events<br />
to the AdWheel Awards competition.<br />
Preparation of this report could not have been accomplished<br />
without the professional, efficient, and dedicated services<br />
of the Finance Department staff, with special thanks to Mae<br />
Sung, Accounting Manager and Maurice Mansion, Treasury<br />
Manager. We wish also to express our appreciation to Milo<br />
Victoria, our CEO/General Manager; Wendy Williams, Director<br />
of Marketing; and Rohan Kuruppu, Director of Planning<br />
and Development Services <strong>for</strong> their assistance and support<br />
of this report. We would also like to express our appreciation<br />
to the Board of Directors and members of the Administrative<br />
and Finance Committee. Finally, we acknowledge that this<br />
report could not have been completed without the partnership<br />
and professional oversight of Mayer Hoffman McCann, P.C.<br />
Respectfully submitted,<br />
INTRODUCTORY SECTION<br />
<strong>Omnitrans</strong>’ Marketing Department received multiple awards<br />
in the American Public Transportation Association (APTA)<br />
annual “AdWheel” competition <strong>for</strong> advertising campaign<br />
elements submitted in fiscal year <strong>2012</strong>. Capturing first-place<br />
awards were the <strong>Omnitrans</strong> blog, Go Smart college pass<br />
program digital ads and the agency’s “Dump the Pump Day”<br />
newspaper ad, radio commercial and interior bus cards.<br />
Robert L. MIller<br />
Chief <strong>Financial</strong> Officer, OMNITRANS<br />
<strong>2012</strong> <strong>Comprehensive</strong> <strong>Annual</strong> <strong>Financial</strong> <strong>Report</strong><br />
xiii
THIS PAGE LEFT BLANK INTENTIONALLY
FINANCIAL SECTION<br />
CONNECTING<br />
OUR<br />
COMMUNITY
FINANCIAL SECTION<br />
CONNECTING<br />
OUR<br />
COMMUNITY
Board of Directors<br />
<strong>Omnitrans</strong><br />
San Bernardino, Cali<strong>for</strong>nia<br />
FINANCIAL SECTION<br />
INDEPENDENT AUDITORS’ REPORT<br />
We have audited the accompanying basic financial statements of <strong>Omnitrans</strong> as of and <strong>for</strong> the year ended<br />
June 30, <strong>2012</strong>, as listed in the table of contents. These financial statements are the responsibility of the<br />
management of <strong>Omnitrans</strong>. Our responsibility is to express an opinion on these financial statements<br />
based on our audit. The prior year partial comparative in<strong>for</strong>mation has been derived from the financial<br />
statements of <strong>Omnitrans</strong> <strong>for</strong> the year ended June 30, 2011 and, in our report dated October 31, 2011,<br />
we expressed an unqualified opinion on those financial statements.<br />
We conducted our audit in accordance with auditing standards generally accepted in the United States<br />
of America and the standards applicable to financial audits contained in Government Auditing Standards,<br />
issued by the Comptroller General of the United States. Those standards require that we plan and<br />
per<strong>for</strong>m the audit to obtain reasonable assurance about whether the financial statements are free of<br />
material misstatement. An audit includes examining, on a test basis, evidence supporting the amounts<br />
and disclosures in the financial statements. An audit also includes assessing the accounting principles<br />
used and significant estimates made by management, as well as evaluating the overall financial<br />
statement presentation. We believe that our audit provides a reasonable basis <strong>for</strong> our opinion.<br />
In our opinion, the financial statements referred to above present fairly, in all material respects, the<br />
financial position of <strong>Omnitrans</strong> on June 30, <strong>2012</strong>, and the respective changes in financial position<br />
and cash flows of <strong>Omnitrans</strong> <strong>for</strong> the year then ended, in con<strong>for</strong>mity with accounting principles generally<br />
accepted in the United States of America.<br />
As described further in note 1 to the financial statements, the accompanying financial statements<br />
reflect certain changes <strong>for</strong> reporting deferred outflows of resources, deferred inflows of resources and<br />
net position in a statement of financial position and related disclosures due to the implementation of<br />
Governmental Accounting Standards Board Statement No. 63.<br />
Accounting principles generally accepted in the United States of America require that management’s<br />
discussion and analysis be presented to supplement the basic financial statements. Such in<strong>for</strong>mation,<br />
although not a part of the basic financial statements, is required by the Governmental Accounting<br />
Standards Board who considers it to be an essential part of the financial reporting <strong>for</strong> placing the<br />
basic financial statements in an appropriate operational, economic or historical context. We have<br />
applied certain limited procedures to the required supplementary in<strong>for</strong>mation in accordance with<br />
auditing standards generally accepted in the United States of America, which consisted of inquiries<br />
of management regarding the methods of preparing the in<strong>for</strong>mation and comparing the in<strong>for</strong>mation<br />
continued on next page<br />
<strong>2012</strong> <strong>Comprehensive</strong> <strong>Annual</strong> <strong>Financial</strong> <strong>Report</strong><br />
1
FINANCIAL SECTION<br />
Board of Directors<br />
<strong>Omnitrans</strong><br />
San Bernardino, Cali<strong>for</strong>nia<br />
<strong>for</strong> consistency with management’s responses to our inquiries, the basic financial statements, and<br />
other knowledge we obtained during our audit of the basic financial statements. We do not express<br />
an opinion or provide any assurance on the in<strong>for</strong>mation because the limited procedures do not provide<br />
us with sufficient evidence to express an opinion or provide any assurance.<br />
Our audit was conducted <strong>for</strong> the purpose of <strong>for</strong>ming opinions on the basic financial statements that<br />
collectively comprise <strong>Omnitrans</strong>’ basic financial statements. The introductory section and statistical<br />
tables are presented <strong>for</strong> purposes of additional analysis and are not a required part of the basic<br />
financial statements. Such in<strong>for</strong>mation has not been subjected to the auditing procedures applied<br />
in the audit of the basic financial statements and, accordingly, we express no opinion or provide any<br />
assurance on it.<br />
In accordance with Government Auditing Standards, we have also issued our report dated October<br />
31, <strong>2012</strong> on our consideration of <strong>Omnitrans</strong>’ internal control over financial reporting and our tests<br />
of its compliance with certain provisions of laws, regulations, contracts, grant agreements and other<br />
matters. The purpose of that report is to describe the scope of our testing of internal control over<br />
financial reporting and compliance and the results of that testing, and not to provide an opinion on<br />
the internal control over the financial reporting or on compliance. That report is an integral part of<br />
an audit per<strong>for</strong>med in accordance with Government Auditing Standards and should be considered<br />
in assessing the results of our audit.<br />
Irvine, Cali<strong>for</strong>nia<br />
October 31, <strong>2012</strong><br />
2<br />
<strong>2012</strong> <strong>Comprehensive</strong> <strong>Annual</strong> <strong>Financial</strong> <strong>Report</strong>
MANAGEMENT’S DISCUSSION AND ANALYSIS<br />
As management of <strong>Omnitrans</strong> (the Agency), we offer the readers of the Agency’s financial statements this narrative<br />
overview and analysis of the financial activities <strong>for</strong> the Agency <strong>for</strong> the fiscal year ended June 30, <strong>2012</strong>.<br />
We encourage readers to consider the in<strong>for</strong>mation presented here in conjunction with additional in<strong>for</strong>mation that we<br />
have furnished in the transmittal letter and financial statements, which are included in this report.<br />
FINANCIAL HIGHLIGHTS<br />
FINANCIAL SECTION<br />
• At the end of fiscal year <strong>2012</strong>, the Statement of Net Position presents total assets of $176.9 million and total<br />
liabilities and deferred inflow of resources of $32.2 million and $55.3 thousand respectively. Total assets increased<br />
9.9 percent over the previous fiscal year, resulting largely from increases in construction in progress that consists<br />
mainly of the E Street Bus Rapid Transit (sbX) project.<br />
• Total liabilities at fiscal year ended June 30, <strong>2012</strong> was $32.2 million, up $5.3 million or 20.1 percent over previous<br />
fiscal year end. Accounts payable increases of $6.0 million, attributed to the accrual of goods and services received<br />
but not yet paid, was offset by reductions in unearned revenues of $2.4 million. Noncurrent liabilities increased<br />
$1.8 million or 24.2 percent due to lease financing arrangements <strong>for</strong> support vehicles, office equipment, and the<br />
estimated outstanding losses highlighted in the actuarial study of the self-insured workers compensation and<br />
liability programs as of June 30, <strong>2012</strong>.<br />
• As a result of General Accounting Standards Board (GASB) 53, $55.3 thousand of accumulated increase in fair<br />
value of hedging derivatives is presented on the Statement of Net Position at fiscal year ended June 30, <strong>2012</strong>.<br />
• Operating revenues at fiscal year ended June 30, <strong>2012</strong> of $15.4 million decreased $107.1 thousand or 0.7 percent<br />
compared to last fiscal year end. Operating expense, excluding depreciation, at fiscal year end June 30, <strong>2012</strong> increased<br />
$2.7 million or 4.0 percent compared to last fiscal year end.<br />
• Non-operating revenues, which include federal and local operating grants and pass-through to other agencies,<br />
increased by $13.8 million or 41.4 percent. The majority of this increase is attributed to the return of $16.0 million<br />
(collected in prior years) in Local Transportation Funds (LTF) to San Bernardino Associated Governments (SANBAG)<br />
in the previous fiscal year.<br />
• At fiscal year end June 30, <strong>2012</strong>, capital assistance of $34.4 million increased $13.4 million or 63.7 percent<br />
compared to the previous fiscal year. This increase is due to increased activity on the sbX project, the major capital<br />
project of <strong>Omnitrans</strong>.<br />
OVERVIEW OF THE FINANCIAL STATEMENTS<br />
This annual financial report consists of two parts: Management’s Discussion and Analysis and the basic financial statements,<br />
including notes to the financial statements. The Agency financial statements offer key, high-level financial in<strong>for</strong>mation about<br />
the Agency’s activities.<br />
The Agency is a government-funded entity that follows enterprise-fund accounting and presents its financial statement on<br />
the accrual basis of accounting. The enterprise-fund concept is similar to how private business enterprises are financed<br />
and operated.<br />
<strong>2012</strong> <strong>Comprehensive</strong> <strong>Annual</strong> <strong>Financial</strong> <strong>Report</strong><br />
3
FINANCIAL SECTION<br />
MANAGEMENT’S DISCUSSION AND ANALYSIS (CONTINUED)<br />
The statements of net position include in<strong>for</strong>mation on all of the Agency’s assets and liabilities with the difference between<br />
assets and liabilities reported as net position. Changes in net position may serve as a useful indicator of whether the<br />
financial position of the Agency is improving or deteriorating.<br />
The statement of revenues, expenses and change in net position present in<strong>for</strong>mation regarding how the Agency net position<br />
changed during the fiscal years ended June 30, <strong>2012</strong> and 2011. All changes in net position are reported as soon as the<br />
underlying event giving rise to the change occurs, and amounts are measurable, regardless of the timing of related<br />
cash flows.<br />
FINANCIAL STATEMENTS ANALYSIS<br />
The following tables summarize revenues, expenses and changes in net position comparing fiscal year <strong>2012</strong> with fiscal<br />
year 2011. For additional in<strong>for</strong>mation regarding the Agencies’ financial activities <strong>for</strong> fiscal year ended June 30, <strong>2012</strong>, readers<br />
are encourage to read this section in conjunction with the accompanying Notes to the Basic <strong>Financial</strong> Statements.<br />
REVENUES AND EXPENSES<br />
REVENUES<br />
<strong>Omnitrans</strong>’ total revenues <strong>for</strong> fiscal year ending June 30, <strong>2012</strong> show an increase of $8.5 million or 9.5 percent compared to<br />
the last fiscal year. Revenue from fares, pass and ticket sales less discount to pass sale vendors was $1.8 thousand less than<br />
the previous fiscal year. Reduction in advertising revenues account <strong>for</strong> the majority of the decrease in total operating revenues.<br />
Advertising revenue decreased $103.3 thousand or 11.4 percent compared to the previous fiscal year. Other transportation<br />
revenues account <strong>for</strong> less than 0.3 percent of total operating revenues decreased $2.0 thousand or 4.7 percent.<br />
Federal and local operating grants <strong>for</strong> <strong>Omnitrans</strong> decreased from $52.7 million in fiscal year 2011 to $47.9 million in<br />
fiscal year <strong>2012</strong>. This represents a $4.8 million or 9.5 percent reduction in revenues. <strong>Omnitrans</strong> receive federal, state<br />
and local funding, which is utilized <strong>for</strong> both operating and capital expenditures.<br />
The slow economy continues to affect the rate of return on the Agency’s investment with Local Agency Investment Fund<br />
(LAIF). The Agency’s interest income from LAIF decreased $21.6 thousand or 29.0 percent compared to the previous<br />
fiscal year. LAIF’s interest rate on investment remains under one percent.<br />
Financing the construction, operation and maintenance of public transportation systems involves many different types of<br />
funding sources, including federal and non-federal grants, and other revenue sources. <strong>Omnitrans</strong> received $47.9 million in<br />
federal and local operating grants and $34.4 million in capital assistance <strong>for</strong> fiscal year ended June 30, <strong>2012</strong>. Compared to<br />
last fiscal year, federal and local operating grants decreased $4.8 million or 9.1 percent and capital assistance increased<br />
$13.4 million or 63.7%. The source of federal and local operating grants and capital assistance include the following:<br />
• Measure I - the ½-cent sales tax collected throughout San Bernardino County <strong>for</strong> transportation improvements.<br />
• Local Transportation Fund (LTF) - Transportation Development Act (TDA) earmark ¼ percent of the state sales tax<br />
<strong>for</strong> transit.<br />
• Urbanized Area Formula Program (5307) - transit capital and operating assistance in urbanized areas and <strong>for</strong><br />
transportation-related planning.<br />
4<br />
<strong>2012</strong> <strong>Comprehensive</strong> <strong>Annual</strong> <strong>Financial</strong> <strong>Report</strong>
MANAGEMENT’S DISCUSSION AND ANALYSIS (CONTINUED)<br />
• Congestion Mitigation and Air Quality Improvement (CMAQ) - established to support surface transportation<br />
projects and other related ef<strong>for</strong>ts that contribute air-quality improvements and provide congestion relief.<br />
• Job Access and Reverse Commute (JARC) - established to improve access to transportation services to employment<br />
and employment-related activities <strong>for</strong> welfare recipients and eligible low-income individuals and to transport residents<br />
of urbanized areas and non-urbanized areas to suburban employment opportunities.<br />
• New Freedom - a <strong>for</strong>mula grant program aims to provide additional tools to overcome existing barriers facing<br />
Americans with disabilities seeking integration into the work<strong>for</strong>ce available to people with disabilities beyond the<br />
requirements of the Americans with Disabilities Act of 1990 (ADA).<br />
FINANCIAL SECTION<br />
• State Transit Assistance Fund (STAF) - derived from sales tax on gasoline and diesel fuel, this funding is an<br />
allocation to local transit agencies to fund a portion of the operations and capital costs associated with local<br />
mass transportation programs.<br />
• Public Transportation Modernization, Improvement and Service Enhancement Account Program (PTMISEA) - created<br />
by Proposition 1B, is funding available to transit operators over a ten-year period. PTMISEA funds may be used <strong>for</strong><br />
transit rehabilitation, safety or modernization improvements, capital service enhancements or expansions, new<br />
capital projects, bus rapid-transit improvements, or rolling stock (buses and rail cars) procurement, rehabilitation<br />
or replacement.<br />
Interest income <strong>for</strong> the Agency consists of quarterly return on investment with the Local Agency Investment Fund (LAIF). The<br />
LAIF program offers local agencies the opportunity to participate in a major portfolio, which invests hundreds of millions of<br />
dollars, using the investment expertise of the State Treasurer's Office at no additional cost. Total interest income <strong>for</strong> fiscal<br />
year ended June 30, <strong>2012</strong> was $52.7 thousand, down $21.6 thousand or 29.0 percent compared to the previous fiscal year.<br />
Other non-operating revenues consist mainly of quarterly reimbursement to the Agency from the Amalgamated Transit<br />
Union (ATU) Local 1704 <strong>for</strong> wages and benefits paid by the Agency to ATU Officers/Stewards during normal work hours to<br />
process grievances. Total other non-operating revenues increased $4.9 thousand or 24.7 percent over last fiscal year.<br />
OMNITRANS’ REVENUES<br />
Percent<br />
Increase Increase<br />
<strong>2012</strong> 2011 (Decrease) (Decrease)<br />
Passenger fares $14,536,931 14,538,747 (1,816) (0.0)<br />
Advertising revenue 805,904 909,176 (103,272) (11.4)<br />
Other transportation revenue 39,819 41,802 (1,983) (4.7)<br />
Federal and local operating grants 47,875,811 52,675,797 (4,799,986) (9.1)<br />
Capital assistance 34,412,696 21,016,685 13,396,011 63.7<br />
Interest income 52,727 74,302 (21,575) (29.0)<br />
Other non-operating revenues 24,951 20,002 4,949 24.7<br />
Total Revenue $97,748,839 89,276,511 8,472,328 9.5<br />
<strong>2012</strong> <strong>Comprehensive</strong> <strong>Annual</strong> <strong>Financial</strong> <strong>Report</strong><br />
5
FINANCIAL SECTION<br />
MANAGEMENT’S DISCUSSION AND ANALYSIS (CONTINUED)<br />
EXPENSES<br />
Total expenses <strong>for</strong> fiscal year <strong>2012</strong> decreased $11.6 million or 11.8% compared to the previous fiscal year. The decrease<br />
in pass-through to other agencies of $18.1 million and the increase in depreciation of $4.3 million accounts <strong>for</strong> most of<br />
the difference.<br />
Wages, salaries and benefits decreased by $286.6 thousand or 0.7 percent under previous fiscal year. This reduction<br />
is attributed mainly to the recapture of cost associated with the Agency’s cost allocation plan (CAP). Wage and benefit<br />
costs <strong>for</strong> an employee’s time spent on capital projects was charged to the applicable grant. For fiscal year ending June 30,<br />
<strong>2012</strong>, $981.9 thousand in labor and benefit cost was recaptured compared to only $346.0 thousand in the previous<br />
fiscal year. Additionally, <strong>Omnitrans</strong> operated under a Board of Directors-authorized wage freeze <strong>for</strong> the fiscal year ended<br />
June 30, <strong>2012</strong>. Fiscal year <strong>2012</strong> is the third consecutive year wages, salaries and benefits were frozen.<br />
Purchased transportation services <strong>for</strong> fiscal year ended June 30, <strong>2012</strong> increased $760.9 thousand or 9.4 percent compared<br />
to the previous fiscal year. The increase in cost is attributed to increases negotiated in the contract, and the increase in<br />
service hours <strong>for</strong> additional OmniGo service.<br />
General and administrative expenses consist mainly of occupancy expenses (utilities, communication and office equipment,<br />
repairs, ground maintenance, stops and stations, etc.) and casualty and liability expenses (property, general, vehicle and<br />
workers’ compensation insurance). Occupancy expense decreased $153.0 thousand, and casualty and liability cost<br />
increased $426.7 thousand when compared to the previous fiscal year.<br />
Material and supplies increased $1.1 million or 14.6 percent over last fiscal year. The difference is attributed to the amount<br />
of compressed natural gas (CNG) fuel tax credit recognized in each of the fiscal years. In fiscal year ended June 30, 2011,<br />
the Agency recognized $2.0 million in fuel tax credit to offset its fuel cost. In fiscal year ended June 30, <strong>2012</strong>, only $636.5<br />
thousand was recognized to offset fuel cost.<br />
The decrease in fuel tax credit was offset by the fuel hedge program implemented at <strong>Omnitrans</strong>. A fuel hedging program<br />
was implemented May 6, 2009, to increase the predictability of <strong>Omnitrans</strong> costs and reduce operational uncertainty in<br />
the event of dramatic fuel price increases in the open market. <strong>Omnitrans</strong> is authorized to hedge up to 150,000 gallons<br />
per month of compressed natural gas (CNG) on the New York Mercantile Exchange (NYMEX) through Morgan Stanley.<br />
<strong>Omnitrans</strong> CNG cost decreased $472.5 thousand or 10.3 percent compared to the previous fiscal year.<br />
Professional and technical services increased $509.2 thousand or 31.1 percent above previous fiscal year ended June<br />
30, 2011. The increase is mainly attributed to the outsourcing of computer hardware and maintenance function of the<br />
In<strong>for</strong>mation Technology department.<br />
<strong>Omnitrans</strong>, as a direct grantee of FTA funding, is responsible <strong>for</strong> complying with specific FTA requirements. These include<br />
the solicitation, evaluation, selection and project management oversight of sub-recipients. The pass-through to other agencies<br />
represents federal and local reimbursements to sub-recipients <strong>for</strong> cost incurred on approved projects. Pass-through payments<br />
to other agencies decrease $18.1 million or 96.7 percent compared to the previous fiscal year. This reduction is attributed to<br />
the return of LTF funds to San Bernardino Associated Governments (SANBAG), previously held by <strong>Omnitrans</strong> as unrestricted<br />
reserves in the previous fiscal year.<br />
The increase in depreciation and loss on disposal of capital assets over the previous fiscal year is attributed to disposal and<br />
replacement of fixed-route and purchased transportation vehicles that were fully depreciated. The parts carried in inventory <strong>for</strong><br />
repairs and maintenance <strong>for</strong> these vehicles was also disposed of in accordance with FTA requirements.<br />
Miscellaneous expenses <strong>for</strong> the fiscal year ended June 30, <strong>2012</strong> increased $206.7 thousand or 67.9 percent when<br />
compared to the last fiscal year. The increase is mainly attributed to increased travel and meeting expenses, employee<br />
training and employee recognition. Additionally, cost associated with CNG hedging activities we recognized as a result<br />
of accounting and financial reporting <strong>for</strong> derivative instruments (GASB 53).<br />
6<br />
<strong>2012</strong> <strong>Comprehensive</strong> <strong>Annual</strong> <strong>Financial</strong> <strong>Report</strong>
MANAGEMENT’S DISCUSSION AND ANALYSIS (CONTINUED)<br />
OMNITRANS’ EXPENSES<br />
Percent<br />
Increase Increase<br />
<strong>2012</strong> 2011 (Decrease) (Decrease)<br />
Wages, salaries and benefits $39,751,359 40,037,950 (286,591) (0.7)<br />
Purchased transportation services 8,882,227 8,121,333 760,894 9.4<br />
General and administrative expenses 7,779,983 7,495,178 284,805 3.8<br />
Materials and supplies 8,876,733 7,743,557 1,133,176 14.6<br />
Capital purchases 345,063 263,908 81,155 30.8<br />
Professional and technical services 2,147,300 1,638,070 509,230 31.1<br />
Advertising and printing 916,224 931,927 (15,703) (1.7)<br />
Pass-through to other agencies 620,108 18,754,320 (18,134,212) (96.7)<br />
Loss on disposal of capital assets 271,438 739,670 (468,232) (63.3)<br />
Depreciation 17,070,294 12,772,455 4,297,839 33.6<br />
Miscellaneous 511,223 304,504 206,719 67.9<br />
Total Expenses $87,171,952 98,802,872 (11,630,920) (11.8)<br />
FINANCIAL SECTION<br />
<strong>2012</strong> <strong>Comprehensive</strong> <strong>Annual</strong> <strong>Financial</strong> <strong>Report</strong><br />
7
FINANCIAL SECTION<br />
MANAGEMENT’S DISCUSSION AND ANALYSIS (CONTINUED)<br />
NET POSITION<br />
The Agency’s total net position <strong>for</strong> fiscal year ending June 30, <strong>2012</strong> increased $10.6 million or 7.9 percent above fiscal<br />
year ended June 30, 2011. The $16.0-million increase in assets was offset by increases in both current and long-term<br />
liabilities. Ongoing construction of the sbX BRT project, preliminary engineering and design work <strong>for</strong> the San Bernardino<br />
Transit Center, and fixed-route bus replacement account <strong>for</strong> the majority of the increase in total assets.<br />
OMNITRANS’ Statement of Net Position<br />
Percent<br />
Increase Increase<br />
<strong>2012</strong> 2011 (Decrease) (Decrease)<br />
ASSETS:<br />
Current and other assets $40,204,481 41,450,301 (1,245,820) (3.0)<br />
Net Capital Assets 136,758,507 119,480,534 17,277,973 14.5<br />
Total Assets 176,962,988 160,930,835 16,032,153 10.0<br />
LIABILITIES:<br />
Current Liabilities 22,829,336 19,264,389 3,564,947 18.5<br />
Long-term Liabilities 9,417,445 7,582,426 1,835,019 24.2<br />
Total Liabilities 32,246,781 26,846,815 5,399,966 20.1<br />
DEFERRED INFLOW OF RESOURCES:<br />
Accumulated increase in fair value<br />
of hedging derivatives (Note 12) 55,300 0 55,300 0.0<br />
Total Deferred inflow of resources 55,300 0 55,300 0.0<br />
NET POSITION:<br />
Invested in capital assets 136,112,836 119,366,226 16,746,610 14.0<br />
Restricted 0 0 0<br />
Unrestricted 8,548,071 14,717,794 (6,169,723) (41.9)<br />
Total Net Position $144,660,907 134,084,020 10,576,887 7.9<br />
8<br />
<strong>2012</strong> <strong>Comprehensive</strong> <strong>Annual</strong> <strong>Financial</strong> <strong>Report</strong>
MANAGEMENT’S DISCUSSION AND ANALYSIS (CONTINUED)<br />
CHANGES IN NET POSITION<br />
The change in net position is noted in the ending balance <strong>for</strong> fiscal year <strong>2012</strong> and the beginning balance in fiscal year<br />
2011 on the Statement of Revenues, Expenses and Changes in Net Position table. The following Statement of Revenues,<br />
Expenses and Changes in Net Position table illustrate and compare the various categories of assets, liabilities and net<br />
position <strong>for</strong> the two fiscal years.<br />
OMNITRANS’ Statement of Revenues, Expenses and Changes in Net Assets<br />
FINANCIAL SECTION<br />
Percent<br />
Fiscal Year Fiscal Year Increase Increase<br />
<strong>2012</strong> 2011 (Decrease) (Decrease)<br />
Revenues:<br />
Passenger fares $14,536,931 14,538,747 (1,816) (0.0)<br />
Advertising revenues 805,904 909,176 (103,272) (11.4)<br />
Other transportation revenues 39,819 41,802 (1,983) (4.7)<br />
Total revenues 15,382,654 15,489,725 (107,071) (0.7)<br />
Expenses:<br />
Depreciation and amortization 17,070,294 12,772,455 4,297,839 33.6<br />
Other operating expenses 69,206,132 66,529,837 2,676,295 4.0<br />
Total expenses 86,276,426 79,302,292 6,974,134 8.8<br />
Non-operating Revenue/(Expenses)<br />
Fed. and local operating grants (Note 3) 47,875,811 52,675,797 (4,799,986) (9.1)<br />
Interest income 52,727 74,302 (21,575) (29.0)<br />
Interest expense (3,980) (6,590) 2,610 39.6<br />
Pass-through - to other agencies (Note 10)<br />
(620,108) (18,754,320) 18,134,212 96.7<br />
Other non-operating revenues (expenses) (246,487) (719,668) 473,181 65.7<br />
Total non-operating revenues 47,057,963 33,269,521 13,788,442 41.4<br />
Income be<strong>for</strong>e capital contribution (23,835,809) (30,543,046) 6,707,237 (22.0)<br />
Capital contributions<br />
Capital assistance 34,412,696 21,016,685 13,396,011 63.7<br />
Total capital contributions 34,412,696 21,016,685 13,396,011 63.7<br />
Change in net assets 10,576,887 (9,526,361) 20,103,248 (211.0)<br />
Net assets, beginning of year 134,084,020 143,610,381 (9,526,361) (6.6)<br />
Net assets, end of year $144,660,907 134,084,020 10,576,887 7.9<br />
<strong>2012</strong> <strong>Comprehensive</strong> <strong>Annual</strong> <strong>Financial</strong> <strong>Report</strong><br />
9
FINANCIAL SECTION<br />
MANAGEMENT’S DISCUSSION AND ANALYSIS (CONTINUED)<br />
CAPITAL ASSETS AND DEBT ADMINISTRATION<br />
Capital Assets<br />
On June 30, <strong>2012</strong>, the Agency had a total of $136.7 million invested in capital assets. This total represents an overall<br />
increase of $17.2 million or 14.4% over the prior year total of $119.5 million. The increase is mainly attributed to the<br />
ongoing construction of the sbX BRT project, preliminary engineering and design work <strong>for</strong> the San Bernardino Transit<br />
Center, and fixed-route bus replacement.<br />
OMNITRANS’ Capital Assets (net of accumulated depreciation)<br />
Percent<br />
Fiscal Year Fiscal Year Increase Increase<br />
<strong>2012</strong> 2011 (Decrease) (Decrease)<br />
Buildings and improvements $45,893,036 45,893,036 0 0.0<br />
Operations equipment 88,840,514 78,485,398 10,355,116 13.2<br />
Furniture and office equipment 36,936,878 35,646,877 1,290,001 3.6<br />
Construction in progress 52,444,563 33,000,960 19,443,603 58.9<br />
Land 10,731,918 10,731,918 0 0.0<br />
Accumulated depreciation (98,143,702) (84,277,655) (13,866,047) 16.5<br />
Total capital assets $136,703,207 119,480,534 17,222,673 14.4<br />
Additional in<strong>for</strong>mation regarding the Agency’s capital assets can be found in Note 5 in the Notes to the Basic<br />
<strong>Financial</strong> Statements.<br />
DEBT ADMINISTRATION<br />
On June 30, <strong>2012</strong>, the Agency had $9.4 million in long-term liabilities compared to $7.6 million on June 30, 2011. A significant<br />
portion of the Agency’s claims payable is anticipated to become payable within one year. Additional in<strong>for</strong>mation regarding the<br />
Agency’s long-term liabilities can be found in Note 4 to the Basic <strong>Financial</strong> Statements.<br />
OMNITRANS’ Long-Term Liabilities<br />
Percent<br />
Fiscal Year Fiscal Year Increase Increase<br />
<strong>2012</strong> 2011 (Decrease) (Decrease)<br />
Claims payable $7,688,128 6,367,488 1,320,640 20.7<br />
Capital leases 425,391 73,674 351,717 477.4<br />
Compensated absences 1,303,926 1,141,264 162,662 14.3<br />
Total long-term liabilities $9,417,445 7,582,426 1,835,019 24.2<br />
10<br />
<strong>2012</strong> <strong>Comprehensive</strong> <strong>Annual</strong> <strong>Financial</strong> <strong>Report</strong>
MANAGEMENT’S DISCUSSION AND ANALYSIS (CONTINUED)<br />
NEXT YEAR’S BUDGET<br />
<strong>Omnitrans</strong> continue to face the challenge of providing mobility, environmental and quality of life benefits within the San<br />
Bernardino Valley during difficult economic times with rising gas prices, high unemployment and discontinued school<br />
bus services. <strong>Omnitrans</strong> prepares an operating and capital budget annually that is approved by the Board of Directors<br />
prior to the beginning of its fiscal year. The operating budget <strong>for</strong> fiscal year ending June 30, 2013 will be comparable<br />
to the previous fiscal year <strong>2012</strong>. Consequently, the focus will be to maintain cost <strong>for</strong> goods and services at current levels.<br />
Fiscal year 2013 will be the fourth consecutive fiscal year that <strong>Omnitrans</strong>’ operating budget has remained at the<br />
existing level.<br />
FINANCIAL SECTION<br />
<strong>Omnitrans</strong> is currently in the midst of a <strong>Comprehensive</strong> Operational Analysis (COA), one of the most extensive ever to be<br />
conducted of <strong>Omnitrans</strong> by SANBAG. According to the objectives of the COA, numerous major changes will result <strong>for</strong> the COA.<br />
The capital budget consists of a multi-year program that includes the sbX E Street Corridor project and the San Bernardino<br />
Transit Center. Funding <strong>for</strong> these major projects has been identified, approved by the Board of Directors, and committed to<br />
those projects.<br />
CONTACTING THE AGENCY’S FINANCIAL MANAGEMENT<br />
This financial report is designed to provide our customers, stakeholders and creditors with an overview of the Agency’s<br />
financial operations and condition. If you have a question about this report or need additional in<strong>for</strong>mation, you may<br />
contact the Agency’s Finance Director at 1700 W. 5th Street, San Bernardino, Cali<strong>for</strong>nia 92411-2401.<br />
<strong>2012</strong> <strong>Comprehensive</strong> <strong>Annual</strong> <strong>Financial</strong> <strong>Report</strong><br />
11
FINANCIAL SECTION<br />
STATEMENT OF NET POSITION<br />
Year Ended June 30, <strong>2012</strong> (with Comparative Totals <strong>for</strong> Year Ended June 30, 2011)<br />
<strong>2012</strong> 2011<br />
ASSETS:<br />
CURRENT ASSETS:<br />
Cash and investments (Note 2) $ 27,671,139 22,625,479<br />
Receivables:<br />
Accounts net of allowances 166,142 667,835<br />
Interest 18,085 19,691<br />
Intergovernmental 10,545,846 16,301,034<br />
Inventory 1,549,750 1,632,738<br />
Prepaid items 253,519 203,524<br />
TOTAL CURRENT ASSETS 40,204,481 41,450,301<br />
NON-CURRENT ASSETS:<br />
Capital assets, not depreciated (Note 5) 63,176,481 43,732,878<br />
Capital assets, depreciated, net (Note 5) 73,526,726 75,747,656<br />
Derivative Instrument - natural gas futures (Note 12) 55,300 -<br />
TOTAL NON-CURRENT ASSETS 136,758,507 119,480,534<br />
TOTAL ASSETS 176,962,988 160,930,835<br />
LIABILITIES:<br />
CURRENT LIABILITIES:<br />
Accounts payable 10,544,787 4,591,632<br />
Accrued salaries and benefits 1,641,537 1,573,091<br />
Retainage payable 17,195 17,195<br />
Interest payable 1,155 1,657<br />
Unearned revenue 4,914,153 7,340,403<br />
Compensated absences payable -<br />
current portion (Note 4) 2,507,658 2,605,033<br />
Capital leases payable - current portion (Note 4) 164,980 40,634<br />
Claims payable - current portion (Note 4) 3,037,871 3,094,744<br />
TOTAL CURRENT LIABILITIES 22,829,336 19,264,389<br />
NON-CURRENT LIABILITIES:<br />
Compensated absences payable (Note 4) 1,303,926 1,141,264<br />
Capital leases payable (Note 4) 425,391 73,674<br />
Claims payable (Note 4) 7,688,128 6,367,488<br />
TOTAL NON-CURRENT LIABILITIES 9,417,445 7,582,426<br />
TOTAL LIABILITIES 32,246,781 26,846,815<br />
DEFERRED INFLOW OF RESOURCES:<br />
Accumulated increase in fair value of hedging derivatives (Note 12) 55,300 -<br />
TOTAL DEFERRED INFLOW OF RESOURCES 55,300 -<br />
NET POSITION:<br />
Net investment in capital assets (Note 11) 136,112,836 119,366,226<br />
Unrestricted (Note 11) 8,548,071 14,717,794<br />
TOTAL NET POSITION $ 144,660,907 134,084,020<br />
See accompanying notes to basic financial statements<br />
12<br />
<strong>2012</strong> <strong>Comprehensive</strong> <strong>Annual</strong> <strong>Financial</strong> <strong>Report</strong>
STATEMENT OF REVENUES, EXPENSES AND CHANGES IN NET ASSETS<br />
Year Ended June 30, <strong>2012</strong> (with Comparative Totals <strong>for</strong> Year Ended June 30, 2011)<br />
<strong>2012</strong> 2011<br />
OPERATING REVENUES:<br />
Passenger fares $ 14,536,931 14,538,747<br />
Advertising revenue 805,904 909,176<br />
Other transportation revenue 39,819 41,802<br />
TOTAL OPERATING REVENUES 15,382,654 15,489,725<br />
FINANCIAL SECTION<br />
OPERATING EXPENSES:<br />
Salaries and benefits 39,751,359 40,037,950<br />
Purchased transportation services 8,882,227 8,121,333<br />
General and administrative 7,779,983 7,495,178<br />
Materials and supplies 8,876,733 7,743,557<br />
Capital purchases 345,063 263,908<br />
Professional and technical services 2,147,300 1,638,070<br />
Advertising and printing 916,224 931,927<br />
Depreciation 17,070,294 12,772,455<br />
Miscellaneous 507,243 297,914<br />
TOTAL OPERATING EXPENSES 86,276,426 79,302,292<br />
OPERATING INCOME/(LOSS) (70,893,772) (63,812,567)<br />
NON-OPERATING REVENUES/(EXPENSES):<br />
Federal and local operating grants 47,875,811 52,675,797<br />
Interest income 52,727 74,302<br />
Interest expense (3,980) (6,590)<br />
Pass-through to other agencies (Note 10) (620,108) (18,754,320)<br />
Loss on disposal of capital assets (271,438) (739,670)<br />
Other non-operating revenues (expenses) 24,951 20,002<br />
TOTAL NON-OPERATING REVENUES 47,057,963 33,269,521<br />
INCOME BEFORE CAPITAL CONTRIBUTIONS (23,835,809) (30,543,046)<br />
CAPITAL CONTRIBUTIONS:<br />
Capital assistance 34,412,696 21,016,685<br />
CHANGE IN NET POSITION 10,576,887 (9,526,361)<br />
NET POSITION, BEGINNING OF YEAR 134,084,020 143,610,381<br />
NET POSITION, END OF YEAR $ 144,660,907 134,084,020<br />
See accompanying notes to basic financial statements<br />
<strong>2012</strong> <strong>Comprehensive</strong> <strong>Annual</strong> <strong>Financial</strong> <strong>Report</strong><br />
13
FINANCIAL SECTION<br />
STATEMENT OF CASH FLOWS<br />
Year Ended June 30, <strong>2012</strong> (with Comparative Totals <strong>for</strong> Year Ended June 30, 2011)<br />
<strong>2012</strong> 2011<br />
CASH FLOWS FROM OPERATING ACTIVITIES:<br />
Cash received from customers $ 15,889,414 14,965,317<br />
Nonoperating miscellaneous receipts (payments) 24,951 20,002<br />
Cash payments to suppliers <strong>for</strong> goods and services (22,204,847) (26,833,933)<br />
Cash payments to employees <strong>for</strong> services (39,617,638) (39,964,466)<br />
Net cash used <strong>for</strong> operating activities (45,908,120) (51,813,080)<br />
CASH FLOWS FROM NON-CAPITAL FINANCING ACTIVITIES:<br />
Federal, state and local operating grants 50,807,315 54,131,745<br />
Pass-through payments to other agencies (620,108) (18,754,320)<br />
Net cash provided by non-capital<br />
financing activities 50,187,207 35,377,425<br />
CASH FLOWS FROM CAPITAL AND RELATED<br />
FINANCING ACTIVITIES:<br />
Acquisition and construction of capital assets (33,911,700) (18,104,911)<br />
Principal paid on capital leases (176,306) (136,821)<br />
Interest paid on capital leases (4,482) (7,310)<br />
Proceeds from sale of capital assets 1,486 58,349<br />
Capital grants received 34,803,242 20,153,259<br />
Net cash provided by (used <strong>for</strong>) capital and related<br />
financing activities 712,240 1,962,566<br />
CASH FLOWS FROM INVESTING ACTIVITIES:<br />
Proceeds from sales and maturities of investments 46,785,300 64,200,000<br />
Purchase of investments (55,509,632) (45,806,112)<br />
Interest received 54,333 106,111<br />
Net cash provided by investing activities (8,669,999) 18,499,999<br />
Net decrease in cash and cash equivalents (3,678,672) 4,026,910<br />
CASH AND CASH EQUIVALENTS, BEGINNING OF YEAR 9,656,222 5,629,312<br />
CASH AND CASH EQUIVALENTS, END OF YEAR $ 5,977,550 9,656,222<br />
RECONCILIATION OF CASH AND CASH EQUIVALENTS TO<br />
AMOUNTS REPORTED ON STATEMENT OF NET ASSETS:<br />
<strong>Report</strong>ed on statement of net assets:<br />
Cash and investments $ 27,671,139 22,625,479<br />
Less investments not meeting the definition of cash and<br />
cash equivalents (21,693,589) (12,969,257)<br />
CASH AND CASH EQUIVALENTS, END OF YEAR $ 5,977,550 9,656,222<br />
(continued on next page)<br />
See accompanying notes to basic financial statements<br />
14<br />
<strong>2012</strong> <strong>Comprehensive</strong> <strong>Annual</strong> <strong>Financial</strong> <strong>Report</strong>
STATEMENT OF CASH FLOWS (CONTINUED)<br />
Year Ended June 30, <strong>2012</strong> (with Comparative Totals <strong>for</strong> Year Ended June 30, 2011)<br />
<strong>2012</strong> 2011<br />
RECONCILIATION OF OPERATING INCOME (LOSS) TO NET<br />
CASH PROVIDED BY (USED FOR) OPERATING ACTIVITIES:<br />
Operating income (loss) $ (70,893,772) (63,812,567)<br />
Adjustments to net cash used by operating activities:<br />
Depreciation 17,070,294 12,772,455<br />
Non-operating miscellaneous income (expense) 24,951 20,002<br />
Realized gain (loss) on sale of capital assets (271,438) (739,670)<br />
(Increase) decrease in accounts receivable 501,693 (545,255)<br />
(Increase) decrease in inventory 82,988 263,337<br />
(Increase) decrease in prepaid items (49,995) (83,990)<br />
(Increase) decrease in other assets 269,616 334,337<br />
Increase (decrease) in accounts payable 5,953,155 (350,023)<br />
Increase (decrease) in accrued salaries and benefits 68,446 180,695<br />
Increase (decrease) in retainage payable - (104,135)<br />
Increase (decrease) in unearned revenue 6,888 20,847<br />
Increase (decrease) in compensated absences payable 65,287 (107,211)<br />
Increase (decrease) in claims payable 1,263,767 338,098<br />
FINANCIAL SECTION<br />
NET CASH PROVIDED BY OPERATING ACTIVITIES $ (45,908,120) (51,813,080)<br />
NON-CASH INVESTING, CAPITAL AND FINANCING ACTIVITIES:<br />
New borrowings under capital lease $ 652,369<br />
-<br />
<strong>2012</strong> <strong>Comprehensive</strong> <strong>Annual</strong> <strong>Financial</strong> <strong>Report</strong><br />
15
FINANCIAL SECTION<br />
NOTES TO BASIC FINANCIAL STATEMENTS YEAR ENDED JUNE 30, <strong>2012</strong><br />
(1) SUMMARY OF SIGNIFICANT ACCOUNTING POLICIES<br />
NATURE OF BUSINESS<br />
<strong>Omnitrans</strong> was organized on March 8, 1976, by a joint powers agreement between the County of San Bernardino, Cali<strong>for</strong>nia<br />
and the following cities: Chino; Colton; Fontana; Loma Linda; Montclair; Ontario; Redlands; Rialto; San Bernardino; and<br />
Upland under Section 6506 of the Cali<strong>for</strong>nia Government Code <strong>for</strong> the purpose of providing transit services under a single<br />
agency. The following cities were added thereafter: Rancho Cucamonga and Grand Terrace in 1979; Highland in 1988;<br />
Yucaipa in 1990; and Chino Hills in 1992.<br />
<strong>Omnitrans</strong> provides a variety of transit services to the public of San Bernardino County. These services include bus operations,<br />
purchased transportation services with independent contractors and demand response transportation services. <strong>Omnitrans</strong> also<br />
functions as a “pass-through” administrative agency <strong>for</strong> various federal, state and local grants.<br />
BASIS OF ACCOUNTING<br />
<strong>Omnitrans</strong> is accounted <strong>for</strong> as an enterprise fund (proprietary fund type) using the economic resources measurement<br />
focus and the accrual basis of accounting. A fund is an accounting entity with a self-balancing set of accounts established<br />
to record the financial position and results of operations of a specific governmental activity. The activities of enterprise<br />
funds closely resemble those of ongoing businesses in which the purpose is to conserve and add to basic resources while<br />
meeting operating expenses from current revenues. Enterprise funds account <strong>for</strong> operations that provide services on a<br />
continuous basis and are substantially financed by revenues derived from user charges. Revenues are recognized when<br />
earned and expenses are recognized as they are incurred.<br />
<strong>Omnitrans</strong> applies all applicable pronouncements issued by the Government Accounting Standards Board (GASB) in<br />
accounting and reporting <strong>for</strong> proprietary operations as well as pronouncements issued on or be<strong>for</strong>e November 30,<br />
1989, unless those pronouncements conflict with or contradict GASB pronouncements: <strong>Financial</strong> Accounting Standards<br />
Board (FASB) Statements and Interpretations, Accounting Principles Board (APB) Opinions, and Accounting Research<br />
Bulletins (ARBs) of the Committee on Accounting Procedure.<br />
IMPLEMENTATION OF GASB NO. 63<br />
During the year ended June 30, <strong>2012</strong>, <strong>Omnitrans</strong> implemented Statement No. 63 of the Governmental Accounting<br />
Standards Board, “<strong>Financial</strong> <strong>Report</strong>ing of Deferred Outflows of Resources, Deferred Inflows of Resources, and Net Position.”<br />
The accompanying financial statements reflect certain changes that have been made with respect to the reporting of the<br />
basic financial statements as a result of the implementation of GASB No. 63.<br />
Statement No. 63 requires governments to no longer report net assets, fund balance or equity, in favor of “net position.”<br />
Accordingly, <strong>Omnitrans</strong> has reported a Statement of Net Position in lieu of a Statement of Net Assets, with net position<br />
being equal to assets, plus deferred outflows of resources, less liabilities and less deferred inflows of resources.<br />
CLASSIFICATION OF REVENUES AND EXPENSES<br />
Enterprise funds distinguish operating revenues and expenses from non-operating items. Operating revenues and expenses<br />
generally result from providing services and producing and delivering goods in connection with an enterprise fund’s<br />
principal operations. The principal operating revenues of <strong>Omnitrans</strong> consist of bus transit services. Non-operating<br />
revenues consist of federal, state and local operating grants, investment income, and special charges that can be used<br />
<strong>for</strong> either operating or capital purposes. Operating expenses <strong>for</strong> enterprise funds include the cost of sales, administrative<br />
expenses and depreciation on capital assets.<br />
Expenses not meeting this definition are reported as non-operating expenses. Non-operating expenses primarily consist of<br />
payments to pass-through agencies and interest expense.<br />
16<br />
<strong>2012</strong> <strong>Comprehensive</strong> <strong>Annual</strong> <strong>Financial</strong> <strong>Report</strong>
Capital contributions consist of grants that are legally restricted <strong>for</strong> capital expenses by federal, state or local law that<br />
established those charges.<br />
When both restricted and unrestricted resources are available <strong>for</strong> use, it is <strong>Omnitrans</strong>' policy to use restricted resources<br />
first, and then unrestricted resources as they are needed.<br />
CASH AND CASH EQUIVALENTS<br />
For the purposes of the Statement of Cash Flows, cash equivalents are defined as short-term, highly liquid investments<br />
that are both readily convertible to known amounts of cash, or so near their maturity that they present insignificant risk<br />
of changes in value because of changes in interest rates, and have an original maturity date of three months or less.<br />
FINANCIAL SECTION<br />
INVESTMENTS<br />
Investments are reported in the accompanying Statement of Net Position at fair value. Changes in fair value that occur<br />
during the fiscal year are recognized as investment income reported <strong>for</strong> that fiscal year. Investment income includes<br />
interest earnings, changes in fair value, and any gains or losses realized upon the liquidation or sale of investments.<br />
ALLOWANCE FOR DOUBTFUL ACCOUNTS<br />
<strong>Omnitrans</strong> has a policy which requires that receivables, except <strong>for</strong> intergovernmental receivables, be written off after<br />
60 days. The allowance <strong>for</strong> doubtful accounts as of June 30, <strong>2012</strong> was $69.<br />
BUDGETARY INFORMATION<br />
Although <strong>Omnitrans</strong> prepares and approves an annual budget, budgetary in<strong>for</strong>mation is not presented because <strong>Omnitrans</strong><br />
is not legally required to adopt a budget.<br />
INVENTORIES<br />
Inventories consist of Operations vehicles’ parts and fuel in storage held <strong>for</strong> consumption. The parts and fuel in storage<br />
are stated at the lower of cost (average cost method) or market. The value of parts and fuel held in storage as of June<br />
30, <strong>2012</strong> was $1,549,750.<br />
CAPITAL ASSETS<br />
Capital assets are valued at cost or estimated historical cost if actual cost is not available. Donated assets are valued<br />
at their estimated fair market value on the date donated. <strong>Omnitrans</strong> capitalizes all assets with a historical cost of at<br />
least $2,000 and a useful life of at least one year. The cost of normal maintenance and repairs that do not add to the<br />
value of the assets or materially extend asset lives are not capitalized.<br />
Depreciation of capital assets used by <strong>Omnitrans</strong> is charged as an expense against its operations. Depreciation is computed<br />
utilizing the straight-line method over the following estimated useful lives:<br />
Number<br />
Category<br />
of Years<br />
Buildings and improvements 5 to 30<br />
Operations equipment 3 to 10<br />
Furniture and office equipment 3 to 20<br />
DEFERRED OUTFLOWS/INFLOWS OF RESOURCES<br />
In addition to assets, the Statement of Net Position will sometimes report a separate section <strong>for</strong> deferred outflows of<br />
resources. This separate financial statement element represents a consumption of net position that applies to a future period<br />
and so will not be recognized as an outflow of resources (expenditure) until then. <strong>Omnitrans</strong> does not have any items that<br />
qualify <strong>for</strong> reporting in this category.<br />
<strong>2012</strong> <strong>Comprehensive</strong> <strong>Annual</strong> <strong>Financial</strong> <strong>Report</strong><br />
17
FINANCIAL SECTION<br />
In addition to liabilities, the Statement of Net Position will sometimes report a separate section <strong>for</strong> deferred inflows of<br />
resources. This separate financial statement element represents an acquisition of net position that applies to a future<br />
period and so will not be recognized as an inflow of resources (revenue) until that time. The government has one item that<br />
qualifies <strong>for</strong> reporting in this category. <strong>Omnitrans</strong> reports the value of their derivative instrument, a natural gas futures<br />
basket used <strong>for</strong> hedging purposes, as an inflow of resources in the period that the amounts become available.<br />
COMPENSATED ABSENCES<br />
It is <strong>Omnitrans</strong>’ policy to permit employees to accumulate earned but unused vacation and sick leave benefits up to certain<br />
limits. Management, non-exempt, and coach operator employees begin to accrue vested sick leave hours after six months<br />
of service. Upon voluntary resignation, retirement or death and after six months of service, management and non-exempt<br />
employees or their estate are paid <strong>for</strong> any unused sick leave up to a maximum of 50 percent of the available sick leave<br />
hours not to exceed 1,200 hours (e.g. 50 percent of 1,200 hours would be paid at 600 hours). Represented employees<br />
begin to accrue vested sick leave hours after reaching a certain amount of service time based upon their respective work<br />
classification. Teamsters accrue sick leave after 1,040 hours of actual hours worked and Amalgamated Transit Union (ATU)<br />
members after their first year of continuous full-time employment, based upon their respective work classification.<br />
Upon voluntary resignation, retirement or death, and after a certain amount of years of service (ATU members after 8 years<br />
of service and Teamsters after 10 years of service), represented employees or their estate are paid <strong>for</strong> any unused sick<br />
leave up to a maximum of 50 percent of available sick leave hours not to exceed 1,200 hours (e.g. 50 percent of 1,200<br />
hours would be paid at 600 hours).<br />
Full-time, non-represented employees begin to accrue vacation hours after 6 months of service. Employee vacation credits<br />
may be accrued and accumulated up to a maximum of 2 years total accumulated vacation credits. Eligible employees with<br />
an annual accrual of 3 or more weeks of vacation per year, after taking 80 hours vacation, shall be permitted to request<br />
2 weeks pay in lieu of time off. Represented employees will accrue vacation benefits in accordance with the provisions<br />
of their respective Memorandum of Understanding (MOU).<br />
Accumulated unpaid vacation and vested sick leave pay is recorded as an expense and a liability at the time the benefit is<br />
earned. Total compensated absences payable was $3,811,584 on June 30, <strong>2012</strong>.<br />
PRIOR YEAR DATA<br />
Selected in<strong>for</strong>mation regarding the prior year has been included in the accompanying financial statements. This in<strong>for</strong>mation<br />
has been included <strong>for</strong> comparison purposes only and does not represent a complete presentation in accordance with<br />
generally accepted accounting principles. Accordingly, such in<strong>for</strong>mation should be read in conjunction with <strong>Omnitrans</strong>’<br />
prior year financial statements, from which this selected financial data was derived.<br />
FEDERAL, STATE AND LOCAL GRANTS<br />
Federal, state and local governments have made various grants available to <strong>Omnitrans</strong> <strong>for</strong> operating assistance and<br />
acquisition of capital assets. Grants <strong>for</strong> operating assistance, the acquisition of equipment or other capital outlay are<br />
not <strong>for</strong>mally recognized in the accounts until the grant becomes a valid receivable as a result of <strong>Omnitrans</strong> complying<br />
with appropriate grant requirements. Operating assistance grants are included in non-operating revenues in the year in<br />
which the grant is applicable and the related expenses are incurred. Revenues earned under capital grants are recorded<br />
as capital contributions.<br />
PASS-THROUGH ACTIVITIES<br />
Revenues associated with grants, where <strong>Omnitrans</strong> serves as the administrating agent, are recorded as either non-operating<br />
revenues or capital contributions based on the approved use of the grant. The related expense is recorded as “pass-through<br />
to other agencies” in the Statement of Revenues, Expenses, and Changes in Net Position as the expenses do not support the<br />
operations of <strong>Omnitrans</strong> nor provide an asset.<br />
18<br />
<strong>2012</strong> <strong>Comprehensive</strong> <strong>Annual</strong> <strong>Financial</strong> <strong>Report</strong>
NET POSITION<br />
The unrestricted net position of <strong>Omnitrans</strong> is restricted by state law <strong>for</strong> sole use by <strong>Omnitrans</strong> <strong>for</strong> bus transit operations.<br />
It is reported as unrestricted net position in the accompanying financial statements because this restriction corresponds<br />
to the general purpose <strong>for</strong> which <strong>Omnitrans</strong> has been established. It is unavailable <strong>for</strong> other government uses and is<br />
committed to the ongoing operations of <strong>Omnitrans</strong>, including amounts necessary to cover contingencies, unanticipated<br />
expenses, revenue shortfalls, and weather and economic fluctuations.<br />
USE OF ESTIMATES<br />
The preparation of basic financial statements in con<strong>for</strong>mity with accounting principles generally accepted in the United<br />
States of America requires management to make estimates and assumptions that affect the reported amounts of assets<br />
and liabilities, and disclosure of contingent assets and liabilities at the date of the financial statements, and the reported<br />
amounts of revenue and expenses during the reporting period. Actual results could differ from those estimates.<br />
FINANCIAL SECTION<br />
(2) CASH AND INVESTMENTS<br />
Cash and investments as of June 30, <strong>2012</strong> consist of the following:<br />
Cash on hand $ 3,000<br />
Deposits with financial institutions 5,974,550<br />
Investments (includes market value adjustment) 21,693,589<br />
$27,671,139<br />
INVESTMENTS AUTHORIZED BY THE CALIFORNIA GOVERNMENT CODE<br />
OR OMNITRANS’ INVESTMENT POLICY<br />
The table below identifies the investment types that are authorized by the Cali<strong>for</strong>nia Government Code (or <strong>Omnitrans</strong>’<br />
investment policy, where more restrictive). The table also identifies certain provisions of the Cali<strong>for</strong>nia Government Code<br />
(or <strong>Omnitrans</strong>’ investment policy, where more restrictive) that address interest rate risk, credit risk, and concentration of<br />
credit risk.<br />
Authorized By Maximum Maximum<br />
Authorized Investment Maximum Percentage Investment<br />
Investment Type Policy Maturity of Portfolio in One Issuer<br />
Local Agency Bonds No 5 years None None<br />
U.S. Treasury Obligations No 5 years None None<br />
Federal Agency Securities No 5 years None None<br />
Banker’s Acceptances No 180 days 40% 30%<br />
Commercial Paper No 270 days 25% 10%<br />
Negotiable Certificates of Deposit No 5 years 30% None<br />
Repurchase Agreements No 1 year None None<br />
20% of base<br />
Reverse Repurchase Agreements No 92 days value None<br />
Medium-Term Notes No 5 years 30% None<br />
Mutual Funds No N/A 20% 10%<br />
Money Market Mutual Funds No N/A 20% 10%<br />
Mortgage Pass-Through Securities No 5 years 20% None<br />
County Pooled Investment Funds No N/A None None<br />
Local Agency Investment Fund Yes N/A None None<br />
State Pools (other investment pools) Yes N/A None None<br />
<strong>2012</strong> <strong>Comprehensive</strong> <strong>Annual</strong> <strong>Financial</strong> <strong>Report</strong><br />
19
FINANCIAL SECTION<br />
INVESTMENTS AUTHORIZED BY DEBT AGREEMENTS<br />
Investment of debt proceeds held by bond trustees are governed by provisions of the debt agreements rather than the<br />
general provisions of the Cali<strong>for</strong>nia Government Code or <strong>Omnitrans</strong>’ investment policy. <strong>Omnitrans</strong> did not have any<br />
investments held by bond trustees as of June 30, <strong>2012</strong>.<br />
DISCLOSURES RELATING TO INTEREST RATE RISK<br />
Interest rate risk is the risk that changes in market interest rates will adversely affect the fair value of an investment.<br />
Generally, the longer the maturity of an investment, the greater the sensitivity of its fair market value to changes in market<br />
interest rates.<br />
In<strong>for</strong>mation about the sensitivity of the fair values of <strong>Omnitrans</strong>’ investments to market interest rate fluctuations is provided<br />
by the following table that shows the distribution of <strong>Omnitrans</strong>’ investments by maturity:<br />
Remaining Maturing (in Months)<br />
12 Months More Than<br />
Investment Type Total Or Less 12 Months<br />
Local Agency Investment Fund $21,693,589 21,693,589 -<br />
Total $21,693,589 21,693,589 -<br />
INVESTMENTS WITH FAIR VALUES HIGHLY SENSITIVE TO INTEREST RATE FLUCTUATIONS<br />
As of June 30, <strong>2012</strong>, <strong>Omnitrans</strong> did not have any investments whose fair values are highly sensitive to interest rate fluctuations.<br />
DISCLOSURES RELATING TO CREDIT RISK<br />
Generally, credit risk is the risk that an issuer of an investment will not fulfill its obligation to the holder of the investment.<br />
This is measured by the assignment of a nationally recognized statistical rating organization. The table below represents<br />
the minimum rating required by the Cali<strong>for</strong>nia Government Code (where applicable), or <strong>Omnitrans</strong>’ investment policy, and<br />
the actual rating as of year-end <strong>for</strong> each investment type.<br />
Minimum<br />
Legal<br />
Rating as of Year End<br />
Investment Type Amount Rating AAA AA A Not Rated<br />
Local Agency<br />
Investment Fund $21,693,589 N/A - - - 21,693,589<br />
Total $21,693,589 - - - 21,693,589<br />
CONCENTRATION OF CREDIT RISK<br />
Concentration of credit risk is the risk of loss attributed to the magnitude of <strong>Omnitrans</strong>’ investment in a single issue. The<br />
investment policy of <strong>Omnitrans</strong> contains no limitations on the amount that can be invested in any one issuer beyond that<br />
stipulated by the Cali<strong>for</strong>nia Government Code. As of June 30, <strong>2012</strong>, <strong>Omnitrans</strong> did not have any investments in any<br />
one issuer (other than external investment pools) that represented 5% or more of its total investment portfolio.<br />
CUSTODIAL CREDIT RISK<br />
Custodial credit risk <strong>for</strong> deposits is the risk that, in the event of the failure of a depository financial institution, <strong>Omnitrans</strong><br />
will not be able to recover its deposits or will not be able to recover collateral securities that are in the possession of an outside<br />
20<br />
<strong>2012</strong> <strong>Comprehensive</strong> <strong>Annual</strong> <strong>Financial</strong> <strong>Report</strong>
party. The custodial credit risk <strong>for</strong> investments is the risk that, in the event of the failure of the counterparty (e.g., broker-dealer)<br />
to a transaction, a government will not be able to recover the value of its investment or collateral securities that are in the<br />
possession of another party. The Cali<strong>for</strong>nia Government Code and <strong>Omnitrans</strong>’ investment policy do not contain legal or<br />
policy requirements that would limit the exposure to custodial credit risk <strong>for</strong> deposits or investments, other than the following<br />
provision <strong>for</strong> deposits. The Cali<strong>for</strong>nia Government Code requires that a financial institution secure deposits made by state<br />
or local government units by pledging securities in an undivided collateral pool held by a depository regulated under state<br />
law (unless so waived by the governmental unit). The market value of the pledged securities in the collateral pool must<br />
equal at least 110% of the total amount deposited by the public agencies. Cali<strong>for</strong>nia law also allows financial institutions<br />
to secure <strong>Omnitrans</strong>’ deposits by pledging first trust deed mortgage notes having a value of 150% of the secured public<br />
deposits. As of June 30, <strong>2012</strong>, $173,676 of <strong>Omnitrans</strong>’ deposits held by Morgan Stanley Smith Barney were uncollateralized.<br />
INVESTMENT IN LAIF<br />
FINANCIAL SECTION<br />
<strong>Omnitrans</strong> is a voluntary participant in the Local Agency Investment Fund (LAIF), which is regulated by Cali<strong>for</strong>nia Government<br />
Code Section 16429.1 through 16429.4 under the oversight of the Treasurer of the State of Cali<strong>for</strong>nia. The fair value of<br />
<strong>Omnitrans</strong>’ investment in this pool is reported in the accompanying financial statements at amounts based upon <strong>Omnitrans</strong>’<br />
pro-rata share of the fair value provided by LAIF <strong>for</strong> the entire LAIF portfolio (in relation to the amortized cost of that portfolio).<br />
The balance available <strong>for</strong> withdrawal is based on the accounting records maintained by LAIF, which are recorded on an<br />
amortized cost basis. Included in LAIF’s investment portfolio are mortgage-backed securities, loans to certain state funds,<br />
securities with interest rates that vary according to changes in rates greater than a one-<strong>for</strong>-one basis, and structured notes.<br />
LAIF is not rated.<br />
(3) FEDERAL, STATE AND LOCAL GRANTS<br />
<strong>Omnitrans</strong> receives operating and capital assistance from various federal, state and local sources.<br />
FEDERAL ASSISTANCE<br />
Under the provision of the Federal Transit Administration (FTA), funds are available to <strong>Omnitrans</strong> <strong>for</strong> preventive<br />
maintenance, security, and various capital costs. Total FTA revenue recognized during the fiscal year ended<br />
June 30, <strong>2012</strong> was $39,989,581.<br />
TRANSPORTATION DEVELOPMENT ACT ASSISTANCE<br />
Pursuant to provisions of the 1971 Transportation Development Act (TDA), as amended, the Cali<strong>for</strong>nia State Legislature<br />
enacted the Local Transportation Fund (LTF) and the State Transit Assistance Fund (STAF) to provide operating and capital<br />
assistance <strong>for</strong> public transportation. These funds are received from the County of San Bernardino based on annual claims<br />
filed by <strong>Omnitrans</strong> and approved by the San Bernardino Associated Governments (SANBAG), the regional transportation<br />
planning entity.<br />
To be eligible <strong>for</strong> TDA funds, <strong>Omnitrans</strong> must maintain a ratio of passenger fares to operating costs of not less than 20.00%<br />
<strong>for</strong> general public transit service and 10.00% <strong>for</strong> specialized service <strong>for</strong> the elderly and handicapped. After considering<br />
certain cost exemption provisions of the TDA, <strong>Omnitrans</strong>’ ratios <strong>for</strong> the fiscal year ended June 30, <strong>2012</strong> were 23.81% <strong>for</strong><br />
general public transit service, and 12.57% <strong>for</strong> specialized service <strong>for</strong> the elderly and handicapped. Total TDA revenue<br />
recognized during the fiscal year ended June 30, <strong>2012</strong> was $33,828,990.<br />
MEASURE I<br />
<strong>Omnitrans</strong> receives Measure I funds <strong>for</strong> paratransit operating costs. Measure I funds are derived from a locally imposed<br />
0.5% retail sales and use tax on all taxable sales within the County of San Bernardino. The allocation and administration<br />
of Measure I is per<strong>for</strong>med by SANBAG. Total Measure I revenue recognized during the fiscal year ended June 30, <strong>2012</strong><br />
was $6,379,645.<br />
<strong>2012</strong> <strong>Comprehensive</strong> <strong>Annual</strong> <strong>Financial</strong> <strong>Report</strong><br />
21
FINANCIAL SECTION<br />
PROPOSITION 1B<br />
The Public Transportation Modernization, Improvement and Service Enhancement Account (PTMISEA) Fund is a part of<br />
the State of Cali<strong>for</strong>nia’s Highway Safety, Traffic Reduction, Air Quality, and Port Security Bond Act of 2006 (Bond Act),<br />
approved by Cali<strong>for</strong>nia voters as Proposition 1B on November 7, 2006. A total of $19.9 billion was deposited into the<br />
PTMISEA fund, $3.6 billion of which was made available to project sponsors in Cali<strong>for</strong>nia <strong>for</strong> allocation to eligible public<br />
transportation projects over a 10-year period. Proposition 1B funds can be used <strong>for</strong> rehabilitation, safety or modernization<br />
improvements, capital service enhancements or expansions, new capital projects, bus rapid transit improvements, or<br />
<strong>for</strong> rolling stock procurement, rehabilitation or replacement. During the fiscal year ended June 30, <strong>2012</strong>, Proposition 1B<br />
cash receipts and cash disbursements were as follows:<br />
Unspent Proposition 1B funds as of June 30, 2011 $7,120,882<br />
Proposition 1B funds received during the fiscal year ended June 30, <strong>2012</strong> 128,566<br />
Proposition 1B expenses incurred during the fiscal year ended June 30, <strong>2012</strong> (2,418,114)<br />
Interest revenue earned on unspent Proposition 1B funds during the fiscal year ended June 30, <strong>2012</strong> 5,170<br />
Total unspent Proposition 1B funds as of June 30, <strong>2012</strong> $4,836,504<br />
(4) LONG-TERM LIABILITIES<br />
Long-term liabilities <strong>for</strong> the year ended June 30, <strong>2012</strong> are as follows:<br />
Amount<br />
Due<br />
Balance on Balance on Due Within Beyond<br />
June 30, 2011 Additions Deletions June 30, <strong>2012</strong> One Year One Year<br />
Compensated<br />
absences $3,746,297 1,977,953 (1,912,666) 3,811,584 2,507,658 1,303,926<br />
Capital leases 114,308 652,369 (176,306) 590,371 164,980 425,391<br />
Claims payable 9,462,232 2,859,989 (1,596,222) 10,725,999 3,037,871 7,688,128<br />
Total long-term<br />
liabilities $13,322,837 5,490,311 (3,685,194) 15,127,954 5,710,509 9,417,445<br />
CAPITAL LEASE OBLIGATIONS<br />
During April <strong>2012</strong>, <strong>Omnitrans</strong> entered into two lease financing arrangements <strong>for</strong> 29 vehicles with Enterprise Fleet Services.<br />
The minimum lease payments required during the current five-year term of these agreements are $665,411. The lease<br />
payments have a present value of $652,369, which approximates the value of the asset, and is the amount capitalized<br />
in <strong>Omnitrans</strong>’ capital assets. The outstanding principal balance was $516,696 as of June 30, <strong>2012</strong>.<br />
During May 2010, <strong>Omnitrans</strong> entered into two lease financing arrangements <strong>for</strong> five relief vehicles with Enterprise Fleet<br />
Services. The minimum lease payments required during the current five-year term of these agreements are $147,420.<br />
The lease payments have a present value of $135,836, which approximates the value of the asset, and is the amount<br />
capitalized in <strong>Omnitrans</strong>’ capital assets. The outstanding principal balance was $63,399 as of June 30, <strong>2012</strong>.<br />
In December 2007, <strong>Omnitrans</strong> entered into an equipment lease <strong>for</strong> ten copiers in the amount of $169,954. The term<br />
of the agreement approximates the useful lives of the copiers. The monthly installment payments of $1,303 are due on<br />
the first day of each month commencing March 1, 2008 and ending February 1, 2013. The outstanding principal balance<br />
was $10,276 as of June 30, <strong>2012</strong>.<br />
22<br />
<strong>2012</strong> <strong>Comprehensive</strong> <strong>Annual</strong> <strong>Financial</strong> <strong>Report</strong>
The future minimum lease obligations and the net present value of these minimum lease payments as of<br />
June 30, <strong>2012</strong> were as follows:<br />
Year Ending<br />
June 30 Principal Interest Total<br />
2013 $164,981 8,007 172,988<br />
2014 157,123 5,444 162,567<br />
2015 139,166 2,757 141,923<br />
2016 129,101 1,392 130,493<br />
Total $590,371 17,600 607,971<br />
FINANCIAL SECTION<br />
(5) CAPITAL ASSETS<br />
Capital asset activity <strong>for</strong> the year ended June 30, <strong>2012</strong> is as follows:<br />
Balance at<br />
Balance at<br />
June 30, 2011 Additions Retirements June 30, <strong>2012</strong><br />
CAPITAL ASSETS, NOT DEPRECIATED:<br />
Land $10,731,918 - - 10,731,918<br />
Construction in progress 33,000,960 33,343,986 (13,900,383) 52,444,563<br />
Total capital assets,<br />
not depreciated $43,732,878 33,343,986 (13,900,383) 63,176,481<br />
CAPITAL ASSETS, DEPRECIATED:<br />
Buildings and improvements 45,893,036 - - 45,893,036<br />
Operations equipment 78,485,398 13,818,690 (3,463,574) 88,840,514<br />
Furniture and office equipment 35,646,877 1,301,778 (11,777) 36,936,878<br />
Total capital assets,<br />
depreciated $160,025,311 15,120,468 (3,475,351) 171,670,428<br />
LESS ACCUMULATED DEPRECIATION FOR:<br />
Buildings and improvements (21,026,164) (1,840,128) - (22,866,292)<br />
Operations equipment (48,776,140) (7,690,192) 3,192,470 (53,273,862)<br />
Furniture and office equipment (14,475,351) (7,539,974) 11,777 (22,003,548)<br />
Total accumulated<br />
depreciation (84,277,655) (17,070,294) 3,204,247 (98,143,702)<br />
Total capital assets,<br />
depreciated, net 75,747,656 (1,949,826) (271,104) 73,526,726<br />
Capital assets, net $119,480,534 31,394,160 (14,171,487) 136,703,207<br />
Depreciation expense <strong>for</strong> the year ended June 30, <strong>2012</strong> was $17,070,294.<br />
<strong>2012</strong> <strong>Comprehensive</strong> <strong>Annual</strong> <strong>Financial</strong> <strong>Report</strong><br />
23
FINANCIAL SECTION<br />
Construction in progress consists primarily of additions to operations equipment and building improvements. Significant<br />
components of construction in progress are as follows:<br />
Cumulative<br />
Amount Expenses Unexpended<br />
Project Authorized June 30, <strong>2012</strong> Commitments<br />
E Street Bus Rapid Transit $81,157,739 39,516,275 41,641,464<br />
E Street Bus Rapid Transit - Right of Way 10,147,607 9,225,759 921,848<br />
San Bernardino Transit Center 1,497,556 1,234,198 263,358<br />
Computer Software and Hard Ware 1,365,903 1,341,218 24,685<br />
Total major components<br />
of construction in progress $94,168,805 51,317,450 42,851,355<br />
(6) OPERATING LEASES<br />
<strong>Omnitrans</strong> leases facilities and tires under noncancelable operating leases. Total costs <strong>for</strong> such leases were $755,724<br />
during the year ended June 30, <strong>2012</strong>. The future minimum lease payments <strong>for</strong> these leases are as follows:<br />
Year Ending June 30<br />
Total<br />
2013 $802,841<br />
2014 156,068<br />
2015 112,702<br />
Total 1,071,611<br />
(7) RISK MANAGEMENT<br />
<strong>Omnitrans</strong> is exposed to various risks of loss related to torts; theft of, damage to and destruction of assets; errors or<br />
omissions; and natural disasters <strong>for</strong> which they carry commercial insurance. Liabilities are reported when it is probable that<br />
a loss has occurred and the amount of the loss can be reasonably estimated. Liabilities include an amount <strong>for</strong> claims that<br />
have been Incurred But Not <strong>Report</strong>ed (IBNR). Claim liabilities are calculated considering the effects of inflation, recent claim<br />
settlement trends, including frequency and amount of payouts and other economic and social factors. The outstanding<br />
claims on June 30, <strong>2012</strong> were estimated to be $10,725,999 and were based on an IBNR study per<strong>for</strong>med in fiscal year<br />
2011-<strong>2012</strong>. Changes in the fund claims liability amount <strong>for</strong> the last two fiscal years are as follows:<br />
Year Ended Beginning of Provisions Claim End of Year<br />
June 30 Year Liability of Claims Payments Liability<br />
2011 $9,124,134 2,366,259 (2,028,161) 9,462,232<br />
<strong>2012</strong> 9,462,232 2,859,989 (1,596,222) 10,725,999<br />
<strong>Omnitrans</strong> is a member of the Association of Cali<strong>for</strong>nia Public Transit Operators Joint Powers Insurance Authority (Authority).<br />
The Authority is a risk-pooling, self-insurance authority, created under provisions of Cali<strong>for</strong>nia law in 1987. The purpose of<br />
the Authority is to arrange and administer programs of insurance <strong>for</strong> the pooling of self-insured losses and to purchase<br />
excess insurance coverage.<br />
On June 30, <strong>2012</strong>, <strong>Omnitrans</strong>’ participation in the self-insurance programs of the Authority is as follows:<br />
• General Liability: <strong>Omnitrans</strong> is self-insured up to $1,000,000 per occurrence and has purchased re-insurance and<br />
excess insurance coverage.<br />
• Automobile Liability: <strong>Omnitrans</strong> is self-insured up to $1,000,000 per occurrence and has purchased re-insurance<br />
and excess insurance coverage.<br />
24<br />
<strong>2012</strong> <strong>Comprehensive</strong> <strong>Annual</strong> <strong>Financial</strong> <strong>Report</strong>
• Public Officials Errors and Omissions: <strong>Omnitrans</strong> is self-insured up to $1,000,000 per occurrence and has purchased<br />
re-insurance and excess insurance coverage.<br />
• Vehicle Collision and <strong>Comprehensive</strong> Liability: Insured up to actual cash value of covered vehicles up to $10,000,000<br />
per occurrence subject to per vehicle deductibles. The Authority has purchased excess insurance coverage.<br />
Separate financial statements of the Authority can be obtained at 1415 L Street, Suite 200, Sacramento, CA 95814.<br />
<strong>Omnitrans</strong> has also purchased additional insurance coverage outlined below:<br />
• Workers’ Compensation Liability: <strong>Omnitrans</strong> is self-insured <strong>for</strong> workers’ compensation claims up to $1,000,000 with<br />
a limit of liability of $5,000,000 and excess coverage up to $95,000,000.<br />
FINANCIAL SECTION<br />
• Property Liability: <strong>Omnitrans</strong> is self-insured <strong>for</strong> property damage up to $25,000 <strong>for</strong> Electronic Data Processing Equipment<br />
and $10,000 <strong>for</strong> all other losses per occurrence, with limit of liability up to $32,522,360. <strong>Omnitrans</strong> has also purchased<br />
earthquake and flood coverage <strong>for</strong> damage, <strong>for</strong> which it is self-insured up to $25,000 <strong>for</strong> an earthquake and $50,000 <strong>for</strong> a<br />
flood per occurrence, with a limit of liability of $10,000,000 and excess coverage of $10,000,000.<br />
• Crime Liability: <strong>Omnitrans</strong> is self-insured <strong>for</strong> employee dishonesty and theft up to $1,000 per occurrence, with a limit<br />
of liability up to $50,000.<br />
• Pollution Remediation Liability: <strong>Omnitrans</strong> is self-insured <strong>for</strong> pollution remediation claims up to $50,000 per occurrence<br />
and $150,000 in aggregate, with a limit of liability of $5,000,000 per occurrence and $10,000,000 in aggregate.<br />
• Employment-Related Practices Liability: <strong>Omnitrans</strong> is self-insured <strong>for</strong> employment-related practices liability claims up<br />
to $50,000 with a limit of liability of $1,000,000.<br />
For the past three fiscal years, none of the above programs of protections has had settlements or judgments that exceeded<br />
pooled or insured coverage. As of June 30, <strong>2012</strong>, in the opinion of legal counsel, <strong>Omnitrans</strong> had no material claims which<br />
would require loss provision in the financial statements and there<strong>for</strong>e no additional claims liability has been recorded.<br />
(8) DEFINED BENEFIT PENSION PLAN<br />
PLAN DESCRIPTION<br />
<strong>Omnitrans</strong> contributes to the Cali<strong>for</strong>nia Public Employees Retirement System (PERS), an agent multiple-employer, public<br />
employee-defined benefit pension plan. PERS provides retirement, disability benefits, and death benefits to plan members<br />
and beneficiaries. PERS acts as a common investment and administrative agent <strong>for</strong> participating public entities within the<br />
State of Cali<strong>for</strong>nia. Copies of PERS’ annual financial report may be obtained from their executive office: 400 Q Street,<br />
Sacramento, Cali<strong>for</strong>nia 95811.<br />
FUNDING POLICY<br />
Participants are required to contribute 7% of their annual covered salary. <strong>Omnitrans</strong> makes the contributions required<br />
of <strong>Omnitrans</strong>’ employees on their behalf and <strong>for</strong> their account. The contribution requirements of the plan members and<br />
<strong>Omnitrans</strong> are established and may be amended by PERS.<br />
ANNUAL PENSION COST<br />
Under GASB Statement No. 27, an employer reports an <strong>Annual</strong> Pension Cost (APC) equal to the <strong>Annual</strong> Required Contribution<br />
(ARC) plus an adjustment <strong>for</strong> the cumulative difference between the APC and the employer’s actual plan contributions <strong>for</strong> the<br />
year. The cumulative difference is called the Net Pension Obligation (NPO). The ARC <strong>for</strong> the period July 1, 2011 to June 30,<br />
<strong>2012</strong> has been determined by an actuarial valuation of the plan as of June 30, 2009. The contribution rate indicated <strong>for</strong> the<br />
period is 11.070% of payroll. In order to calculate the dollar value of the ARC <strong>for</strong> inclusion in financial statements prepared as<br />
<strong>2012</strong> <strong>Comprehensive</strong> <strong>Annual</strong> <strong>Financial</strong> <strong>Report</strong><br />
25
FINANCIAL SECTION<br />
of June 30, <strong>2012</strong>, this contribution rate, as modified by any amendments <strong>for</strong> the year, is multiplied by the payroll of covered<br />
employees that were actually paid during the period from July 1, 2011 to June 30, <strong>2012</strong>.<br />
A summary of principal assumptions and methods used to determine the ARC is shown below.<br />
Valuation Date June 30, 2009<br />
Actuarial Cost Method<br />
Entry Age Actuarial Cost Method<br />
Amortization Method<br />
Level Percent of Payroll<br />
Average Remaining Period<br />
22 Years as of the Valuation Date<br />
Asset Valuation Method<br />
15-Year Smoothed Market<br />
Actuarial Assumptions:<br />
Investment Rate of Return 7.75% (net of administrative expenses)<br />
Projected Salary Increases 3.55% to 14.45% depending on age, service, and type<br />
of employment<br />
Inflation 3.00%<br />
Payroll Growth 3.25%<br />
Individual Salary Growth<br />
A merit scale varying by duration of employment coupled<br />
with an assumed annual inflation component of 3.00%<br />
and an annual production growth of 0.25%.<br />
Initial unfunded liabilities are amortized over a closed period that depends on the plan’s date of entry into CalPERS.<br />
Subsequent plan amendments are amortized as a level percentage of pay over a closed 20-year period. Gains and<br />
losses that occur in the operation of the plan are amortized over a rolling period, which results in an amortization of<br />
6% of unamortized gains and losses each year. If the plan’s accrued liability exceeds the actuarial value of plan assets,<br />
then the amortization payment on the total unfunded liability may not be lower than the payment calculated over a<br />
30-year amortization period.<br />
The Schedule of Funding Progress presented below presents multi-year trend in<strong>for</strong>mation about whether the actuarial<br />
value of plan assets is increasing or decreasing over time relative to the actuarial accrued liability <strong>for</strong> benefits.<br />
Three-Year Trend In<strong>for</strong>mation<br />
<strong>Annual</strong> Pension Percentage of Net Pension<br />
Fiscal Year Cost (APC) APC Contribution Obligation<br />
6/30/10 $3,041,854 100% -<br />
6/30/11 2,851,883 100% -<br />
6/30/12 3,050,337 100% -<br />
The Schedule of Funding Progress presented below shows the recent history of the actuarial value of assets, actuarial<br />
accrued liability, their relationship, and the relationship of the unfunded actuarial accrued liability to payroll.<br />
Entry Age<br />
Unfunded/<br />
Normal Actuarial Liability <strong>Annual</strong> UAAL<br />
Valuation Accrued Value of (Excess Funded Covered As a % of<br />
Date Liability Assets Assets) Status Payroll Payroll<br />
6/30/08 $83,978,470 81,559,403 2,419,067 97.1% 28,941,542 8.4%<br />
6/30/09 95,214,597 89,108,941 6,105,656 93.6% 30,956,875 19.7%<br />
6/30/10 102,163,260 97,530,157 4,633,103 95.5% 30,958,894 15.0%<br />
26<br />
<strong>2012</strong> <strong>Comprehensive</strong> <strong>Annual</strong> <strong>Financial</strong> <strong>Report</strong>
(9) COMMITMENTS AND CONTINGENCIES<br />
LITIGATION<br />
<strong>Omnitrans</strong> is subject to lawsuits and claims which arise out of the normal course of business. In the opinion of management,<br />
based upon the opinion of legal counsel, the disposition of such actions of which it is aware will not have a material effect on<br />
the financial position, results of operations or liquidity of <strong>Omnitrans</strong>.<br />
CONTINGENCIES<br />
<strong>Omnitrans</strong> has received federal and state funds <strong>for</strong> specific purposes that are subject to review and audit by grantor<br />
agencies. Although such audits could generate expenditure disallowances under the terms of the grants, in the opinion<br />
of management, any additional required reimbursement will not have a material effect on the financial position, results<br />
of operations or liquidity of <strong>Omnitrans</strong>.<br />
FINANCIAL SECTION<br />
(10) PASS-THROUGH GRANTS<br />
In November 2003, the Board approved a grant to the City of Needles <strong>for</strong> the restoration of the El Garces Hotel/Santa<br />
Fe Depot. The restoration is funded by FTA funds with <strong>Omnitrans</strong> acting as the administrative agent and the City of Needles<br />
acting as the sub-grantee. During the fiscal year ended June 30, <strong>2012</strong>, expenses incurred were $110,934.<br />
In November 2004, the Board approved an agreement between <strong>Omnitrans</strong> and Chaffey College which initiated the<br />
cooperation and participation in development and construction of the Chaffey College Transcenter to be located in the<br />
City of Rancho Cucamonga. During the fiscal year ended June 30, <strong>2012</strong>, expenses incurred were $265,825.<br />
In March 2008, the Board approved an agreement between <strong>Omnitrans</strong> and SANBAG which included a cooperative and<br />
collaborative process to establish the range of alternatives to be considered and factors to be addressed regarding the<br />
San Bernardino to Redlands Corridor Regionally Significant Transportation Investment Study (RSTIS) and Environmental<br />
Analysis. During the fiscal year ended June 30, <strong>2012</strong>, expenses incurred were $7,465.<br />
In August 2009, the Board approved an agreement to obtain New Freedom Funds <strong>for</strong> the Inland Valley Recovery Services<br />
to operate a rehab center that would purchase and operate a vehicle. During the fiscal year ended June 30, <strong>2012</strong>,<br />
expenses incurred were $23,762.<br />
In October 2009, <strong>Omnitrans</strong> received an FTA Award <strong>for</strong> various projects. Within that award agreement was a portion to<br />
pass through to the City of Chino <strong>for</strong> the Chino Transit Terminal Facility Improvements to be located in the City of Chino.<br />
During the fiscal year ended June 30, <strong>2012</strong>, expenses incurred were $7,993.<br />
In December 2010, the Board approved an agreement between <strong>Omnitrans</strong> and the City of Ontario to participate in the<br />
construction of the Ontario Civic Center Transit Station to be located in the city of Ontario. During the fiscal year ended<br />
June 30, <strong>2012</strong>, expenses incurred were $13,451.<br />
In February 2011, the Board approved an agreement between <strong>Omnitrans</strong> and the City of Rialto to participate in the Rialto<br />
Metrolink Expansion Project to be located in the City of Rialto. During the fiscal year ended June 30, <strong>2012</strong>, expenses<br />
incurred were $14,532.<br />
In March <strong>2012</strong>, the Board approved an agreement between <strong>Omnitrans</strong> and Central City Lutheran to fund the<br />
purchase of a vehicle <strong>for</strong> medical and social service appointments and operating expenses. During the fiscal year<br />
ended June 30, <strong>2012</strong>, expenses incurred were $56,521.<br />
In January <strong>2012</strong>, the Board approved an agreement between <strong>Omnitrans</strong> and Pomona Valley Workshop (PVW) to participate<br />
in the PVW In Motion Program and fund the purchase of 4 vehicles and the hiring of a transportation coordinator to oversee<br />
the program. During the fiscal year ended June 30, <strong>2012</strong>, expenses incurred were $117,292.<br />
<strong>2012</strong> <strong>Comprehensive</strong> <strong>Annual</strong> <strong>Financial</strong> <strong>Report</strong><br />
27
FINANCIAL SECTION<br />
In February <strong>2012</strong>, the Board approved an agreement between <strong>Omnitrans</strong> and Valley Transportation Services to fund the<br />
staffing of 5 travel training project employees. During the fiscal year ended June 30, <strong>2012</strong>, expenses incurred were $1,725.<br />
In February <strong>2012</strong>, the Board approved an agreement between <strong>Omnitrans</strong> and Community Senior Services to establish a<br />
volunteer driver program to service disabled residents of west San Bernardino Valley. During the fiscal year ended June<br />
30, <strong>2012</strong>, expenses incurred were $608.<br />
Pass-through activity <strong>for</strong> the year ended June 30, <strong>2012</strong> is summarized as follows:<br />
City of Needles $110,934<br />
Chaffey College Transit Center 265,825<br />
SANBAG 7,465<br />
Inland Valley Recovery Services 23,762<br />
City of Chino 7,993<br />
City of Ontario 13,451<br />
City of Rialto 14,532<br />
Central City Lutheran 56,521<br />
Pomona Valley 117,292<br />
Valley Transportation Services 1,725<br />
Community Senior Services 608<br />
(11) NET POSITION<br />
Total $620,108<br />
The following is a detailed breakdown of net position. Also shown below is a listing of the uses of unrestricted net position.<br />
Capital assets, net of accumulated depreciation $136,703,207<br />
Less: Debt offsetting capital assets (590,371)<br />
Net investment in capital assets 136,112,836<br />
Unrestricted net position 8,548,071<br />
Total net position $144,660,907<br />
Although not legally restricted, unrestricted net position has been recorded as reserves <strong>for</strong> various purposes. These reserves<br />
have been established and maintained to provide sound financial management and a stable and equitable rate structure.<br />
The June 30, <strong>2012</strong> reserve amounts consist of the following:<br />
Reserved <strong>for</strong> bus transit operations, workers’<br />
compensation and general liability contingencies $8,548,071<br />
Total unrestricted net position $8,548,071<br />
(12) DERIVATIVE INSTRUMENTS<br />
<strong>Omnitrans</strong> holds a basket of natural gas futures contracts with a contract price of $3.349 / MMBtu and a notional amount<br />
of 12,500 MMBtus / month that settle on a monthly basis. As of June 30, <strong>2012</strong>, there were 23 remaining monthly settlements<br />
as the last maturity date is May 29, 2014. These futures contracts are classified as cash flow hedges of <strong>for</strong>ecasted purchases<br />
(12,500 MMBtus per month) of clean energy natural gas through May 2014.<br />
28<br />
<strong>2012</strong> <strong>Comprehensive</strong> <strong>Annual</strong> <strong>Financial</strong> <strong>Report</strong>
The fair values, classification and notional amounts <strong>for</strong> the natural gas hedge derivatives accounted <strong>for</strong> as derivative financial<br />
instruments as of June 30, <strong>2012</strong> are summarized as follows:<br />
Changes in<br />
Fair Value as of Fair Value <strong>for</strong><br />
Cash Flow Hedges Classification Notional June 30, <strong>2012</strong> Fiscal Year<br />
Henry Hub Natural Deferred 12,500 $55,300 $55,300<br />
Gas Futures Basket Inflow MMBtu/Month<br />
(effective hedge)<br />
FINANCIAL SECTION<br />
The accounting standards, namely GASB Statement No. 53, “Accounting and <strong>Financial</strong> <strong>Report</strong>ing <strong>for</strong> Derivative Instruments”<br />
(“GASB 53”), require governments to record derivative instruments on the Statement of Net Position as either assets or<br />
liabilities, depending on the fair value of the derivative. <strong>Omnitrans</strong>’ gas hedging contracts are an effective hedge, thus<br />
gains and losses are deferred on the Statement of Net Position as either current credits or charges <strong>for</strong> contracts with under<br />
12 months remaining until expiration, or as long-term <strong>for</strong> contracts with over 12 months remaining until expiration. A deferred<br />
inflow of resources has also been recorded on the Statement of Net Position reflecting the deferred inflow associated with the<br />
derivative financial instrument.<br />
In January <strong>2012</strong>, <strong>Omnitrans</strong> entered into an agreement with Morgan Stanley Smith Barney <strong>for</strong> brokerage services <strong>for</strong><br />
transactions to be executed in <strong>Omnitrans</strong>’ name on the New York Mercantile Exchange (NYMEX). The objective of the<br />
brokerage agreement is to achieve cost certainty <strong>for</strong> deliveries of Liquefied Natural Gas (LNG) based on hedging activity<br />
of LNG futures contracts traded openly on the NYMEX.<br />
The name of the derivative traded openly on the NYMEX is the Henry Hub Natural Gas Futures Basket (Futures Basket) and<br />
it has an effective date of January 17, <strong>2012</strong> and a maturity date of May 29, 2014. As required by the brokerage agreement<br />
with Morgan Stanley Smith Barney, <strong>Omnitrans</strong> deposited $175,000 into a margin account to initiate the derivative.<br />
<strong>2012</strong> <strong>Comprehensive</strong> <strong>Annual</strong> <strong>Financial</strong> <strong>Report</strong><br />
29
30<br />
THIS PAGE LEFT BLANK INTENTIONALLY
STATISTICAL SECTION<br />
CONNECTING<br />
OUR<br />
COMMUNITY
STATISTIACAL SECTION<br />
CONNECTING<br />
OUR<br />
COMMUNITY
STATISTICAL SECTION<br />
This section of <strong>Omnitrans</strong>’ <strong>Comprehensive</strong> <strong>Annual</strong> <strong>Financial</strong> <strong>Report</strong> presents detailed in<strong>for</strong>mation as a context <strong>for</strong><br />
understanding what the in<strong>for</strong>mation in the financial statements, note disclosures, and required supplementary<br />
in<strong>for</strong>mation says about <strong>Omnitrans</strong>’ overall financial health. This in<strong>for</strong>mation has not been audited by the independent auditors.<br />
Page<br />
FINANCIAL TRENDS 32<br />
These schedules contain trend in<strong>for</strong>mation to help the reader understand how <strong>Omnitrans</strong>’<br />
financial per<strong>for</strong>mance and well-being has changed over time.<br />
REVENUE CAPACITY 34<br />
These schedules contain in<strong>for</strong>mation to help the reader assess <strong>Omnitrans</strong>’ most significant<br />
local revenue source, passenger fares.<br />
STATISTICAL SECTION<br />
THE ECONOMY AND ECONOMIC OUTLOOK 39<br />
These schedules offer demographic and economic indicators to help the reader understand<br />
the environment within which <strong>Omnitrans</strong>’ financial activities take place.<br />
OPERATING INFORMATION 40<br />
These schedules contain service and infrastructure data to help the reader understand how<br />
the in<strong>for</strong>mation in <strong>Omnitrans</strong>’ financial report relates to the services <strong>Omnitrans</strong> provides<br />
and the activities it per<strong>for</strong>ms.<br />
Source: Unless otherwise noted, the in<strong>for</strong>mation in these schedules derived from the <strong>Comprehensive</strong> <strong>Annual</strong> <strong>Financial</strong><br />
<strong>Report</strong>s <strong>for</strong> the relevant years. <strong>Omnitrans</strong> implemented Governmental Accounting Standards Board, Statement Number<br />
34 (GASB 34) in the fiscal year ended June 30, 2003; schedules presented government-wide in<strong>for</strong>mation includes in<strong>for</strong>mation<br />
beginning in the year.<br />
<strong>2012</strong> <strong>Comprehensive</strong> <strong>Annual</strong> <strong>Financial</strong> <strong>Report</strong><br />
31
STATISTICAL SECTION<br />
FINANCIAL TRENDS<br />
NET POSITION BY COMPONENT<br />
2003 2004 2005 2006 2007 2008 2009 2010 2011 <strong>2012</strong><br />
Capital assets, net of<br />
accumulated depreciation $68,967,329 77,167,085 81,664,827 79,318,662 84,731,356 84,317,308 94,909,096 114,540,764 119,480,534 136,703,207<br />
Less: Debt offsetting capital assets 547,921 850,173 0 (57,044) (404,372) (364,370) (241,226) (251,129) (114,308) (590,371)<br />
Total invested in capital assets, 69,515,250 78,017,258 81,664,827 79,261,618 84,326,984 83,952,938 94,667,870 114,289,635 119,366,226 136,112,836<br />
net of related debt<br />
Unrestricted net assets 16,778,833 15,005,583 17,617,017 28,256,748 29,683,079 33,300,903 33,883,455 29,320,746 14,717,794 8,548,071<br />
Total net position $86,294,083 93,022,841 99,281,844 107,518,366 114,010,063 117,253,841 128,551,325 143,610,381 134,084,020 144,660,907<br />
<strong>Omnitrans</strong> implemented GASB 34 during the fiscal year end June 30, 2003. The increase in net position is mainly attributed to ongoing construction of the San Bernardino Express Bus Rapid Transit (sbX), and preliminary<br />
engineering and design of the San Bernardino Transit Center projects.<br />
Source: Finance Department<br />
32<br />
<strong>2012</strong> <strong>Comprehensive</strong> <strong>Annual</strong> <strong>Financial</strong> <strong>Report</strong>
FINANCIAL TRENDS (CONTINUED)<br />
CHANGES IN NET POSITION<br />
2003 2004 2005 2006 2007 2008 2009 2010 2011 <strong>2012</strong><br />
OPERATING REVENUES<br />
Passenger fares $ 11,566,651 12,075,736 11,837,875 12,202,126 12,761,463 13,511,536 13,779,684 14,242,013 14,538,747 14,536,931<br />
Advertising revenues 554,784 592,126 596,723 677,943 824,253 948,051 967,628 849,585 909,176 805,904<br />
Other transportation revenues 163,002 189,553 267,901 111,577 37,862 47,307 42,708 39,752 41,802 39,819<br />
Total revenues $ 12,284,437 12,857,415 12,702,499 12,991,646 13,623,578 14,506,894 14,790,020 15,131,350 15,489,725 15,382,654<br />
OPERATING EXPENSES<br />
Depreciation and amortization 8,870,422 8,084,525 7,869,981 8,275,341 8,323,081 8,861,306 9,255,553 10,999,458 12,772,455 17,070,294<br />
Other operating expenses 56,338,850 61,486,917 64,367,977 64,867,497 66,481,860 67,756,893 67,770,003 67,501,900 66,529,837 69,206,132<br />
Total expenses $ 65,209,272 69,571,442 72,237,958 73,142,838 74,804,941 76,618,199 77,025,556 78,501,358 79,302,292 86,276,426<br />
NON-OPERATING<br />
REVENUES/(EXPENSES)<br />
Federal and local<br />
operating grants 43,061,928 45,956,338 49,798,107 54,858,935 52,112,668 55,587,601 52,983,639 48,085,804 52,675,797 47,875,811<br />
Interest income 338,592 285,807 464,377 995,770 1,714,629 1,656,529 758,950 243,098 74,302 52,727<br />
Interest expense 0 0 0 (2,218) (5,762) (11,029) (9,149) (6,835) (6,590) (3,980)<br />
Pass-through to<br />
other agencies (2,884,271) (3,727,931) (2,625,321) (800,137) (729,007) (1,254,751) (2,779,299) (3,031,642) (18,754,320) (620,108)<br />
Other non-operating<br />
revenues (expenses) 116,692 (777,389) 171,574 55,196 (305,583) (258,422) (24,710) (299,568) (719,668) (246,487)<br />
Total non-operating<br />
revenues $ 40,632,941 41,736,825 47,808,737 55,107,546 52,786,945 55,719,928 50,929,431 44,990,857 33,269,521 47,057,963<br />
Income be<strong>for</strong>e<br />
capital contribution (12,291,894) (14,977,202) (11,726,722) (5,043,646) (8,394,418) (6,391,377) (11,306,105) (18,379,151) (30,543,046) (23,835,809)<br />
CAPITAL CONTRIBUTIONS<br />
Capital assistance $ 6,628,839 21,705,960 16,144,460 7,274,580 14,623,890 9,635,155 22,603,589 33,438,207 21,016,685 34,412,696<br />
Contributions from<br />
other agencies 0 0 0 0 262,225 0 0 0 0 0<br />
Total capital contributions $ 6,628,839 21,705,960 16,144,460 7,274,580 14,886,115 9,635,155 22,603,589 33,438,207 21,016,685 34,412,696<br />
Change in net position $ (5,663,055) 6,728,758 4,417,738 2,230,934 6,491,697 3,243,778 11,297,484 15,059,056 (9,526,361) 10,576,887<br />
Net position,<br />
beginning of year $ 91,957,138 86,294,083 94,864,106 105,287,432 107,518,366 114,010,063 117,253,841 128,551,325 143,610,381 134,084,020<br />
Net position, end of year $ 86,294,083 93,022,841 99,281,844 107,518,366 114,010,063 117,253,841 128,551,325 143,610,381 134,084,020 144,660,907<br />
Notes: <strong>Omnitrans</strong> implemented GASB 34 during the fiscal year ended June 30, 2003. The <strong>FY</strong>2005 beginning balance in net assets includes an adjustment <strong>for</strong> workers’ compensation reserve that was previously<br />
overstated. In addition, the restatement includes certain revenues and expenses that were not recognized in prior period. Pass-through to other agencies <strong>for</strong> 2011 include return of $16M in LTF funds to SANBAG<br />
<strong>for</strong> future allocation.<br />
Source: Finance Department<br />
STATISTICAL SECTION<br />
<strong>2012</strong> <strong>Comprehensive</strong> <strong>Annual</strong> <strong>Financial</strong> <strong>Report</strong><br />
33
STATISTICAL SECTION<br />
REVENUE CAPACITY<br />
REVENUE SOURCE<br />
2003 2004 2005 2006 2007 2008 2009 2010 2011 <strong>2012</strong><br />
Passenger Fares - Individuals<br />
F/R Full Fares - Cash $4,449,891 $3,960,198 $3,453,606 $3,885,180 $4,321,978 $4,571,811 $4,510,511 $4,715,996 $4,756,220 $4,564,607<br />
F/R Senior/Disable Fare - Cash 148,347 151,782 137,899 179,632 210,954 256,870 263,959 297,986 34,730 360,603<br />
F/R 1-Day & 7-Day Full Fare - Pass 2,855,475 3,450,711 3,634,606 3,910,662 4,139,709 4,015,846 3,925,863 3,626,533 3,540,698 3,478,828<br />
F/R 1-Day & 7-Day S/D Fare - Pass 334,309 417,956 442,060 538,213 562,418 613,947 606,615 666,085 716,572 712,770<br />
F/R 31-Day Full Fare - Pass 493,809 1,008,613 1,054,614 1,004,008 1,069,585 1,197,152 1,299,310 1,423,947 1,354,296 1,125,569<br />
(less: discount)<br />
F/R 31-Day Student Fare-Pass 606,788 797,320 882,108 833,925 866,516 837,689 1,010,097 1,239,874 1,247,839 909,534<br />
F/R 31-Day Senior Fare - Pass 91,233 109,414 91,278 84,538 82,373 86,571 93,902 0 0 0<br />
F/R 31-Day Disability Fare - Pass 205,760 388,291 371,914 362,423 325,432 352,027 367,110 479,601* 542,878 571,416<br />
University Passes 0 0 0 0 0 0 0 0 0 736,134<br />
Metrolink Transfer 146 140 1,514 920 37,819 3,237 66,712 49,419 51,325 100,098<br />
F/R 7-Day Student Pass 6,500 227,621 347,973 417,670 446,094 340,581<br />
Access Base Fare - Cash 128,961 151,255 149,292 154,518 130,641 150,814 138,454 158,044 166,246 144,141<br />
Access Base Fare (3 zones) - Ticket 8,089 483,474 888,070 889,053 918,970 1,032,973 991,817 1,023,493 1,183,363 1,248,892<br />
Access Additional (1 zone) - Ticket 16,374 141,228 255 1,553 3,660 5,175 3,916 4,059 12,989 17,071<br />
Access Monthly Subscription 8,040 71,595 3,968 4,315 4,055 6,020 21,510 16,075 13,340 12,905<br />
Zone - Pass<br />
Total Passenger Fares $9,347,222 $11,131,977 $11,111,183 $11,848,938 $12,680,609 $13,397,751 $13,647,749 $14,118,782 $14,366,590 $14,323,149<br />
Special Transit Fares - Group<br />
F/R 1 - Trip Full Fare - Ticket 1,184 0 0 25 378 54,675 41,475 57,705 67,330<br />
OmniLink (Yucaipa) - Cash 54,135 48,173 42,214 37,802 40,075 48,104 46,238 50,305 26,859 20,777<br />
OmniLink (Chino Hills) - Cash 9,010 10,850 13,639 12,688 12,829 22,388 22,368 20,570 10,017 8,914<br />
OmniLink S/D Fare - Ticket 1,620 0 1,496 2,583 2,525 5,821 5,495 5,994 5,535 4,199<br />
OmniLink Full Fare - Ticket 56,760 38,739 17,883 40,250 25,400 35,960 297 459 0 54<br />
OmniLink Student Fare - Ticket 1,134 2,862 4,428 2,934 2,304<br />
OmniGo - Fares 69,107 110,204<br />
Total Special Transit Fares $122,710 $97,762 $75,231 $93,322 $80,854 $113,785 $131,935 $123,231 $172,157 $213,782<br />
Total Fares $9,469,932 $11,229,739 $11,186,415 $11,942,260 $12,761,463 $13,511,536 $13,779,684 $14,242,013 $14,538,747 $14,536,931<br />
* F/R 31-Day Senior and Disable Passes were combined into a single pass.<br />
** Implemented GoSmart Student Pass Program. Source: Finance Department<br />
34<br />
<strong>2012</strong> <strong>Comprehensive</strong> <strong>Annual</strong> <strong>Financial</strong> <strong>Report</strong>
DEMOGRAPHIC AND ECONOMIC INFORMATION<br />
DEMOGRAPHICS AND STATISTICS OF SAN BERNARDINO COUNTY<br />
Personal Per Capita<br />
Fiscal Income Personal Median School Unemployment<br />
Year Population (000) Income Age Enrollment Rate<br />
2003 1,853,248 44,452,948 23,987 30.4 407,228 6.3%<br />
2004 1,907,138 47,921,959 25,128 30.3 419,084 5.8%<br />
2005 1,953,229 50,916,445 26,068 30.4 423,780 5.3%<br />
2006 1,987,505 53,928,618 27,134 30.4 427,631 4.8%<br />
2007 2,007,800 56,940,673 28,187 30.3 427,583 5.6%<br />
2008 2,044,895 59,800,525 29,016 30.3 428,142 8.0%<br />
2009 2,045,632 60,875,315 30,363 30.3 420,325 13.6%<br />
2010 2,048,217 60,800,000 29,848 30.3 415,549 14.3%<br />
2011 2,053,348 63,600,000 30,245 30.9 417,202 14.3%<br />
<strong>2012</strong> 2,065,000 59,300,605 28,717 31.2 417,000 12.2%<br />
STATISTICAL SECTION<br />
Source: U.S. Census Bureau; Bureau of Economic Analysis; Cali<strong>for</strong>nia Employment Development Department;<br />
Cali<strong>for</strong>nia Basic Educational Data Systems (CBEDS); Cali<strong>for</strong>nia Department of Education.<br />
PRINCIPAL EMPLOYERS OF SAN BERNARDINO COUNTY<br />
<strong>2012</strong> 2011<br />
Percent of<br />
Employer Rank Employees Total Employment Rank<br />
County of San Bernardino, San Bernardino 1 15,000 - 20,000 1.8% 3<br />
U.S. Army, Fort Irwin & National Training Center 2 15,000 - 20,000 1.4% 4<br />
Loma Linda University* 3 10,000 - 15,000 1.4% 6<br />
U.S. Marine Corps Air Ground Combat Center 4 10,000 - 15,000 1.3% 5<br />
San Bernardino City Unified School District 5 5,000 - 10,000 0.8% 12<br />
Stater Brothers Markets, San Bernardino 6 5,000 - 10,000 0.8% 1<br />
Ontario International Airport, Ontario 7 5,000 - 10,000 0.8% 7<br />
Wal-Mart Stores Inc. 8 5,000 - 10,000 0.6% 8<br />
Kaiser Permanente 9 5,000 - 10,000 0.6% 9<br />
United Parcel Service (UPS) 10 5,000 - 10,000 0.5% 10<br />
Arrowhead Regional Medical Center, Colton 11 2,000 - 5,000 0.5% 2<br />
Fontana Unified School District 12 2,000 - 5,000 0.4% 13<br />
San Manuel Band of Mission Indians 13 2,000 - 5,000 0.3% 15<br />
Chino Valley Unified School District, Chino 14 2,000 - 5,000 0.3% 16<br />
Cali<strong>for</strong>nia State University, San Bernardino 15 2,000 - 5,000 0.3% 11<br />
Colton Joint Unified School District 16 2,000 - 5,000 0.3% 14<br />
*Includes: Loma Linda University, Loma Linda Medical Center, and VA Loma Linda Healthcare Systems<br />
Source: The Inland Empire - Southern Cali<strong>for</strong>nia’s Backyard, U.S. Census Bureau, Inland SoCal<br />
<strong>2012</strong> <strong>Comprehensive</strong> <strong>Annual</strong> <strong>Financial</strong> <strong>Report</strong><br />
35
STATISTICAL SECTION<br />
RIVERSIDE-SAN BERNARDINO-ONTARIO MSA (RIVERSIDE AND SAN BERNARDINO COUNTIES)<br />
INDUSTRY EMPLOYMENT AND LABOR FORCE<br />
TITLE Jun-03 Jun-04 Jun-05 Jun-06 Jun-07 Jun-08 Jun-09 Jun-10 Jun-11 Jun-12 Average<br />
Civilian Labor Force 1,589,000 1,651,400 1,703,600 1,746,000 1,767,400 1,780,200 1,776,700 1,794,800 1,793,400 1,808,000 1,741,050<br />
Civilian Employment 1,480,000 1,549,300 1,610,100 1,656,700 1,664,200 1,636,800 1,536,600 1,537,700 1,542,700 1,579,800 1,579,390<br />
Civilian Unemployment 109,000 102,100 93,500 89,300 103,200 143,400 240,200 257,100 250,600 228,200 161,660<br />
Civilian Unemployment Rate 6.9% 6.2% 5.5% 5.1% 5.8% 8.1% 13.5% 14.3% 14.0% 12.6% 9.2%<br />
Total, All Industries 1,130,100 1,187,500 1,245,500 1,300,600 1,301,400 1,256,200 1,160,000 1,154,100 1,145,800 1,168,500 1,204,970<br />
Total Farm 28,800 25,900 23,700 22,500 22,800 21,900 20,900 21,100 19,000 19,100 22,570<br />
Total Nonfarm 1,101,300 1,161,600 1,221,800 1,278,100 1,278,600 1,234,300 1,139,100 1,133,000 1,126,800 1,149,400 1,182,400<br />
Total Private 887,200 948,200 1,001,600 1,050,800 1,049,600 1,001,000 906,300 891,400 896,000 924,300 955,640<br />
Goods Producing 217,000 234,400 247,000 259,400 237,800 203,500 159,900 147,800 146,100 146,300 199,920<br />
Mining and Logging 1,200 1,200 1,300 1,400 1,300 1,200 1,200 1,000 1,000 1,100 1,190<br />
Construction 99,800 112,200 124,900 132,600 116,600 93,800 69,800 61,300 59,100 59,300 92,940<br />
Construction of Buildings 15,700 17,800 20,300 22,500 20,300 16,300 12,000 10,600 10,700 11,100 15,730<br />
Heavy & Civil Engineering Construction 10,700 11,400 12,500 12,500 13,000 11,700 9,100 8,200 9,000 9,500 10,760<br />
Specialty Trade Contractors 73,400 83,000 92,100 97,600 83,300 65,800 48,700 42,500 39,400 38,700 66,450<br />
Building Foundation & Exterior Contractors 26,700 30,400 34,700 37,200 29,200 20,800 13,600 12,400 10,800 9,600 22,540<br />
Building Equipment Contractors 18,400 20,000 22,200 22,900 21,800 19,200 15,800 13,700 13,400 13,200 18,060<br />
Building Finishing Contractors 19,900 23,500 25,000 25,900 21,600 16,500 12,400 10,400 9,800 9,100 17,410<br />
Manufacturing 116,000 121,000 120,800 125,400 119,900 108,500 88,900 85,500 86,000 85,900 105,790<br />
Durable Goods 82,500 85,800 86,000 88,600 83,100 73,700 58,200 55,500 56,600 55,700 72,570<br />
Fabricated Metal Product Manufacturing 15,900 16,500 17,000 16,800 16,100 14,900 11,900 11,500 12,500 12,400 14,550<br />
Nondurable Goods 33,500 35,200 34,800 36,800 36,800 34,800 30,700 30,000 29,400 30,200 33,220<br />
Food Mfg & Beverage & Tobacco Product Mfg 8,800 9,300 9,600 10,800 11,100 10,500 9,700 9,800 9,500 9,600 9,870<br />
Service Providing 884,300 927,200 974,800 1,018,700 1,040,800 1,030,800 979,200 985,200 980,700 1,003,100 982,480<br />
Private Service Producing 670,200 713,800 754,600 791,400 811,800 797,500 746,400 743,600 749,900 778,000 755,720<br />
Trade, Transportation & Utilities 234,500 251,200 272,700 289,300 299,000 293,300 270,100 269,000 272,300 278,200 272,960<br />
Wholesale Trade 44,000 45,100 49,900 54,200 56,900 55,000 48,900 48,900 48,800 54,100 50,580<br />
Merchant Wholesalers, Durable Goods 26,900 27,200 30,800 34,100 34,500 33,000 29,100 29,200 29,000 31,400 30,520<br />
Merchant Wholesalers, Nondurable Goods 13,400 13,000 13,800 14,500 16,500 16,600 15,400 15,500 15,500 16,100 15,030<br />
Retail Trade 140,500 151,300 163,100 171,600 173,300 168,100 154,100 153,900 155,000 154,500 158,540<br />
Motor Vehicle & Parts Dealer 22,600 23,700 25,000 25,900 25,300 23,200 18,600 18,700 19,600 20,400 22,300<br />
Automotive Parts, Accessories & Tire Stores 6,500 6,700 6,700 6,800 6,400 6,300 6,000 6,400 6,500 6,500 6,480<br />
Building Material & Garden Equipment Stores 12,500 14,300 15,300 16,200 15,400 13,900 12,800 12,500 12,300 12,300 13,750<br />
Food & Beverage Stores 27,800 28,900 30,800 31,800 33,700 33,300 32,900 32,700 30,700 31,200 31,380<br />
Health & Personal Care Stores 7,500 8,200 7,700 8,300 8,900 9,400 9,000 9,100 9,100 9,500 8,670<br />
Clothing & Clothing Accessories Stores 12,300 12,500 13,500 14,500 16,100 16,200 14,400 15,600 17,100 18,000 15,020<br />
Clothing Stores 9,100 9,200 10,100 11,000 12,400 12,600 11,200 12,300 13,500 14,000 11,540<br />
General Merchandise Stores 28,500 31,200 35,400 38,400 37,700 37,100 35,500 35,500 35,000 35,100 34,940<br />
Department Stores 21,200 23,900 27,800 30,500 29,200 27,900 25,100 24,600 23,800 23,700 25,770<br />
Other General Merchandise Stores 7,300 7,300 7,600 7,900 8,500 9,200 10,400 10,900 11,200 11,400 9,170<br />
Transportation, Warehousing & Utilities 50,000 54,800 59,700 63,500 68,800 70,200 67,100 66,200 68,500 69,600 63,840<br />
Utilities 5,000 5,000 5,300 5,600 5,700 5,900 5,800 5,800 5,800 5,900 5,580<br />
Transportation & Warehousing 45,000 49,800 54,400 57,900 63,100 64,300 61,300 60,400 62,700 63,700 58,260<br />
36<br />
<strong>2012</strong> <strong>Comprehensive</strong> <strong>Annual</strong> <strong>Financial</strong> <strong>Report</strong>
RIVERSIDE-SAN BERNARDINO-ONTARIO MSA (RIVERSIDE AND SAN BERNARDINO COUNTIES) (CONTINUED)<br />
INDUSTRY EMPLOYMENT AND LABOR FORCE<br />
TITLE Jun-03 Jun-04 Jun-05 Jun-06 Jun-07 Jun-08 Jun-09 Jun-10 Jun-11 Jun-12 Average<br />
Truck Transportation 19,000 20,700 23,300 23,100 23,700 22,900 21,400 20,200 21,900 22,900 21,910<br />
General Freight Trucking 12,000 13,900 16,000 16,100 16,800 16,800 16,000 15,500 16,500 17,300 15,690<br />
Couriers & Messengers 6,800 7,400 7,600 8,200 7,900 7,900 7,600 7,000 7,000 7,000 7,440<br />
Warehousing & Storage 6,600 8,300 9,900 12,200 16,100 16,900 17,200 18,300 19,600 20,400 14,550<br />
In<strong>for</strong>mation 13,800 14,000 14,600 15,400 15,500 14,900 15,300 16,100 14,900 14,900 14,940<br />
Publishing Industries (except Internet) 3,400 3,500 3,300 3,400 3,200 3,000 2,400 1,900 1,800 1,900 2,780<br />
Telecommunications 5,600 5,800 6,200 6,300 6,700 7,100 8,200 9,100 8,500 8,200 7,170<br />
<strong>Financial</strong> Activities 42,900 45,500 48,500 52,100 50,200 46,500 42,200 40,900 39,800 38,600 44,720<br />
Finance & Insurance 25,700 27,800 29,800 31,700 30,500 27,500 25,900 25,400 25,300 24,800 27,440<br />
Credit Intermediation & Related Activities 14,900 16,200 17,900 19,000 18,200 16,500 15,300 14,900 14,900 14,700 16,250<br />
Depository Credit Intermediation 8,500 9,300 9,800 10,400 11,000 10,800 10,100 10,100 9,800 9,500 9,930<br />
Nondepository Credit Intermediation 5,000 5,600 6,500 6,800 5,500 4,400 4,000 3,600 4,000 4,200 4,960<br />
Insurance Carriers & Related 8,700 9,600 10,000 10,600 10,300 9,100 8,900 8,800 9,000 9,000 9,400<br />
Insurance Carriers 4,600 5,400 5,500 5,500 5,100 4,200 4,100 4,100 4,100 4,100 4,670<br />
Real Estate & Rental & Leasing 17,200 17,700 18,700 20,400 19,700 19,000 16,300 15,500 14,500 13,800 17,280<br />
Real Estate 11,300 11,800 12,600 13,700 13,000 12,000 10,500 10,400 9,800 9,500 11,460<br />
Professional & Business Services 113,900 127,000 132,700 141,800 145,300 138,200 123,700 123,000 123,300 140,500 130,940<br />
Professional, Scientific & Technical Services 28,400 30,600 34,600 39,300 40,300 39,800 36,700 34,100 34,600 36,900 35,530<br />
Management of Companies & Enterprises 10,900 11,400 11,900 10,800 9,700 9,800 9,000 8,700 8,800 8,800 9,980<br />
Administrative & Support & Waste Services 74,600 85,000 86,200 91,700 95,300 88,600 78,000 80,200 79,900 94,800 85,430<br />
Administrative & Support Services 71,600 81,800 83,500 88,900 92,500 85,700 75,400 77,500 76,900 91,500 82,530<br />
Employment Services 37,500 45,200 46,600 49,600 53,000 46,500 35,500 37,200 35,800 41,700 42,860<br />
Investigation & Security Services 6,100 7,000 7,300 8,000 8,000 8,000 9,600 9,900 10,700 11,300 8,590<br />
Services to Buildings & Dwellings 16,800 16,500 18,000 19,100 18,500 17,300 16,400 16,100 16,000 17,100 17,180<br />
Educational & Health Services 116,600 119,300 120,700 121,800 126,000 131,100 133,500 132,500 136,700 140,300 127,850<br />
Educational Services 13,300 13,900 14,000 13,700 14,300 15,100 15,600 14,900 14,500 14,200 14,350<br />
Colleges, Universities & Professional Schools 5,100 5,300 5,600 4,600 4,600 4,900 5,600 5,400 5,500 5,600 5,220<br />
Health Care & Social Assistance 103,300 105,400 106,700 108,100 111,700 116,000 117,900 117,600 122,200 126,100 113,500<br />
Ambulatory Health Care Services 41,500 42,800 44,500 46,500 46,800 49,000 50,300 51,200 52,900 54,900 48,040<br />
Offices of Physicians 21,400 21,300 20,900 21,700 20,400 21,900 23,000 23,200 24,200 24,900 22,290<br />
Hospitals 29,300 29,100 28,900 28,800 30,100 31,700 32,600 32,300 34,000 34,000 31,080<br />
Nursing & Residential Care Facilities 20,200 19,800 19,600 19,400 20,600 20,700 20,300 20,400 21,400 21,900 20,430<br />
Leisure & Hospitality 109,300 117,600 124,300 128,400 133,800 131,300 124,100 122,900 123,500 125,600 124,080<br />
Arts, Entertainment & Recreation 14,400 14,900 15,800 15,600 16,700 16,100 14,800 14,900 14,200 14,900 15,230<br />
Accommodation & Food Services 94,900 102,700 108,500 112,800 117,100 115,200 109,300 108,000 109,300 110,700 108,850<br />
Accommodation 16,500 18,500 17,900 18,200 17,400 16,300 14,600 13,600 13,900 14,900 16,180<br />
Food Services & Drinking Places 78,400 84,200 90,600 94,600 99,700 98,900 94,700 94,400 95,400 95,800 92,670<br />
Full-Service Restaurants 33,800 35,800 39,400 40,300 41,900 40,900 38,900 39,300 40,300 39,800 39,040<br />
Limited-Service Eating Places 41,400 45,000 48,300 51,300 54,300 54,300 52,500 51,700 51,600 52,700 50,310<br />
Other Services 39,200 39,200 41,100 42,700 42,000 42,200 37,500 39,200 39,400 39,900 40,240<br />
Repair & Maintenance 16,500 16,400 17,000 17,700 15,900 15,400 13,000 12,900 13,000 13,000 15,080<br />
Personal & Laundry Services 8,400 8,400 9,100 9,600 10,300 10,400 9,600 9,800 9,500 9,300 9,440<br />
STATISTICAL SECTION<br />
<strong>2012</strong> <strong>Comprehensive</strong> <strong>Annual</strong> <strong>Financial</strong> <strong>Report</strong><br />
37
STATISTICAL SECTION<br />
RIVERSIDE-SAN BERNARDINO-ONTARIO MSA (RIVERSIDE AND SAN BERNARDINO COUNTIES) (CONTINUED)<br />
INDUSTRY EMPLOYMENT AND LABOR FORCE<br />
TITLE Jun-03 Jun-04 Jun-05 Jun-06 Jun-07 Jun-08 Jun-09 Jun-10 Jun-11 Jun-12 Average<br />
Government 214,100 213,400 220,200 227,300 229,000 233,300 232,800 241,600 230,800 225,100 226,760<br />
Federal Government 17,000 17,000 18,800 19,300 19,500 19,700 20,300 25,000 21,400 20,500 19,850<br />
Department of Defense 5,200 5,300 5,600 5,700 5,600 5,800 6,100 6,300 6,400 6,000 5,800<br />
Federal Government excluding 11,800 11,700 13,200 13,600 13,900 13,900 14,200 18,700 15,000 14,500 14,050<br />
Department of Defense<br />
State & Local Government 197,100 196,400 201,400 208,000 209,500 213,600 212,500 216,600 209,400 204,600 206,910<br />
State Government 27,300 27,000 27,600 27,900 29,300 30,500 30,800 29,900 30,100 29,100 28,950<br />
State Government Education 10,200 9,900 10,100 10,300 10,700 11,100 11,200 10,900 11,600 11,300 10,730<br />
State Government Excluding Education 17,100 17,100 17,500 17,600 18,600 19,400 19,600 19,000 18,500 17,800 18,220<br />
Local Government 169,800 169,400 173,800 180,100 180,200 183,100 181,700 186,700 179,300 175,500 177,960<br />
Local Government Education 100,400 100,200 98,500 99,900 97,100 99,200 99,200 107,100 103,000 100,000 100,460<br />
County 34,100 32,400 32,500 36,000 37,400 37,700 37,500 36,400 35,200 35,000 35,420<br />
City 15,000 15,200 15,500 16,200 17,300 17,900 17,700 16,600 16,200 15,300 16,290<br />
Special Districts plus Indian Tribes 20,300 21,600 27,300 28,000 28,400 28,300 27,300 26,500 24,900 25,200 25,780<br />
Source: CA Employment Development Department Labor Market In<strong>for</strong>mation<br />
38<br />
<strong>2012</strong> <strong>Comprehensive</strong> <strong>Annual</strong> <strong>Financial</strong> <strong>Report</strong>
THE ECONOMY AND ECONOMIC OUTLOOK<br />
After a steady decline in employment in San Bernardino County since 2006, the number of jobs rose in 2011 and continued<br />
to rise into <strong>2012</strong>. Between the high of 2006 and the low of 2010, employment declined by nearly 82,000 jobs. Employment<br />
began to rebound in 2011 and by the first quarter of <strong>2012</strong> had reached 760,600 jobs, an increase of 21,700. Still, over<br />
110,000 San Bernardino County residents report being unemployed as of March <strong>2012</strong>.<br />
Paralleling unemployment trends nationwide, San Bernardino County’s unemployment rate fell in 2011 and continued<br />
falling into early <strong>2012</strong> (according to the latest data available at the time of this report). During the 10-year period from 2002<br />
to <strong>2012</strong>, the unemployment rate in San Bernardino County ranged from a low of 4.8% in 2006 to a high of 14.2% in 2010.<br />
From its high in 2010, the unemployment rate decreased slightly to 13.2% in 2011 and 12.2% as of March <strong>2012</strong>. In March<br />
<strong>2012</strong>, San Bernardino County’s unemployment rate was ranked 25th out of the 58 counties in Cali<strong>for</strong>nia, the same ranking<br />
as in March 2011. San Bernardino County had higher unemployment rates than in the United States as a whole between<br />
2002 and <strong>2012</strong>.<br />
STATISTICAL SECTION<br />
The unemployment rate in the Riverside-San Bernardino-Ontario MSA was 11.3 percent in November <strong>2012</strong>, down from<br />
a revised 11.7 percent in October <strong>2012</strong>, and below the year-ago estimate of 12.4 percent. This compares with an unadjusted<br />
unemployment rate of 9.6 percent <strong>for</strong> Cali<strong>for</strong>nia and 7.4 percent <strong>for</strong> the nation during the same period. The unemployment<br />
rate was 11.5 percent in Riverside County and 11.0 percent in San Bernardino County.<br />
As the economy continues to recover from the Great Recession, San Bernardino County has experienced a slow, but<br />
steady decline in unemployment. In 2011, the county added nearly 2,500 jobs to the local economy with significant activity<br />
in manufacturing and logistics. With the work<strong>for</strong>ce driving corporate relocations and expansions, San Bernardino County<br />
is well positioned with a labor pool of 900,000 and a two million-resident metropolitan area. Other advantages of the region<br />
include newer facilities at lower lease rates than competing markets, superior transportation infrastructure, and access to a<br />
market of 23 million people within three hours of driving. Significant speculative industrial construction activity has returned<br />
to the region, and with trade volumes expected to increase, the economic outlook <strong>for</strong> San Bernardino County is optimistic.<br />
Source: San Bernardino <strong>2012</strong> Community Indicator <strong>Report</strong> and the County of San Bernardino Economic<br />
Development Agency.<br />
<strong>2012</strong> <strong>Comprehensive</strong> <strong>Annual</strong> <strong>Financial</strong> <strong>Report</strong><br />
39
STATISTICAL SECTION<br />
OPERATING INFORMATION<br />
NUMBER OF EMPLOYEES<br />
2003 2004 2005 2006 2007 2008 2009 2010 2011 <strong>2012</strong><br />
Administration 3 3 3 4 4 5 5 5 5 5<br />
Operation 501 470 491 504 494 504 474 473 445 438<br />
Maintenance 109 113 108 116 117 118 118 111 99 102<br />
In<strong>for</strong>mation Technology 6 6 6 6 7 10 10 10 6 6<br />
Marketing 22 24 24 24 22 23 23 24 23 23<br />
Planning 6 9 8 7 7 17* 15 16 17 19<br />
Human Resources 10 10 10 10 10 11 11 11 9 9<br />
Safety & Security 3 3 3 2 2 4 4 4 4 4<br />
Procurement 17 15 21 22 19 21 21 21 17 19<br />
Finance 17 17 17 15 17 16 16 12 12 12<br />
Total 694 670 691 710 699 729 697 687 637 637<br />
*Revised in 2008 to include Integrated Project Management Oversight Employees<br />
Source: Human Resources Department<br />
40<br />
<strong>2012</strong> <strong>Comprehensive</strong> <strong>Annual</strong> <strong>Financial</strong> <strong>Report</strong>
OPERATING INFORMATION (CONTINUED)<br />
OPERATING EXPENSES BY CATEGORY<br />
2003 2004 2005 2006 2007 2008 2009 2010 2011 <strong>2012</strong><br />
Personnel $19,392,752 $19,787,768 $21,093,308 $24,297,509 $25,198,119 $25,639,106 $26,704,109 $26,628,484 $24,869,713 $25,280,131<br />
Materials & Supplies 7,268,910 7,249,581 8,073,124 10,732,723 10,911,136 10,053,655 9,062,296 8,831,959 7,743,557 8,479,014<br />
Casualty & Liability 6,962,241 9,492,396 7,683,447 3,704,840 2,206,571 4,981,889 4,448,557 ,233,360 4,674,142 5,100,830<br />
Purchased Transportation 7,227,663 8,884,853 9,876,923 7,404,173 6,241,231 6,336,702 6,719,510 7,114,073 8,831,959 8,882,227<br />
Depreciation & Other 23,649,799 23,271,495 25,208,047 27,003,593 30,247,884 29,606,847 30,091,084 31,693,482 33,182,921 38,534,224<br />
Total Operating Expenses $64,501,365 $68,686,093 $71,934,849 $73,142,838 $74,804,941 $76,618,199 $77,025,556 $78,501,358 $79,302,292 $86,276,426<br />
Source: Finance Department<br />
OPERATING EXPENSES BY FUNCTION<br />
2003 2004 2005 2006 2007 2008 2009 2010 2011 <strong>2012</strong><br />
Transportation $19,605,284 $19,071,473 $21,794,508 $24,680,219 $25,506,068 $26,163,421 $27,787,511 $28,239,330 $29,168,399 $29,261,593<br />
Maintenance 13,955,552 14,134,065 14,054,738 17,488,081 18,315,985 17,867,594 16,627,719 15,770,795 14,204,780 14,830,016<br />
Risk Management* 6,618,237 9,185,069 7,157,905 3,708,749 2,206,571 4,981,889 4,448,557 4,233,360 4,674,142 5,100,830<br />
Marketing 1,835,971 2,115,129 2,111,795 2,275,828 2,328,273 2,366,484 2,330,561 2,673,847 2,260,166 2,259,488<br />
General Administration 4,900,181 4,847,166 3,402,253 6,510,371 7,341,094 9,569,184 7,451,941 7,226,877 7,835,246 8,052,766<br />
Depreciation & Other** 17,586,140 19,332,191 23,413,650 18,481,808 19,106,950 15,669,627 18,379,268 20,357,148 21,159,558 26,771,733<br />
Total Operating Expenses $64,501,365 $68,685,093 $71,934,849 $73,145,056 $74,804,941 $76,618,199 $77,025,556 $78,501,358 $79,302,292 $86,276,426<br />
*Risk Management consists of casualty and liability costs.<br />
**Depreciation & Other cost consists of depreciation, purchased transportation, leases and rentals, and capital purchases charged to operating.<br />
Source: Finance Department<br />
STATISTICAL SECTION<br />
<strong>2012</strong> <strong>Comprehensive</strong> <strong>Annual</strong> <strong>Financial</strong> <strong>Report</strong><br />
41
STATISTICAL SECTION<br />
OPERATING INFORMATION (CONTINUED)<br />
CAPITAL ASSETS BY FUNCTION<br />
2003 2004 2005 2006 2007 2008 2009 2010 2011 <strong>2012</strong><br />
Fixed route<br />
Buses 187 183 181 181 180 175 173 177 167 179<br />
Paratransit<br />
Paratransit buses 100 101 101 101 101 95 102 101 106 106<br />
Paratransit vans 0 0 0 0 0 6 10 10 10 10<br />
Support vehicles<br />
Vans, cars & trucks 41 43 45 39 31 35 52 49 42 43<br />
Source: Finance Department<br />
42<br />
<strong>2012</strong> <strong>Comprehensive</strong> <strong>Annual</strong> <strong>Financial</strong> <strong>Report</strong>
CONNECTING<br />
OUR<br />
COMMUNITY<br />
OMNITRANS<br />
1700 W Fifth Street<br />
San Bernardino, CA 92411