Chapter 4 Results - etheses Repository
Chapter 4 Results - etheses Repository
Chapter 4 Results - etheses Repository
You also want an ePaper? Increase the reach of your titles
YUMPU automatically turns print PDFs into web optimized ePapers that Google loves.
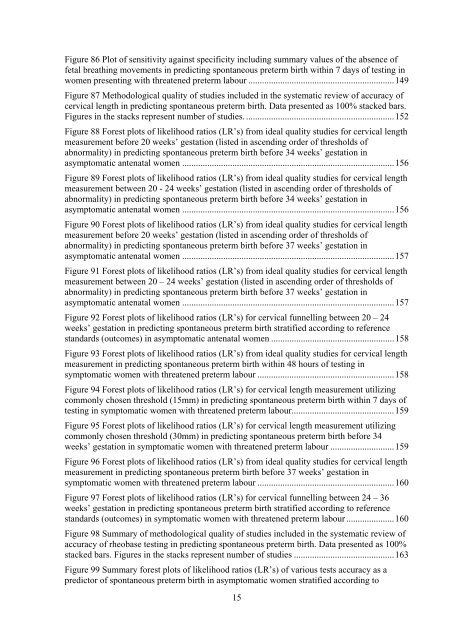
Figure 86 Plot of sensitivity against specificity including summary values of the absence of<br />
fetal breathing movements in predicting spontaneous preterm birth within 7 days of testing in<br />
women presenting with threatened preterm labour ................................................................149<br />
Figure 87 Methodological quality of studies included in the systematic review of accuracy of<br />
cervical length in predicting spontaneous preterm birth. Data presented as 100% stacked bars.<br />
Figures in the stacks represent number of studies. .................................................................152<br />
Figure 88 Forest plots of likelihood ratios (LR’s) from ideal quality studies for cervical length<br />
measurement before 20 weeks’ gestation (listed in ascending order of thresholds of<br />
abnormality) in predicting spontaneous preterm birth before 34 weeks’ gestation in<br />
asymptomatic antenatal women .............................................................................................156<br />
Figure 89 Forest plots of likelihood ratios (LR’s) from ideal quality studies for cervical length<br />
measurement between 20 - 24 weeks’ gestation (listed in ascending order of thresholds of<br />
abnormality) in predicting spontaneous preterm birth before 34 weeks’ gestation in<br />
asymptomatic antenatal women .............................................................................................156<br />
Figure 90 Forest plots of likelihood ratios (LR’s) from ideal quality studies for cervical length<br />
measurement before 20 weeks’ gestation (listed in ascending order of thresholds of<br />
abnormality) in predicting spontaneous preterm birth before 37 weeks’ gestation in<br />
asymptomatic antenatal women .............................................................................................157<br />
Figure 91 Forest plots of likelihood ratios (LR’s) from ideal quality studies for cervical length<br />
measurement between 20 – 24 weeks’ gestation (listed in ascending order of thresholds of<br />
abnormality) in predicting spontaneous preterm birth before 37 weeks’ gestation in<br />
asymptomatic antenatal women .............................................................................................157<br />
Figure 92 Forest plots of likelihood ratios (LR’s) for cervical funnelling between 20 – 24<br />
weeks’ gestation in predicting spontaneous preterm birth stratified according to reference<br />
standards (outcomes) in asymptomatic antenatal women ......................................................158<br />
Figure 93 Forest plots of likelihood ratios (LR’s) from ideal quality studies for cervical length<br />
measurement in predicting spontaneous preterm birth within 48 hours of testing in<br />
symptomatic women with threatened preterm labour ............................................................158<br />
Figure 94 Forest plots of likelihood ratios (LR’s) for cervical length measurement utilizing<br />
commonly chosen threshold (15mm) in predicting spontaneous preterm birth within 7 days of<br />
testing in symptomatic women with threatened preterm labour.............................................159<br />
Figure 95 Forest plots of likelihood ratios (LR’s) for cervical length measurement utilizing<br />
commonly chosen threshold (30mm) in predicting spontaneous preterm birth before 34<br />
weeks’ gestation in symptomatic women with threatened preterm labour ............................159<br />
Figure 96 Forest plots of likelihood ratios (LR’s) from ideal quality studies for cervical length<br />
measurement in predicting spontaneous preterm birth before 37 weeks’ gestation in<br />
symptomatic women with threatened preterm labour ............................................................160<br />
Figure 97 Forest plots of likelihood ratios (LR’s) for cervical funnelling between 24 – 36<br />
weeks’ gestation in predicting spontaneous preterm birth stratified according to reference<br />
standards (outcomes) in symptomatic women with threatened preterm labour .....................160<br />
Figure 98 Summary of methodological quality of studies included in the systematic review of<br />
accuracy of rheobase testing in predicting spontaneous preterm birth. Data presented as 100%<br />
stacked bars. Figures in the stacks represent number of studies ............................................163<br />
Figure 99 Summary forest plots of likelihood ratios (LR’s) of various tests accuracy as a<br />
predictor of spontaneous preterm birth in asymptomatic women stratified according to<br />
15


