Codon Evolution Mechanisms and Models
Codon Evolution Mechanisms and Models
Codon Evolution Mechanisms and Models

You also want an ePaper? Increase the reach of your titles
YUMPU automatically turns print PDFs into web optimized ePapers that Google loves.
� 1<br />
tAI = exp<br />
otot<br />
�<br />
c∈C<br />
oc log w tAI�<br />
c . (13.27)<br />
One drawback of tAI is that it requires information<br />
that may not be known. Computation of<br />
the tAI requires: the codon recognition of tRNA,<br />
the properties of anticodon–codon interaction, the<br />
correct annotation of tRNA genes, <strong>and</strong> a subset of<br />
highly expressed genes (or alternatively a method<br />
to determine optimal codon frequencies). The values<br />
of the anticodon–codon affinity sct may also be<br />
difficult to assign correctly. Expression data is used<br />
to find the best correlation between expression levels<br />
<strong>and</strong> tAI values <strong>and</strong> from this the values for the<br />
possible anticodon–codon binding are derived. For<br />
humans, these values were found to be: G:U=0.41,<br />
I:C=0.28, I:A=0.99, U:G=0.68, L:A=0.89 (dos Reis<br />
et al., 2004). Furthermore, it is unclear if the accuracy<br />
of this information is adequate to give reliable<br />
values of tAI. On the other h<strong>and</strong>, when this<br />
information was available, the index has performed<br />
favourably (Tuller et al., 2007).<br />
13.5.4 Measures based on deviation from an<br />
expected distribution<br />
There is a large group of indices that measure<br />
deviation from the expected distribution of codons.<br />
These indices have the advantage of being easily<br />
understood from a statistical perspective. If the<br />
expected distribution can be estimated <strong>and</strong> a model<br />
formulated, the significance analysis <strong>and</strong> statistical<br />
tests can be performed, lending a big advantage.<br />
13.5.4.1 <strong>Codon</strong>-preference bias measure (CPB)<br />
The codon preference bias (CPB) measures how far<br />
observed codon usage deviates from the theoretical<br />
mean (McLachlan et al., 1984). The CPB is not used<br />
often, perhaps due to the fact the method is quite<br />
theoretical <strong>and</strong> not very straightforward to implement.<br />
Like the P measure, it was used to detect<br />
bona fide coding sequences:<br />
U − U<br />
CPB = . (13.28)<br />
The CPB measures the improbability of codon<br />
usage U, which is the negative log of the probability<br />
of observing a particular codon count vector:<br />
ÛU<br />
MEASURES OF CODON BIAS 199<br />
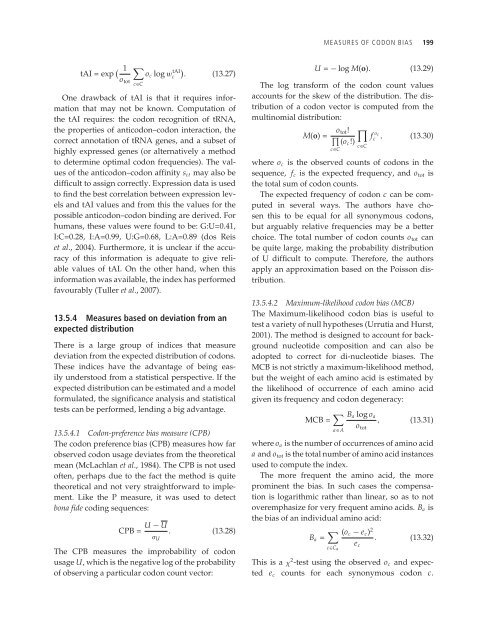
U = − log M(o). (13.29)<br />
The log transform of the codon count values<br />
accounts for the skew of the distribution. The distribution<br />
of a codon vector is computed from the<br />
multinomial distribution:<br />
M(o) = otot! �<br />
�<br />
(oc!)<br />
c∈C<br />
c∈C<br />
f oc<br />
c , (13.30)<br />
where oc is the observed counts of codons in the<br />
sequence, fc is the expected frequency, <strong>and</strong> otot is<br />
the total sum of codon counts.<br />
The expected frequency of codon c can be computed<br />
in several ways. The authors have chosen<br />
this to be equal for all synonymous codons,<br />
but arguably relative frequencies may be a better<br />
choice. The total number of codon counts otot can<br />
be quite large, making the probability distribution<br />
of U difficult to compute. Therefore, the authors<br />
apply an approximation based on the Poisson distribution.<br />
13.5.4.2 Maximum-likelihood codon bias (MCB)<br />
The Maximum-likelihood codon bias is useful to<br />
test a variety of null hypotheses (Urrutia <strong>and</strong> Hurst,<br />
2001). The method is designed to account for background<br />
nucleotide composition <strong>and</strong> can also be<br />
adopted to correct for di-nucleotide biases. The<br />
MCB is not strictly a maximum-likelihood method,<br />
but the weight of each amino acid is estimated by<br />
the likelihood of occurrence of each amino acid<br />
given its frequency <strong>and</strong> codon degeneracy:<br />
MCB = � Ba log oa<br />
, (13.31)<br />
a∈A<br />
otot<br />
where oa is the number of occurrences of amino acid<br />
a <strong>and</strong> otot is the total number of amino acid instances<br />
used to compute the index.<br />
The more frequent the amino acid, the more<br />
prominent the bias. In such cases the compensation<br />
is logarithmic rather than linear, so as to not<br />
overemphasize for very frequent amino acids. Ba is<br />
the bias of an individual amino acid:<br />
Ba = � (oc − ec) 2<br />
. (13.32)<br />
c∈Ca<br />
This is a ˜ 2 -test using the observed oc <strong>and</strong> expected<br />
ec counts for each synonymous codon c.<br />
ec