Codon Evolution Mechanisms and Models
Codon Evolution Mechanisms and Models
Codon Evolution Mechanisms and Models
You also want an ePaper? Increase the reach of your titles
YUMPU automatically turns print PDFs into web optimized ePapers that Google loves.
log mRNA<br />
log Protein<br />
log k s<br />
3<br />
2<br />
1<br />
0<br />
–2<br />
14<br />
12<br />
10<br />
4 corr: 0.4970<br />
8<br />
6<br />
corr: 0.4920<br />
4<br />
18 corr: 0.1974<br />
14<br />
10<br />
8<br />
6<br />
0.2 0.4 0.6 0.8<br />
CAI<br />
COMPARISONS USING BIOLOGICAL DATA 211<br />
corr: 0.5167 corr: 0.5204 corr: 0.5245 corr: 0.3682 corr: 0.4506<br />
corr: 0.5198 corr: 0.4873 corr: 0.4842 corr: 0.3659 corr: 0.4374<br />
corr: 0.2274<br />
0.3 0.4 0.5 0.6 0.7 0.3 0.5 0.7 0.9 0.2 0.2 0.6<br />
tAI<br />
corr: 0.2234<br />
Fop<br />
corr: 0.2279<br />
CBI<br />
corr: 0.1824<br />
30 40 50 600.0<br />
0.2 0.4<br />
Nc<br />
corr: 0.2351<br />
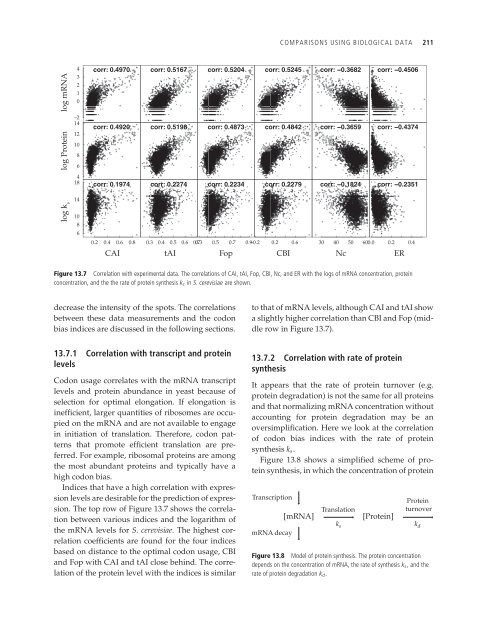
Figure 13.7 Correlation with experimental data. The correlations of CAI, tAI, Fop, CBI, Nc, <strong>and</strong> ER with the logs of mRNA concentration, protein<br />
concentration, <strong>and</strong> the the rate of protein synthesis ks in S. cerevisiae are shown.<br />
decrease the intensity of the spots. The correlations<br />
between these data measurements <strong>and</strong> the codon<br />
bias indices are discussed in the following sections.<br />
13.7.1 Correlation with transcript <strong>and</strong> protein<br />
levels<br />
<strong>Codon</strong> usage correlates with the mRNA transcript<br />
levels <strong>and</strong> protein abundance in yeast because of<br />
selection for optimal elongation. If elongation is<br />
inefficient, larger quantities of ribosomes are occupied<br />
on the mRNA <strong>and</strong> are not available to engage<br />
in initiation of translation. Therefore, codon patterns<br />
that promote efficient translation are preferred.<br />
For example, ribosomal proteins are among<br />
the most abundant proteins <strong>and</strong> typically have a<br />
high codon bias.<br />
Indices that have a high correlation with expression<br />
levels are desirable for the prediction of expression.<br />
The top row of Figure 13.7 shows the correlation<br />
between various indices <strong>and</strong> the logarithm of<br />
the mRNA levels for S. cerevisiae. The highest correlation<br />
coefficients are found for the four indices<br />
based on distance to the optimal codon usage, CBI<br />
<strong>and</strong> Fop with CAI <strong>and</strong> tAI close behind. The correlation<br />
of the protein level with the indices is similar<br />
ER<br />
to that of mRNA levels, although CAI <strong>and</strong> tAI show<br />
a slightly higher correlation than CBI <strong>and</strong> Fop (middle<br />
row in Figure 13.7).<br />
13.7.2 Correlation with rate of protein<br />
synthesis<br />
It appears that the rate of protein turnover (e.g.<br />
protein degradation) is not the same for all proteins<br />
<strong>and</strong> that normalizing mRNA concentration without<br />
accounting for protein degradation may be an<br />
oversimplification. Here we look at the correlation<br />
of codon bias indices with the rate of protein<br />
synthesis ks.<br />
Figure 13.8 shows a simplified scheme of protein<br />
synthesis, in which the concentration of protein<br />
Transcription<br />
Translation<br />
[mRNA] [Protein]<br />
mRNA decay<br />
k s<br />
Protein<br />
turnover<br />
Figure 13.8 Model of protein synthesis. The protein concentration<br />
depends on the concentration of mRNA, the rate of synthesis ks,<strong>and</strong>the<br />
rate of protein degradation kd.<br />
k d


