Codon Evolution Mechanisms and Models
Codon Evolution Mechanisms and Models
Codon Evolution Mechanisms and Models

Create successful ePaper yourself
Turn your PDF publications into a flip-book with our unique Google optimized e-Paper software.
(a) 2<br />
(b)<br />
Normalized mean<br />
1<br />
0<br />
−1<br />
−2<br />
0.0 0.2 0.4 0.6 0.8 1.0<br />
Degree of codon discrepancy<br />
CAI<br />
Fop<br />
CBI<br />
Nc<br />
log CV<br />
4<br />
2<br />
0<br />
−2<br />
−4<br />
DEPENDENCIES OF MEASURES 209<br />
0.0 0.2 0.4 0.6 0.8 1.0<br />
Degree of codon discrepancy<br />
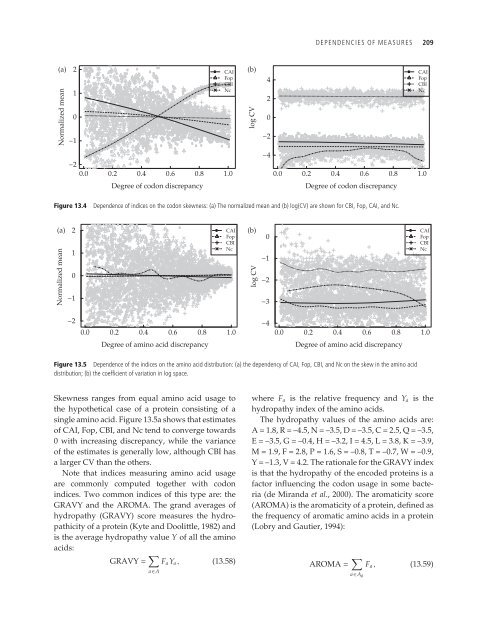
Figure 13.4 Dependence of indices on the codon skewness: (a) The normalized mean <strong>and</strong> (b) log(CV) are shown for CBI, Fop, CAI, <strong>and</strong> Nc.<br />
(a) 2<br />
CAI (b)<br />
Normalized mean<br />
1<br />
0<br />
−1<br />
−2<br />
0.0 0.2 0.4 0.6 0.8 1.0<br />
Degree of amino acid discrepancy<br />
Fop<br />
CBI<br />
Nc<br />
log CV<br />
0<br />
−1<br />
−2<br />
−3<br />
−4<br />
CAI<br />
Fop<br />
CBI<br />
Nc<br />
0.0 0.2 0.4 0.6 0.8 1.0<br />
Degree of amino acid discrepancy<br />
Figure 13.5 Dependence of the indices on the amino acid distribution: (a) the dependency of CAI, Fop, CBI, <strong>and</strong> Nc on the skew in the amino acid<br />
distribution; (b) the coefficient of variation in log space.<br />
Skewness ranges from equal amino acid usage to<br />
the hypothetical case of a protein consisting of a<br />
single amino acid. Figure 13.5a shows that estimates<br />
of CAI, Fop, CBI, <strong>and</strong> Nc tend to converge towards<br />
0 with increasing discrepancy, while the variance<br />
of the estimates is generally low, although CBI has<br />
a larger CV than the others.<br />
Note that indices measuring amino acid usage<br />
are commonly computed together with codon<br />
indices. Two common indices of this type are: the<br />
GRAVY <strong>and</strong> the AROMA. The gr<strong>and</strong> averages of<br />
hydropathy (GRAVY) score measures the hydropathicity<br />
of a protein (Kyte <strong>and</strong> Doolittle, 1982) <strong>and</strong><br />
is the average hydropathy value Y of all the amino<br />
acids:<br />
GRAVY = �<br />
Fa Ya, (13.58)<br />
a∈A<br />
CAI<br />
Fop<br />
CBI<br />
Nc<br />
where Fa is the relative frequency <strong>and</strong> Ya is the<br />
hydropathy index of the amino acids.<br />
The hydropathy values of the amino acids are:<br />
A = 1.8, R = –4.5, N = –3.5, D = –3.5, C = 2.5, Q = –3.5,<br />
E = –3.5, G = –0.4, H = –3.2, I = 4.5, L = 3.8, K = –3.9,<br />
M = 1.9, F = 2.8, P = 1.6, S = –0.8, T = –0.7, W = –0.9,<br />
Y = –1.3, V = 4.2. The rationale for the GRAVY index<br />
is that the hydropathy of the encoded proteins is a<br />
factor influencing the codon usage in some bacteria<br />
(de Mir<strong>and</strong>a et al., 2000). The aromaticity score<br />
(AROMA) is the aromaticity of a protein, defined as<br />
the frequency of aromatic amino acids in a protein<br />
(Lobry <strong>and</strong> Gautier, 1994):<br />
AROMA = �<br />
Fa, (13.59)<br />
a∈Aˆ