Codon Evolution Mechanisms and Models
Codon Evolution Mechanisms and Models
Codon Evolution Mechanisms and Models

Create successful ePaper yourself
Turn your PDF publications into a flip-book with our unique Google optimized e-Paper software.
(a)<br />
1.0<br />
CAI<br />
Fop<br />
(b)<br />
1.0<br />
0.5<br />
CBI<br />
Nc 0.8<br />
Normalized mean<br />
0.0<br />
−0.5<br />
−1.0<br />
0 20 40 60 80 100<br />
GC content<br />
Coefficient of variation<br />
0.6<br />
0.4<br />
0.2<br />
0.0<br />
DEPENDENCIES OF MEASURES 207<br />
0 20 40 60 80 100<br />
GC content<br />
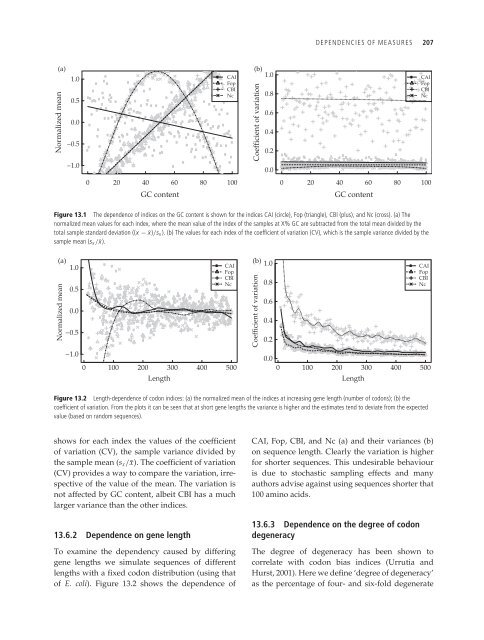
Figure 13.1 The dependence of indices on the GC content is shown for the indices CAI (circle), Fop (triangle), CBI (plus), <strong>and</strong> Nc (cross). (a) The<br />
normalized mean values for each index, where the mean value of the index of the samples at X% GC are subtracted from the total mean divided by the<br />
total sample st<strong>and</strong>ard deviation ((x − ¯x)/sx ). (b) The values for each index of the coefficient of variation (CV), which is the sample variance divided by the<br />
sample mean (sx / ¯x).<br />
(a)<br />
1.0<br />
CAI<br />
Fop<br />
(b) 1.0<br />
0.5<br />
CBI<br />
Nc 0.8<br />
Normalized mean<br />
0.0<br />
−0.5<br />
−1.0<br />
0 100 200 300 400 500<br />
Length<br />
Coefficient of variation<br />
0.6<br />
0.4<br />
0.2<br />
CAI<br />
Fop<br />
CBI<br />
Nc<br />
0.0<br />
0 100 200 300 400 500<br />
Length<br />
Figure 13.2 Length-dependence of codon indices: (a) the normalized mean of the indices at increasing gene length (number of codons); (b) the<br />
coefficient of variation. From the plots it can be seen that at short gene lengths the variance is higher <strong>and</strong> the estimates tend to deviate from the expected<br />
value (based on r<strong>and</strong>om sequences).<br />
shows for each index the values of the coefficient<br />
of variation (CV), the sample variance divided by<br />
the sample mean (sx/¯x). The coefficient of variation<br />
(CV) provides a way to compare the variation, irrespective<br />
of the value of the mean. The variation is<br />
not affected by GC content, albeit CBI has a much<br />
larger variance than the other indices.<br />
13.6.2 Dependence on gene length<br />
To examine the dependency caused by differing<br />
gene lengths we simulate sequences of different<br />
lengths with a fixed codon distribution (using that<br />
of E. coli). Figure 13.2 shows the dependence of<br />
CAI<br />
Fop<br />
CBI<br />
Nc<br />
CAI, Fop, CBI, <strong>and</strong> Nc (a) <strong>and</strong> their variances (b)<br />
on sequence length. Clearly the variation is higher<br />
for shorter sequences. This undesirable behaviour<br />
is due to stochastic sampling effects <strong>and</strong> many<br />
authors advise against using sequences shorter that<br />
100 amino acids.<br />
13.6.3 Dependence on the degree of codon<br />
degeneracy<br />
The degree of degeneracy has been shown to<br />
correlate with codon bias indices (Urrutia <strong>and</strong><br />
Hurst, 2001). Here we define ‘degree of degeneracy’<br />
as the percentage of four- <strong>and</strong> six-fold degenerate