Article - MyGeologyPage - University of California, Davis
Article - MyGeologyPage - University of California, Davis
Article - MyGeologyPage - University of California, Davis

You also want an ePaper? Increase the reach of your titles
YUMPU automatically turns print PDFs into web optimized ePapers that Google loves.
<strong>Article</strong><br />
Volume 12, Number 12<br />
28 December 2011<br />
Q12017, doi:10.1029/2011GC003639<br />
ISSN: 1525‐2027<br />
Environmental and chemical controls on palagonitization<br />
Bruce D. Pauly, Peter Schiffman, and Robert A. Zierenberg<br />
Department <strong>of</strong> Geology, <strong>University</strong> <strong>of</strong> <strong>California</strong>, 1 Shields Avenue, <strong>Davis</strong>,<br />
<strong>California</strong> 95616, USA (bdpauly@ucdavis.edu)<br />
David A. Clague<br />
Monterey Bay Aquarium Research Institute, 7700 Sandholdt Road, Moss Landing,<br />
<strong>California</strong> 95039, USA<br />
[1] Palagonitized sideromelane from submarine volcaniclastic, seafloor volcanic, marine phreatomagmatic,<br />
lacustine phreatomagmatic, and subglacial volcanic settings was investigated using in situ microanalysis<br />
to test if palagonite composition and texture are related to depositional environment. Palagonitization extent<br />
varies linearly and inversely with original sample porosity, suggesting that porosity is a controlling factor <strong>of</strong><br />
palagonitization. Water absorbance <strong>of</strong> reflected infrared light varies linearly with water content derived from<br />
electron microprobe totals. Palagonite water content has a linear, inverse relationship to palagonitization<br />
extent. REEs are immobile during palagonitization, so they can be used to construct isocon diagrams<br />
for estimating major‐element concentration changes. Major‐element and overall mass changes during<br />
palagonitization vary widely (particularly for FeO and TiO 2 ) and indicate that palagonitization cannot be<br />
an isovolumetric process. These parameters depend strongly on original sideromelane composition, thus<br />
requiring composition to be taken into account when performing global oceanic cation flux calculations.<br />
Subalkaline sideromelane dissolves much more rapidly than alkaline sideromelane during palagonitization.<br />
Two styles <strong>of</strong> palagonitization, burial‐diagenesis (relatively long‐duration, low water/rock; passive fluid<br />
circulation) and hydrothermal (relatively short‐duration, high water/rock; hydrothermal fluid circulation),<br />
are recognized. Observed palagonite REE concentration gradients indicate that sideromelane dissolution<br />
must continue in the zone behind the advancing palagonitization front. MgO was found to be highly mobile<br />
during palagonitization. Observed palagonite MgO gradients are not developed during sideromelane dissolution,<br />
but instead record initiation <strong>of</strong> syn‐ and/or post‐palagonitization conversion <strong>of</strong> the gel‐palagonite<br />
layer to a phyllosillicate layer, consistent with evolution <strong>of</strong> sideromelane alteration layers toward equilibrium<br />
with the solution.<br />
Components: 13,000 words, 14 figures, 7 tables.<br />
Keywords: alteration layers; equilibrium; glass dissolution; mass change; palagonitization; water content.<br />
Index Terms: 1039 Geochemistry: Alteration and weathering processes (3617); 8424 Volcanology: Hydrothermal systems<br />
(0450, 1034, 3017, 3616, 4832, 8135); 8427 Volcanology: Subaqueous volcanism.<br />
Received 28 June 2011; Revised 27 October 2011; Accepted 29 October 2011; Published 28 December 2011.<br />
Pauly, B. D., P. Schiffman, R. A. Zierenberg, and D. A. Clague (2011), Environmental and chemical controls on<br />
palagonitization, Geochem. Geophys. Geosyst., 12, Q12017, doi:10.1029/2011GC003639.<br />
Copyright 2011 by the American Geophysical Union 1 <strong>of</strong> 26
Geochemistry<br />
Geophysics<br />
Geosystems G 3 PAULY ET AL.: GEOCHEMICAL CONTROLS ON PALAGONITIZATION 10.1029/2011GC003639<br />
1. Introduction<br />
[2] Palagonitization entails the hydrolytic alteration<br />
<strong>of</strong> sideromelane whereby basaltic glass is dissolved<br />
and hydrated, producing palagonite and various<br />
authigenic minerals, notably zeolites and smectites<br />
[Fisher and Schmincke, 1984; Stroncik and<br />
Schmincke, 2001; Walton and Schiffman, 2003].<br />
Palagonitization is a globally significant geochemical<br />
process. In spite <strong>of</strong> important implications to our<br />
understanding <strong>of</strong> nuclear waste storage [Crovisier<br />
et al., 2003], volcanic edifice stability [Schiffman<br />
et al., 2006], and Martian crustal evolution<br />
[Bishop et al., 2002], the controls and mechanism <strong>of</strong><br />
the palagonitization reaction remain poorly understood.<br />
Palagonite generally is considered to be the<br />
initial, possibly metastable, replacement product <strong>of</strong><br />
sideromelane during palagonitization, with the final<br />
replacement product being smectite [Staudigel and<br />
Hart, 1983; Thorseth et al., 1991; Stroncik and<br />
Schmincke, 2001]. In this study, we follow Walton<br />
and Schiffman [2003] and consider palagonitization<br />
to be the process <strong>of</strong> forming palagonitized<br />
sideromelane, which herein will be referred to simply<br />
as palagonite. We use the term palagonite to<br />
describe the gel‐like, yellow to orange (as viewed in<br />
plane‐polarized light), isotropic replacement product<br />
<strong>of</strong> sideromelane; this is the practical, comprehensive<br />
sense as defined by Stroncik and Schmincke<br />
[2001].<br />
[3] Published major‐element compositional data on<br />
palagonites from different localities, examples <strong>of</strong><br />
which can be found in the works by Honnorez [1967,<br />
1972], Hay and Iijima [1968a], Staudigel and Hart<br />
[1983], Furnes [1984], Bednarz and Schmincke<br />
[1989], Jercinovic et al. [1990], Crovisier et al.<br />
[1992], Daux et al. [1994], Stroncik and Schmincke<br />
[2001], and Walton and Schiffman [2003], show<br />
substantial variation. The cause(s) <strong>of</strong> these compositional<br />
variations remain poorly understood. Although<br />
there is general agreement among previous workers<br />
that dissolution (congruent or incongruent) and<br />
hydration are responsible for the creation <strong>of</strong> palagonite<br />
[Crovisier et al.,1987;Daux et al., 1994; Le Gal<br />
et al., 1999], the mechanism(s) by which the transformation<br />
occurs is not completely understood.<br />
Stroncik and Schmincke [2001] proposed that palagonitization<br />
consists <strong>of</strong> two different reaction stages,<br />
the first being congruent dissolution <strong>of</strong> glass and<br />
simultaneous precipitation <strong>of</strong> palagonite, the second<br />
being an aging process during which palagonite<br />
reacts with fluid and crystallizes to smectite.<br />
Crovisier et al. [2003] summarizes results also<br />
suggesting that palagonitization is not a steady state<br />
process because glass dissolution rates decrease by<br />
up to 5 orders <strong>of</strong> magnitude as the palagonite layer<br />
thickens.<br />
[4] The purpose <strong>of</strong> this study was to investigate<br />
whether palagonitization and the resulting textural<br />
and compositional properties <strong>of</strong> palagonites are<br />
controlled by characteristics <strong>of</strong> the starting materials<br />
and <strong>of</strong> the palagonitization environment. Selected<br />
palagonitized samples from various geologic settings<br />
and localities were systematically analyzed by<br />
optical petrography, electron microprobe analysis<br />
(EPMA), and laser ablation inductively coupled<br />
mass spectroscopy (LA‐ICPMS). An advantage <strong>of</strong><br />
these techniques is the ability to perform in situ<br />
analyses <strong>of</strong> thin section samples <strong>of</strong> palagonite and<br />
adjacent sideromelane in their petrogenetic context.<br />
The widely used assumption that palagonite water<br />
content equals the difference between 100% and the<br />
total <strong>of</strong> the analyzed oxides in EPMA compositional<br />
analyses was tested using in situ reflected‐light<br />
Fourier transform infrared spectroscopy (RL‐FTIR).<br />
[5] Basaltic glass alteration textures currently are<br />
categorized as either biotic or abiotic; Staudigel et al.<br />
[2008] provided a recent review. Thorseth et al.<br />
[1992] suggested a mechanism for the formation <strong>of</strong><br />
bioalteration features in volcanic glass whereby<br />
microbes dissolve glass by changing the local contact<br />
area pH. Biotic versus abiotic glass alteration can be<br />
differentiated based on petrographically observable<br />
microtextures [Furnes et al., 2002, 2007]. Bioalteration<br />
textures generally fall into two categories: granular<br />
and tubular (tunneling) [Furnes et al., 2001;<br />
Cockell and Herrera, 2008]. Staudigel et al. [2008]<br />
provide detailed documentation <strong>of</strong> these textures.<br />
Many recent studies [Furnes et al.,2001;Walton and<br />
Schiffman, 2003; Staudigel and Furnes, 2004;<br />
Staudigel et al., 2004, 2006; Walton, 2008] document<br />
evidence that microorganisms play a role in palagonitization,<br />
particularly in the enhancement <strong>of</strong> sideromelane<br />
dissolution and involvement in precipitation<br />
<strong>of</strong> authigenic phases. Because this study focuses on<br />
abiotic palagonitization, samples with visual biotically<br />
mediated textures were excluded.<br />
2. Sample Selection<br />
[6] The sampling strategy for this study was designed<br />
to test if observed variations in the petrographic and<br />
chemical data are related to varying protolith and/<br />
or palagonitization environment. Localities were<br />
chosen based on prior knowledge <strong>of</strong> the geologic<br />
history and therefore likely conditions attending<br />
sample palagonitization. All <strong>of</strong> the samples have<br />
2<strong>of</strong>26
Geochemistry<br />
Geophysics<br />
Geosystems G 3 PAULY ET AL.: GEOCHEMICAL CONTROLS ON PALAGONITIZATION 10.1029/2011GC003639<br />
undergone palgonitization, and were classified by<br />
similarity <strong>of</strong> geologic setting into 5 environmental<br />
groups. Samples in the Submarine Volcaniclastic<br />
group consist <strong>of</strong> hyaloclastite that was deposited and<br />
subsequently buried in marine environments. The<br />
Seafloor Volcanic samples are from surficial hyaloclastite<br />
deposits or surficial lava flows located near<br />
the submarine edifice where they formed. Samples in<br />
the Marine Phreatomagmatic and Lacustrine Phreatomagmatic<br />
groups consist <strong>of</strong> hyaloclastite formed at<br />
tuff rings and tuff cones. The Subglacial Volcanic<br />
samples are from hyaloclastite deposits formed during<br />
eruptions <strong>of</strong> volcanoes beneath Icelandic glaciers.<br />
Table 1 lists the location, nomenclature, geologic<br />
setting, type, age, and reference(s) for each <strong>of</strong> the<br />
studied samples by environment group. The samples<br />
in this study are <strong>of</strong> Neogene and Quaternary age, the<br />
youngest being the two Surtsey samples, which were<br />
deposited between 1963 and 1968.<br />
3. Analytical Methods<br />
3.1. Petrography<br />
[7] One thin section <strong>of</strong> each sample was pointcounted<br />
using a mechanical stage with 1 mm gridspacing.<br />
The number <strong>of</strong> points counted per sample<br />
varied as a function <strong>of</strong> the available thin‐section<br />
area and ranged from 240 to 464. Point‐counting<br />
categories were sideromelane, lithic and crystal<br />
clasts, palagonite and smectite, undifferentiated<br />
zeolite, pore space, and “other” as necessary (clastic<br />
matrix, non‐replacive smectite, etc.). Minus‐cement<br />
porosity [Walton and Schiffman, 2003], an estimate<br />
<strong>of</strong> initial (depositional) porosity, was determined for<br />
each sample. For this study, minus‐cement porosity<br />
was defined as % pore space + % zeolite − % lithic<br />
and crystal clasts. This parameter can range from<br />
0 to 100 percent; lower values indicate lower initial<br />
porosity and vice versa. Palagonitization extent,<br />
defined here as % zeolite + % palagonite + %<br />
smectite (calculated as lithic and crystal clast and<br />
pore space free) was also calculated for each sample.<br />
This parameter can range from 0 to 100 percent;<br />
higher values indicate a greater extent <strong>of</strong> palagonitization<br />
and vice versa.<br />
3.2. Reflected Light Infrared Spectroscopy<br />
(RL‐FTIR)<br />
[8] Four thin‐section samples, with widely differing<br />
inferred palagonite water contents (based<br />
on electron microprobe compositional data) were<br />
selected for analysis by FTIR‐reflectance methods<br />
[Grzechnik et al., 1996; Moore et al., 2000] using a<br />
Nicolet Magna 750 FTIR spectrometer, fitted with<br />
a SpectraTech Analytical‐IR microscope, at the<br />
U.S. Geological Survey in Menlo Park, CA. The<br />
reflectance spectrum for each sample consisted <strong>of</strong><br />
250 scans performed over the 6000–650 cm −1<br />
range using a 40 mm aperture. Background reflectance<br />
was measured using these same parameters<br />
and a polished gold target. The spectra have a<br />
resolution <strong>of</strong> 32 cm −1 and were corrected to provide<br />
a flat baseline, followed by a Kramers‐Kronig<br />
transformation between 4000 and 2000 wave numbers.<br />
All data collection and transformations were<br />
undertaken with Omnic® s<strong>of</strong>tware provided with<br />
the Nicolet FTIR spectrometer. The Kramers‐<br />
Kronig absorbance due to total water was determined<br />
by measuring the peak height at 3500 cm −1 ,<br />
but this indicates relative sample water content only,<br />
since RL‐FTIR calibration standards for palagonite<br />
water content are not available.<br />
3.3. Electron Probe Microanalysis (EPMA)<br />
[9] Palagonite and sideromelane major‐element<br />
composition was analyzed using a Cameca SX‐100<br />
electron microprobe at the <strong>University</strong> <strong>of</strong> <strong>California</strong>,<br />
<strong>Davis</strong>. Prior to analysis, a ∼250 Å‐thick conductive<br />
carbon coating was applied to the sample thin sections.<br />
All analyses were performed using 15 KeV<br />
accelerating voltage. Sideromelane was analyzed<br />
using a 10 mm rastered beam and 10 nA current.<br />
Elemental thermal stability (particularly <strong>of</strong> Na) in<br />
palagonites as a function <strong>of</strong> current and raster size<br />
was investigated; optimal beam settings for palagonite<br />
analyses were 5 mm raster size and 2 nA current.<br />
Peaks and backgrounds for all analyses were typically<br />
counted for 10 s, and standard ZAF correction<br />
techniques [Schiffman and Roeske, 2002] were used<br />
to convert net intensities relative to oxide and silicate<br />
calibration standards to concentrations. Two types<br />
<strong>of</strong> analyses were performed. Palagonite <strong>of</strong> all<br />
samples was initially analyzed at several spots<br />
roughly in the centers <strong>of</strong> the rinds; adjacent sideromelane<br />
spot analyses were also performed. Also,<br />
for several <strong>of</strong> the samples with rinds <strong>of</strong> sufficient<br />
thickness, spot analyses were performed at a uniform<br />
spacing along a traverse starting at the outer<br />
edge <strong>of</strong> the palagonitized rind, moving inward toward<br />
and perpendicular to the sideromelane contact, continuing<br />
across the contact, and ending with at least<br />
one analysis in sideromelane. The number <strong>of</strong> palagonite<br />
spot analyses possible for each traverse was a<br />
function <strong>of</strong> the rastered beam size and the particular<br />
sample’s palagonitized rind thickness.<br />
3<strong>of</strong>26
Geochemistry<br />
Geophysics<br />
Geosystems G 3 PAULY ET AL.: GEOCHEMICAL CONTROLS ON PALAGONITIZATION 10.1029/2011GC003639<br />
Table 1. Sample Geologic Information and Reference(s)<br />
ENVIRONMENT GROUP<br />
Sample (Nomenclature for This Sudy) [Location] Geologic Setting Sample Setting (Rock Type) Age Reference(s)<br />
SUBMARINE VOLCANICLASTIC<br />
Hawaii Scientific Drilling Project<br />
(HSDP)<br />
[Big Island <strong>of</strong> Hawaii] (hyaloclastite)<br />
submerged volcano flank drillcore Pleistocene Walton and Schiffman [2003];<br />
Garcia et al. [2007]<br />
St. <strong>of</strong> Hawaii Geothermal Hole #1<br />
(SOH‐1)<br />
[Big Island <strong>of</strong> Hawaii] (hyaloclastite)<br />
submerged volcano flank drillcore Pleistocene Novak and Evans [1991];<br />
Trusdell et al. [1999]<br />
Palagonia submerged lava flows surface (uplifted) Miocene–Early Pliocene Honnorez [1967, 1972]<br />
[Acqua Amara, Palagonia, Sicily] (hyaloclastite)<br />
Hilina Bench volcaniclastic basin submarine surface Pleistocene Lipman et al. [2002, 2006];<br />
Coombs et al. [2006];<br />
Kimura et al. [2006]<br />
[Offshore, Big Island <strong>of</strong> Hawaii] (volcaniclastic hyaloclastite)<br />
SEAFLOOR VOLCANIC<br />
Davidson seamount submarine push-core 14.8–9.8 Ma <strong>Davis</strong> et al. [2002];<br />
<strong>Davis</strong> and Clague [2003];<br />
Clague et al. [2009]<br />
[Davidson Seamount, Pacific Ocean] (flow breccia)<br />
North Arch volcanic field submarine surface Pliocene–Pleistocene Clague et al. [1990, 2002];<br />
<strong>Davis</strong> and Clague [2006]<br />
[North Arch volcanic field,<br />
<strong>of</strong>fshore Hawaii]<br />
(flow margin; Mn oxide‐encrusted)<br />
O’ahu cone submarine surface 510 Ka Clague et al. [2006]<br />
[O’ahu, northeast <strong>of</strong>fshore flank] (hyaloclastite)<br />
MARINE PHREATOMAGMATIC<br />
Diamond Head tuff ring subaerial surface 360 Ka Winchell [1947];<br />
Clague et al. [2006]<br />
[O’ahu] (hyaloclastite)<br />
Surtsey (less palagonitized sample) tuff cone subaerial surface 1963 AD Thorarinsson et al. [1964];<br />
Jakobsson [1972, 1978];<br />
[<strong>of</strong>fshore Iceland] (hyaloclastite) Jakobsson and Moore [1986];<br />
Jakobsson et al. [2000]<br />
4<strong>of</strong>26
Geochemistry<br />
Geophysics<br />
Geosystems G 3 PAULY ET AL.: GEOCHEMICAL CONTROLS ON PALAGONITIZATION 10.1029/2011GC003639<br />
Table 1. (continued)<br />
ENVIRONMENT GROUP<br />
Sample (Nomenclature for This Sudy) [Location] Geologic Setting Sample Setting (Rock Type) Age Reference(s)<br />
Surtsey (more palagonitized sample) tuff cone subaerial surface 1963 AD Thorarinsson et al. [1964];<br />
Jakobsson [1972, 1978];<br />
[<strong>of</strong>fshore Iceland] (hyaloclastite) Jakobsson and Moore [1986];<br />
Jakobsson et al. [2000]<br />
Heimaklettur tuff cone subaerial surface approx. Nine Ka Mattsson and Höskuldsson [2003]<br />
[Westman Islands, Iceland] (hyaloclastite)<br />
LACUSTRINE PHREATOMAGMATIC<br />
Black Point tuff cone subaerial surface 13.61 Ka Benson et al. [1998]<br />
[Mono Lake, eastern <strong>California</strong>] (hyaloclastite)<br />
Pahvant Butte tuff cone subaerial surface 15.3 Ka Oviatt and Nash [1989];<br />
White [1996, 2001]<br />
[South‐central Utah] (hyaloclastite)<br />
Fort Rock tuff ring subaerial surface 100–50 Ka Heiken et al. [1981];<br />
Jensen [1995]<br />
[Southeastern Oregon] (hyaloclastite)<br />
SUBGLACIAL VOLCANIC<br />
Mosfell (less palagonitized sample) tuya subaerial surface 400–500 Ka H. Franzson (personal<br />
communication, 2010)<br />
[Iceland] (Grimsnes district, Iceland) (hyaloclastite)<br />
Mosfell (more palagonitized sample) tuya subaerial surface 400–500 Ka H. Franzson (personal<br />
communication, 2010)<br />
[Iceland] (Grimsnes district, Iceland) (hyaloclaastite)<br />
Ingólfsfjall tuya subaerial surface approx. One Ma Saemundsson et al. [2010]<br />
[Iceland] (hyaloclastite)<br />
5<strong>of</strong>26
Geochemistry<br />
Geophysics<br />
Geosystems G 3 PAULY ET AL.: GEOCHEMICAL CONTROLS ON PALAGONITIZATION 10.1029/2011GC003639<br />
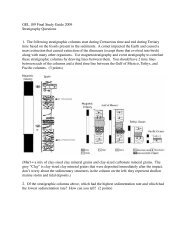
Figure 1. Thin section photomicrograph (PPL) <strong>of</strong> HSDP sample R0777–17.4 (hyaloclastite; submarine volcaniclastic<br />
group). Note relatively thick, smooth, gel‐like palagonite rinds developed on sideromelane grains, abundant zeolites<br />
(phillipsite and chabazite), and evidence <strong>of</strong> original porosity reduction due to burial such as abundant fractured<br />
grains and intergranular contacts.<br />
3.4. Laser Ablation Mass Spectroscopy<br />
(LA‐ICPMS)<br />
[10] Trace element analyses were performed using<br />
Laser Ablation‐Inductively Coupled Mass Spectrometry<br />
(LA‐ICPMS) at the <strong>University</strong> <strong>of</strong><br />
<strong>California</strong>‐<strong>Davis</strong> Interdisciplinary Center for Plasma<br />
Mass Spectrometry. A New Wave Research Nd:<br />
YAG 213 nm laser (model UP‐213), equipped with<br />
an optical microscope, was used for laser ablation.<br />
Helium gas was used to carry ablated material to an<br />
Agilent Technologies inductively coupled mass<br />
spectrometer (model 7500a) equipped with a quadrupole<br />
mass analyzer and an electron multiplier<br />
detector. Ar gas was mixed with the He carrier gas at<br />
the entrance to the plasma chamber. Palagonitized<br />
sideromelane can disintegrate easily with application<br />
<strong>of</strong> the laser. In order to prevent uncontrolled ablation,<br />
optimal laser parameters were determined by trial and<br />
error, attempting to maximize count rates and prevent<br />
sample destruction during analysis. Sample thin<br />
sections were ablated using a 20‐micron beam size,<br />
70% laser energy (approximately 3.75 J/cm 2 ), and a<br />
10 Hz laser pulse repetition rate. For each analysis,<br />
the laser dwell time was 35 s. Mass spectrometer<br />
integration times were 10 ms for V, Sr, Zr, and Rb,<br />
30 ms for Sc, Cr, Co, and Cu, and 50 ms for Zn, Nb,<br />
Ba, REE, and Pb. U.S. Geological Survey Geochemical<br />
Reference Materials BCR‐2 (absolute external<br />
calibration) and BHVO‐2 (internal reference) fused to<br />
glasses were used as calibration standards. Intensities<br />
(counts) were converted to concentrations by the<br />
GLITTER s<strong>of</strong>tware [van Achterbergh et al., 2001].<br />
Palagonite and adjacent sideromelane spot and traverse<br />
(when possible) analyses locations were as<br />
described above for EPMA.<br />
4. Results<br />
4.1. Petrography<br />
[11] Significant palagonite microtextural differences<br />
across the sample set were observed with respect to<br />
the abundance <strong>of</strong> pore space (initial and remaining),<br />
abundance <strong>of</strong> zeolitic cements, and thickness <strong>of</strong><br />
palagonitized rinds. Submarine volcaniclastic samples<br />
such as those from HSDP have relatively abundant<br />
zeolites and evidence <strong>of</strong> significant porosity<br />
reduction (likely due to their deep burial) such as<br />
significant fractures and grain to grain contacts<br />
(Figure 1). These samples also have relatively thick<br />
and smooth palagonitized rinds on sideromelane<br />
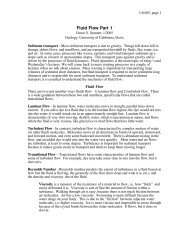
grains. In contrast, samples from the seafloor volcanic,<br />
marine phreatomagmatic (example Surtsey), and<br />
lacustrine phreatomagmatic groups typically have<br />
relatively rare zeolites, abundant pore space, and thin<br />
palagonitized rinds (Figure 2). The subglacial volcanic<br />
samples have more variability in terms <strong>of</strong> zeolite<br />
abundance, porosity, and palagonitized rind<br />
thickness. Measured palagonitized rind thickness<br />
varies widely across the sample set from 0.020 to<br />
0.600 mm (Table 2).<br />
6<strong>of</strong>26
Geochemistry<br />
Geophysics<br />
Geosystems G 3 PAULY ET AL.: GEOCHEMICAL CONTROLS ON PALAGONITIZATION 10.1029/2011GC003639<br />
Figure 2. Thin section photomicrograph (PPL) <strong>of</strong> Surtsey sample 07010405 (the more palagonitized <strong>of</strong> the 2 Surtsey<br />
samples; hyaloclastite; marine phreatomagmatic group). Note relatively thin palagonitized rinds, rare zeolites, and<br />
abundant pore space.<br />
Table 2.<br />
Rind Thickness, Minus‐Cement Porosity, and Palagonitization Extent Results<br />
Environment Group<br />
Sample Name<br />
Sample<br />
Identification<br />
Maximum Rind<br />
Thickness (mm)<br />
Percent Palagonite<br />
and Assoc.<br />
Smectite<br />
Percent<br />
Zeolite<br />
Minus‐Cement<br />
Porosity a (%)<br />
Palagonitization<br />
Extent b (%)<br />
Submarine Volcaniclastic<br />
HSDP R0777–17.4 0.350 28 21 37 85<br />
SOH‐1 4565 0.200 49 17 19 71<br />
Hilina Bench (all grains) S708–9 0.225 47 26 36 90<br />
Hilina Bench (subalkaline grains) S508–7 0.225<br />
Hilina Bench (alkaline grains) S508–7 0.150<br />
Palagonia PAL‐1 0.425 55 20 26 88<br />
Seafloor Volcanic<br />
Davidson T430‐R8 – c 31 16 43 70<br />
North Arch 26D‐6 0.200 37 3 51 57<br />
O’ahu T298‐R17 0.250 32 5 56 53<br />
Marine Phreatomagmatic<br />
Diamond Head 02010405 0.125 32 19 59 66<br />
Surtsey (less palagonitized) 07010404 – d 9 9 71 29<br />
Surtsey (more palagonitized) 07010405 0.150 26 11 63 58<br />
Heimaklettur 07020402 – d 40 12 30 68<br />
Lacustrine Phreatomagmatic<br />
Black Point 08310202 0.020 12 12 48 40<br />
Pahvant Butte 10230304 0.300 35 28 51 84<br />
Fort Rock 08029904 0.600 42 19 50 76<br />
Subglacial Volcanic<br />
Mosfell (less palagonitized) MOS‐1 0.040 14 9 24 35<br />
Mosfell (more palagonitized) MOS‐2 0.060 36 8 16 50<br />
Ingólfsfjall ING‐1 0.325 52 26 34 82<br />
a Minus‐cement porosity (%) = % pore space + % zeolites − % lithic and crystal clasts.<br />
b Palagonitization extent (%) = % zeolites + % palagonite and smectite (calculated as lithic and crystal clast and pore space free).<br />
c Rind thickness not measurable (glassy flow margin; palagonitized in areas, not rinds).<br />
d Rind thickness not measurable (rinds are very thin and incomplete).<br />
7<strong>of</strong>26
Geochemistry<br />
Geophysics<br />
Geosystems G 3 PAULY ET AL.: GEOCHEMICAL CONTROLS ON PALAGONITIZATION 10.1029/2011GC003639<br />
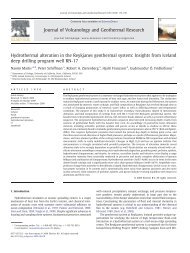
Figure 3. Plot <strong>of</strong> palagonitization extent versus minus‐cement porosity. Black solid symbols: submarine volcaniclastic<br />
group; violet solid symbols: seafloor volcanic group; blue solid symbols: marine phreatomagmatic group;<br />
red open symbols: lacustrine phreatomagmatic group; green symbols: subglacial volcanic group. For the submarine<br />
volcaniclastic, seafloor volcanic, and marine phreatomagmatic environment groups, samples with relatively greater<br />
palagonitization extent also have relatively low minus‐cement porosity and vice versa; samples from the other two<br />
groups are more variable. However, the more‐palagonitized Surtsey and Mosfell samples have higher palagonitization<br />
extent and lower minus‐cement porosity than the corresponding less‐palagonitized samples from the same edifices<br />
(colored arrows connecting symbols), implying that samples with lower original porosity (and expected lower permeability)<br />
palagonitized to a greater extent.<br />
[12] Minus‐cement porosity and palagonitization<br />
extent (Table 2) also show wide variations. Minuscement<br />
porosity ranges from 16 (relatively low) to<br />
71% (relatively high initial pore space). Minuscement<br />
porosity is fairly consistent within each<br />
environmental group (except for the Heimaklettur<br />
sample <strong>of</strong> the marine phreatomagmatic group) and is<br />
relatively low for the submarine volcaniclastic and<br />
subglacial volcanic samples. Palagonitization extent<br />
ranges from 29 (least palagonitized) to 90% (most<br />
thoroughly palagonitized). Palagonitization extent<br />
is consistently higher for the submarine volcaniclastic<br />
samples; it is generally lower and more variable<br />
for samples from the other sample groups.<br />
Palagonitization extent versus minus‐cement<br />
porosity is plotted in Figure 3. The submarine volcaniclastic<br />
samples have relatively high palagonitization<br />
extent and relatively low minus‐cement<br />
porosity. The other groups are more variable, but<br />
in general, there is a trend <strong>of</strong> increasing palagonitization<br />
extent with decreasing minus‐cement porosity.<br />
The less‐palagonitized samples from Surtsey and<br />
Mosfell have greater minus‐cement porosities than the<br />
more‐palagonitized samples from these same edifices.<br />
4.2. Water Content Measurement<br />
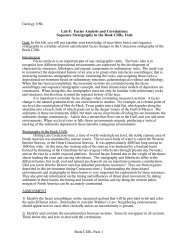
[13] The Kramers‐Kronig absorbances measured<br />
using RL‐FTIR at 3500 cm −1 (the wave number <strong>of</strong><br />
the total H 2 O absorbance peak) correspond to the<br />
derived (EPMA) water contents (Table 3). Figure 4<br />
shows that this is a nearly linear relationship, with<br />
the line <strong>of</strong> best fit having the equation<br />
Kramers-Kronig absorbance<br />
¼ 0:0081ðwt:% EPMA-derived H 2 OÞ:<br />
[14] The extinction coefficient <strong>of</strong> 0.0081 is in close<br />
agreement with the calibrated extinction coefficient<br />
obtained for basalt glass (0.0084) by King et al.<br />
[2006] using the same method. These workers calibrated<br />
the extinction coefficient using transmission<br />
IR spectroscopy on samples <strong>of</strong> natural sideromelane<br />
from the Manus Basin and the Galapagos Islands.<br />
8<strong>of</strong>26
Geochemistry<br />
Geophysics<br />
Geosystems G 3 PAULY ET AL.: GEOCHEMICAL CONTROLS ON PALAGONITIZATION 10.1029/2011GC003639<br />
Table 3. Measured Kramers‐Kronig Absorbance for the 3500 cm −1 Band (RL‐FTIR) and Inferred Water Content (EPMA,<br />
wt. % Oxide)<br />
Location Sample KK Absorbance (RL‐FTIR) Inferred H 2 O (EPMA)<br />
Surtsey (less palagonitized sample) 07010404 0.260 33.4<br />
Davidson 26D‐6 0.246 27.1<br />
HSDP 7231 0.154 20.4<br />
Palagonia PAL‐1 0.130 14.0<br />
The precise extinction coefficient for palagonite<br />
awaits analysis <strong>of</strong> a set <strong>of</strong> palagonite samples with<br />
known absolute water contents. The linear relationship<br />
observed here, however, supports our<br />
assertion that the inferred water content (i.e., 100%<br />
minus the EPMA analysis total) <strong>of</strong> a palagonite<br />
sample represents its water content, and that therefore<br />
palagonite water content can be derived with the<br />
other major‐elements using EPMA. Water content<br />
results are given and discussed below (majorelement<br />
composition).<br />
4.3. Major‐Element Composition<br />
[15] Sideromelane major‐element composition results<br />
(EPMA) are given in Table 4. Sampled sideromelane<br />
compositions are fairly evenly distributed between<br />
alkaline and subalkaline (Figure 5). Averaged palagonite<br />
compositions for each sampled locality (measured<br />
adjacent to the sideromelane analyses in the<br />
center <strong>of</strong> the palagonitized rind) are given in Table 5.<br />
[16] Sample S508–7 from Hilina Bench is unique in<br />
this study because it contains both alkaline and subalkaline<br />
palagonitized sideromelane grains (Figure 6).<br />
These grains are from the pre‐shield alkalic and shield<br />
tholeiitic stages [Sisson et al., 2002, and references<br />
therein], respectively, <strong>of</strong> Kilauea volcano development.<br />
Palagonitization <strong>of</strong> these samples must have<br />
occurred after final deposition within the (Hilina)<br />
volcaniclastic basin, because the hyaloclastite grains<br />
are for the most part sub‐rounded and have relatively<br />
thick and smooth palagonite rinds, which would not<br />
be expected to survive erosion. Palagonitized rinds<br />
for this and other samples were observed to be so<br />
friable that preparation <strong>of</strong> double‐sided thin sections<br />
was not possible without rind separation from the<br />
fresh glass. Therefore, all <strong>of</strong> the grains within this<br />
particular sample must have palagonitized with<br />
identical conditions and for identical duration. The<br />
major‐element compositions <strong>of</strong> sideromelane and<br />
corresponding palagonite for 2 adjacent pairs <strong>of</strong><br />
Figure 4. Plot <strong>of</strong> measured Kramers‐Kronig absorbance (from RL‐FTIR measurements) versus inferred water content<br />
(from EPMA analyses) for samples from the 4 localities indicated (Table 3). A nearly linear, direct relationship<br />
between absorbance and inferred water content is indicated.<br />
9<strong>of</strong>26
Geochemistry<br />
Geophysics<br />
Geosystems G 3 PAULY ET AL.: GEOCHEMICAL CONTROLS ON PALAGONITIZATION 10.1029/2011GC003639<br />
Table 4.<br />
Average Sideromelane Major‐Element Compositions (wt. % Oxide), Determined Using EPMA<br />
Sample Group<br />
Location<br />
(Sample ID)<br />
Number<br />
<strong>of</strong><br />
Concentration (wt. % Oxide):<br />
Sideromelane<br />
Analyses SiO 2 TiO 2 Al 2 O 3 FeO MnO MgO CaO Na 2 O K 2 O<br />
P 2 O 5 SO 2 Total<br />
Submarine Volcaniclastic<br />
HSDP (R0777–17.4) 10 52.66 2.60 13.83 10.77 0.18 6.72 10.63 2.31 0.31 0.24 0.03 100.65<br />
SOH‐1 (3135) 9 50.76 2.86 13.63 11.36 0.16 6.09 10.28 2.54 0.48 0.38 0.07 98.60<br />
Palagonia (PAL‐1) 9 52.75 1.72 14.66 9.45 0.13 6.39 9.42 3.08 0.19 0.28 0.11 98.19<br />
Hilina Bench (S508‐7) (See Table 6)<br />
Submarine Volcanic<br />
Davidson (T430‐R8) 9 44.18 3.40 17.39 9.22 0.14 4.59 8.61 4.37 1.79 0.74 0.11 94.53<br />
North Arch (26D‐6) 3 44.64 2.21 13.79 11.44 0.24 6.73 13.77 3.82 0.91 0.35 0.35 98.25<br />
O’ahu (T298‐R17) 9 40.74 3.39 12.99 11.86 0.20 5.24 14.79 5.25 1.82 1.19 0.30 97.77<br />
Marine Phreatomagmatic<br />
Diamond Head (02010405) 9 42.65 2.70 13.84 11.87 0.18 6.38 13.42 3.94 0.98 0.66 0.12 96.74<br />
Surtsey–less palagonitized 9 46.33 2.37 15.70 12.01 0.22 5.82 10.25 3.84 0.55 0.53 0.12 97.74<br />
sample (07010404)<br />
Surtsey–more palagonitized 9 48.53 2.48 14.56 12.24 0.23 5.70 10.74 3.75 0.54 0.50 0.12 99.39<br />
sample (07010405)<br />
Heimaklettur (07020402) 9 46.32 2.66 15.78 12.18 0.21 5.87 10.02 3.71 0.70 0.39 0.10 97.93<br />
Lacustrine Phreatomagmatic<br />
Black Point (09120301) 6 49.90 1.51 18.78 8.32 0.13 5.63 8.59 3.94 1.08 0.36 0.03 98.27<br />
Pahvant Butte (10230304) 5 51.76 1.75 15.17 12.01 0.18 4.87 8.36 3.40 1.13 0.39 0.09 99.12<br />
Fort Rock (08029904) 4 50.24 1.65 15.60 11.12 0.22 5.90 8.78 3.55 0.45 0.34 0.09 97.95<br />
Subglacial Volcanic<br />
Mosfell–less palagonitized 9 47.05 1.50 15.60 10.82 0.21 8.65 12.68 2.17 0.05 0.22 0.02 98.96<br />
sample (MOS‐1)<br />
Mosfell–more palagonitized 11 47.78 1.67 16.01 11.11 0.18 8.70 12.66 2.21 0.05 0.14 0.02 100.53<br />
sample (MOS‐2)<br />
Ingolfsfjall (ING‐1) 9 48.96 1.72 15.04 11.92 0.20 7.90 11.72 2.45 0.14 0.25 0.13 100.44<br />
Figure 5. Total alkalies versus silica plot <strong>of</strong> sideromelane compositions, averaged at each locality sampled. Black<br />
solid symbols: submarine volcaniclastic group; violet solid symbols: seafloor volcanic group; blue solid symbols:<br />
marine phreatomagmatic group; red open symbols: lacustrine phreatomagmatic group; green symbols: subglacial volcanic<br />
group. Sideromelane composition sampled in this study covers a broad range and is fairly evenly distributed<br />
across alkaline and subalkaline compositions.<br />
10 <strong>of</strong> 26
Geochemistry<br />
Geophysics<br />
Geosystems G 3 PAULY ET AL.: GEOCHEMICAL CONTROLS ON PALAGONITIZATION 10.1029/2011GC003639<br />
Table 5.<br />
Average Palagonite Major‐Element Compositions (wt. % Oxide), Determined Using EPMA<br />
Sample Group<br />
Location<br />
(Sample ID)<br />
Number<br />
<strong>of</strong><br />
Concentration (wt. % Oxide):<br />
Palagonite<br />
Analyses SiO 2 TiO 2 Al 2 O 3 FeO MnO MgO CaO Na 2 O K 2 O<br />
P 2 O 5 SO 2 Total H 2 O a<br />
Submarine Volcaniclastic<br />
HSDP (R0777‐17.4) 9 40.80 5.15 9.88 11.50 0.00 0.97 10.07 0.91 0.16 0.10 0.02 79.62 20.38<br />
SOH‐1 (3135) 9 41.87 4.70 9.31 15.45 0.16 2.73 9.23 0.91 0.35 0.37 0.11 85.19 14.81<br />
Palagonia (PAL‐1) 9 44.54 3.27 10.65 16.16 0.11 1.86 7.13 1.83 0.32 0.04 0.03 85.99 14.01<br />
Hilina Bench (S508‐7) (See Table 6)<br />
Seafloor Volcanic<br />
Davidson (T430‐R8) 8 38.25 3.12 10.47 12.32 0.00 1.09 0.79 4.57 1.94 0.21 0.15 72.91 27.09<br />
North Arch (26D‐6) 4 26.40 4.47 4.93 20.96 0.03 0.83 0.71 2.24 0.83 0.00 0.11 61.57 38.43<br />
O’ahu (T298‐R17) 9 31.41 4.87 16.08 16.84 0.00 2.06 2.40 3.07 1.13 1.70 0.14 79.70 20.30<br />
Marine Phreatomagmatic<br />
Diamond Head (02010405) 8 43.06 4.25 7.83 19.07 0.02 0.78 4.30 0.34 0.43 0.08 0.01 80.21 19.79<br />
Surtsey–less palagonitized 9 27.80 3.99 7.55 16.41 0.19 2.22 6.87 0.72 0.16 0.70 0.00 66.64 33.36<br />
sample (07010404)<br />
Surtsey–more palagonitized 9 30.39 3.81 12.84 18.46 0.16 3.31 6.89 0.04 0.04 0.30 0.00 76.39 23.61<br />
sample (07010405)<br />
Heimaklettur (07020402) 6 37.01 4.28 10.40 17.23 0.07 2.31 4.52 0.45 0.66 0.00 0.01 77.73 22.27<br />
Lacustrine Phreatomagmatic<br />
Black Point (09120301) 9 36.99 2.92 9.49 12.98 0.06 1.12 6.76 1.85 0.78 0.20 0.01 73.20 26.80<br />
Pahvant Butte (10230304) 3 36.81 2.91 8.25 16.35 0.05 0.55 8.06 0.68 0.14 0.06 0.01 73.88 26.12<br />
Fort Rock (08029904) 5 34.07 2.27 10.08 15.46 0.01 1.05 4.66 1.27 0.25 0.11 0.01 69.28 30.72<br />
Subglacial Volcanic<br />
Mosfell–less palagonitized 9 42.58 2.58 11.15 17.35 0.07 0.75 9.83 0.17 0.05 0.08 0.03 84.66 15.34<br />
sample (MOS‐1)<br />
Mosfell–more palagonitized 3 46.81 2.79 13.54 13.12 0.05 2.92 6.59 0.19 0.05 0.05 0.03 86.34 13.66<br />
sample (MOS‐2)<br />
Ingólfsfjall (ING‐1) 9 42.33 3.33 11.00 17.23 0.14 3.08 8.34 0.14 0.16 0.11 0.09 85.99 14.01<br />
a Calculated as 100‐Total.<br />
alkaline and subalkaline palagonitized hyaloclastite<br />
grains (Figure 6) in this sample are given in Table 6.<br />
The alkaline versus subaklaline compositions <strong>of</strong> the<br />
sideromelane grains are clearly distinguishable<br />
(Table 6 and Figure 6 (insets)), as are those <strong>of</strong> the<br />
corresponding palagonites (Table 6). Also, it can be<br />
seen in Figure 6 that the palagonitized margins <strong>of</strong> the<br />
subalkaline grains are relatively thick (Table 2) and<br />
deep‐orange colored, whereas palagonitized margins<br />
<strong>of</strong> the alkaline grains are relatively thin and paleorange<br />
colored.<br />
[17] The derived palagonite water contents <strong>of</strong> all<br />
samples are given in Tables 5 and 6, and are plotted<br />
(by sample location and environmental group) in<br />
Figure 7. The averaged group values for water<br />
content range from approximately 14 (subglacial<br />
volcanic group) to 29 (seafloor volcanic group)<br />
wt. % oxide. The values are generally consistent<br />
within the seafloor volcanic, lacustrine phreatomagmatic,<br />
and subglacial volcanic groups, although<br />
the less‐palagonitized Surtsey sample has significantly<br />
higher water content than the other marine<br />
phreatomagmatic samples. The palagonitized rinds<br />
developed on the 2 subalkaline grains analyzed in<br />
Hilina Bench sample S508–7 (Figure 6 and Table 6)<br />
have much higher water content (25% average) than<br />
for the 2 alkaline grains (17% average). Water<br />
content (Tables 6 and 7) versus palagonitization<br />
extent (Table 2) is plotted in Figure 8. Water content<br />
generally decreases with increasing palagonitization<br />
extent. This trend also holds for the less‐ and morepalagonitized<br />
Surtsey and Mosfell samples, with<br />
both sample sets showing lower water content with<br />
higher palagonitization extent. No correlation<br />
between sample age and sample water content was<br />
observed.<br />
4.4. Trace Element Composition<br />
[18] The raw trace element data are presented in<br />
Table S1 in the auxiliary material. 1 Multielement<br />
spider diagrams were prepared for each sample<br />
1 Auxiliary materials are available in the HTML. doi:10.1029/<br />
2011GC003639.<br />
11 <strong>of</strong> 26
Geochemistry<br />
Geophysics<br />
Geosystems G 3 PAULY ET AL.: GEOCHEMICAL CONTROLS ON PALAGONITIZATION 10.1029/2011GC003639<br />
Figure 6. Thin section photomicrographs (PPL) and TAS plot (inset) for Hilina Bench sample S508–7. Sideromelane<br />
<strong>of</strong> hyaloclastite grains (a) 12 and 13 and (b) 18 and 19 are alkaline and subalkaline, respectively (Table 6). Note<br />
that the palagonitized rinds on the subalkaline grains are colored a deeper shade <strong>of</strong> orange than those <strong>of</strong> the alkaline<br />
grains (Table 2), which are relatively pale (the sideromelanes are also distinguishably colored). The palagonitized<br />
rinds developed on the subalkaline grains are also significantly thicker than those on the alkaline grains.<br />
Table 6.<br />
Compositional Analyses (EPMA) <strong>of</strong> Sideromelane and Palagonite Grains in Hilina Bench Sample S508–7 a<br />
SiO 2 TiO 2 Al 2 O3 FeO MnO<br />
Concentration<br />
(wt. % Oxide)<br />
MgO CaO Na 2 O<br />
K 2 O P 2 O 5 SO 2 Total H 2 O b<br />
Sideromelane<br />
S508‐7 G12‐1 (alkaline) 47.81 4.17 12.96 13.02 0.18 6.08 11.13 2.93 0.64 0.46 0.08 99.45<br />
S508‐7 G12‐2 (alkaline) 47.98 4.21 13.50 13.20 0.18 6.08 11.14 2.92 0.75 0.55 0.01 100.52<br />
S508‐7 G18‐1 (alkaline) 46.22 4.68 13.79 13.44 0.16 5.96 11.13 3.25 0.84 0.70 0.07 100.24<br />
S508‐7 G18‐2 (alkaline) 46.32 4.64 13.98 13.53 0.25 5.92 11.15 3.25 0.88 0.66 0.04 100.61<br />
S508‐7 G18‐3 (alkaline) 46.01 4.56 13.63 13.24 0.20 6.02 11.35 3.31 0.89 0.47 0.02 99.70<br />
average alkaline 46.87 4.45 13.57 13.28 0.19 6.01 11.18 3.13 0.80 0.57 0.04 100.10<br />
S508‐7 G13‐1 (subalk.) 52.29 2.30 13.21 11.44 0.18 6.84 10.96 2.27 0.32 0.41 0.02 100.25<br />
S508‐7 G13‐2 (subalk.) 52.24 2.33 13.51 11.46 0.20 6.72 10.93 2.38 0.31 0.49 0.00 100.55<br />
S508‐7 G13‐3 (subalk.) 52.57 2.29 13.40 11.20 0.20 6.74 10.98 2.26 0.33 0.37 0.00 100.34<br />
S508‐7 G19‐1 (subalk.) 53.70 2.20 13.47 10.98 0.20 7.00 10.82 2.36 0.31 0.36 0.00 101.40<br />
S508‐7 G19‐2 (subalk.) 52.95 2.14 13.73 10.82 0.18 7.13 10.91 2.29 0.29 0.32 0.03 100.78<br />
average subalkaline 52.75 2.25 13.46 11.18 0.19 6.89 10.92 2.31 0.31 0.39 0.01 100.66<br />
Palagonite<br />
S508‐7 G12‐1 (alkaline) 36.75 6.97 6.53 12.27 0.10 3.45 3.59 1.95 1.31 0.15 0.09 73.14 26.86<br />
S508‐7 G12‐2 (alkaline) 38.76 7.60 7.24 12.17 0.08 2.86 3.90 1.63 1.05 0.17 0.08 75.53 24.47<br />
S508‐7 G18‐1 (alkaline) 39.08 8.32 8.10 10.51 0.16 2.78 4.73 1.19 1.05 0.14 0.13 76.19 23.81<br />
S508‐7 G18‐2 (alkaline) 39.56 8.33 7.65 11.30 0.04 2.58 4.88 1.98 0.98 0.00 0.14 77.45 22.55<br />
S508‐7 G18‐3 (alkaline) 36.45 7.48 6.42 12.65 0.18 3.10 3.59 1.57 1.15 0.08 0.00 72.67 27.33<br />
average alkaline 38.12 7.74 7.19 11.78 0.11 2.95 4.14 1.66 1.11 0.11 0.09 74.99 25.0<br />
S508‐7 G13‐1 (subalk.) 39.72 4.57 8.03 18.79 0.11 3.14 2.62 1.96 1.46 0.00 0.32 80.71 19.29<br />
S508‐7 G13‐2 (subalk.) 42.01 4.74 9.60 17.23 0.18 2.67 3.39 1.93 1.45 0.15 0.19 83.53 16.47<br />
S508‐7 G13‐3 (subalk.) 42.09 4.79 8.40 17.66 0.07 3.79 2.76 2.20 1.37 0.11 0.07 83.29 16.71<br />
S508‐7 G19‐1 (subalk.) 43.29 4.51 10.22 15.50 0.14 2.87 3.66 2.27 1.45 0.00 0.02 83.91 16.09<br />
S508‐7 G19‐2 (subalk.) 42.46 4.35 9.57 15.96 0.07 2.62 3.33 2.44 1.56 0.01 0.08 82.45 17.55<br />
average subalkaline 41.91 4.59 9.16 17.03 0.11 3.02 3.15 2.16 1.46 0.05 0.14 82.78 17.22<br />
a Grains 12 and 18 consist <strong>of</strong> alkaline sideromelane (dark blue); grains 13 and 19 consist <strong>of</strong> subalkaline sideromelane (red).<br />
b Calculated as 100‐Total.<br />
12 <strong>of</strong> 26
Geochemistry<br />
Geophysics<br />
Geosystems G 3 PAULY ET AL.: GEOCHEMICAL CONTROLS ON PALAGONITIZATION 10.1029/2011GC003639<br />
Figure 7. Plot <strong>of</strong> derived water content (wt. % oxide; EPMA) versus sample location. Black: submarine volcaniclastic<br />
group; violet: seafloor volcanic group; blue: marine phreatomagmatic group; red: lacustrine phreatomagmatic<br />
group; green: subglacial volcanic group. Values within the seafloor volcanic and subglacial volcanic groups are fairly<br />
consistent; each <strong>of</strong> the other groups contains at least one sample with an inconsistent value. Average group values<br />
(indicated by the black lines) range from approximately 14 (subglacial volcanic group) to 29 wt. % oxide (seafloor<br />
volcanic group).<br />
Table 7. Major‐Element and Overall Mass Change (%) for Subalkaline and Alkaline Samples, Determined Graphically Using<br />
Isocon Diagrams (Figure 10 and Figure S2) a<br />
Location<br />
Mass Change (%) Element (Oxide)<br />
SiO 2 TiO 2 Al 2 O 3 FeO MgO CaO Na 2 O K 2 O<br />
Overall Mass<br />
Change (%)<br />
(Subalkaline Sideromelane)<br />
HSDP* −71.7 −31.1 −70.9 −68.4 −96.1 −63.9 −87.4 −77.2 −63.7<br />
SOH‐1* −54.3 6.3 −64.2 −21.8 −63.7 −41.6 −82.5 −49.5 −42.6<br />
Palagonia* −56.3 2.8 −66.5 2.2 −82.7 −59.1 −69.1 −41.4 −47.0<br />
Ingólfsfjall −58.9 −5.4 −62.8 −41.7 −84.3 −61.8 −97.9 −38.9 −53.3<br />
Hilina Bench (subalk. grain)* −48.7 34.0 −59.8 1.0 −64.0 −83.9 −37.6 166.0 −35.9<br />
Avg. Subalkaline Sideromelane −58.0 1.3 −64.8 −25.7 −78.1 −62.1 −74.9 −8.2 −48.5<br />
(Alkaline Sideromelane)<br />
Davidson* −53.0 −47.6 −70.3 −17.5 −88.2 −95.0 −33.6 8.1 −43.2<br />
Surtsey (more palagonitized sample) −56.3 18.5 −33.8 8.7 −64.8 −49.8 −91.8 −91.8 −27.4<br />
O’ahu* −50.8 −8.1 −1.5 3.7 −83.0 −90.6 −69.4 −65.2 −33.0<br />
Black Point −40.8 109.5 −64.6 44.2 −71.3 −45.6 −69.5 −22.5 −23.4<br />
Pahvant Butte −53.0 7.8 −63.2 −5.5 −91.9 −27.8 −89.2 −92.8 −36.3<br />
Diamond Head −17.9 11.1 −57.7 32.3 −88.6 −79.9 −91.9 −65.3 −19.6<br />
Fort Rock −53.8 2.4 −53.7 3.8 −88.6 −71.0 −44.0 −60.7 −29.0<br />
Heimaklettur −55.9 27.6 −66.9 19.7 −83.9 −76.9 −63.5 −69.1 −38.1<br />
Hilina Bench (alkaline grain)* −26.4 54.7 −48.9 −31.9 −59.4 −63.0 −68.1 8.8 −13.0<br />
Avg. Alkaline Sideromelane −45.3 19.5 −51.2 6.4 −80.0 −66.6 −69.0 −50.0 −29.2<br />
*Oceanic sample average (this study) −51.6 1.6 −54.6 −19.0 −76.7 −71.0 −64.0 −7.2<br />
Staudigel and Hart [1983, Table 2]; MORB −50.0 n/a −55.0 −12.0 −67.0 −88.0 −81.0 900.0<br />
a The averaged values for the oceanic samples are compared to MORB values calculated by Staudigel and Hart [1983] at the bottom <strong>of</strong> the table<br />
(see section 5).<br />
13 <strong>of</strong> 26
Geochemistry<br />
Geophysics<br />
Geosystems G 3 PAULY ET AL.: GEOCHEMICAL CONTROLS ON PALAGONITIZATION 10.1029/2011GC003639<br />
Figure 8. Plot <strong>of</strong> palagonite water content versus palagonitization extent. Black solid symbols: submarine volcaniclastic<br />
group; violet solid symbols: seafloor volcanic group; blue solid symbols: marine phreatomagmatic group; red<br />
open symbols: lacustrine phreatomagmatic group; green symbols: subglacial volcanic group. Samples with lower<br />
water contents generally palagonitized to a greater extent, however this trend is not evident in the seafloor volcanic<br />
and lacustrine phreatomagmatic groups. The less‐ and more‐palagonitized sample pairs from Surtsey and Mosfell<br />
show this trend (indicated by arrows connecting symbols).<br />
(Figures 9 and S1). The sampled palagonite REE<br />
patterns among the different environment groups<br />
and for localities within each environment group<br />
are broadly similar. Sr, K, Rb, and Ba in palagonite<br />
relative to sideromelane are highly variable across<br />
the sample set. Sr and K in palagonite vary from<br />
depleted to enriched (relative to sideromelane),<br />
independent <strong>of</strong> environment sample group. Rb and<br />
Ba in palagonite, for the majority <strong>of</strong> the samples,<br />
are depleted (in some cases greatly) relative to<br />
sideromelane. For most <strong>of</strong> the samples, Nb through<br />
Lu (including REEs) palagonite concentration<br />
Figure 9. Chondrite‐normalized [McDonough and Sun, 1995] multielement spider diagrams for (a) a subalkaline<br />
grain and (b) an alkaline grain in Hilina Bench sample S508–7 (submarine volcaniclastic environment group). Colors<br />
and analyses numbers as in Figure S1. Note the difference in Nb through Lu (immobile elements) concentration<br />
relative to sideromelane for the palagonitized subalkaline versus alkaline grain.<br />
14 <strong>of</strong> 26
Geochemistry<br />
Geophysics<br />
Geosystems G 3 PAULY ET AL.: GEOCHEMICAL CONTROLS ON PALAGONITIZATION 10.1029/2011GC003639<br />
Figure 10. Isocon diagrams [Grant, 1986] used for determination <strong>of</strong> elemental and overall mass change for palagonite<br />
developed on (a) a subalkaline grain (plotted trace element analyses Sid. One and average <strong>of</strong> Pal. One and Pal. 2) and<br />
(b) an alkaline grain (plotted trace element analyses Sid. One and average <strong>of</strong> Pal. One and Pal. 2) in Hilina Bench sample<br />
S508–7 (submarine volcaniclastic environment group). For both samples, plotted major‐element analyses and trace<br />
element analyses were carried out using EPMA and LA‐ICPMS, respectively, at identical spots in sideromelane and<br />
palagonite. Plotted palagonite major‐ and trace element analyses were made as close to the center <strong>of</strong> palagonitized rinds<br />
as possible. Plotted sideromelane major‐ and trace element analyses were made at identical spots in sideromelane, which<br />
in all samples is homogeneous with respect to major‐ and trace element composition. Plotted major‐element sideromelane<br />
and palagonite analyses (green symbols) are given in Table S2; plotted trace element analyses (red and blue<br />
symbols) are given in Table S1. C A : factored concentration in altered sideromelane (palagonite); C O : original sideromelane<br />
factored concentration (see text). Isocon line (red) was determined by linear regression using Zr, Nb, Sc, La,<br />
and Nd. The slope <strong>of</strong> the isocon line is significantly steeper for palagonitized subalkaline (35.9% overall mass loss) than<br />
for alkaline sideromelane (13.0% overall mass loss).<br />
patterns are parallel to and show higher concentrations<br />
than the corresponding sideromelane patterns.<br />
Walton et al. [2005], using LA‐ICPMS, found<br />
similar behavior in palagonite relative to sideromelane<br />
REE patterns for HSDP hyaloclastite<br />
samples, as did Daux et al. [1994], using inductively<br />
coupled plasma atomic emission spectrometry<br />
(ICP‐AES) to analyze chemically separated<br />
sideromelane and palagonite fragments from Icelandic<br />
subglacially erupted hyaloclastite samples.<br />
The immobile‐element sections <strong>of</strong> the spider patterns<br />
<strong>of</strong> the present study indicate that essentially<br />
no systematic chemical fractionation <strong>of</strong> these<br />
elements occurred during palagonitization (a few<br />
samples show the LREEs to be slightly less enriched<br />
than the HREEs). This finding is consistent<br />
with Daux et al. [1994], who found no evidence for<br />
REE fractionation among a suite <strong>of</strong> 11 Icelandic<br />
palagonitized hyaloclastites. For samples with<br />
sufficiently thick palagonitized rinds, so that palagonite<br />
analyses could be determined along a traverse<br />
(Pal. 1, Pal. 2, etc. in Figures 9 and S1),<br />
immobile‐element concentration decreases systematically<br />
from the outer palagonitized rim inward<br />
toward the fresh sideromelane. Immobile‐element<br />
(Nb through Lu) concentration relative to sideromelane<br />
is greater for subalkaline (Figures S1a,<br />
S1b, S1c, and S1m) as compared to alkaline<br />
(Figures S1d, S1f, S1g, S1h, S1i, S1j, S1k, and<br />
S1l) palagonite. This is also the case for subalkaline<br />
and alkaline grains analyzed in Hilina Bench<br />
sample S508–7 (Figure 9). Only the North Arch<br />
palagonite trace element pattern (Figure S1e) does<br />
not follow the trends described above, and shows<br />
a distinct Ce anomaly.<br />
4.5. Major‐Element Concentration<br />
Changes<br />
[19] Isocon diagrams [Grant, 1986] were prepared for<br />
each sample in order to investigate major‐element<br />
concentration changes during palagonitization. This<br />
method allowed a test <strong>of</strong> a constant volume or constant<br />
mass assumption based on immobile element<br />
concentrations. The trace‐ and major‐element concentration<br />
analyses (Tables S1 and S2, respectively)<br />
used for these diagrams were from LA‐ICPMS and<br />
EPMA analyses performed at approximately the<br />
center <strong>of</strong> the palagonitized outer margins and at as<br />
close to identical spots as possible for each sample.<br />
15 <strong>of</strong> 26
Geochemistry<br />
Geophysics<br />
Geosystems G 3 PAULY ET AL.: GEOCHEMICAL CONTROLS ON PALAGONITIZATION 10.1029/2011GC003639<br />
Figure 11. Mass loss (Table 7) versus palagonitization extent (Table 2). Samples plot along a general trend <strong>of</strong><br />
increasing mass loss with increasing extent (arrow). Subalkaline samples for the most part have greater mass loss<br />
values than alkaline samples. The alkaline and subalkaline fields overlap for extent values between 70 and 85%,<br />
however in this region, subalkaline mass loss values are generally greater.<br />
The palagonite compositions were plotted against the<br />
analyses <strong>of</strong> adjacent sideromelane. Major‐element<br />
(wt. % oxide) and trace element (ppm) concentrations<br />
were scaled, using appropriate factors, for<br />
plotting. The actual trace‐ and major‐element analyses<br />
used to construct each sample’s isocon diagram<br />
are given with Figures 10 and S2. Zr, Nb, Sc, La, and<br />
Nd concentrations consistently plotted along isocon<br />
lines for almost all <strong>of</strong> the samples (Figures 10 and<br />
S2). These elements therefore can be considered<br />
immobile. Major‐element oxide as well as Rb, V,<br />
and Cr concentrations did not consistently plot<br />
along the isocon lines, hence these elements are<br />
considered mobile. Concentration changes for mobile<br />
elements, as well as overall mass loss, were determined<br />
graphically using each sample’s isocon diagram<br />
and the lever rule [Grant, 1986].<br />
[20] The mass loss results fall into two categories:<br />
palagonites in samples <strong>of</strong> subalkaline sideromelane<br />
(Figures 10a, S2a, S2b, S2c, and S2m) exhibit relatively<br />
higher (35.9 to 63.7%) mass loss; palagonites<br />
in samples <strong>of</strong> alkaline sideromelane (Figures 10b,<br />
S2d, S2f, S2g, S2h, S2i, S2j, S2k, and S2l) exhibit<br />
relatively lower (13.0 to 43.2%) mass loss (Table 7).<br />
In particular, the palagonites in samples <strong>of</strong> subalkaline<br />
sideromelane lost significant amounts Si,<br />
Ti, Al, and Fe, whereas in palagonites <strong>of</strong> samples <strong>of</strong><br />
alkaline sideromelane, relatively less Si and Al were<br />
lost, and, on average, Ti and Fe were gained. These<br />
trends are also observed for the subalkaline and<br />
alkaline grains in Hilina Bench sample S508–7<br />
(Figure 10 and Table 7). Overall mass loss versus<br />
palagonitization extent is plotted in Figure 11. Mass<br />
loss generally increases linearly with increasing<br />
palagonitization extent. Samples <strong>of</strong> subalkaline<br />
sideromelane that palagonitized to a relatively high<br />
extent also had relatively high mass loss. For a given<br />
palagonitization extent, samples <strong>of</strong> subalkaline palagonitized<br />
sideromelane lost more mass than alkaline<br />
samples. The North Arch Zr, Nb, Sc, La, and Nd<br />
concentrations do not plot along a line (Figure S2e),<br />
so the isocon approach cannot be used to determine<br />
valid palagonitization mass changes for this sample.<br />
The North Arch sample was the only Mn oxideencrusted<br />
sample studied (Table 1). Previous studies<br />
indicate that Mn and Fe oxides comprising marine<br />
ferromanganese crusts scavenge trace metals<br />
[Koschinsky and Hein,2003;Hein et al., 1997]. The<br />
anomalous mobile behavior <strong>of</strong> Zr, Nb, Sc, La, and<br />
Nd in the North Arch sample we interpret to be due<br />
to variable sequestering <strong>of</strong> these elements within<br />
the Mn oxide crust. Furthermore, we interpret the<br />
observed negative Ce anomaly to be the result <strong>of</strong><br />
significant oxidative accumulation <strong>of</strong> Ce within<br />
the Mn oxide crust, as observed in ferromanganese<br />
crusts from the Central Pacific by Bau and<br />
Koschinsky [2009].<br />
16 <strong>of</strong> 26
Geochemistry<br />
Geophysics<br />
Geosystems G 3 PAULY ET AL.: GEOCHEMICAL CONTROLS ON PALAGONITIZATION 10.1029/2011GC003639<br />
Figure 12. Major‐element concentration traverse, SOH‐1 (submarine volcaniclastic environment group; subalkaline<br />
sideromelane). (top) BSE photomicrograph showing the palagonite traverse in red and the sideromelane traverse in<br />
brown. Spot‐spacing is given on the lower image. (bottom) Palagonite major‐element concentration (Table S3),<br />
plotted as a percentage <strong>of</strong> the outermost (Spot 1) palagonite concentration, for each spot along the palagonite traverse.<br />
4.6. Major‐Element Concentration<br />
Gradients<br />
[21] Major‐element spot analyses along traverses<br />
through palagonite were performed on 5 <strong>of</strong> the samples<br />
with relatively thick palgonitized rinds. The raw<br />
data are given in Table S3, and the traverse details and<br />
plotted results are given in Figures 12 and S3a–S3d.<br />
In each sample, the sideromelane is homogeneous<br />
with respect to major‐element composition. For all<br />
5 <strong>of</strong> the palagonites, a distinct MgO concentration<br />
gradient, highest at the outer palagonitized margin<br />
and decreasing inward toward the sideromelane<br />
contact to only about 50% <strong>of</strong> the outer margin value,<br />
was observed. Over the same interval, SiO2, Al2O3,<br />
and CaO concentrations generally increased by 5 to<br />
20%, whereas TiO2 and FeO concentrations generally<br />
remained steady or decreased.<br />
5. Discussion<br />
5.1. Palagonitization Extent<br />
[22] Previous workers have devised various means<br />
for the quantification <strong>of</strong> palagonitization extent,<br />
based for example on palagonitized rind thickness<br />
and major‐element concentration changes during<br />
palagonitization. Interpretation <strong>of</strong> palagonitized rind<br />
thickness is not straightforward. Rind thickness has<br />
been shown to relate to both palagonitization duration<br />
[Moore, 1966] and temperature [Moore et al.,<br />
17 <strong>of</strong> 26
Geochemistry<br />
Geophysics<br />
Geosystems G 3 PAULY ET AL.: GEOCHEMICAL CONTROLS ON PALAGONITIZATION 10.1029/2011GC003639<br />
Figure 13. Palagonitization extents determined using 3 different methods (see legend and text) for sampled localities<br />
in the present study (sample groups as indicated). The calculated extents vary widely for most <strong>of</strong> the samples.<br />
Petrography‐based reaction extents are 15 and 29% higher for the more palagonitized Surtsey and Mosfell (see<br />
PPL photomicrograph insets) samples respectively than for the corresponding less palagonitized samples (green<br />
arrows). The same values determined using the SiO 2 /MgO method are 29 and 25% (violet arrows). However, those<br />
determined using the TiO 2 method are −5 and −15% (blue arrows).<br />
1985; Jakobsson and Moore, 1986]. Crovisier et al.<br />
[1992] found palagonitized rind thickness not to be a<br />
good indicator <strong>of</strong> reaction progress. Studies using<br />
major‐element concentration data as the basis for<br />
reaction extent include Staudigel and Hart [1983],<br />
Crovisier et al. [1992], and Stroncik and Schmincke<br />
[2001], in which assumed passive accumulation <strong>of</strong><br />
TiO 2 , SiO 2 /MgO, or MgO, respectively, was used<br />
as the basis for determining elemental changes<br />
during palagonitization. Since the present study<br />
shows that TiO 2 , SiO 2 , and MgO mass change<br />
behaviors vary significantly among different samples<br />
(Table 7), palagonitization extent values based<br />
on these element behaviors cannot be used to<br />
compare palagonitization extent among samples.<br />
Furthermore, SiO 2 , TiO 2 and particularly MgO<br />
concentrations vary as a function <strong>of</strong> analysis location<br />
within a given palagonite rind due to the<br />
observed concentration gradients for these elements<br />
(Figures 12 and S3).<br />
[23] Since palagonitization extent could potentially<br />
depend on many factors, including initial sideromelane<br />
composition, palagonitization duration,<br />
available heat, water/rock (i.e., porosity), fluid<br />
chemistry, and analysis location, a petrographicbased<br />
approach to determining the extent <strong>of</strong> palagonitization,<br />
representing an average extent for<br />
the sample, rather than a chemically based extent<br />
<strong>of</strong> palagonitization seems appropriate for sample<br />
comparison. Here we suggest an alternative,<br />
petrography‐based approach, wherein palagonitization<br />
extent is calculated based on observed modal<br />
data (see section 3.1 and Table 2). Palagonitization<br />
extents calculated from both modal data (this study)<br />
and using the major‐element concentration data<br />
approach used by previous workers are compared in<br />
Figure 13; wide variations are apparent. At Surtsey<br />
and Mosfell, petrographically distinct (Figure 13,<br />
insets) samples were collected from areas that<br />
were less‐ and more‐palagonitized, based on field<br />
observations. Calculated extents using the SiO 2 /<br />
MgO method correlate with the petrographically<br />
observable difference in degree <strong>of</strong> palagonitization<br />
between the samples; the TiO 2 method does not.<br />
However, as mentioned above, the SiO 2 /MgO<br />
method is shown here to depend on analyzed spot<br />
location, particularly for MgO. The petrographic<br />
palagonitization extent provides a basis for comparison<br />
<strong>of</strong> other measured parameters in samples<br />
from different locations that are known to have<br />
palagonitized under different conditions. For<br />
example, in this study, palagonite water content is<br />
18 <strong>of</strong> 26
Geochemistry<br />
Geophysics<br />
Geosystems G 3 PAULY ET AL.: GEOCHEMICAL CONTROLS ON PALAGONITIZATION 10.1029/2011GC003639<br />
observed to decrease linearly with increasing palagonitization<br />
extent (Figure 8); this finding is discussed<br />
further below.<br />
5.2. Porosity Control <strong>of</strong> Palagonitization<br />
Extent<br />
[24] The observed general trend <strong>of</strong> increasing<br />
palagonitization extent with decreasing minuscement<br />
porosity (i.e., decreasing original porosity;<br />
Figure 3) across the sample set suggests that porosity<br />
plays a controlling role in the extent <strong>of</strong> palagonitization.<br />
Walton and Schiffman [2003] made a similar<br />
finding for palagonitized HSDP hyaloclastites. Less<br />
fluid flow would be expected within low‐porosity<br />
samples (due to the expected relative lack <strong>of</strong> permeability),<br />
so we can speculate that water/rock ratio<br />
(w/r) decreases with decreasing porosity. Therefore<br />
the trend observed in Figure 3 suggests that sample<br />
w/r is inversely related to palagonitization extent.<br />
Pauly [2011] showed that pH (presumably determined<br />
by sample w/r and thus porosity) controls B<br />
isotope fractionation between palagonite and seawater.<br />
In that study, palagonitized sideromelane<br />
samples having the lowest zeolite abundance (suggesting<br />
low palagonitization extent) also had the<br />
lightest d 11 B values, as would be expected for<br />
samples that palagonitized in relatively low pH,<br />
more porous environments (presumably where little<br />
if any porosity reduction due to burial has occurred).<br />
This finding confirms that porosity is an important<br />
control <strong>of</strong> palagonitization extent.<br />
[25] It is also apparent in Figure 3 that within the<br />
lacustrine phreatomagmatic and subglacial volcanic<br />
sample groups, palagonitization extent varies<br />
widely among samples with similar porosity. Palagonitization<br />
extents <strong>of</strong> 84% and 40% were measured<br />
at Pahvant Butte and Black Point (lacustrine<br />
phreatomagmatic samples) respectively, yet these<br />
samples have nearly identical porosities (Table 2).<br />
Evidently, within these sample groups, other factor(s)<br />
besides porosity, presumably including available<br />
heat and palagonitization duration, exert control on<br />
palagonitization extent.<br />
5.3. Non‐isovolumetric Process:<br />
Implications for Major‐Element Changes<br />
[26] Previous workers [Hay and Iijima, 1968a,<br />
1968b; Honnorez, 1967, 1972; Eggleton and Keller,<br />
1982; Staudigel and Hart, 1983; Furnes, 1984;<br />
Bednarz and Schmincke, 1989; Zhou and Fyfe,<br />
1989; Jercinovic et al., 1990; Thorseth et al.,<br />
1991; Crovisier et al., 1992; Daux et al., 1994;<br />
Stroncik and Schmincke, 2001; Walton et al., 2005]<br />
studied major‐ and/or trace element changes during<br />
palagonitization as a means <strong>of</strong> understanding the<br />
geochemical mechanism <strong>of</strong> palagonitization, using<br />
various methods and assumptions. Stroncik and<br />
Schmincke [2001] and Walton and Schiffman<br />
[2003] summarize these studies. This impressive<br />
number <strong>of</strong> studies, spanning nearly 40 years, gives<br />
an indication <strong>of</strong> the (still) elusive nature <strong>of</strong> elemental<br />
mobility during palagonitization.<br />
[27] In the present study, the availability <strong>of</strong> both<br />
major‐ and trace‐element data, obtained using in situ<br />
microanalysis at essentially the same spots within<br />
sampled palagonites, is exploited to determine<br />
major‐element and overall mass changes during<br />
palagonitization, using the isocon method [Grant,<br />
1986]. The observed large major‐element mass changes<br />
(Table 7) are well in excess <strong>of</strong> changes in solidphase<br />
specific gravity that can be attributed to<br />
hydration alone, and require extensive dissolution<br />
and creation <strong>of</strong> microporosity. This indicates that<br />
palagonitization cannot be an isovolumetric process,<br />
as previously suggested based on petrographic evidence<br />
[Walton and Schiffman, 2003; Stroncik and<br />
Schmincke, 2001; Jercinovic et al., 1990]. Even<br />
though, when observed petrographically, preserved<br />
primary texture and absence <strong>of</strong> secondary pores<br />
within palagonitized areas suggests an isovolumetric<br />
process, evidently significant microporosity develops<br />
during palagonitization, potentially in the leached<br />
layers imaged within gel palagonite by Drief<br />
and Schiffman [2004]. These workers concluded<br />
that the leached layers result from selective dissolution,<br />
and form palagonite. The finding that palagonitization<br />
is not an isovolumetric process calls<br />
into question element changes that have previously<br />
been calculated in weight per unit volume [Daux et al.,<br />
1994; Crovisier et al., 1992; Hay and Iijima, 1968a],<br />
and suggests instead that the isocon approach <strong>of</strong> Grant<br />
[1986], in which mobile element concentration changes<br />
are determined based on immobile element concentration<br />
changes, is necessary to understand mass<br />
transfer during palagonitization.<br />
5.4. Major‐Element Changes: Implications<br />
for Seawater Cation Flux<br />
[28] Major‐element concentration changes determined<br />
from immobile‐element isocon lines in the<br />
present study (Table 7) confirm that palagonitization<br />
<strong>of</strong> sideromelane can be a significant source (or<br />
sink) <strong>of</strong> oceanic cations. The averaged element<br />
changes determined for oceanic samples in the<br />
present study are for the most part in reasonable<br />
agreement with elemental changes calculated for<br />
19 <strong>of</strong> 26
Geochemistry<br />
Geophysics<br />
Geosystems G 3 PAULY ET AL.: GEOCHEMICAL CONTROLS ON PALAGONITIZATION 10.1029/2011GC003639<br />
palagonitization <strong>of</strong> MORB crust by Staudigel and<br />
Hart [1983] (Table 7). The lone exception is<br />
K 2 O, for which average change calculated for<br />
oceanic samples in the present study is −12%,<br />
whereas Staudigel and Hart [1983] calculated<br />
a value <strong>of</strong> 900%. An important observation is<br />
that both overall and specific major‐element mass<br />
changes depend strongly on original sideromelane<br />
composition. In particular, averaged TiO 2 and FeO<br />
changes range from 1.3 and −25.7% respectively<br />
during palagonitization <strong>of</strong> subalkaline sideromelane<br />
(i.e., neutral to a source <strong>of</strong> seawater cations) to 19.5<br />
and 6.4% respectively during palagonitization <strong>of</strong><br />
alkaline sideromelane (i.e., sink <strong>of</strong> oceanic cations).<br />
This finding points out the need to account for variable<br />
mass changes due to sideromelane composition<br />
when performing global oceanic flux calculations.<br />
5.5. Compositional Control<br />
[29] Palagonitized rinds on the subalkaline and<br />
alkaline grains <strong>of</strong> Hilina Bench sample S508–7 were<br />
observed to have distinguishable major‐element<br />
compositions, even though they were palagonitized<br />
under identical conditions (Table 6). In addition, the<br />
average overall mass loss values across the entire<br />
sample set are very different for palagonitization<br />
<strong>of</strong> alkaline (26%) versus subalkaline (48%) sideromelane<br />
(Table 7). It is clear that palagonite<br />
composition depends on original sideromelane<br />
composition. This finding is potentially inconsistent<br />
with Stroncik and Schmincke [2001], who found<br />
palagonite composition to be mainly controlled by<br />
palagonite aging, beginning with the first appearance<br />
<strong>of</strong> palagonitized sideromelane. However, it<br />
should be noted that for the most part the samples<br />
analyzed by Stroncik and Schmincke [2001] are<br />
significantly older than those <strong>of</strong> the present study;<br />
also all samples analyzed in the present study are gel<br />
palagonite.<br />
5.6. Subalkaline Versus Alkaline<br />
Sideromelane Dissolution Rate<br />
[30] The substantial difference in average overall<br />
mass loss values (Table 7) indicate that subalkaline<br />
sideromelane dissolves much more readily than<br />
alkaline. This observation cannot be attributed to<br />
differences in palagonitization duration or conditions,<br />
because subalkaline versus alkaline sideromelane<br />
grains in Hilina Bench sample S508–7,<br />
which must have palagonitized for identical duration<br />
and conditions, lost 35.9% and 13.0% mass,<br />
respectively (Figure 10 and Table 7). The thicker<br />
versus thinner palagonitized rinds that developed<br />
on the subalkaline versus alkaline grains in this<br />
sample (Figure 6) are therefore evidence that subalkaline<br />
sideromelane must dissolve at a relatively<br />
higher rate than alkaline sideromelane during<br />
palagonitization. This is strong evidence that sideromelane<br />
dissolution rate depends on sideromelane<br />
composition. An implication <strong>of</strong> this finding is that<br />
palagonitized rind thickness gives a true indication<br />
<strong>of</strong> palagonitization duration, as suggested by Moore<br />
[1966], only if the original sideromelane compositions<br />
in the sample set are identical.<br />
5.7. Water Content<br />
[31] The observation that palagonite water content<br />
decreases linearly with palagonitization extent<br />
(Figure 8) holds for samples from all <strong>of</strong> the environmental<br />
groups, including localities known or<br />
inferred to have palagonitized over a relatively short<br />
duration (volcanic and phreatomagmatic environments)<br />
and localities known or inferred to have<br />
palagonitized over a relatively long duration (submarine<br />
volcaniclastic environments). In particular,<br />
water contents <strong>of</strong> the less‐ and more‐palagonitized<br />
samples from both Surtsey and Mosfell (subglacial<br />
volcanic group) are higher and lower, respectively<br />
(Figure 8, blue and green arrows). Presumably<br />
palagonitization duration is similar for each sample<br />
pair from Surtsey and Mosfell. This indicates that<br />
water content depends on palagonitization extent<br />
(or possibly temperature), for a given palagonitization<br />
duration (assuming water content to be stable<br />
post‐palagonitization). Drief and Schiffman [2004,<br />
Figure 2d] showed that palagonite consists <strong>of</strong><br />
amorphous and smectite‐like areas. The higher<br />
water contents observed in relatively low palagonitization<br />
extent samples in the present study might<br />
reflect a higher abundance <strong>of</strong> amorphous (and<br />
presumably more hydrated) material relative to<br />
smectite‐like areas. Similarly, the lower water contents<br />
observed in relatively high palagonitization<br />
extent samples might reflect higher degrees <strong>of</strong> crystallinity,<br />
consistent with inferred recrystallization <strong>of</strong><br />
palagonite to smectite (see section 5.9).<br />
5.8. Two Distinct Palagonitization Styles<br />
[32] The submarine volcaniclastic samples have<br />
remarkably similar low porosity values, high zeolite<br />
abundances, thick, smooth, gel‐like palagonite rind<br />
textures, and high palagonitization extents (Figure 2<br />
and Table 2). The submarine volcanic, phreatomagmatic<br />
(both marine and lacustrine) and subglacial<br />
volcanic samples generally are much more<br />
variable in terms <strong>of</strong> these same parameters (Figure 3<br />
20 <strong>of</strong> 26
Geochemistry<br />
Geophysics<br />
Geosystems G 3 PAULY ET AL.: GEOCHEMICAL CONTROLS ON PALAGONITIZATION 10.1029/2011GC003639<br />
and Table 2); palagonitization extent within these<br />
groups is particularly variable. These observations<br />
suggest two distinguishable and environmentally<br />
dependent palagonitization styles.<br />
[33] Burial‐diagenetic palagonitization. Palagonitization<br />
in submarine volcaniclastic localities is<br />
known, or is inferred, to have occurred significantly<br />
later than initial eruption, fragmentation, and deposition<br />
<strong>of</strong> hyaloclastites [e.g., Walton and Schiffman,<br />
2003]. In particular, the rounded sideromelane<br />
grains deposited in the volcaniclastic basin at Hilina<br />
Bench indicate that palagonitization must have<br />
occurred later (i.e., after transport) than the initial<br />
eruption and deposition <strong>of</strong> hyaloclastite. These<br />
samples have been buried; burial‐diagenesis is the<br />
likely source <strong>of</strong> thermal energy to drive palagonitization<br />
at these localities. Walton and Schiffman<br />
[2003] attributed the high degree <strong>of</strong> palagonitization<br />
observed near the bottom <strong>of</strong> the core to be the<br />
result <strong>of</strong> burial‐diagenesis. Presumably, as samples<br />
at submarine volcaniclastic localities underwent<br />
progressive burial (initial porosity loss, decrease in<br />
w/r), the temperature would have been relatively<br />
low; for example at HSDP palagonitization occurred<br />
at approximately 15°C [Walton and Schiffman,<br />
2003]. The rate <strong>of</strong> palagonitization would be<br />
expected to have been relatively low, but the duration<br />
<strong>of</strong> palagonitization might have been relatively<br />
long; Walton and Schiffman [2003] estimated that<br />
100 mm thick palagonitized hyaloclastite rinds<br />
developed over a 5000‐year interval in their HSDP<br />
samples. These factors in combination would be<br />
expected to produce the observed relatively high<br />
palagonitiation extent, smooth, complete palagonitized<br />
rinds, relatively low water content, and relatively<br />
high REE enrichment in all <strong>of</strong> these samples.<br />
[34] Hydrothermal palagonitization. On the other<br />
hand, palagonitization <strong>of</strong> the seafloor volcanic,<br />
phreatomagmatic, and subglacial volcanic samples<br />
is known or inferred to have occurred essentially<br />
syn‐eruptively or relatively shortly thereafter. The<br />
relatively high temperatures associated with the<br />
volcanic activity at these localities would be<br />
expected to establish a potentially vigorous hydrothermal<br />
system, flushing heated fluid through the<br />
relatively porous volcanic edifice. Palagonitization<br />
at these environments would be expected to have<br />
occurred at a higher rate (presumably due to the<br />
active hydrothermal system) as compared to palagonitization<br />
in submarine environments. For example<br />
at the surface <strong>of</strong> Surtsey, Jakobsson and Moore<br />
[1986] and Jakobsson et al. [2000] mapped rapid<br />
palagonitization (advancement <strong>of</strong> consolidated<br />
tephra areas visible during annual field visits) that<br />
was dependent on the volcano’s hydrothermal system.<br />
Palagonitization duration at these localities<br />
would be expected to be relatively short compared to<br />
that expected for submarine volcaniclastic systems,<br />
due to dependence on the longevity <strong>of</strong> the volcanic<br />
heat source. Palagonitized samples from these<br />
environments therefore would be expected to be<br />
distinguishable from submarine volcaniclastic samples<br />
in terms <strong>of</strong> palagonitized rind texture (relatively<br />
thin, less well‐developed), zeolite abundance (relatively<br />
low). Palagonitization extents for these samples<br />
would be expected to be relatively low,<br />
resulting in higher water contents as was generally<br />
observed.<br />
[35] Of special note however are the rind textures<br />
(complete and fairly smooth), zeolite abundances<br />
(high; Table 2), and palagonitization extents (high;<br />
Table 2) for the Ingólfsfjall (subglacial volcanic) and<br />
Pahvant Butte (lacustrine phreatomagmatic) samples;<br />
in terms <strong>of</strong> these parameters, these samples resemble<br />
submarine volcaniclastic samples. The observed<br />
greater palagonitization extent observed for these<br />
samples potentially could be due to exceptionally<br />
long palagonitization duration or exceptionally high<br />
palagonitization temperatures. Another possibility is<br />
a second stage <strong>of</strong> palagonitization that could occur in<br />
seafloor volcanic, marine phreatomagmatic, and<br />
subglacial volcanic environments due to subsequent<br />
burial‐diagenesis <strong>of</strong> the volcanic edifice. Jakobsson<br />
and Gudmundsson [2008] found that hydrothermal<br />
activity caused tephra palagonitization and consolidation<br />
<strong>of</strong> the edifices during the first years after the<br />
eruptions <strong>of</strong> Surtsey (1963–1967) and Gjálp (1996),<br />
but that alteration and consolidation <strong>of</strong> the outer<br />
slopes likely occurs over thousands <strong>of</strong> years and is<br />
mainly a diagenetic process. In summary, burialdiagenesis<br />
and hydrothermal palagonitization styles<br />
are distinguishable based on palagonitized rind<br />
petrographical and in situ analytical observations,<br />
however care must be taken interpreting the palagonitization<br />
<strong>of</strong> samples from seafloor volcanic,<br />
phreatomagmatic, and subglacial volcanic environments.<br />
Unambiguous distinction <strong>of</strong> palagonitization<br />
style requires additional information regarding<br />
the potential occurrence <strong>of</strong> post‐eruptive burialdiagenesis<br />
in these environments.<br />
5.9. Formation and Evolution<br />
<strong>of</strong> Alteration Layers<br />
[36] Palagonitization arguably must begin at the<br />
outer margin <strong>of</strong> fresh sideromelane shards, where<br />
initially sideromelane is in contact with fluid and<br />
begins to dissolve, and then proceed inward with<br />
21 <strong>of</strong> 26
Geochemistry<br />
Geophysics<br />
Geosystems G 3 PAULY ET AL.: GEOCHEMICAL CONTROLS ON PALAGONITIZATION 10.1029/2011GC003639<br />
Figure 14. Schematic model depicting evolution and migration <strong>of</strong> sideromelane alteration layers. Arrows indicate<br />
evolution direction <strong>of</strong> the gel‐palagonite and phyllosilicate alteration layers with time. The contact between the phyllosilicate<br />
and gel‐palagonite layers likely is gradational (purple area). The observed SiO 2 ,Al 2 O 3 , and CaO (mobile)<br />
and Zr, Nb, Sc, La, Nd (immobile) concentration gradients are consistent with progressive sideromelane dissolution<br />
with time, however the observed MgO (mobile element) concentration gradient is not. The MgO concentration gradient<br />
is consistent with the syn‐ and/or post palagonitization development <strong>of</strong> a phyllosilicate (e.g., smectite) layer,<br />
forming as a consequence <strong>of</strong> the progressive evolution <strong>of</strong> the gel‐palagonite layer to equilibrium with the fluid.<br />
The inferred degree <strong>of</strong> development <strong>of</strong> smectite is highest at the fluid boundary.<br />
time; Walton and Schiffman [2003] showed this to<br />
be true for samples <strong>of</strong> palagonitized hyaloclastite<br />
from HSDP. The observed palagonite REE concentration<br />
gradients in the present study (Figures 9<br />
and S1) suggest therefore that REE concentration<br />
changes with time. This finding contrasts with<br />
Daux et al. [1994], who found that changes in<br />
palagonite REE concentration are independent <strong>of</strong><br />
reaction progress. Because we have found that the<br />
REEs are immobile during palagonitization, mobileelement<br />
mass loss must be greatest at the outer<br />
palagonitized margin, and decrease inward toward<br />
sideromelane. Furthermore, dissolution must continue<br />
behind the palagonitization front in order to account<br />
for the observed REE concentration gradients.<br />
[37] Because MgO was found to be highly mobile<br />
(Table 7), the observed MgO concentration gradients<br />
(decreasing through palagonite toward sideromelane;<br />
Figures 12 and S3) are inconsistent<br />
(opposite direction <strong>of</strong>) with gradients that would be<br />
expected due to cumulative dissolution with time ‐<br />
the MgO concentration gradients do not record<br />
sideromelane dissolution. Rather, they are consistent<br />
with syn‐ and/or post‐palagonitization conversion<br />
<strong>of</strong> gel‐palagonite to phyllosilicate (e.g.,<br />
smectite), beginning at the outer palagonitized<br />
margin and proceeding inward toward sideromelane<br />
with time. Valle et al. [2010] documented the formation<br />
and inward‐thickening with time <strong>of</strong> a phyllosilicate<br />
layer at the outer margin <strong>of</strong> gel‐palagonite<br />
layers that developed on synthetic borosilicate<br />
(nuclear waste containment) glass, and these workers<br />
suggest that similar behavior during alteration <strong>of</strong><br />
natural sideromelane would be expected. A schematic<br />
model depicting the evolution and migration<br />
<strong>of</strong> alteration layers in this framework is given in<br />
Figure 14. Valle et al. [2010] concluded that the gel<br />
(leached) layer developed on borosilicate glass surfaces<br />
is not at equilibrium with the solution,<br />
implying that this layer evolves with time. Honnorez<br />
[1967, 1972, 1978] and Stroncik and Schmincke<br />
[2001] concluded that the ultimate fate <strong>of</strong> gelpalagonite<br />
is conversion to smectite, and Drief and<br />
Schiffman [2004] documented both amorphous and<br />
crystalline areas within the outer palagonitized<br />
margins <strong>of</strong> natural sideromelane samples. The MgO<br />
concentration gradients within palagonites observed<br />
in the present study are consistent with these previous<br />
studies, and likely represent the continuing<br />
22 <strong>of</strong> 26
Geochemistry<br />
Geophysics<br />
Geosystems G 3 PAULY ET AL.: GEOCHEMICAL CONTROLS ON PALAGONITIZATION 10.1029/2011GC003639<br />
evolution (conversion) <strong>of</strong> the gel‐palagonite layer<br />
toward a phyllosilicate layer, which would be<br />
expected to be approaching equilibrium with the<br />
fluid.<br />
6. Conclusions<br />
[38] 1. Palagonite water content decreases with<br />
increasing palagonitization extent, likely due to<br />
recrystallization <strong>of</strong> palagonite into smectite.<br />
[39] 2. Palagonitization extent varies inversely with<br />
original sample porosity, confirming that porosity<br />
(i.e., associated permeability) is an important controlling<br />
factor <strong>of</strong> palagonitization; however, other<br />
factors are also important.<br />
[40] 3. Zr, Nb, Sc, and REE concentrations in<br />
palagonite and sideromelane plot along isocon<br />
lines, indicating that these elements are immobile<br />
during palagonitization.<br />
[41] 4. Large major‐element mass changes indicate<br />
that palagonitization entails extensive dissolution<br />
and creation <strong>of</strong> microporosity, and therefore cannot<br />
be considered an isovolumetric process, as has<br />
been assumed previously by many workers.<br />
[42] 5. Major‐element mass changes due to palagonitization<br />
for SiO 2 ,Al 2 O 3 , and in particular TiO 2<br />
and FeO depend on the subalkaline versus alkaline<br />
character <strong>of</strong> the sideromelane.<br />
[43] 6. Original sideromelane composition is an<br />
important control <strong>of</strong> palagonite composition.<br />
Therefore it is necessary to take original sideromelane<br />
composition (and resulting expected<br />
mass loss for specific elements) into account when<br />
calculating estimates <strong>of</strong> global seawater cation flux.<br />
[44] 7. Subalkaline sideromelane appears to dissolve<br />
at a much higher rate than alkaline sideromelane<br />
during palagonitization.<br />
[45] 8. Two distinct palagonitization styles, burialdiagenetic<br />
and hydrothermal, are recognized.<br />
[46] 9. Observed palagonite REE concentration<br />
gradients indicate that sideromelane dissolution<br />
continues in the zone behind the advancing palagonitization<br />
front.<br />
[47] 10. Observed palagonite MgO concentration<br />
gradients appear to reflect the early stages <strong>of</strong> synand/or<br />
post‐palagonitization conversion <strong>of</strong> the gelpalagonite<br />
layer to a phyllosilicate (e.g., smectite)<br />
layer, consistent with the evolution <strong>of</strong> sideromelane<br />
alteration layers toward equilibrium with the surrounding<br />
fluid.<br />
Acknowledgments<br />
[48] Michelle Coombs, Mike Garcia, and Don Thomas graciously<br />
provided some <strong>of</strong> the samples used in this study, as well<br />
as thoughtful discussions. José Honnorez provided the Palagonia<br />
sample. Roy Bailey and James White provided very helpful<br />
field guidance at Black Point and Pahvant Butte, respectively.<br />
Svienn Jakobsson and The Surtsey Committee granted access<br />
to Surtsey, and Hjalti Franzson supported and participated in<br />
the Iceland fieldwork. Tony Walton and Jim Moore provided<br />
very useful discussion support. Jake Lowenstern provided lab<br />
access and guidance for the reflected‐light FTIR measurements.<br />
Alicé <strong>Davis</strong> provided expert assistance with petrographic imaging;<br />
Norm Winter and Greg Baxter provided thin section sample<br />
preparation. Sarah Roeske and Brian Joy were <strong>of</strong> tremendous<br />
help during the extensive electron microprobe sessions, and<br />
Michelle Gras was equally helpful in the laser‐ablation ICPMS<br />
lab. This work was supported by NSF‐EAR grant 0125666. The<br />
authors thank José Honnorez and Tony Walton for very helpful<br />
reviews <strong>of</strong> the initial manuscript.<br />
References<br />
Bau, M., and A. Koschinsky (2009), Oxidative scavenging <strong>of</strong><br />
cerium on hydrous Fe oxide: Evidence from the distribution<br />
<strong>of</strong> rare earth elements and yttrium between Fe oxides and Mn<br />
oxides in hydrogenetic ferromanganese crusts, Geochem. J.,<br />
43, 37–47.<br />
Bednarz, U., and H.‐U. Schmincke (1989), Mass transfer during<br />
sub‐seafloor alteration <strong>of</strong> the upper Troodos crust (Cyprus),<br />
Contrib. Mineral. Petrol., 102, 93–101, doi:10.1007/<br />
BF01160193.<br />
Benson, L. V., S. P. Lund, J. W. Burdett, M. Kashgarian, T. P.<br />
Rose, J. P. Smoot, and M. Schwartz (1998), Correlation<br />
<strong>of</strong> Late‐Pleistocene lake‐level oscillation in Mono Lake,<br />
<strong>California</strong>, with North Atlantic climate events, Quat. Res.,<br />
49, 1–10, doi:10.1006/qres.1997.1940.<br />
Bishop, J. L., P. Schiffman, and R. Southard (2002), Geochemical<br />
and mineralogical analyses <strong>of</strong> palgonitic tuffs and altered<br />
rinds on pillow basalts in Iceland and applications to Mars, in<br />
Volcano‐Ice Interaction on Earth and Mars, editedbyJ.L.<br />
Smellie and M. G. Chapman, Geol. Soc. Spec. Publ., 202,<br />
371–392.<br />
Clague, D. A., R. T. Holcomb, J. M. Sinton, R. S. Detrick, and<br />
M. E. Torresan (1990), Pliocene and Pleistocene alkalic flood<br />
basalts on the seafloor north <strong>of</strong> the Hawaiian islands, Earth<br />
Planet. Sci. Lett., 98, 175–191, doi:10.1016/0012-821X(90)<br />
90058-6.<br />
Clague, D. A., K. Uto, K. Satake, and A. S. <strong>Davis</strong> (2002),<br />
Eruption style and flow <strong>of</strong> emplacement in the submarine<br />
North Arch Volcanic Field, Hawaii, in Hawaii Volcanoes<br />
Deep Underwater Perspectives, Geophys. Monogr. Ser.,<br />
vol. 128, edited by E. Takahashi et al. pp. 65–84, AGU,<br />
Washington D. C.<br />
Clague, D. A., J. B. Paduan, W. C. McIntosh, B. L. Cousens,<br />
A. S. <strong>Davis</strong>, and J. R. Reynolds (2006), A submarine perspective<br />
<strong>of</strong> the Honolulu volcanics, Oahu, J. Volcanol.<br />
Geotherm. Res., 151, 270–307.<br />
Clague, D. A., J. B. Paduan, R. A. Duncan, J. J. Huard, A. S.<br />
<strong>Davis</strong>, P. R. Castillo, P. Lonsdale, and A. DeVogelaere<br />
(2009), Five million years <strong>of</strong> compositionally diverse, episodic<br />
volcanism: Construction <strong>of</strong> Davidson Seamount atop<br />
23 <strong>of</strong> 26
Geochemistry<br />
Geophysics<br />
Geosystems G 3 PAULY ET AL.: GEOCHEMICAL CONTROLS ON PALAGONITIZATION 10.1029/2011GC003639<br />
an abandoned spreading center, Geochem. Geophys. Geosyst.,<br />
10, Q12009, doi:10.1029/2009GC002665.<br />
Cockell, C., and A. Herrera (2008), Why are some microorganisms<br />
boring?, Trends Microbiol., 16(3), 101–106, doi:10.1016/<br />
j.tim.2007.12.007.<br />
Coombs, M. L., T. W. Sisson, and P. W. Lipman (2006),<br />
Growth history <strong>of</strong> Kilauea inferred from volatile concentrations<br />
in submarine‐collected basalts, J. Volcanol. Geotherm.<br />
Res., 151, 19–49, doi:10.1016/j.jvolgeores.2005.07.037.<br />
Crovisier, J. L., J. Honnorez, and J. P. Eberhart (1987), Dissolution<br />
<strong>of</strong> basaltic glass in seawater; mechanism and rate,<br />
Geochim. Cosmochim. Acta, 51, 2977–2990, doi:10.1016/<br />
0016-7037(87)90371-1.<br />
Crovisier, J. L., J. Honnorez, B. Fritz, and J. C. Petit (1992),<br />
Dissolution <strong>of</strong> subglacial volcanic glasses from Iceland: Laboratory<br />
study and modeling, Appl. Geochem. Suppl., Issue,<br />
7, 55–81.<br />
Crovisier, J. L., T. Advocat, and J. L. Dussossoy (2003), Nature<br />
and role <strong>of</strong> natural alteration gels formed on the surface <strong>of</strong><br />
ancient volcanic glasses (natural analogs <strong>of</strong> waste containment<br />
glasses), J. Nucl. Mater., 321, 91–109, doi:10.1016/<br />
S0022-3115(03)00206-X.<br />
Daux, V., J. L. Crovisier, C. Hemond, and J. C. Petit (1994),<br />
Geochemical evolution <strong>of</strong> basaltic rocks subjected to weathering:<br />
Fate <strong>of</strong> the major elements, rare earth elements, and<br />
thorium, Geochim. Cosmochim. Acta, 58, 4941–4954,<br />
doi:10.1016/0016-7037(94)90223-2.<br />
<strong>Davis</strong>, A. S., and D. A. Clague (2003), Hyaloclastite from miocene<br />
seamounts <strong>of</strong>fshore central <strong>California</strong>: Compositions,<br />
eruption styles, and depositional processes, in Explosive Subaqueous<br />
Volcanism, Geophys. Monogr. Ser., vol. 140, edited<br />
by J. D. L. White, J. L. Smellie, and D. A. Clague, pp. 129–142,<br />
AGU, Washington D. C.<br />
<strong>Davis</strong>, A. S., and D. A. Clague (2006), Volcaniclastic deposits<br />
from the North Arch volcanic field, Hawaii: Explosive fragmentation<br />
<strong>of</strong> alkalic lava at abyssal depths, Bull. Volcanol.,<br />
68, 294–307.<br />
<strong>Davis</strong>, A. S., D. A. Clague, W. A. Bohrson, G. B. Dalrymple,<br />
and H. G. Greene (2002), Seamounts at the continental margin<br />
<strong>of</strong> <strong>California</strong>: A different kind <strong>of</strong> oceanic intraplate volcanism,<br />
Geol. Soc. Am. Bull., 114, 316–333, doi:10.1130/<br />
0016-7606(2002)1142.0.CO;2.<br />
Drief, A., and P. Schiffman (2004), Very low temperature<br />
alteration <strong>of</strong> sideromelane in hyaloclastites and hyalotuffs<br />
from Kilauea and Mauna Loa volcanoes: Implications for<br />
the mechanism <strong>of</strong> palagonite formation, Clays Clay Miner.,<br />
52, 623–635.<br />
Eggleton, R. A., and J. Keller (1982), The palagonitization <strong>of</strong><br />
limburgite glass: A TEM study, Neues. Jahrb. Mineral.<br />
Montash., 7, 321–336.<br />
Fisher, R. V., and H.‐U. Schmincke (1984), Alteration <strong>of</strong> volcanic<br />
glass, in Pyroclastic Rocks, pp. 312–345, Springer,<br />
New York.<br />
Furnes, H. (1984), Chemical changes during progressive subaerial<br />
palagonitization <strong>of</strong> a subglacial olivine tholeiite hyaloclastite;<br />
a microprobe study, Chem. Geol., 43, 271–285,<br />
doi:10.1016/0009-2541(84)90054-8.<br />
Furnes, H., H. Staudigel, I. H. Torseth, K. Muehlenbachs, and<br />
O. Tumyr (2001), Bioalteration <strong>of</strong> basaltic glass in the oceanic<br />
crust, Geochem. Geophys. Geosyst., 2(8), 1049, doi:10.1029/<br />
2000GC000150.<br />
Furnes,H.,I.H.Thorseth,T.Torsvik,K.Muehlenbachs,<br />
H. Staudigel, and O. Tumyr (2002), Identifying bio‐interaction<br />
with basaltic glass in oceanic crust and implications for estimating<br />
the depth <strong>of</strong> oceanic lithosphere: A review, in Volcano‐Ice<br />
Interaction on Earth and Mars, editedbyJ.L.Smellieand<br />
M. G. Chapman, Geol. Soc. Spec. Publ., 202, 407–421.<br />
Furnes, H., N. R. Banerjee, H. Saudigel, K. Muehlenbachs,<br />
N. McLoughlin, M. de Wit, and M. Van Kranendonk<br />
(2007), Comparing petrographic signatures <strong>of</strong> bioalteration<br />
in recent to Mesoarchean pillow lavas: Tracing subsurface life<br />
in oceanic igneous rocks, Precamb. Res., 158, 156–176.<br />
Garcia, M. O., E. H. Haskins, E. M. Stolper, and M. Baker (2007),<br />
Stratigraphy <strong>of</strong> the Hawai’i Scientific Drilling Project core<br />
(HSDP2), Anatomy <strong>of</strong> a Hawaiian shield volcano, Geochem.<br />
Geophys. Geosyst., 8, Q02G20, doi:10.1029/2006GC001379.<br />
Grant, J. A. (1986), The isocon diagram–A simple solution to<br />
Gresens’ equation for metasomatic alteration, Econ. Geol.,<br />
81, 1976–1982, doi:10.2113/gsecongeo.81.8.1976.<br />
Grzechnik, A., H. D. Zimmermann, P. L. King, P. F. McMillan,<br />
and R. L. Hervig (1996), FTIR micro‐reflectance measurements<br />
<strong>of</strong> the CO 3 2− ion content in basanite and leucite glasses,<br />
Contrib. Mineral. Petrol., 125, 311–318, doi:10.1007/<br />
s004100050224.<br />
Hay, R. L., and A. Iijima (1968a), Nature and origin <strong>of</strong> palagonite<br />
tuffs <strong>of</strong> the Honolulu Group, on Oahu, Hawaii, in Studies<br />
in Volcanology: A Memoir in Honor <strong>of</strong> Howell Williams,<br />
Mem. Geol. Soc. <strong>of</strong> Am., 116, 331–376.<br />
Hay, R. L., and A. Iijima (1968b), Petrology <strong>of</strong> palagonite tuffs<br />
<strong>of</strong> Koko Craters, Oahu, Hawaii, Contrib. Mineral. Petrol., 17,<br />
141–154.<br />
Heiken, G. H., R. V. Fisher, and N. V. Peterson (1981), A field<br />
trip to the maar volcanoes <strong>of</strong> the Fort Rock—Christmas Lake<br />
Valley basin, Oregon, in Guides to Some Volcanic Terranes in<br />
Washington, Idaho, Oregon, and Northern <strong>California</strong>, U.S.<br />
Geol. Surv. Circ., 838, 119–140.<br />
Hein, J. R., A. Koschinsky, P. E. Halbach, F. T. Manheim,<br />
M. Bau, J. K. Kang, and N. Lubick (1997), Iron and manganese<br />
oxide mineralization in the Pacific, in Manganese Mineralization:<br />
Geochemistry and Mineralogy <strong>of</strong> Terrestrial and<br />
Marine Deposits, edited by K. Nicholson et al., Geol. Soc.<br />
Spec. Publ., 119, 123–138.<br />
Honnorez, J. (1967), La palagonitisation, l’alteration sousmarine<br />
du verre volcanique basique de palagonia (Sicile),<br />
Ph.D. thesis, Univ. Libre de Bruxelles, Brussels.<br />
Honnorez, J. (1972), La Palagonitisation, l’Alteration Sous‐<br />
Marine du Verre Volcanique Basique de Palagonia (Sicile),<br />
131 pp., Birkhaüser, Stuttgart, Germany.<br />
Honnorez, J. (1978), Generation <strong>of</strong> phillipsites by palagonitization<br />
<strong>of</strong> basaltic glass in seawater and the origin <strong>of</strong> K‐rich<br />
deep‐sea deposits, in Natural Zeolites, Occurrence, Properties,<br />
Use, edited by L. B. Sand and F. A. Mumpton, pp. 245–258,<br />
Elsevier, New York.<br />
Jakobsson, S. P. (1972), On the consolidation and palagonitization<br />
<strong>of</strong> the tephra <strong>of</strong> the Surtsey volcanic island, Iceland,<br />
Surtsey Res. Program Rep., 6, 121–128.<br />
Jakobsson, S. P. (1978), Environmental factors controlling the<br />
palagonitization <strong>of</strong> the Surtsey tephra, Iceland, Bull. Geol.<br />
Soc. Den., 27, 91–105.<br />
Jakobsson, S. P., and M. T. Gudmundsson (2008), Subglacial<br />
and interglacial volcanic formations in Iceland, Joekull, 58,<br />
179–196.<br />
Jakobsson, S. P., and J. G. Moore (1986), Hydrothermal minerals<br />
and alteration rates at Surtsey volcano, Iceland, Geol. Soc.<br />
Am. Bull., 97, 648–659, doi:10.1130/0016-7606(1986)<br />
972.0.CO;2.<br />
Jakobsson, S. P., G. Gudmundsson, and J. G. Moore (2000), Geological<br />
monitoring <strong>of</strong> Surtsey, Icelend, 1967–1998, Surtsey<br />
Res. Program Rep., 11, 99–108.<br />
24 <strong>of</strong> 26
Geochemistry<br />
Geophysics<br />
Geosystems G 3 PAULY ET AL.: GEOCHEMICAL CONTROLS ON PALAGONITIZATION 10.1029/2011GC003639<br />
Jensen, R. A. (1995), Roadside Guide to the Geology <strong>of</strong> Newberry<br />
Volcano, CenOreGeoPub, Bend, Oreg.<br />
Jercinovic,M.J.,K.Keil,M.R.Smith,andR.A.Schmitt<br />
(1990), Alteration <strong>of</strong> basltic glasses from north‐central<br />
British Columbia, Canada, Geochim. Cosmochim. Acta, 54,<br />
2679–2696, doi:10.1016/0016-7037(90)90004-5.<br />
Kimura, J.‐I., T. W. Sisson, N. Nakano, M. L. Coombs, and<br />
P. W. Lipman (2006), Isotope geochemistry <strong>of</strong> early Kilauea<br />
magmas from the submarine Hilina Bench: The nature <strong>of</strong> the<br />
Hilina mantle component, J. Volcanol. Geotherm. Res., 151,<br />
51–72, doi:10.1016/j.jvolgeores.2005.07.024.<br />
King, P. L., J. F. Larsen, D. K. Lui, J. Lockard, K. Dalby, and<br />
T. Griffin (2006), Rapid analysis <strong>of</strong> total H 2 O and molecular<br />
H 2 O contents <strong>of</strong> small geologic glasses using reflectance IR<br />
spectroscopy, Geol. Assoc. Can. Abstr. Program, 31, 77–78.<br />
Koschinsky, A., and J. Hein (2003), Uptake <strong>of</strong> elements from<br />
seawater by ferromanganese crusts: Solid‐phase associations<br />
and seawater speciation, Mar. Geol., 198, 331–351, doi:10.1016/<br />
S0025-3227(03)00122-1.<br />
Le Gal, X., J. L. Crovisier, F. Gauthier‐Lafaye, J. Honnorez,<br />
and B. Grambow (1999), Meteoric alteration <strong>of</strong> Icelandic<br />
volcanic glass: Long term changes in the mechanism, C. R.<br />
Acad. Sci., Ser. IIa Sci. Terre Planetes, 329, 175–181.<br />
Lipman, P. W., T. W. Sisson, U. Tadahide, J. Naka, and J. R.<br />
Smith (2002), Ancestral submarine growth <strong>of</strong> Kïlauea volcano<br />
and instability <strong>of</strong> its south flank, in Hawaiian Volcanoes:<br />
Deep Underwater Perspectives, Geophys. Monogr. Ser.,<br />
vol. 128, edited by E. Takahashi et al., pp. 161–191, AGU,<br />
Washington, D. C.<br />
Lipman, P., T. Sisson, M. Coombs, and J.‐I. Kimura (2006),<br />
Piggyback tectonics: Long‐term growth <strong>of</strong> Kilauea on the<br />
south flank <strong>of</strong> Mauna Loa, J. Volcanol. Geotherm. Res.,<br />
151, 73–108, doi:10.1016/j.jvolgeores.2005.07.032.<br />
Mattsson, H., and A. Höskuldsson (2003), Geology <strong>of</strong> the<br />
Heimaey volcanic centre, south Iceland: Early evolution <strong>of</strong> a<br />
central volcano in a propagating rift?, J. Volcanol. Geotherm.<br />
Res., 127, 55–71, doi:10.1016/S0377-0273(03)00178-1.<br />
McDonough, W. F., and S.‐S. Sun (1995), The composition <strong>of</strong><br />
the Earth, Chem. Geol., 120, 223–253, doi:10.1016/0009-<br />
2541(94)00140-4.<br />
Moore, G., A. Chizmeshya, and P. F. McMillan (2000), Calibration<br />
<strong>of</strong> a reflectance FTIR method for determination <strong>of</strong><br />
dissolved CO 2 concentration in rhyolitic glasses, Geochim.<br />
Cosmochim. Acta, 64(20), 3571–3579, doi:10.1016/S0016-<br />
7037(00)00447-6.<br />
Moore, J. G. (1966), Rate <strong>of</strong> palagonitization <strong>of</strong> submarine<br />
basalt adjacent to Hawaii, U.S. Geol. Surv. Pr<strong>of</strong>. Pap.,<br />
550D, 163–171.<br />
Moore, J. G., D. J. Fornari, and D. Clague (1985), Basalts<br />
from the 1887 submarine eruption <strong>of</strong> Mauna Loa, Hawaii:<br />
New data on the variation <strong>of</strong> palagonitization rate with temperature,<br />
U.S. Geol. Surv. Bull., 1163, 11 pp.<br />
Novak, E. A., and S. R. Evans (1991), Preliminary results from<br />
two scientific observation holes on the Kilauea East Rift<br />
Zone, Trans. Geotherm. Resour. Counc., 15, 187–192.<br />
Oviatt, C. G., and W. P. Nash (1989), Late Pleistocene basaltic<br />
ash and volcanic eruptions in the Bonneville basin, Utah,<br />
Geol. Soc. Am. Bull., 101, 292–303, doi:10.1130/0016-<br />
7606(1989)1012.3.CO;2.<br />
Pauly, B. D. (2011), In situ micro‐analytical investigations <strong>of</strong><br />
palagonitization, Ph.D. dissertation, 1779 pp., Univ. <strong>of</strong><br />
Calif., <strong>Davis</strong>, Calif.<br />
Saemundsson, K., H. Jóhannesson, Á. Hjartarson, S. Gardar<br />
Kristinsson, and M. Á. Sigurgeirsson (2010), Geological Map<br />
<strong>of</strong> Southwest Iceland, 1:100000, Icel. GeoSurvey, Reykjavík.<br />
Schiffman, P., and S. Roeske (2002), Electron microprobe<br />
analysis <strong>of</strong> minerals, in Encyclopedia <strong>of</strong> Physical Sciences<br />
and Technology, vol. 5, pp. 293–306, Academic, San Diego,<br />
Calif.<br />
Schiffman, P., A. W. Walton, N. Thompson, and R. J. Watters<br />
(2006), Hyaloclastite alteration and slope stability <strong>of</strong> Hawaiian<br />
volcanoes: Insights from the Hawaiian Scientific Driling<br />
Project’s 3‐km drill core, J. Volcanol. Geotherm. Res., 151,<br />
217–228, doi:10.1016/j.jvolgeores.2005.07.030.<br />
Sisson, T. W., P. W. Lipman, and J. Naka (2002), Submarine<br />
alkalic through tholeiitic shield‐stage development <strong>of</strong><br />
Kīlauea volcano, Hawai’i, in Hawaiian Volcanoes: Deep<br />
Underwater Perspectives, Geophys. Monogr. Ser., vol.128,<br />
edited by E. Takahashi et al., pp. 193–219, AGU, Washington,<br />
D. C.<br />
Staudigel, H., and H. Furnes (2004), Microbial mediation <strong>of</strong><br />
oceanic crust alteration, in Hydrology <strong>of</strong> the Oceanic Lithosphere,<br />
edited by E. <strong>Davis</strong> and H. Elderfield, pp. 608–626,<br />
Cambridge Univ. Press, Cambridge, U. K.<br />
Staudigel, H., and S. R. Hart (1983), Alteration <strong>of</strong> basaltic<br />
glass: Mechanisms and significance for the oceanic crustseawater<br />
budget, Geochim. Cosmochim. Acta, 47, 337–350,<br />
doi:10.1016/0016-7037(83)90257-0.<br />
Staudigel, H., H. Furnes, K. Kelley, Y. Plank, K. Muehlenbachs,<br />
B. Tebo, and A. Yayanos (2004), The oceanic crust as a bioreactor,<br />
in Deep Subsurface Biosphere at Mid‐Ocean Ridges,<br />
Geophys. Monogr. Ser., vol.144,editedbyW.S.Wilcock<br />
et al., pp. 325–341, AGU, Washington, D. C.<br />
Staudigel, H., H. Furnes, N. R. Banerjee, Y. Dilek, and<br />
K. Muehlenbachs (2006), Microbes and volcanoes: A tale<br />
from the oceans, ophiolites and greenstone belts, GSA Today,<br />
16, 4–10, doi:10.1130/GSAT01610A.1.<br />
Staudigel, H., H. Furnes, N. McLoughlin, N. R. Banerjee,<br />
L. B. Connell, and A. Templeton (2008), 3.5 billion years<br />
<strong>of</strong> glass bioalteration: Volcanic rocks as a basis for microbial<br />
life?, Earth Sci. Rev., 89, 156–176, doi:10.1016/j.earscirev.<br />
2008.04.005.<br />
Stroncik, N. A., and H.‐U. Schmincke (2001), Evolution <strong>of</strong><br />
palagonite: Crystallization, chemical changes, and element<br />
budget, Geochem. Geophys. Geosyst., 2(7), 1017,<br />
doi:10.1029/2000GC000102.<br />
Thorarinsson, S., T. Einarsson, G. E. Sigvaldson, and G. Elisson<br />
(1964), The submarine eruption <strong>of</strong>f the Westman Islands,<br />
1963–64, Bull. Volcanol., 27, 435–445, doi:10.1007/<br />
BF02597544.<br />
Thorseth, I. H., H. Furnes, and O. Tumyr (1991), A textural<br />
and chemical study <strong>of</strong> Icelandic palagonite <strong>of</strong> varied composition<br />
and its bearing on the mechanism <strong>of</strong> the glass‐palagonite<br />
transformation, Geochim. Cosmochim. Acta, 55, 731–749,<br />
doi:10.1016/0016-7037(91)90337-5.<br />
Thorseth, I. H., H. Furnes, and M. Heldal (1992), The importance<br />
<strong>of</strong> microbiological activity in the alteration <strong>of</strong> natural<br />
basaltic glass, Geochim. Cosmochim. Acta, 56, 845–850,<br />
doi:10.1016/0016-7037(92)90104-Q.<br />
Trusdell, F. A., E. Novak, S. R. Evans, and K. Okano (1999),<br />
Core lithology from the State <strong>of</strong> Hawaii Scientific Observation<br />
Hole 1, Kilauea Volcano, Hawai’i, U.S. Geol. Surv.<br />
Open File Rep., 99‐389.<br />
Valle, N., A. Verney‐Carron, J. Sterenich, G. Libourel,<br />
E. Deloule, and P. Jollivet (2010), Elemental and isotopic<br />
( 29 Si and 18 O) tracing <strong>of</strong> glass alteration mechanisms, Geochim.<br />
Cosmochim. Acta, 74, 3412–3431, doi:10.1016/j.gca.2010.<br />
03.028.<br />
van Achterbergh, E., C. Ryan, S. Jackson, and W. Griffin<br />
(2001), Data reduction s<strong>of</strong>tware for LA‐ICP‐MS, in Laser<br />
25 <strong>of</strong> 26
Geochemistry<br />
Geophysics<br />
Geosystems G 3 PAULY ET AL.: GEOCHEMICAL CONTROLS ON PALAGONITIZATION 10.1029/2011GC003639<br />
Ablation ICPMS in the Earth Sciences: Principles and Applications,editedbyPaulSylvester,Short<br />
Course Handb. Mineral.<br />
Assoc. Can., 29, 239–243.<br />
Walton, A. W. (2008), Microtubules in basalt glass from<br />
Hawaii Scientific Drilling Project #2 phase 1 core and Hilina<br />
slope, Hawaii: Evidence <strong>of</strong> the occurrence and behavior <strong>of</strong><br />
endolithic microorganisms, Geobiology, 6, 351–364,<br />
doi:10.1111/j.1472-4669.2008.00149.x.<br />
Walton, A. W., and P. Schiffman (2003), Alteration <strong>of</strong> hyaloclastites<br />
in the HSDP 2 Phase 1 Drill Core 1. Description and<br />
paragenesis, Geochem. Geophys. Geosyst., 4(5), 8709,<br />
doi:10.1029/2002GC000368.<br />
Walton, A. W., P. Schiffman, and G. L. Macpherson (2005),<br />
Alteration <strong>of</strong> hyaloclastites in the HSDP 2 Phase 1 Drill<br />
Core: 2. Mass balance <strong>of</strong> the conversion <strong>of</strong> sideromelane<br />
to palagonite and chabazite, Geochem. Geophys. Geosyst.,<br />
6, Q09G19, doi:10.1029/2004GC000903.<br />
White, J. D. L. (1996), Pre‐emergent construction <strong>of</strong> a lacustrine<br />
basaltic volcano, Pahvant Butte, Utah (USA), Bull. Volcanol.,<br />
58, 249–262, doi:10.1007/s004450050138.<br />
White, J. D. L. (2001), Eruption and reshaping <strong>of</strong> Pahvant<br />
Butte volcano in Pleistocene Lake Bonneville, Spec. Publ.<br />
Int. Assoc. Sedimentol., 30, 61–80.<br />
Winchell, H. (1947), Honolulu series, Oahu, Hawaii, Geol. Soc.<br />
Am. Bull., 58, 1–48, doi:10.1130/0016-7606(1947)58[1:<br />
HSOH]2.0.CO;2.<br />
Zhou, Z., and W. S. Fyfe (1989), Palagonitization <strong>of</strong> basaltic glass<br />
from DSDP Site 335, Leg 37: Textures, chemical‐composition,<br />
and mechanism <strong>of</strong> formation, Am. Mineral., 74, 1045–1053.<br />
26 <strong>of</strong> 26