Fence diagrams, page 1 Geology 109L Fence ... - MyGeologyPage
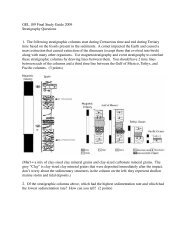
Fence diagrams, page 1 Geology 109L Fence ... - MyGeologyPage
Fence diagrams, page 1 Geology 109L Fence ... - MyGeologyPage

You also want an ePaper? Increase the reach of your titles
YUMPU automatically turns print PDFs into web optimized ePapers that Google loves.
<strong>Geology</strong> <strong>109L</strong><br />
<strong>Fence</strong> Diagrams and Isopach Maps<br />
<strong>Fence</strong> Diagrams<br />
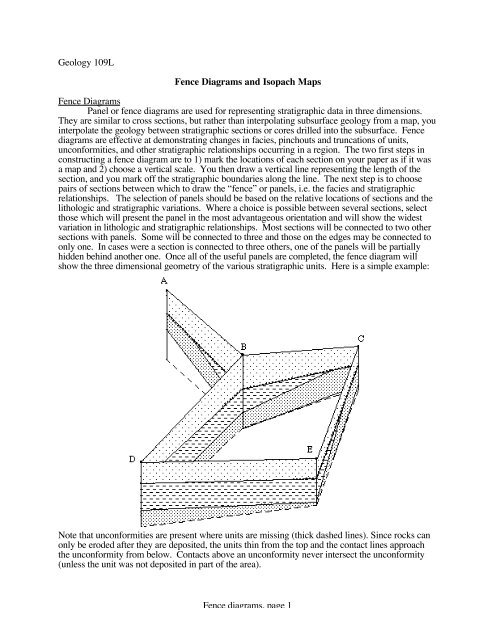
Panel or fence <strong>diagrams</strong> are used for representing stratigraphic data in three dimensions.<br />
They are similar to cross sections, but rather than interpolating subsurface geology from a map, you<br />
interpolate the geology between stratigraphic sections or cores drilled into the subsurface. <strong>Fence</strong><br />
<strong>diagrams</strong> are effective at demonstrating changes in facies, pinchouts and truncations of units,<br />
unconformities, and other stratigraphic relationships occurring in a region. The two first steps in<br />
constructing a fence diagram are to 1) mark the locations of each section on your paper as if it was<br />
a map and 2) choose a vertical scale. You then draw a vertical line representing the length of the<br />
section, and you mark off the stratigraphic boundaries along the line. The next step is to choose<br />
pairs of sections between which to draw the “fence” or panels, i.e. the facies and stratigraphic<br />
relationships. The selection of panels should be based on the relative locations of sections and the<br />
lithologic and stratigraphic variations. Where a choice is possible between several sections, select<br />
those which will present the panel in the most advantageous orientation and will show the widest<br />
variation in lithologic and stratigraphic relationships. Most sections will be connected to two other<br />
sections with panels. Some will be connected to three and those on the edges may be connected to<br />
only one. In cases were a section is connected to three others, one of the panels will be partially<br />
hidden behind another one. Once all of the useful panels are completed, the fence diagram will<br />
show the three dimensional geometry of the various stratigraphic units. Here is a simple example:<br />
Note that unconformities are present where units are missing (thick dashed lines). Since rocks can<br />
only be eroded after they are deposited, the units thin from the top and the contact lines approach<br />
the unconformity from below. Contacts above an unconformity never intersect the unconformity<br />
(unless the unit was not deposited in part of the area).<br />
<strong>Fence</strong> <strong>diagrams</strong>, <strong>page</strong> 1
Isopach Maps:<br />
A second good visualization tool for three dimensional stratigraphic reconstructions is a<br />
map of the thickness of a unit of interest, i.e. an isopach (same thickness) map. These maps consist<br />
of contours like a topographic map, but they represent the thickness of a unit rather than the<br />
elevation of the surface. Various other maps can be constructed. For example, the depth to a<br />
certain unit can be very useful. Sometimes % clay in a sandstone is useful, etc. They are all<br />
constructed by plotting the desired data on a base map and contouring it to identify systematic<br />
variations. This type of work is extremely common in both hydrology and resource exploration<br />
(gas, oil, metals, etc.), and you will hopefully see why as you work through this lab.<br />
The basic principles of contouring are simple. A contour is a line of constant value. The<br />
spacing of contours on a map reflects the steepness of a gradient or slope. The path of a contour is<br />
the expression of the variations on the surface that the contours represent. A group of equally<br />
spaced contour lines would represent an inclined plane, whereas concentric rings would denote a<br />
domal or basinal feature. There are, as with most techniques, a few rules to remember.<br />
1. A contour never crosses over itself or another contour because a single point can not have two<br />
values.<br />
2. Contours must not touch each other except where the gradient is VERY steep relative to your<br />
contour interval. For example, if you have two data points very close to each other with<br />
radically different values, the lines may touch. On a topographic map, points at the top and<br />
bottom of a cliff can have a very different elevation, but be at essentially the same place on<br />
the map. There are no points like this in this lab. Therefore, your contour lines must not<br />
touch each other.<br />
3. Where a slope or gradient reverses direction, as on a ridge or in a valley, the highest or lowest<br />
contour, respectively, must be repeated in map view; i.e., it forms a u-shape or a loop.<br />
4. Closed contours around small areas represent isolated values which are anomalous to the local<br />
slope or gradient. If the anomaly is lower than the normal gradient, the contour is<br />
characterized by short hachured lines pointing inward.<br />
Your Job:<br />
You have been hired to help a small city evaluate locations to place another water supply<br />
well. The city is built on a sequence of lacustrine and fluvial rocks in an area that was tectonically<br />
active. Due to previous tectonic activity, specifically regional tilting and folding, several<br />
unconformities are locally developed that truncate the potential aquifer. The city has hired you to<br />
map out target areas and depths for drilling. To site a good well, you will need a three dimensional<br />
picture of the subsurface distribution of the aquifer, creatively called Unit 6, as well as a map of its<br />
thickness to estimate potential water volume. In this case, thicker is better. Your job is to construct<br />
a fence diagram showing the distribution of all of the geological units, construct maps showing the<br />
depth to the top of Unit 6 and the thickness of Unit 6, and write a short report recommending<br />
potential drill sites.<br />
The following table shows 18 well sections, which are your sources of data. The wells that<br />
intersect Unit 6 at depths shallower than 1500 feet are already being used for water sources. You<br />
will need to recommend new locations where less data are available. Each well penetrates several or<br />
all ten units in the sequence of rocks. Luckily, the previous geologist accurately identified all of the<br />
units before being offered a much higher paying job elsewhere because of the skills she learned<br />
citing water wells when she was in your job. Unit 1 is the youngest and Unit 10 is the oldest. Unit<br />
10 consists of metamorphic rather than sedimentary rocks. An "X" in the table represents the<br />
formation in which the well started. Numbers in the columns represent the depths at which the top<br />
of each unit was encountered in feet (most wells in the US are still reported in feet!). Certain units<br />
are absent in some wells. There is no actual faulting in the region so all of the missing units are<br />
truncated against unconformities. Also, the previous geologist demonstrated that all of the units<br />
were initially deposited over the entire area.<br />
<strong>Fence</strong> <strong>diagrams</strong>, <strong>page</strong> 2
Well<br />
No.<br />
Unit<br />
1<br />
Unit<br />
2<br />
Unit<br />
3<br />
Unit<br />
4<br />
Unit<br />
5<br />
Unit<br />
6<br />
Unit<br />
7<br />
Unit<br />
8<br />
Unit<br />
9<br />
Unit<br />
10<br />
Total<br />
Depth<br />
of<br />
Well<br />
1 X 600 1800 2010<br />
2 X 150 520 900 1120<br />
3 X 1100 2100 2750 3650 4500<br />
4 X 950 1000 1720<br />
5 X 550 625<br />
6 X 1100 2020 2040<br />
7 X 800 1700 2200 2320<br />
8 X 450 1200 1850<br />
9 X 800 1450 2320<br />
10 X 650 1400 1950<br />
11 X 400 2650 3250 3800 4600<br />
12 X 600 1100 2400 2700 3500 4020<br />
13 X 750 1220 1800 2000<br />
14 X 1100 1500 2500<br />
15 X 900 1550<br />
16 X 700 2100 2370<br />
17 X 550 2100 3100 3900 3940<br />
18 X 1100 1600 2700<br />
Your <strong>Fence</strong> Diagram<br />
Construct a colored stratigraphic fence diagram on a vertical scale of 1" = 2000', showing<br />
the distribution and relationships of the formations penetrated in the wells. Draw a vertical scale bar<br />
on your base map (included here). For each well, plot the depths at which each formation is<br />
encountered and the total depth. Then connect the formation tops using the guidelines above to<br />
develop a panel system along the connecting lines on the base map. A few lines at the surface<br />
between wells have already been drawn for you. You may choose the rest of the panels making<br />
sure that you include each well. When constructing the panels, draw a wavy line where<br />
unconformities are present. Label and color each unit. Expect to have to erase a few lines, so draw<br />
them lightly until you are fairly confident in your interpretation. Reading the following questions<br />
might help you identify the tougher parts early.<br />
General Conceptual Questions<br />
1. Why might the thickness of some units change from well to well? Think of at least 2 reasons.<br />
What conditions might account for the decrease in section thickness between wells 3 and 2?<br />
2. Indicate where any unconformities might be present and how you identified them. What is the<br />
fewest number of erosional events that can account for all of the truncated units?<br />
<strong>Fence</strong> <strong>diagrams</strong>, <strong>page</strong> 3
3. What objection would there be to drawing a panel between wells 13 and 8? Would a panel<br />
between wells 18 and 8 improve the stratigraphic picture?<br />
Isolith and Isopach Maps<br />
Now construct two maps showing the thickness of Unit 6 and the depth to the top of Unit 6.<br />
Start with the isopach map. Calculate and then mark the thickness of Unit 6 near the point marking<br />
each well. Next contour the thickness with a 250 foot contour interval. Use your fence diagram to<br />
help with your interpretation. Pay particular attention to the area near wells 3, 16, and 18 and<br />
implications for the geometry of the unconformity. Make the map consistent with your fence<br />
diagram by putting the 0 foot contour line where Unit 6 is truncated by the unconformity in your<br />
fence diagram.<br />
Next work on the iso-depth map. First outline the area in which Unit 6 occurs, which<br />
should correspond to your 0 thickness contour on the isopach map. It will be helpful to make this<br />
line a different color than your depth contour lines. Next, write the depth to the top of Unit 6 by<br />
each well and contour the depth of Unit 6 in the area in which it occurs. Where Unit 6 is missing,<br />
there should be no contours, not even at 0 feet (think about why). A contour interval of 500 feet is<br />
appropriate for your data because the city would like the well to be at least 500 feet deep for<br />
cleanliness and less than 1500 feet deep to save drilling and pumping costs. The contour lines will<br />
meet the line marking the extent of the area that Unit 6 occurs. Once again, reading the following<br />
questions will help you identify some of the tricky points.<br />
General Conceptual Questions<br />
4. How did you deal with the isopachs for wells 11 and 12 which did not reach the bottom of Unit<br />
6? Why did you make this choice?<br />
5. Did you include the 0 and 500 feet contour intervals on the iso-depth map? Why or why not?<br />
Thought Question (will not be graded): What do you think happened tectonically after deposition<br />
of Unit 6 and before development of the unconformity under Unit 3? How would your tectonic<br />
interpretation influence the way you draw the contours near well 3?<br />
City Report: Write a short report for the municipality discussing: 1) the stratigraphic factors<br />
controlling the distribution of Unit 6; 2) your recommended drilling locations; and 3) why other<br />
locations are poor candidates for drilling. Refer to your fence diagram and maps. Bureaucrats do<br />
not read long reports, so make yours brief and to the point, but be sure to include enough<br />
information to be convincing. Feel free to make lists of points and refer to your <strong>diagrams</strong> to help<br />
reduce the length of your report.<br />
<strong>Fence</strong> <strong>diagrams</strong>, <strong>page</strong> 4