Activity to reduce unit consumption of compressed air by its supply in ...
Activity to reduce unit consumption of compressed air by its supply in ...
Activity to reduce unit consumption of compressed air by its supply in ...
You also want an ePaper? Increase the reach of your titles
YUMPU automatically turns print PDFs into web optimized ePapers that Google loves.
National Convention <strong>of</strong> Excellent Examples <strong>in</strong> Energy Conservation for Fiscal 2005<br />
2005_PCECCJ_7_Nissan_Mo<strong>to</strong>r_Co._Ltd._Oppama_Plant<br />
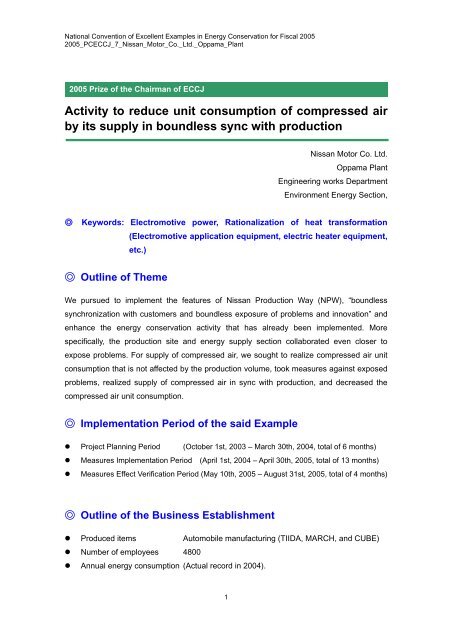
2005 Prize <strong>of</strong> the Ch<strong>air</strong>man <strong>of</strong> ECCJ<br />
<strong>Activity</strong> <strong>to</strong> <strong>reduce</strong> <strong>unit</strong> <strong>consumption</strong> <strong>of</strong> <strong>compressed</strong> <strong>air</strong><br />
<strong>by</strong> <strong>its</strong> <strong>supply</strong> <strong>in</strong> boundless sync with production<br />
Nissan Mo<strong>to</strong>r Co. Ltd.<br />
Oppama Plant<br />
Eng<strong>in</strong>eer<strong>in</strong>g works Department<br />
Environment Energy Section,<br />
◎ Keywords: Electromotive power, Rationalization <strong>of</strong> heat transformation<br />
(Electromotive application equipment, electric heater equipment,<br />
etc.)<br />
◎ Outl<strong>in</strong>e <strong>of</strong> Theme<br />
We pursued <strong>to</strong> implement the features <strong>of</strong> Nissan Production Way (NPW), “boundless<br />
synchronization with cus<strong>to</strong>mers and boundless exposure <strong>of</strong> problems and <strong>in</strong>novation” and<br />
enhance the energy conservation activity that has already been implemented. More<br />
specifically, the production site and energy <strong>supply</strong> section collaborated even closer <strong>to</strong><br />
expose problems. For <strong>supply</strong> <strong>of</strong> <strong>compressed</strong> <strong>air</strong>, we sought <strong>to</strong> realize <strong>compressed</strong> <strong>air</strong> <strong>unit</strong><br />
<strong>consumption</strong> that is not affected <strong>by</strong> the production volume, <strong>to</strong>ok measures aga<strong>in</strong>st exposed<br />
problems, realized <strong>supply</strong> <strong>of</strong> <strong>compressed</strong> <strong>air</strong> <strong>in</strong> sync with production, and decreased the<br />
<strong>compressed</strong> <strong>air</strong> <strong>unit</strong> <strong>consumption</strong>.<br />
◎ Implementation Period <strong>of</strong> the said Example<br />
� Project Plann<strong>in</strong>g Period (Oc<strong>to</strong>ber 1st, 2003 – March 30th, 2004, <strong>to</strong>tal <strong>of</strong> 6 months)<br />
� Measures Implementation Period (April 1st, 2004 – April 30th, 2005, <strong>to</strong>tal <strong>of</strong> 13 months)<br />
� Measures Effect Verification Period (May 10th, 2005 – August 31st, 2005, <strong>to</strong>tal <strong>of</strong> 4 months)<br />
◎ Outl<strong>in</strong>e <strong>of</strong> the Bus<strong>in</strong>ess Establishment<br />
� Produced items Au<strong>to</strong>mobile manufactur<strong>in</strong>g (TIIDA, MARCH, and CUBE)<br />
� Number <strong>of</strong> employees 4800<br />
� Annual energy <strong>consumption</strong> (Actual record <strong>in</strong> 2004).<br />
1
National Convention <strong>of</strong> Excellent Examples <strong>in</strong> Energy Conservation for Fiscal 2005<br />
2005_PCECCJ_7_Nissan_Mo<strong>to</strong>r_Co._Ltd._Oppama_Plant<br />
Electric power :131,231 Mwh<br />
City gas :21,513 km3N<br />
Kerosene :1,094 kl<br />
Bunker A :151 kl<br />
◎ Process Flow <strong>of</strong> Target Facility<br />
The overall <strong>compressed</strong> <strong>air</strong> <strong>supply</strong> facility that supplies <strong>air</strong> <strong>to</strong> all processes throughout the<br />
plant is shown below:<br />
Third pa<strong>in</strong>t<br />
Second assembly<br />
Second pa<strong>in</strong>t<br />
First pa<strong>in</strong>t<br />
First assembly<br />
First form<strong>in</strong>g<br />
Second<br />
body<br />
First<br />
body Press<br />
1. Reasons for Theme Selection<br />
Fig.1 Control <strong>of</strong> <strong>compressed</strong> <strong>air</strong><br />
Second compressor room<br />
Air convergence header<br />
Connection pipe<br />
First compressor room<br />
Air convergence header<br />
Power <strong>consumption</strong> <strong>of</strong> the <strong>air</strong> compressors accounts for about 16% <strong>of</strong> the entire plant, so we<br />
have worked on reduction <strong>of</strong> <strong>unit</strong> <strong>consumption</strong> for a long time. (Fig.1) For the <strong>unit</strong><br />
<strong>consumption</strong> <strong>in</strong> 2003, however, while <strong>air</strong> discharge electricity <strong>unit</strong> <strong>consumption</strong> (kwh/m3N)<br />
has decreased, <strong>unit</strong> <strong>consumption</strong> per au<strong>to</strong>mobile (kwh/au<strong>to</strong>mobile) is <strong>in</strong>creas<strong>in</strong>g <strong>in</strong>fluenced<br />
<strong>by</strong> decreased production. Therefore, we assumed that if <strong>compressed</strong> <strong>air</strong> can be supplied<br />
accord<strong>in</strong>g <strong>to</strong> the production (synchronization), <strong>unit</strong> <strong>consumption</strong> should be ma<strong>in</strong>ta<strong>in</strong>ed at a<br />
low level with out <strong>in</strong>fluence <strong>of</strong> production volume, which is the way it should be.<br />
2
National Convention <strong>of</strong> Excellent Examples <strong>in</strong> Energy Conservation for Fiscal 2005<br />
2005_PCECCJ_7_Nissan_Mo<strong>to</strong>r_Co._Ltd._Oppama_Plant<br />
Annual production volume<br />
Au<strong>to</strong>mobile<br />
Number <strong>of</strong><br />
produced<br />
au<strong>to</strong>mobile<br />
Countermeasures<br />
Decrease pressure<br />
Introduction <strong>of</strong> tube end pressure control<br />
Introduction <strong>of</strong> number <strong>of</strong> operated mach<strong>in</strong>es control<br />
Measure <strong>to</strong> <strong>reduce</strong> pipe resistance<br />
Measure <strong>to</strong> close facility primary valves<br />
Reduction <strong>of</strong> <strong>air</strong> leak<br />
Reduction <strong>of</strong> <strong>air</strong> feed time<br />
Sett<strong>in</strong>g "no energy day"<br />
Introduction <strong>of</strong> <strong>in</strong>termittent <strong>air</strong> blow<br />
Electro-mo<strong>to</strong>rization <strong>of</strong> <strong>air</strong> equipment<br />
Table <strong>of</strong> <strong>unit</strong> <strong>consumption</strong> transition<br />
Air discharge electricity <strong>unit</strong><br />
<strong>consumption</strong><br />
Unit <strong>consumption</strong> per<br />
au<strong>to</strong>mobile<br />
Year<br />
Fig. 2 Transition <strong>of</strong> <strong>air</strong> <strong>unit</strong> <strong>consumption</strong><br />
Year<br />
Table 1 Measures <strong>to</strong> decrease <strong>air</strong> <strong>unit</strong> <strong>consumption</strong><br />
2. Understand<strong>in</strong>g and Analysis <strong>of</strong> Current Situation<br />
(1) Understand<strong>in</strong>g <strong>of</strong> Current Situation<br />
1) Outl<strong>in</strong>e <strong>of</strong> <strong>compressed</strong> <strong>air</strong> <strong>supply</strong> facility<br />
Compressors are <strong>in</strong>stalled <strong>in</strong> two compressor rooms. The first compressor room has two<br />
high pressure compressors and five low pressure compressors and their <strong>to</strong>tal capacity is<br />
3280 kw. The second compressor room has four low pressure compressors and their <strong>to</strong>tal<br />
capacity is 2190 w.<br />
To <strong>supply</strong> <strong>air</strong>, processes are grouped <strong>in</strong><strong>to</strong> two systems (high pressure and low pressure) and<br />
the <strong>air</strong> is looped after each process <strong>to</strong> lower the <strong>air</strong> feed pressure <strong>to</strong> the lowest allowable<br />
level.<br />
3<br />
Unit <strong>consumption</strong>
National Convention <strong>of</strong> Excellent Examples <strong>in</strong> Energy Conservation for Fiscal 2005<br />
2005_PCECCJ_7_Nissan_Mo<strong>to</strong>r_Co._Ltd._Oppama_Plant<br />
For control,<br />
[1] tube end pressure control <strong>to</strong> detect tube end pressure for each system and detect the<br />
lowest pressure among them,<br />
[2] control <strong>of</strong> number <strong>of</strong> compressors <strong>to</strong> balance load <strong>of</strong> all compressors <strong>in</strong>stalled <strong>in</strong> the first<br />
and second compressor rooms, and<br />
[3] control <strong>to</strong> operate high pressure compressors at fixed load and use excess <strong>air</strong> for low<br />
pressure us<strong>in</strong>g the pressure regula<strong>to</strong>r at the receiver tank are implemented.<br />
This <strong>compressed</strong> <strong>air</strong> <strong>supply</strong> facility, <strong>to</strong> which such improvements are done, supplies<br />
<strong>compressed</strong> <strong>air</strong> <strong>to</strong> virtually all processes <strong>in</strong> the 500,000 m2 <strong>of</strong> plant area (14 systems).<br />
First compressor<br />
room, for high<br />
pressure,<br />
two 480 kw<br />
compressors<br />
First compressor<br />
room, for low<br />
pressure, four 480<br />
kw compressors<br />
and one 400 kw<br />
compressor<br />
Number control equipment<br />
First and second collaboration<br />
Second<br />
compressor room,<br />
for low pressure,<br />
two 720 kw<br />
compressors, one<br />
500 kw<br />
compressor, and<br />
one 250 kw<br />
Compressor<br />
Tube end pressure detec<strong>to</strong>r<br />
High pressure<br />
header Tube end<br />
pressure sensor<br />
Low pressure<br />
header<br />
Low pressure<br />
header<br />
Press plant<br />
Tube end<br />
pressure sensor<br />
First plant series<br />
7 systems<br />
Tube end<br />
pressure sensor<br />
Second plant<br />
series 6 systems<br />
Number control equipment, First and second collaboration<br />
Fig.3 Compressed <strong>air</strong> system diagram<br />
Compressor<br />
**** ****<br />
Compressor ****<br />
Number control<br />
equipment<br />
Tube end pressure<br />
detec<strong>to</strong>r<br />
Fig.4 Block diagram <strong>of</strong> the tube end pressure feedback control<br />
4<br />
Facility diagram
National Convention <strong>of</strong> Excellent Examples <strong>in</strong> Energy Conservation for Fiscal 2005<br />
2005_PCECCJ_7_Nissan_Mo<strong>to</strong>r_Co._Ltd._Oppama_Plant<br />
2) Current situation <strong>of</strong> supplied pressure<br />
Trend accord<strong>in</strong>g <strong>to</strong> the record <strong>of</strong> tube end pressure for each process is shown <strong>in</strong> Fig.5 and<br />
trend accord<strong>in</strong>g <strong>to</strong> the record <strong>of</strong> header pressure is shown <strong>in</strong> Fig.6.<br />
These suggest the follow<strong>in</strong>g:<br />
[1] When production is f<strong>in</strong>ished, there is a temporary and sharp rise <strong>of</strong> pressure.<br />
[2] When production is not done, pressure is higher than when production is done.<br />
[3] Tube end pressure differs from process <strong>to</strong> process, and <strong>in</strong> some systems, it is higher<br />
than the specified pressure.<br />
[4] Header pressure fluctuates widely and is higher than the expected value.<br />
Tube end<br />
pressure<br />
(2) Analysis <strong>of</strong> Current Situation<br />
Pressure rises after production is f<strong>in</strong>ished<br />
Production end Production start<br />
Pressure is high dur<strong>in</strong>g non-production<br />
hours<br />
Pressure drops when l<strong>in</strong>es are started<br />
Fig.5 Current situation <strong>of</strong> the tube end pressure<br />
Header pressure<br />
Maximum<br />
value<br />
Average<br />
M<strong>in</strong>imum<br />
value<br />
Fig.6 Current situation <strong>of</strong> header pressure fluctuation<br />
The correlation between <strong>compressed</strong> <strong>air</strong> flow rate and pressure at the start and end <strong>of</strong><br />
production is shown <strong>in</strong> Fig.7. At the end <strong>of</strong> production, flow rate <strong>of</strong> <strong>compressed</strong> <strong>air</strong> drops<br />
rapidly and the pressure rises temporarily. When production is not done, pressure is higher<br />
than when production is done because flow rate is less. In addition, at the start <strong>of</strong> production,<br />
flow rate <strong>of</strong> <strong>compressed</strong> <strong>air</strong> rises rapidly and the pressure drops temporarily. As described<br />
5
National Convention <strong>of</strong> Excellent Examples <strong>in</strong> Energy Conservation for Fiscal 2005<br />
2005_PCECCJ_7_Nissan_Mo<strong>to</strong>r_Co._Ltd._Oppama_Plant<br />
above, fluctuation <strong>of</strong> <strong>compressed</strong> <strong>air</strong> flow rate causes pressure fluctuation. This fluctuation<br />
suggests that demand <strong>by</strong> production facility and supplier side control are not <strong>in</strong> sync.<br />
It became clear that there is a major problem that production and <strong>supply</strong> <strong>of</strong> <strong>compressed</strong> <strong>air</strong><br />
are not <strong>in</strong> synchronization.<br />
Furthermore, consider<strong>in</strong>g this fac<strong>to</strong>r and pressure drop, operation pressure is set high,<br />
caus<strong>in</strong>g energy loss <strong>of</strong> the compressor shaft power.<br />
Air flow rate<br />
Air pressure<br />
3. Progress <strong>of</strong> Activities<br />
Fig.7 Correlation between <strong>air</strong> flow rate and <strong>air</strong> pressure<br />
(1) Implementation Structure (Family activity)<br />
To synchronize with production, <strong>in</strong>formation from the production site is the most important<br />
requirement. To discuss <strong>supply</strong> for the user <strong>of</strong> the <strong>compressed</strong> <strong>air</strong> <strong>in</strong> more detail <strong>in</strong> the family<br />
activity (manufactur<strong>in</strong>g, ma<strong>in</strong>tenance, technology, logistics and energy <strong>supply</strong> section) that<br />
has been already implemented <strong>in</strong> each process, we decided <strong>to</strong> establish a regular<br />
discussion opport<strong>unit</strong>y <strong>to</strong> promote this activity.<br />
(2) Target Sett<strong>in</strong>gs<br />
To achieve the lowest level <strong>of</strong> <strong>unit</strong> <strong>consumption</strong> all the time regardless <strong>of</strong> production volume<br />
and “synchronize <strong>supply</strong> <strong>of</strong> <strong>compressed</strong> <strong>air</strong> <strong>to</strong> production <strong>to</strong> elim<strong>in</strong>ate loss”.<br />
Less than the average <strong>unit</strong> <strong>consumption</strong> <strong>in</strong> 2002 (the m<strong>in</strong>imum <strong>unit</strong> <strong>consumption</strong><br />
when the production volume was maximum), 46.82 (kwh/au<strong>to</strong>mobile)<br />
(Equivalent <strong>of</strong> 12% reduction <strong>to</strong> 2003).<br />
6
National Convention <strong>of</strong> Excellent Examples <strong>in</strong> Energy Conservation for Fiscal 2005<br />
2005_PCECCJ_7_Nissan_Mo<strong>to</strong>r_Co._Ltd._Oppama_Plant<br />
(3) Problem Areas and Their Investigations<br />
1) Analysis <strong>of</strong> pressure control when start<strong>in</strong>g/s<strong>to</strong>pp<strong>in</strong>g l<strong>in</strong>es<br />
Because the <strong>compressed</strong> <strong>air</strong> <strong>supply</strong> facility supplies <strong>air</strong> from two locations <strong>to</strong> the broad area<br />
<strong>of</strong> the entire plant, the <strong>supply</strong> distance is long, capacity is large, and response on load<br />
fluctuation is poor. Therefore, <strong>to</strong> avoid <strong>supply</strong> failure due <strong>to</strong> pressure drop when the<br />
pressure fluctuation is large at start<strong>in</strong>g and s<strong>to</strong>pp<strong>in</strong>g <strong>of</strong> the l<strong>in</strong>es, pressure is set rather high<br />
and many load adjustment mechanisms are <strong>in</strong>stalled. In addition, the base mach<strong>in</strong>e is<br />
started earlier. Therefore, unload and wait<strong>in</strong>g status is frequently seen, which is a cause <strong>of</strong><br />
degradation <strong>of</strong> <strong>unit</strong> <strong>consumption</strong> dur<strong>in</strong>g non-production hours.<br />
Air flow<br />
Air flow and<br />
electricity<br />
Load adjuster<br />
Load adjuster<br />
Load adjuster<br />
Base mach<strong>in</strong>e<br />
Electricity<br />
Load drop Load rise L<strong>in</strong>e s<strong>to</strong>p L<strong>in</strong>e start<br />
Fig.8 Operation and wait<strong>in</strong>g status <strong>of</strong> the compressors<br />
2) Clarification <strong>of</strong> conditions <strong>of</strong> production side<br />
[1] For production hours, l<strong>in</strong>e start and end times are specified for each process accord<strong>in</strong>g <strong>to</strong><br />
the Nissan Production Way.<br />
[2] Pressure enough for production is required dur<strong>in</strong>g production and after production until<br />
all facilities are s<strong>to</strong>pped. However, after facilities are s<strong>to</strong>pped, only low pressure <strong>air</strong><br />
<strong>supply</strong> is required for facility ma<strong>in</strong>tenance and adjustment etc.<br />
7
National Convention <strong>of</strong> Excellent Examples <strong>in</strong> Energy Conservation for Fiscal 2005<br />
2005_PCECCJ_7_Nissan_Mo<strong>to</strong>r_Co._Ltd._Oppama_Plant<br />
High High pressure<br />
Low pressure<br />
L<strong>in</strong>e s<strong>to</strong>p<br />
All facilities<br />
L<strong>in</strong>e start<br />
Fig.9 Required pressure<br />
3) Clarification <strong>of</strong> conditions <strong>of</strong> production side<br />
Pressure for<br />
production<br />
Pressure for<br />
ma<strong>in</strong>tenance<br />
Processes are grouped <strong>in</strong><strong>to</strong> high pressure systems (press process) and low pressure<br />
systems (13 processes). Although all low pressure systems require the same pressure, as<br />
shown <strong>in</strong> Table 2, flow rate varies depend<strong>in</strong>g on processes and pip<strong>in</strong>g resistance and load<br />
situation are also different. In such a situation, low pressure <strong>air</strong> is currently supplied <strong>to</strong> all<br />
processes <strong>by</strong> the same system. (Fig.3)<br />
Therefore, although all processes require the same low pressure, <strong>compressed</strong> <strong>air</strong> is<br />
supplied so that the required pressure is satisfied <strong>in</strong> the process whose tube end pressure is<br />
the lowest, so pressures <strong>in</strong> other processes are higher than the required pressure.<br />
4) Clarification <strong>of</strong> problems<br />
Process<br />
Press<br />
First body<br />
First assembly<br />
Second body<br />
Second assembly<br />
First form<strong>in</strong>g<br />
Three areas<br />
Second and third form<strong>in</strong>g<br />
General research<br />
Experiment department<br />
First pa<strong>in</strong>t<br />
Second pa<strong>in</strong>t<br />
Third pa<strong>in</strong>t<br />
Guaranteed pressure Used <strong>air</strong><br />
Table 2 Flow rate and pressure <strong>of</strong> each process<br />
[1] Current control us<strong>in</strong>g only pressure <strong>in</strong>formation cannot appropriately respond <strong>to</strong> load<br />
fluctuation.<br />
[2]There are no mechanisms or facility specifications <strong>to</strong> control pressure appropriately for<br />
each process.<br />
8
National Convention <strong>of</strong> Excellent Examples <strong>in</strong> Energy Conservation for Fiscal 2005<br />
2005_PCECCJ_7_Nissan_Mo<strong>to</strong>r_Co._Ltd._Oppama_Plant<br />
This requires a major improvement <strong>of</strong> the control system, but because the current control<br />
system does not have enough flexibility, we discussed update <strong>of</strong> the entire system.<br />
4. Details <strong>of</strong> Measures<br />
To update the entire control system, we considered the follow<strong>in</strong>g issues that are currently<br />
troubl<strong>in</strong>g:<br />
To <strong>supply</strong> <strong>compressed</strong> <strong>air</strong> <strong>in</strong> sync with production, [1] production <strong>in</strong>formation should be<br />
<strong>in</strong>cluded <strong>in</strong> control <strong>in</strong>formation <strong>to</strong> suppress pressure fluctuation doe <strong>to</strong> production fluctuation.<br />
[2] Control <strong>supply</strong> <strong>of</strong> <strong>compressed</strong> <strong>air</strong> for each process.<br />
(1) Countermeasure 1: Synchronization <strong>of</strong> Compressed Air Supply Control<br />
with Production (Produce as Needed)<br />
・ Feed forward the production <strong>in</strong>formation<br />
Plan <strong>in</strong>put based on the production plan and correction based on the change <strong>of</strong> plan<br />
<strong>in</strong>formation is established and added <strong>to</strong> the control <strong>in</strong>formation. This allows time<br />
management and au<strong>to</strong>matic control <strong>of</strong> operation <strong>of</strong> the base load mach<strong>in</strong>e and load adjuster<br />
<strong>in</strong> synchronization with production <strong>by</strong> judg<strong>in</strong>g the start and end <strong>of</strong> production.<br />
As a result, header presser became stable and lower, and unload wait time was decreased.<br />
Production plan (monthly) Power source<br />
operation<br />
department<br />
Production <strong>in</strong>formation web page<br />
Plan modification (daily)<br />
Air <strong>supply</strong> facility<br />
Power source operation plan and<br />
accrual record web page<br />
Fig.10 Verification <strong>of</strong> production <strong>in</strong>formation<br />
9
National Convention <strong>of</strong> Excellent Examples <strong>in</strong> Energy Conservation for Fiscal 2005<br />
2005_PCECCJ_7_Nissan_Mo<strong>to</strong>r_Co._Ltd._Oppama_Plant<br />
Controlled compressors<br />
Application<br />
Low pressure<br />
Low pressure<br />
Low pressure<br />
Low pressure<br />
Low pressure<br />
Low pressure<br />
Low pressure/<br />
High pressure<br />
Low pressure/<br />
High pressure<br />
High pressure<br />
High pressure<br />
Low pressure<br />
Location<br />
First<br />
First<br />
First<br />
Second<br />
Second<br />
Second<br />
First<br />
First<br />
First<br />
First<br />
Second<br />
Compressor Air flow (m3/h) Capacity (kw)<br />
2c Reciproca<strong>to</strong>r<br />
3c Reciproca<strong>to</strong>r<br />
4c Reciproca<strong>to</strong>r<br />
8c Reciproca<strong>to</strong>r<br />
9c Reciproca<strong>to</strong>r<br />
11c Screw<br />
1c Turbo<br />
5c Reciproca<strong>to</strong>r<br />
6c Reciproca<strong>to</strong>r<br />
7c Reciproca<strong>to</strong>r<br />
10c Turbo<br />
Load adjustment<br />
Load adjustment<br />
Load adjustment<br />
Base load<br />
Base load<br />
Base load<br />
Base load<br />
Load adjustment<br />
Base load<br />
Base load<br />
S<strong>in</strong>gle<br />
Method <strong>of</strong> <strong>air</strong> flow control<br />
Table 3 Mach<strong>in</strong>es that can respond <strong>to</strong> load fluctuation at l<strong>in</strong>e start<br />
(2) Countermeasure 2: Air Supply <strong>in</strong> Synchronization with Production <strong>of</strong><br />
Each Section (Feed as Needed)<br />
・ Supply <strong>air</strong> <strong>in</strong> synchronization with production <strong>of</strong> each process<br />
Start-s<strong>to</strong>p<br />
Start-s<strong>to</strong>p<br />
Start-s<strong>to</strong>p<br />
Start-s<strong>to</strong>p<br />
Start-s<strong>to</strong>p<br />
Start-s<strong>to</strong>p<br />
Start-s<strong>to</strong>p<br />
Start-s<strong>to</strong>p<br />
Start-s<strong>to</strong>p<br />
Start-s<strong>to</strong>p<br />
Start-s<strong>to</strong>p<br />
We utilized the exist<strong>in</strong>g system <strong>to</strong> measure pip<strong>in</strong>g end pressure for each process and<br />
modified it <strong>to</strong> <strong>in</strong>stall pressure control valves <strong>to</strong> the <strong>supply</strong> pipes <strong>to</strong> each process so that<br />
<strong>compressed</strong> <strong>air</strong> that is controlled at the required pressure can be supplied <strong>to</strong> each process.<br />
As such, improvement <strong>to</strong> feed <strong>air</strong> at the required pressure <strong>to</strong> each process <strong>in</strong><br />
synchronization with production was implemented and loss was elim<strong>in</strong>ated.<br />
In addition, <strong>to</strong> improve response <strong>of</strong> control <strong>of</strong> supplied pressure <strong>to</strong> each process, control and<br />
stability <strong>of</strong> header pressure is important, so this header pressure <strong>in</strong>formation is <strong>in</strong>cluded <strong>in</strong><br />
the control.<br />
10
National Convention <strong>of</strong> Excellent Examples <strong>in</strong> Energy Conservation for Fiscal 2005<br />
2005_PCECCJ_7_Nissan_Mo<strong>to</strong>r_Co._Ltd._Oppama_Plant<br />
High pressure base<br />
Low pressure load<br />
adjustment<br />
Production<br />
<strong>in</strong>formation<br />
Operation<br />
direction<br />
Control <strong>unit</strong><br />
Convergence header<br />
Output<br />
Input<br />
Fig.11 Air feed system for each section<br />
Number control<br />
equipment<br />
Pressure sensor<br />
Press plant<br />
Body plant<br />
Assembly plant<br />
Form<strong>in</strong>g plant<br />
Compressor Production<br />
Pressure<br />
adjustment valve<br />
facility<br />
Tube end pressure<br />
detec<strong>to</strong>r<br />
Fig.12 Block chart <strong>of</strong> production <strong>in</strong>formation feed forward<br />
(3) Other Measures (Produce with M<strong>in</strong>imum Resource)<br />
In the family activity, the follow<strong>in</strong>g loss improvements were implemented as well as<br />
modification <strong>of</strong> control etc.<br />
[1] Reduction <strong>of</strong> pipe resistance<br />
・ Appropriate dehumidification performance<br />
・ Appropriate pip<strong>in</strong>g capacity and change <strong>of</strong> routes<br />
11
National Convention <strong>of</strong> Excellent Examples <strong>in</strong> Energy Conservation for Fiscal 2005<br />
2005_PCECCJ_7_Nissan_Mo<strong>to</strong>r_Co._Ltd._Oppama_Plant<br />
[2] Improvement <strong>of</strong> measurement equipment<br />
[3] Efforts <strong>to</strong> appropriate usage and used volume <strong>of</strong> <strong>compressed</strong> <strong>air</strong> when layout is changed<br />
or facility is updated.<br />
[4] Reconfirmation <strong>of</strong> required pressure and correction <strong>of</strong> tube end position for each process<br />
[5] Countermeasures aga<strong>in</strong>st leak <strong>of</strong> <strong>compressed</strong> <strong>air</strong><br />
(4) Addition <strong>of</strong> Other Measures<br />
(Introduction <strong>of</strong> steam turb<strong>in</strong>e driven compressors)<br />
1) Boundless pursuit <strong>of</strong> problems<br />
We have promoted improvement <strong>of</strong> control and facilities for boundless synchronization with<br />
production, but still a lot <strong>of</strong> <strong>compressed</strong> <strong>air</strong> is used dur<strong>in</strong>g non-production hours as shown <strong>in</strong><br />
Fig.13. This is the base part (fixed part) <strong>of</strong> the <strong>compressed</strong> <strong>air</strong> <strong>supply</strong> and a cause <strong>to</strong><br />
fluctuate <strong>unit</strong> <strong>consumption</strong> when production volume is changed. Each process family has<br />
discussed how <strong>to</strong> <strong>reduce</strong> this fixed part, it was difficult <strong>to</strong> <strong>reduce</strong> more.<br />
Fig.13 Compressor power for each hour<br />
12<br />
Holiday Week day
National Convention <strong>of</strong> Excellent Examples <strong>in</strong> Energy Conservation for Fiscal 2005<br />
2005_PCECCJ_7_Nissan_Mo<strong>to</strong>r_Co._Ltd._Oppama_Plant<br />
Plant load<br />
2) Change <strong>in</strong> th<strong>in</strong>k<strong>in</strong>g<br />
W<strong>in</strong>ter<br />
Inc<strong>in</strong>era<strong>to</strong>r<br />
Steam load<br />
Summer W<strong>in</strong>ter<br />
Cogeneration Plant load<br />
Fig.14 Generated steam and load<br />
To <strong>reduce</strong> the effect <strong>of</strong> this fixed part, we discussed whether other excess energy etc. can be<br />
used.<br />
As a result, we found that [1] there is excess waste heat recovery <strong>in</strong> the waste disposal site<br />
<strong>in</strong> summer, and [2] how <strong>to</strong> use the summer time steam after cogeneration starts operation is<br />
undecided, so we discussed <strong>in</strong>troduction <strong>of</strong> steam driven compressors. Dur<strong>in</strong>g heat<strong>in</strong>g<br />
period <strong>in</strong> w<strong>in</strong>ter, steam is <strong>in</strong>sufficient, but steam for heat<strong>in</strong>g is low pressure, so <strong>its</strong> pressure is<br />
decreased us<strong>in</strong>g decompression valves. We discussed utiliz<strong>in</strong>g this decompression energy<br />
as a source <strong>of</strong> power for compressors.<br />
The result <strong>of</strong> simulation <strong>in</strong>dicated <strong>in</strong>vestment effect, so we adopted steam driven<br />
compressors <strong>in</strong> the system shown <strong>in</strong> Fig.15 and used as compressor for the base part. As a<br />
result, <strong>unit</strong> price <strong>of</strong> <strong>compressed</strong> <strong>air</strong> decreased. In this improvement, the amount <strong>of</strong> used<br />
<strong>compressed</strong> <strong>air</strong> is unchanged, but <strong>compressed</strong> <strong>air</strong> <strong>unit</strong> <strong>consumption</strong> was also <strong>reduce</strong>d<br />
because <strong>of</strong> effective use <strong>of</strong> recovered heat.<br />
13<br />
Steam volume
National Convention <strong>of</strong> Excellent Examples <strong>in</strong> Energy Conservation for Fiscal 2005<br />
2005_PCECCJ_7_Nissan_Mo<strong>to</strong>r_Co._Ltd._Oppama_Plant<br />
Boiler steam<br />
Cogeneration steam<br />
Inc<strong>in</strong>era<strong>to</strong>r steam<br />
For production<br />
High pressure steam header<br />
5. Verification <strong>of</strong> Effects<br />
W<strong>in</strong>ter: 3 Mpa steam<br />
Steam turb<strong>in</strong>e<br />
Summer: dra<strong>in</strong> recovery<br />
Heat<strong>in</strong>g<br />
Low pressure steam header<br />
Fig.15 Steam driven compressor<br />
(1) Reduction <strong>of</strong> Unit Consumption and Year-round Effect<br />
Turbo compressor<br />
Turbo compressor with<br />
steam turb<strong>in</strong>e mo<strong>to</strong>r<br />
Mo<strong>to</strong>r<br />
Air low pressure header<br />
As a result <strong>of</strong> the above measures, the actual <strong>unit</strong> <strong>consumption</strong> per au<strong>to</strong>mobile<br />
(kwh/au<strong>to</strong>mobile) dur<strong>in</strong>g May – August <strong>of</strong> 2005 was 47.99 kwh/au<strong>to</strong>mobile, which was<br />
12.6% lower compared <strong>to</strong> 2003. (Fig.16)<br />
(The number <strong>of</strong> produced au<strong>to</strong>mobiles is fewer and the <strong>unit</strong> <strong>consumption</strong> is lower than 2002,<br />
when the <strong>unit</strong> <strong>consumption</strong> was the lowest. The target is achieved.)<br />
year-round effect: electric charge 27,700 [1,000 yen / year]<br />
Number <strong>of</strong> produced<br />
au<strong>to</strong>mobiles<br />
(Au<strong>to</strong>mobiles/four months)<br />
Effect verification<br />
Target <strong>to</strong> 2002<br />
Period: May - August (Kwh/au<strong>to</strong>mobile)<br />
Year<br />
Effect<br />
Reduced amount:<br />
6.9 kwh/au<strong>to</strong>mobile<br />
Reduced rate:<br />
12.6% decrease<br />
Fig.16 Reduction <strong>of</strong> <strong>unit</strong> <strong>consumption</strong> per au<strong>to</strong>mobile<br />
14<br />
Unit <strong>consumption</strong> per<br />
au<strong>to</strong>mobile
National Convention <strong>of</strong> Excellent Examples <strong>in</strong> Energy Conservation for Fiscal 2005<br />
2005_PCECCJ_7_Nissan_Mo<strong>to</strong>r_Co._Ltd._Oppama_Plant<br />
(2) Verification <strong>of</strong> Unit Consumption Reduction<br />
As shown <strong>in</strong> Fig.17, for the <strong>unit</strong> <strong>consumption</strong> for each hour, <strong>unit</strong> <strong>consumption</strong> dur<strong>in</strong>g<br />
production time is more stable and decreased. Also, the <strong>unit</strong> <strong>consumption</strong> dur<strong>in</strong>g<br />
non-production time is significantly decreased. (Synchronization <strong>of</strong> compression <strong>air</strong> <strong>supply</strong><br />
with production is improved.) In addition, header pressure became stable and is decreased.<br />
<strong>unit</strong> <strong>consumption</strong><br />
Graph <strong>of</strong> <strong>air</strong> discharge electricity (kwh/m3N)<br />
Early shift<br />
start<br />
6:30<br />
Early shift<br />
lunch break<br />
11:00-11:45<br />
Late shift lunch<br />
break<br />
20:30-21:15<br />
Before<br />
measurement<br />
15<br />
*****<br />
15:00-18:00<br />
Late shift<br />
end<br />
0:30<br />
After<br />
measurement<br />
Fig.17 Synchronization with production <strong>by</strong> improvement <strong>of</strong> <strong>air</strong> feed<br />
Traditional control Improved control<br />
Lower limit <strong>of</strong> the<br />
required pressure<br />
Less fluctuation due <strong>to</strong> improvement<br />
Effect<br />
Pressure loss<br />
Decrease <strong>of</strong> base pressure due <strong>to</strong> improved<br />
control<br />
Fig.18 Synchronization with production <strong>by</strong> improvement <strong>of</strong> control<br />
6. Summary and Challenges for the Future<br />
� We have implemented improvement accord<strong>in</strong>g <strong>to</strong> Nissan Production Way and realized<br />
both stabilization <strong>of</strong> <strong>compressed</strong> <strong>air</strong> <strong>supply</strong> and energy conservation.<br />
� In the future, we would like perform energy conservation check <strong>by</strong> families at l<strong>in</strong>e<br />
change or when new facility is <strong>in</strong>troduced us<strong>in</strong>g this case as a guide <strong>to</strong> always<br />
synchronize energy <strong>supply</strong> <strong>to</strong> the ever chang<strong>in</strong>g production processes.


