Coral Bleaching Response Plan - Great Barrier Reef Marine Park ...
Coral Bleaching Response Plan - Great Barrier Reef Marine Park ...
Coral Bleaching Response Plan - Great Barrier Reef Marine Park ...

You also want an ePaper? Increase the reach of your titles
YUMPU automatically turns print PDFs into web optimized ePapers that Google loves.
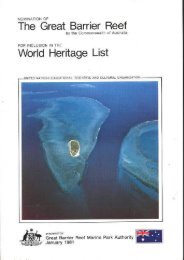
<strong>Great</strong> <strong>Barrier</strong> <strong>Reef</strong><br />
<strong>Coral</strong> <strong>Bleaching</strong><br />
<strong>Response</strong> <strong>Plan</strong><br />
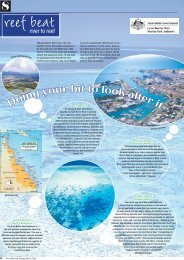
SUMMER 2005 - 2006<br />
Hotspot (thermal anomaly) Feb 2002<br />
Climate Change <strong>Response</strong> Programme - Research & Monitoring Coordination Unit
Contents<br />
INTRODUCTION ................................................................................................................................. 1<br />
1. PLAN OVERVIEW....................................................................................................................... 1<br />
1.1 SELECTING APPROPRIATE CORAL BLEACHING MONITORING FOR THE GBR ......................... 2<br />
2. EARLY WARNING SYSTEM .................................................................................................... 3<br />
2.1 CLIMATE MONITORING............................................................................................................ 3<br />
2.2 SEA TEMPERATURE MONITORING........................................................................................... 4<br />
2.3 BLEACHWATCH....................................................................................................................... 4<br />
2.4 BLEACHWATCH (AERIAL)....................................................................................................... 5<br />
3. BLEACHING ASSESSMENT AND MONITORING COMPONENT.................................... 6<br />
3.1 BROAD-SCALE SYNOPTIC SURVEYS ........................................................................................ 6<br />
3.2 BLEACHING SURVEYS............................................................................................................. 7<br />
SURVEY DESIGN AND METHODS ......................................................................................................... 8<br />
3.2.1 Spatial and Temporal Scale............................................................................................ 8<br />
3.2.2 Survey Sites..................................................................................................................... 9<br />
3.2.3 Survey Design ................................................................................................................. 9<br />
3.2.4 Data Analysis & Management ..................................................................................... 10<br />
3.2.5 Complementary Studies................................................................................................ 10<br />
4. COMMUNICATION STRATEGY ........................................................................................... 11<br />
5. IMPLEMENTATION................................................................................................................. 12<br />
5.1 RESPONSE SCHEDULE ............................................................................................................ 12<br />
5.1.1 Routine Tasks ............................................................................................................... 12<br />
5.1.2 Responsive Tasks .......................................................................................................... 13<br />
5.2 DEFINITION OF EVENT TRIGGERS FOR IMPLEMENTATION PLAN........................................... 13<br />
6. REFERENCES ............................................................................................................................ 13<br />
APPENDIX A – BLEACHWATCH REPORTING FORM............................................................ 17<br />
APPENDIX B – RAPID ASSESSMENT SURVEY DATA SHEET............................................... 18<br />
APPENDIX C – CODE TABLES FOR KEY VARIABLES........................................................... 19<br />
APPENDIX D – SCHEMATIC REPRESENTATIONS OF PERCENT COVER........................ 20
Introduction<br />
Large-scale coral bleaching events, driven by unusually warm sea temperatures, have now affected<br />
every major coral reef ecosystem on the planet (Wilkinson 2004). The effects of coral bleaching are<br />
pervasive, and potentially devastating to ecosystems and the people and industries that depend upon<br />
them. The frequency and severity of these large-scale disturbances is predicted to increase as<br />
temperatures continue to warm under a global regime of climate change. Climate change in<br />
combination with the multitude of other stressors resulting from human activities is leading to<br />
unprecedented pressure on coral reefs. Understanding the effects and implications of coral bleaching,<br />
and identifying strategies to reduce stress and mitigate impacts, are urgent challenges for the<br />
conservation and management of coral reefs worldwide.<br />
The <strong>Great</strong> <strong>Barrier</strong> <strong>Reef</strong> <strong>Marine</strong> <strong>Park</strong> has experienced two major coral bleaching events in recent years:<br />
1998 and 2002. The spatial extent of these events, combined with the high level of mortality seen at<br />
severely affected sites, has lead to widespread concern about the future of the <strong>Great</strong> <strong>Barrier</strong> <strong>Reef</strong> in the<br />
face of global climate change. The <strong>Great</strong> <strong>Barrier</strong> <strong>Reef</strong> <strong>Marine</strong> <strong>Park</strong> Authority’s (GBRMPA) <strong>Coral</strong><br />
<strong>Bleaching</strong> <strong>Response</strong> <strong>Plan</strong> has been developed to provide an early warning system for conditions that are<br />
conducive to coral bleaching, and to document the extent and severity of coral bleaching events using<br />
broad-scale synoptic surveys and ecological surveys. The information collected under this <strong>Response</strong><br />
<strong>Plan</strong> can be used to compare and analyse the frequency and patterns of bleaching events and to develop<br />
forecasting tools.<br />
1. <strong>Plan</strong> Overview<br />
This document describes a <strong>Coral</strong> <strong>Bleaching</strong> <strong>Response</strong> <strong>Plan</strong> for the <strong>Great</strong> <strong>Barrier</strong> <strong>Reef</strong> (GBR). This will<br />
enable GBRMPA to:<br />
• Develop a system to forecast coral bleaching events;<br />
• Provide early warnings of a major coral bleaching event;<br />
• Measure the spatial extent and severity of mass coral bleaching events;<br />
• Assess the ecological impacts of mass coral bleaching events;<br />
• Involve the community in monitoring the health of the GBR;<br />
• Communicate and raise awareness about coral bleaching and climate change impacts on the GBR;<br />
• Provide information to evaluate the implications of coral bleaching events for management policy<br />
and strategies.<br />
The <strong>Great</strong> <strong>Barrier</strong> <strong>Reef</strong> <strong>Coral</strong> <strong>Bleaching</strong><br />
<strong>Response</strong> <strong>Plan</strong> (the <strong>Response</strong> <strong>Plan</strong>) has<br />
been developed in conjunction with A<br />
Global Protocol for Assessment and<br />
Monitoring of <strong>Coral</strong> <strong>Bleaching</strong> (WWF,<br />
FishBase and GBRMPA), A <strong>Reef</strong><br />
Manager’s Guide to <strong>Coral</strong> <strong>Bleaching</strong> (an<br />
international collaborative effort lead by the<br />
US <strong>Coral</strong> <strong>Reef</strong> Task Force and GBRMPA)<br />
and to maximise comparability and<br />
consistency with bleaching response plans<br />
in other regions. The <strong>Response</strong> <strong>Plan</strong> also<br />
links in with GBR tourism industry-based<br />
monitoring programs such Eye on the <strong>Reef</strong>.<br />
The GBR <strong>Coral</strong> <strong>Bleaching</strong> <strong>Response</strong> <strong>Plan</strong><br />
has the following three main components<br />
(Figure 1):<br />
• Early Warning System<br />
• <strong>Bleaching</strong> Assessment and Monitoring<br />
• Communication Programme<br />
Figure 1. Schematic overview of GBR <strong>Coral</strong> <strong>Bleaching</strong><br />
<strong>Response</strong> <strong>Plan</strong> elements<br />
GBRMPA <strong>Coral</strong> <strong>Bleaching</strong> <strong>Response</strong> <strong>Plan</strong><br />
<strong>Coral</strong> <strong>Bleaching</strong><br />
Early Warning System<br />
Climate Monitoring<br />
Sea Temperature<br />
Monitoring<br />
BleachWatch<br />
<strong>Bleaching</strong> Assessment<br />
and<br />
Monitoring Programme<br />
Broad-scale synoptic<br />
surveys<br />
<strong>Bleaching</strong> surveys<br />
Communication Programme
<strong>Great</strong> <strong>Barrier</strong> <strong>Reef</strong> <strong>Coral</strong> <strong>Bleaching</strong> <strong>Response</strong> <strong>Plan</strong> 2005/2006<br />
The following sections detail the rationale, strategies and methods for each of the components. The final<br />
section of the <strong>Response</strong> <strong>Plan</strong> includes a detailed description of the implementation plan.<br />
1.1 Selecting Appropriate <strong>Coral</strong> <strong>Bleaching</strong> Monitoring for the GBR<br />
A Global Protocol for Monitoring and Assessing <strong>Coral</strong> <strong>Bleaching</strong> outlines a range of monitoring<br />
activities that can be conducted to address the objectives of a coral bleaching monitoring plan. The<br />
broad objectives of the GBR <strong>Coral</strong> <strong>Bleaching</strong> <strong>Response</strong> <strong>Plan</strong> are to document and assess:<br />
1. The extent and severity of coral bleaching (if an event occurs)<br />
2. The duration of a coral bleaching event<br />
3. The ecological impacts of a coral bleaching event<br />
a. Does bleaching result in changes to species diversity and/or coral cover?<br />
b. Does bleaching result in changes to relative abundance and dominance of different species?<br />
c. Does bleaching result in changes to reef structure and habitat complexity e.g. are there<br />
impacts on other species?<br />
d. Does bleaching result in changes to the ability of reefs to recover after an impact?<br />
4. Other anthropogenic stresses that may affect the severity of coral bleaching and recovery<br />
The GBR <strong>Coral</strong> <strong>Bleaching</strong> <strong>Response</strong> <strong>Plan</strong> also expects to provide a foundation to develop an<br />
understanding of the social and economic impacts of coral bleaching.<br />
Table 1 from the Global Protocol provides a guide to the types and frequency of monitoring which<br />
should be considered for different resource scenarios and for different objectives. The GBRMPA<br />
Climate Change <strong>Response</strong> Team reviewed the needs of the <strong>Response</strong> <strong>Plan</strong> and designed the monitoring<br />
plan using the following selected methods based on the available resources.<br />
Table 1 Monitoring activities of the GBR <strong>Coral</strong> <strong>Bleaching</strong> <strong>Response</strong> <strong>Plan</strong><br />
Question<br />
A.<br />
What is the general<br />
extent and severity of<br />
the current bleaching<br />
event?<br />
B.<br />
Is the bleaching<br />
associated with<br />
specific environmental<br />
factors such as<br />
temperature, solar<br />
radiation, water<br />
circulation?<br />
C.<br />
How long will it last<br />
and is it a recurring<br />
event?<br />
D.<br />
What are the<br />
ecological impacts on<br />
Resource Scenarios (see definitions below)<br />
1. Low 2. Medium 3. High<br />
A1<br />
• Circulate questionnaires<br />
(BleachWatch) amongst local<br />
divers and other reef users<br />
• Submit information to<br />
<strong>Reef</strong>Base<br />
B1<br />
• Ask other reef users to collect<br />
similar data<br />
C1<br />
• Ask local reef users for details<br />
on bleaching events and record<br />
these on BleachWatch<br />
questionnaires<br />
D1<br />
• Conduct before and after<br />
bleaching observations<br />
A2<br />
• Identify major species affected<br />
(take photos or video footage)<br />
B2<br />
• Get local weather data from<br />
Meteorological office on air<br />
temperature, sun hours, wind<br />
• Consult with oceanographers<br />
regarding the circulation patterns,<br />
water exchange and any<br />
upwelling features in the area<br />
• Compare bleaching records with<br />
hotspots and degree heating<br />
weeks on NOAA’s website<br />
C2<br />
D2<br />
• Measured estimates of benthic<br />
cover through time<br />
A3<br />
• Conduct detailed surveys of<br />
representative sites using<br />
transects and a precise measure<br />
of percentage of coral affected<br />
(line transect, video-transect)<br />
• Use remote sensing to obtain<br />
synoptic estimates over wider<br />
geographic area<br />
B3<br />
• Install recording temperature<br />
loggers at main bleaching sites<br />
• Install remote weather stations<br />
to record temperatures, wind<br />
and solar radiation<br />
• Measure currents and tidal flow<br />
at key sites<br />
• Acquire and analyse remote<br />
sensing data to correlate<br />
bleaching records with thermal<br />
anomalies and degree heating<br />
weeks<br />
C3<br />
• Repeat detailed observations in<br />
A3<br />
• Repeat same observations for<br />
any subsequent bleaching events<br />
D3<br />
• Measured estimates of benthic<br />
cover through time at higher<br />
Climate Change <strong>Response</strong> Programme - GBRMPA 2
<strong>Great</strong> <strong>Barrier</strong> <strong>Reef</strong> <strong>Coral</strong> <strong>Bleaching</strong> <strong>Response</strong> <strong>Plan</strong> 2005/2006<br />
the reef system? including mortality/recovery (transects/quadrats) taxonomic resolution<br />
(transects/quadrats)<br />
• Transects include other macroinvertebrates<br />
• Fish abundance and diversity<br />
surveys<br />
E.<br />
Are adjacent human<br />
impacts causing or<br />
exacerbating the<br />
bleaching?<br />
E1<br />
• Note location, timing (onset,<br />
duration, cessation) and<br />
severity of local human<br />
impacts<br />
• Ask other reef users to give<br />
you similar information<br />
E2<br />
• Collect information on key<br />
environmental variables at<br />
impacts sites (turbidity,<br />
sedimentation, gross pollution<br />
indicators)<br />
E3<br />
• Detailed surveys at control and<br />
impact sites<br />
• Collate existing data on human<br />
impacts such as water quality,<br />
chronic disturbance from<br />
destructive fishing<br />
2. Early Warning System<br />
Mass coral bleaching is preceded by a series of stages. Beginning with the build-up of climatic<br />
conditions that warm sea temperatures, above-average water temperatures follow, which in turn can<br />
lead to patchy bleaching or bleaching of more vulnerable coral species. If stressful conditions persist,<br />
widespread bleaching of a range of coral species can ensue, resulting in a mass bleaching event. The<br />
onset of each of these stages can be used the to provide an early warning of a mass bleaching event.<br />
The GBRMPA Early Warning System consists of three elements designed to detect the onset of each of<br />
the three stages that lead to a mass coral bleaching event:<br />
1. Climate Monitoring: Development of weather conditions that are conducive to elevated sea<br />
temperatures;<br />
2. Sea Temperature Monitoring: Persistence of increased sea temperatures to levels known to cause<br />
stress to corals; and<br />
3. BleachWatch: Early signs of bleaching on reefs and the spatial extent and severity of any bleaching.<br />
2.1 Climate Monitoring<br />
Above-average sea temperatures are associated with El Niño conditions in many reef regions around the<br />
world. While the El Niño Southern Oscillation is an important influence on weather patterns over<br />
eastern Australia, other factors are also known to result in high sea temperatures in the GBR region. In<br />
particular, delayed or weak development of the monsoonal trough over northern Australia during<br />
summer appears to be a strong precursor to the anomalously warm conditions that cause stress to corals.<br />
Based on an emerging understanding of the relationship between weather and sea temperatures for the<br />
GBR, current and forecast weather conditions can provide a useful indicator of pending warming of<br />
waters in the GBR, and thus serve as early warnings of potential stress.<br />
Seasonal climate predictions will be reviewed in the early stages of summer to monitor the development<br />
of regional weather patterns that may lead to anomalous sea temperatures. These will be complemented<br />
with long- to mid-range weather forecasts as the summer progresses.<br />
Objectives: Monitor climate and weather conditions in the lead up to summer to assess risk of<br />
elevated sea temperatures<br />
Strategies: • Monitor long-range climate predictions and weather forecasts<br />
• Obtain 4-Day forecasts and weather summaries from the Bureau of Meteorology<br />
• Explore value of long-range forecast for predicting potential warming conditions<br />
Triggers: Forecasts of calm clear conditions, above average summer temperatures, or below<br />
average rainfall will trigger logistic preparations for the <strong>Bleaching</strong> Assessment and<br />
Monitoring component<br />
Climate Change <strong>Response</strong> Programme - GBRMPA 3
<strong>Great</strong> <strong>Barrier</strong> <strong>Reef</strong> <strong>Coral</strong> <strong>Bleaching</strong> <strong>Response</strong> <strong>Plan</strong> 2005/2006<br />
2.2 Sea Temperature Monitoring<br />
Sea temperatures on the GBR are an indicator of actual stress on corals, and thus serve as an early<br />
warning of potential bleaching on the GBR. The NOAA HotSpots programme provides regional-scale<br />
near-real time measurements of sea surface temperature (SST) anomalies above the maximum expected<br />
summer time temperature. HotSpots and Accumulated Heat Index products from the NOAA web site<br />
provide reliable indicators of levels of heat stress in reef regions and coral bleaching events have been<br />
noted in areas where the HotSpots are greater than 1 degree C anomalous. Over the last year, the<br />
GBRMPA has been developing <strong>Reef</strong>Temp, an improved sea temperature monitoring product for the<br />
GBR region with the Bureau of Meteorology (BoM) and the Commonwealth Scientific and Industrial<br />
Research Organization (CSIRO). <strong>Reef</strong>Temp improves the GBRMPA’s ability to monitor thermal stress,<br />
and allows for the now-casting of bleaching risk at the scale of an individual reef (~2 km resolution).<br />
Images of the a) SST anomaly (above the long-term average temperature for that month); b) number of<br />
Degree Heating Days; and c) Rate of Heat Stress Accumulation are updated on the <strong>Reef</strong>Temp website<br />
daily.<br />
Excessive and persistent SST anomalies indicate sea temperatures are approaching levels that are<br />
known to be stressful to corals, and therefore provide an early warning of coral bleaching. The<br />
development of conditions likely to induce bleaching will be monitored using <strong>Reef</strong>Temp and the<br />
accumulated stress indices therein as indicators of local thermal stress during the summer.<br />
In addition, in situ measurements of local sea temperatures are available from a network of weather<br />
stations on the GBR. These weather stations record water temperature at the surface and 6 m depth,<br />
providing important information about any depth-related variability in water temperatures, while also<br />
providing a mechanism to ground-truth <strong>Reef</strong>Temp predictions.<br />
A network of temperature loggers is also maintained in a collaboration with Australian Institute of<br />
<strong>Marine</strong> Science (AIMS) and the CRC <strong>Reef</strong>. The lengthy retrieval times required for these loggers<br />
precludes them from contributing to an early warning system. However, the data that they provide has<br />
proven invaluable in retrospective analyses of the links between sea temperatures and coral bleaching,<br />
enabling AIMS scientists to develop bleaching thresholds for key locations throughout the <strong>Great</strong> <strong>Barrier</strong><br />
<strong>Reef</strong>.<br />
Objectives: Obtain early warnings of temperature stress and conditions that could lead to<br />
bleaching on the GBR over summer<br />
Strategies: • Actively monitor <strong>Reef</strong>Temp<br />
• Evaluate sea temperature from weather station data to validate the remotely<br />
sensed sea temperatures used in <strong>Reef</strong>Temp<br />
• Actively monitor NOAA HotSpots<br />
Triggers: • The onset of stressful conditions will trigger increased vigilance of coral<br />
condition through BleachWatch and site inspections (Table 2). Stressful<br />
conditions (event triggers) are defined in Table 3<br />
2.3 BleachWatch<br />
The initial onset of mass coral bleaching can range from gradual and patchy to rapid and uniform, and<br />
can occur with varying synchrony over hundreds or thousands of square kilometres. Detecting the early<br />
signs of a mass bleaching event requires a wide network of observers providing regular reports of<br />
conditions throughout the region. BleachWatch is a community monitoring initiative that has been<br />
designed to provide reliable reports of reef condition from a wide range of reef sites throughout the<br />
GBR. BleachWatch is built on a network of regular reef users, including tourism professionals,<br />
scientists, conservation groups, fishers and community members who voluntarily monitor and report on<br />
conditions at reefs that they visit regularly.<br />
BleachWatch was initially established at the start of 2002, during the major bleaching event that<br />
occurred that summer on the GBR. Participants visiting reefs between Port Douglas in the north and<br />
Bundaberg in the south have been enlisted to provide regular reports on the appearance and health of<br />
Climate Change <strong>Response</strong> Programme - GBRMPA 4
<strong>Great</strong> <strong>Barrier</strong> <strong>Reef</strong> <strong>Coral</strong> <strong>Bleaching</strong> <strong>Response</strong> <strong>Plan</strong> 2005/2006<br />
the sites they visit during summer. The number of participants and geographic coverage of<br />
BleachWatch has continued to grow, with currently 87 participants.<br />
BleachWatch participants are provided with a BleachWatch kit and asked to complete purpose-designed<br />
monitoring forms on a weekly basis. Participants are asked to provide general observer information<br />
(section 1), as well as details about their site, type of habitat and specific weather conditions (section 2)<br />
that are known to influence risk of bleaching (i.e. water temperature, cloud cover, air temperature, wind<br />
speed). Detailed information about reef condition (section 3) and bleaching observations is also<br />
collected (a copy of the form is at Appendix A). Once the observer has submitted the first site report to<br />
the GBRMPA, they need only fill out sections 1 and 2 and tick ‘no change’ unless coral bleaching is<br />
observed or there has been a change in conditions at the reef site. It is estimated that completion of the<br />
form takes approximately 10 minutes per week for each participant. The data submitted by<br />
BleachWatch observers will be compiled and synthesised into summary reports during the summer<br />
season, these will be sent to participants for their information and for display to their clientele on board<br />
tourism vessels. The data collected is reviewed weekly to identify where coral bleaching has been<br />
sighted, whether it is spatially or locally significant and whether the Assessment and Monitoring<br />
component of the <strong>Response</strong> <strong>Plan</strong> should be implemented.<br />
Less regular or one off reef visitors can also submit observations on reef status and coral bleaching to a<br />
central database on the GBRMPA website. Reports will be compiled onto maps every 1-2 months<br />
during the summer season, and published on the website.<br />
Objectives: • To detect the early stages of coral bleaching events over a wide geographic area<br />
• To involve the community in reef monitoring, reef education and reef<br />
conservation relating to coral bleaching and climate change<br />
Strategies: • Develop and maintain a network of regular reef users who will provide reports of<br />
coral bleaching conditions at reefs that they regularly visit<br />
• Provide operators with a BleachWatch kit that assists them in reporting on reef<br />
conditions and detecting coral bleaching. The BleachWatch kit includes:<br />
- Interpretive material on coral bleaching and climate change<br />
- Examples of coral growth forms<br />
- Examples of bleaching severity<br />
- Monitoring forms<br />
- Instruction for the monitoring form<br />
- In-water identification wrist band<br />
• Regularly enter and evaluate data received to determine the composition of each<br />
reef to assist with evaluations of bleaching susceptibility<br />
• Provide regular feedback in the form of summary site reports and to all<br />
participants<br />
• Develop and maintain a website providing information on BleachWatch,<br />
including a downloadable version of the datasheet, on-line reporting form and<br />
copies of the site reports for each participant<br />
• Provide regular feedback in the form of reports, web updates and informal<br />
communications, to all participants<br />
Triggers: Reports of spatially extensive or severe local bleaching will trigger the <strong>Bleaching</strong><br />
Assessment and Monitoring component.<br />
2.4 BleachWatch (Aerial)<br />
BleachWatch (Aerial) is the product of broad-scale aerial surveys conducted in previous years.<br />
BleachWatch (Aerial) is a partnership between GBRMPA and Coastwatch and benefits from the active<br />
involvement of Coastwatch pilots and crew who visit an extensive number of reef sites regularly<br />
throughout summer. Pilots and crew are trained in identifying possible bleaching from the air and asked<br />
to take geo-referenced photographs for later analysis. The information collected by BleachWatch<br />
Climate Change <strong>Response</strong> Programme - GBRMPA 5
<strong>Great</strong> <strong>Barrier</strong> <strong>Reef</strong> <strong>Coral</strong> <strong>Bleaching</strong> <strong>Response</strong> <strong>Plan</strong> 2005/2006<br />
(Aerial) helps GBRMPA detect the onset of bleaching and helps assess the full spatial extent and<br />
distribution of a bleaching event.<br />
Objectives:<br />
Strategies:<br />
Triggers:<br />
Assess the spatial extent and distribution of coral bleaching for the entire GBR<br />
Implement a partnership with Coastwatch to incorporate bleaching observations and<br />
photography into routine surveillance flights covering reefs spanning the full length<br />
and breadth of the GBR<br />
Confirmation of conditions conducive to bleaching from the climate and sea<br />
temperature monitoring will trigger the broad-scale synoptic surveys.<br />
3. <strong>Bleaching</strong> Assessment and Monitoring Component<br />
The objective of the <strong>Bleaching</strong> Assessment and Monitoring component is to assess the spatial extent<br />
and severity of coral bleaching events and determine the ecological implications (e.g. coral mortality,<br />
shifts in community structure) resulting from coral bleaching.<br />
Timing is critical for the implementation of bleaching surveys. A bleaching event can progress quite<br />
quickly once visible signs of stress are prevalent, with only four to six weeks required for bleached<br />
corals to either recover or die. On the <strong>Great</strong> <strong>Barrier</strong> <strong>Reef</strong>, the peak of previous bleaching events has<br />
occurred around March-April. If assessments are delayed beyond this time, they are likely to provide an<br />
under-estimate of the amount of bleaching that has occurred as many corals may have died or<br />
recovered, making it difficult to confidently attribute any coral mortality to bleaching-related stress.<br />
A tiered approach using two methods will be used to provide the best possible combination of spatial<br />
coverage and detailed information. The <strong>Bleaching</strong> Assessment and Monitoring component is comprised<br />
of broad-scale synoptic surveys and in-water bleaching surveys. The broad-scale synoptic surveys will<br />
use both MERIS and Quickbird satellite imagery to access different spatial resolution data. CSIRO will<br />
provide the MERIS mapping and the Centre for Remote Sensing and Spatial Information Science at the<br />
University of Queensland will provide the Quickbird high resolution and field mapping. The bleaching<br />
surveys will collect detailed ecological information from a set of established reef sites that represent<br />
cross-shelf as well as latitudinal reefs. This tiered approach is the most effective for obtaining a<br />
synoptic overview of where bleaching is occurring from a GBR-wide perspective.<br />
3.1 Broad-scale synoptic surveys<br />
The correlation between sea surface temperatures and bleaching risk is an area of active research, and<br />
early results are indicating that sea surface temperatures are reliable indicators of regional-scale stress,<br />
but not an accurate predictor of bleaching at individual reefs. Broad-scale synoptic surveys are the most<br />
effective method for obtaining an overview of where bleaching is occurring over spatial scales that are<br />
relevant to management on the GBR (i.e. hundreds to thousands of kilometres). As well as being<br />
important for temporal comparisons of the extent of future bleaching events, broad-scale synoptic<br />
surveys help to identify the reefs or regions worst affected by thermal stress.<br />
The MERIS based mapping will trial a small-scale pilot method during the 2005/2006 summer. The<br />
pilot will involve field validation of remotely sensed images, and will provide a high level of detail on<br />
the health of coral (e.g. healthy coral, bleached coral, recently dead coral). Due to the high level of<br />
resolution, this method will be limited in spatial coverage. The MERIS data will be captured over the<br />
entire GBR and will be used to test the mapping algorithm developed at CSIRO, over inshore and<br />
offshore reefs. The pilot will concentrate in areas around the field survey sites, which will allow the<br />
image data to be validated with field data.<br />
Climate Change <strong>Response</strong> Programme - GBRMPA 6
<strong>Great</strong> <strong>Barrier</strong> <strong>Reef</strong> <strong>Coral</strong> <strong>Bleaching</strong> <strong>Response</strong> <strong>Plan</strong> 2005/2006<br />
If a bleaching event occurs, Quickbird (2.4m pixels) image data will be captured over the sites where<br />
bleaching surveys are conducted. These images will cover 10 km x 10 km sections and will be used to<br />
map bleached versus non-bleached coral areas.<br />
Objectives: Assess the spatial extent and distribution of coral bleaching for select locations along<br />
the GBR;<br />
Strategies: • Utilise satellite imagery (at a spatially relevant scale) to document coral cover<br />
and extent of bleaching at target reefs<br />
• Build hierarchical system using satellite imagery, and in-water data to get a<br />
complete picture and possibly predictive capacity for extent of bleaching<br />
3.2 <strong>Bleaching</strong> Surveys<br />
Although the phenomenon of bleaching has received much attention, the ecological significance of<br />
mass bleaching is still poorly understood. Severe bleaching events have the potential to kill large areas<br />
of living coral, and consequently cause major disturbance to coral reef ecosystems. However, the fate of<br />
bleached corals cannot readily be predicted from observations of the severity or extent of bleaching.<br />
Widespread bleaching does not necessarily equate to widespread coral mortality. To better understand<br />
the long-term implications of these events information on the extent and patterns of coral mortality that<br />
result from bleaching need to be measured.<br />
In-water bleaching surveys will provide more precise information about the percentage and types of<br />
corals that bleach, and then subsequently die or survive. Over longer time frames, the bleaching surveys<br />
will also enable the direction and rate of community recovery to be evaluated. The quantitative data<br />
provided by the bleaching surveys will enable the testing of hypotheses about differences or trends<br />
between sites or through time. Differences in coral community structure that may occur because of<br />
bleaching and mortality will be detected, and information on whether certain community types are more<br />
susceptible to bleaching than others can be obtained.<br />
<strong>Bleaching</strong> surveys will use a combination of rapid visual assessment and more detailed video transects<br />
to provide information about the bleaching event and its ecological impacts. The rapid assessment and<br />
video transects will be done simultaneously at all sites. The two techniques are designed to be<br />
complimentary: the rapid assessment provides basic information about the severity of the bleaching<br />
event in near real-time, while the video transects provide more detailed information, but require<br />
intensive analysis that normally takes weeks to months to complete. Details on site selection,<br />
integration with the AIMS LTMP and survey methods are outlined in the following section Survey<br />
Design and Methods.<br />
Objectives: Assess the percentage of coral bleaching, affected species and mortality for<br />
select reefs along the GBR<br />
Strategies: • Rapid visual assessments to document coral cover, community<br />
composition, and severity of bleaching at target reefs<br />
• Video transects to quantify coral cover, community composition,<br />
and extent and pattern of bleaching at target reefs<br />
• Ground truth aerial data using in-water fine scale surveys<br />
Climate Change <strong>Response</strong> Programme - GBRMPA 7
<strong>Great</strong> <strong>Barrier</strong> <strong>Reef</strong> <strong>Coral</strong> <strong>Bleaching</strong> <strong>Response</strong> <strong>Plan</strong> 2005/2006<br />
Survey Design and Methods<br />
3.2.1 Spatial and Temporal Scale<br />
The <strong>Coral</strong> <strong>Bleaching</strong> <strong>Response</strong> <strong>Plan</strong> will build on<br />
existing programmes, in particular the AIMS Long<br />
Term Monitoring Programme (LTMP), which has a<br />
suite of core sites that are surveyed annually for benthic<br />
cover and diversity, fish diversity and abundance and<br />
other stressors (e.g. COTS). By surveying AIMS LTMP<br />
sites during a bleaching event, important baseline and<br />
recovery data can be incorporated in any assessments.<br />
Additionally, AIMS targeted bleaching surveys will<br />
complement the GBRMPA surveys.<br />
The dynamic nature of coral bleaching requires multiple<br />
temporal and spatial surveys in order to characterise the<br />
extent and severity of bleaching that occurs, and the<br />
ecological implications (i.e. the amount of mortality that<br />
occurs). This ideally requires three temporal surveys:<br />
Baseline - the first survey is used to document reef<br />
status (coral cover and composition) prior to any<br />
changes caused by bleaching. This is best conducted<br />
before the onset of bleaching. The <strong>Response</strong> <strong>Plan</strong> will<br />
utilise AIMS LTMP data from the previous survey<br />
period.<br />
Event Monitoring - the second survey will be timed to<br />
coincide with the peak of the bleaching event, and is<br />
used to document the spatial and taxonomic patterns of<br />
bleaching. This information is necessary to report on the<br />
extent and severity of bleaching, and to interpret the<br />
causes and significance of changes in reef condition.<br />
Recovery - the third survey should be done shortly after<br />
the bleaching event, but not until all corals have either<br />
recovered or died. This survey determines the<br />
ecological impacts of the bleaching by assessing<br />
changes in coral cover or composition attributable to the<br />
bleaching event. The AIMS LTMP data set from the<br />
next survey period will be used to determine reef status<br />
after the bleaching event.<br />
Structured survey sites will be monitored from Lizard<br />
Island in the north to One Tree Island in the south and<br />
have been selected to match the AIMS Long Term<br />
Monitoring Programme (LTMP) sites (see section<br />
3.2.2).<br />
Table 1. Location of Sites for Fine Scale<br />
Ecological Impact Assessments<br />
(I) - inner-shelf reef; (M) – mid-shelf reef;<br />
(O) – outer shelf reef<br />
Transect Region <strong>Reef</strong> Name *<br />
Far Northern Martin <strong>Reef</strong> (I)<br />
(Cooktown to Linnet <strong>Reef</strong> (I)<br />
Lizard Is) Decapolis <strong>Reef</strong> (I)<br />
MacGillivray <strong>Reef</strong> (M)<br />
Nth Direction Is (M)<br />
Lizard Island lagoon (M)<br />
Yonge <strong>Reef</strong> (O)<br />
Carter <strong>Reef</strong> (O)<br />
No Name <strong>Reef</strong> (O)<br />
Northern Green Island (I)<br />
(Cairns)<br />
Low Isles (I)<br />
Fitzroy Is (I)<br />
Mackay <strong>Reef</strong> (M)<br />
Michaelmas Cay (M)<br />
Hastings <strong>Reef</strong> (M)<br />
St Crispin <strong>Reef</strong> (O)<br />
Opal <strong>Reef</strong> (O)<br />
Agincourt No.1 <strong>Reef</strong> (O)<br />
Central<br />
Pandora <strong>Reef</strong> (I)<br />
(Townsville) Havannah Is (I)<br />
Middle <strong>Reef</strong> (I)<br />
Davies <strong>Reef</strong> (M)<br />
Rib <strong>Reef</strong> (M)<br />
John Brewer <strong>Reef</strong> (M)<br />
Chicken <strong>Reef</strong> (O)<br />
Dip <strong>Reef</strong> (O)<br />
Myrmidon <strong>Reef</strong> (O)<br />
Southern Hayman Is (I)<br />
(Whitsundays) Border Island (I)<br />
Langford & Bird Is (I)<br />
<strong>Reef</strong> 19131S (M)<br />
<strong>Reef</strong> 19138S (M)<br />
<strong>Reef</strong> 20104S (M)<br />
Slate <strong>Reef</strong> (O)<br />
Hyde <strong>Reef</strong> (O)<br />
Rebe <strong>Reef</strong> (O)<br />
Far Southern Nth Keppel Is (I)<br />
(Capricorn Pelican Is (I)<br />
Bunkers & Humpy Is (I)<br />
Swains South) Gannet Cay (M)<br />
Chinaman <strong>Reef</strong> (M)<br />
<strong>Reef</strong> 21529S (M)<br />
Turner Cay (O)<br />
Wreck Is (O)<br />
One Tree Island (O)<br />
Climate Change <strong>Response</strong> Programme - GBRMPA 8
<strong>Great</strong> <strong>Barrier</strong> <strong>Reef</strong> <strong>Coral</strong> <strong>Bleaching</strong> <strong>Response</strong> <strong>Plan</strong> 2005/2006<br />
3.2.2 Survey Sites<br />
Each survey will assess the condition and composition of the benthic community along five cross-shelf<br />
transects (Table 1 lists the reef sites for each of these transects). These will be located at latitudes<br />
centred on Lizard Island, Cairns, Townsville, Whitsunday Islands and the Capricorn Bunker Group.<br />
Forty five sites have been selected based on existing AIMS LTMP site locations, to provide for a longterm<br />
data set on coral cover and community composition at the sites. Three inshore, three mid-shelf and<br />
three outer shelf reefs have been selected for each transect. Sites were selected from the AIMS LTMP<br />
database based on the existence of previous coral bleaching survey data (1998 and 2002), accessibility<br />
under predominant weather conditions and location of <strong>Reef</strong> Water Quality Protection <strong>Plan</strong> 1 survey sites.<br />
The benefit of this approach is that baseline and recovery data for the deep transects can be obtained<br />
from the AIMS LTMP routine surveys and thus reduce the need for multiple GBRMPA survey trips and<br />
duplication with existing programmes. However, the LTMP only surveys the coral community on the<br />
lower reef slope (6-9 m) while the GBRMPA <strong>Response</strong> <strong>Plan</strong> also surveys the community on the upper<br />
slope (3-4 m), as this is the area most affected by coral bleaching. It is necessary to obtain a quantitative<br />
baseline assessment of the upper slope community at all of the survey sites to enable us to evaluate the<br />
long-term ecological impacts of coral bleaching on the <strong>Great</strong> <strong>Barrier</strong> <strong>Reef</strong>.<br />
Some remote locations along the GBR have been omitted from the standard sites selected, such as the<br />
northern Swains and Pompey Complex. These locations are rarely visited and do not have long-term<br />
datasets as they are not AIMS LTMP survey sites. If a significant bleaching event occurs, these sites<br />
will be surveyed if logistics allow.<br />
Additional sites may be surveyed using manta tow or rapid assessment techniques in a bleaching event.<br />
These sites would be selected to match those surveyed in the 1998 and 2002 bleaching events, reefs<br />
surveyed under the <strong>Reef</strong> <strong>Plan</strong> monitoring programme (e.g. Daydream Is, Dent Is and Double Cone Is),<br />
and other sites of interest. They will be surveyed as time and resources permit.<br />
3.2.3 Survey Design<br />
Three shelf positions will be surveyed in each transect: inshore, mid-shelf and outer shelf. Three<br />
replicate reefs will be surveyed at each shelf position. Sites will be those established by the AIMS<br />
LTMP and will be divided into 2 depth zones: shallow and deep. The shallow station includes the reef<br />
crest and upper slope from about 1 m – 4 m in depth. The deep station includes the mid to lower reef<br />
slope from 5 – 10 m. Actual depths at each station vary according to the reef morphology and coral<br />
community type and distribution. At more turbid stations, or areas with poorer reef development, these<br />
depths may be shallower, while at stations that are generally characterised by clear conditions they are<br />
deeper. In the few stations with very restricted reef development, only the shallow depth zone is<br />
present. These depth zones, once established, will be fixed for each station.<br />
Three random transects will be surveyed at each depth at each station. Random transects will be used<br />
rather than fixed transects to reduce time required for establishment and survey, avoid unsightly<br />
markers on the reef and ensure independence among consecutive surveys. Each transect will be<br />
surveyed simultaneously by two independent methods: a rapid visual assessment and video transects.<br />
Two divers will swim along a 50 m belt transect, one recording information on the Rapid Assessment<br />
Survey data sheet and the other recording the same substratum area with an underwater video camera.<br />
The rapid assessment survey will record observations on condition of corals and other benthos within a<br />
band 5 m wide along the length of the transect. Three sets of information will be recorded: station<br />
1 The <strong>Reef</strong> Water Quality Protection <strong>Plan</strong> is a joint Australian and Queensland Government initiative to ‘halt and<br />
reverse the decline in water quality entering the <strong>Reef</strong> within 10 years’. The <strong>Reef</strong> <strong>Plan</strong> has a number of actions for<br />
addressing declining water quality, including the implementation of a water quality and ecosystem health longterm<br />
monitoring program in the GBR lagoon.<br />
Climate Change <strong>Response</strong> Programme - GBRMPA 9
<strong>Great</strong> <strong>Barrier</strong> <strong>Reef</strong> <strong>Coral</strong> <strong>Bleaching</strong> <strong>Response</strong> <strong>Plan</strong> 2005/2006<br />
information; general coral and bleaching observations; and detailed information for selected coral<br />
groups. All data will be entered directly onto the specially designed Rapid Assessment Survey data<br />
sheets. The categories for estimating percent cover and progress of bleaching have been standardised on<br />
the survey sheet to enable consistent surveying methods by different observers. A table showing<br />
schematic representations of percent cover will be utilised to maximise consistency in estimates made<br />
under water.<br />
Video transects will be recorded at a distance of 40 cm above the substrate at a speed of 10 metres per<br />
minute (in accordance with the standard protocol used by AIMS).<br />
3.2.4 Data Analysis & Management<br />
Video transect data will be analysed by an appropriately skilled and experienced analyst, and stored in a<br />
database maintained by GBRMPA and shared with AIMS. Data from video transects will be used to<br />
quantify coral cover, community composition, and extent and pattern of bleaching at target reefs.<br />
Data collected using the Rapid Visual Assessment surveys will be stored in a database maintained by<br />
GBRMPA. Data will be used to document coral cover, community composition, and severity of<br />
bleaching at target reefs<br />
3.2.5 Complementary Studies<br />
AIMS Climate Change Programme: temperature loggers<br />
AIMS coordinate the Sea Temperature Monitoring Programme, which includes the deployment and<br />
collection of in-situ data loggers, and the maintenance of a network of weather stations. Data loggers<br />
have been placed on the reef flat, at or near Lowest Astronomical Tide, and on the reef slope at ~ 50<br />
locations spanning the extent of the GBR. At some locations, loggers have been placed on the upper<br />
reef slope (~ 5-9 m), or on the deep reef slope (~ 20 m). Following the 1998 and 2002 bleaching events,<br />
data from these loggers allowed for a better understanding of the link between temperature and the<br />
severity of bleaching responses. <strong>Bleaching</strong> ‘thresholds’ developed from this research can currently be<br />
monitored at the weather station sites on the <strong>Reef</strong> Futures website, and are an important component of<br />
the Early Warning System in the <strong>Response</strong> <strong>Plan</strong>. Additionally, AIMS targeted bleaching surveys will<br />
complement the GBRMPA surveys.<br />
AIMS LTMP<br />
The AIMS Long-term Monitoring Programme has been tracking the condition of the <strong>Great</strong> <strong>Barrier</strong> <strong>Reef</strong><br />
for more than a decade, by surveying fish, corals, crown-of-thorns starfish, and coral disease. The<br />
AIMS monitoring team is the one of the premier bodies focussing on the condition of coral reef<br />
ecosystems in the <strong>Great</strong> <strong>Barrier</strong> <strong>Reef</strong> World Heritage Area. The GBR <strong>Response</strong> <strong>Plan</strong> utilises the<br />
information collected under the LTMP to obtain baseline and recovery data.<br />
<strong>Reef</strong> Water Quality Protection <strong>Plan</strong><br />
In addition to the fine-scale ecological surveys, water quality data collected for the <strong>Reef</strong> Water Quality<br />
Protection <strong>Plan</strong> (<strong>Reef</strong> <strong>Plan</strong>) marine monitoring will be utilised to assess the influence of water quality<br />
stressors on susceptibility to bleaching and recovery post-bleaching. The <strong>Reef</strong> <strong>Plan</strong> monitoring<br />
programme will collect information on temperature, salinity, turbidity, chlorophyll a, sediment and<br />
nutrients loads, flood events (pollutant loads, salinity and flow), pesticide concentrations and reef health<br />
at a number of inshore locations. Many of these sites overlap with proposed fine scale ecological impact<br />
assessment sites of the GBR <strong>Response</strong> <strong>Plan</strong> and there is the opportunity to correlate these sites further<br />
for broad-scale synoptic surveys and bleaching surveys during a bleaching event.<br />
Climate Change <strong>Response</strong> Programme - GBRMPA 10
<strong>Great</strong> <strong>Barrier</strong> <strong>Reef</strong> <strong>Coral</strong> <strong>Bleaching</strong> <strong>Response</strong> <strong>Plan</strong> 2005/2006<br />
4. Communication Strategy<br />
<strong>Coral</strong> bleaching and global climate change are issues that attract strong interest from the public, the<br />
media and senior decision-makers. It is important to proactively release accurate information about<br />
coral bleaching events to all stakeholders as it becomes available in order to raise awareness and ensure<br />
discussions and debate are well informed. The GBR <strong>Coral</strong> <strong>Bleaching</strong> <strong>Response</strong> <strong>Plan</strong> will be the main<br />
source of timely and credible information on coral bleaching on the GBR, and on the ecological<br />
implications for the reef ecosystem.<br />
Information will be delivered directly to stakeholder groups via public meetings, existing formal and<br />
informal networks (including GBRMPA initiatives such as Eye on the <strong>Reef</strong>, Tourism and Recreation<br />
Newsletter and LMACs) and email. Information will also be distributed more widely through the<br />
GBRMPA website and via media outlets. The Communication Strategy aims to increase awareness of<br />
the implications of climate change for the GBR, and the occurrence and consequences of coral<br />
bleaching events through a variety of strategies. Information about coral bleaching will be<br />
communicated using the following methods:<br />
• In the months prior to the period of high bleaching risk, beginning in November, the website will be<br />
reviewed to present the most current information on predicted climate and local weather conditions<br />
and the estimated potential for coral bleaching.<br />
• Information about bleaching issues and notification of web updates will be circulated via industry<br />
newsletters, meetings, and email lists.<br />
• During summer (December to April), the GBRMPA will post regular web reports (every 2-4<br />
weeks) on bleaching conditions on the GBR.<br />
• Reports will also be sent directly to stakeholder groups (tourism operators, <strong>Marine</strong> <strong>Park</strong>s staff,<br />
scientists, etc) via email on a semi-regular basis (every 2-4 weeks).<br />
• Media statements will be prepared and released if/when:<br />
• conditions develop which indicate a high risk of coral bleaching;<br />
• a bleaching event occurs (describing spatial extent and general severity); and<br />
• the bleaching event has concluded (describing coral mortality and ecological impacts).<br />
Climate Change <strong>Response</strong> Programme - GBRMPA 11
<strong>Great</strong> <strong>Barrier</strong> <strong>Reef</strong> <strong>Coral</strong> <strong>Bleaching</strong> <strong>Response</strong> <strong>Plan</strong> 2005/2006<br />
5. Implementation<br />
The sequence of events and decision points for implementation of the GBR <strong>Coral</strong> <strong>Bleaching</strong> <strong>Response</strong><br />
<strong>Plan</strong> are shown in the Schedule below (Figure 2). Climate and weather conditions will be monitored<br />
from mid-November, approximately 3 months prior to the period of greatest bleaching risk. Sea<br />
temperature monitoring and BleachWatch will be implemented from December each summer. If the<br />
onset of high bleaching risk conditions are confirmed, or if there are any reports of significant coral<br />
bleaching, the <strong>Bleaching</strong> Assessment and Monitoring component will be implemented (Figure 2).<br />
Figure 2. Schedule for the GBR <strong>Coral</strong> <strong>Bleaching</strong> <strong>Response</strong> <strong>Plan</strong>.<br />
5.1 <strong>Response</strong> schedule<br />
The GBR <strong>Coral</strong> <strong>Bleaching</strong> <strong>Response</strong> <strong>Plan</strong> consists of a combination of routine tasks and responsive<br />
tasks that are triggered by thresholds.<br />
Routine tasks are designed to provide basic information to help determine if and when a bleaching<br />
event is occurring, and to ensure the Climate Change <strong>Response</strong> Team is prepared for the responsive<br />
tasks. Responsive tasks are implemented if it appears that a major bleaching event is imminent, and are<br />
designed to provide a more detailed picture of bleaching conditions and their ecological significance.<br />
An outline of these tasks is provided below, with a detailed breakdown of tasks provided in Table 2.<br />
5.1.1 Routine Tasks<br />
Prepare for implementation of responsive tasks<br />
Initial assessment of probability of stressful conditions to corals based on long term climate<br />
predictions for summer (i.e. ENSO conditions; development of monsoonal trough);<br />
Establish bleaching reporting system, including email updates and website;<br />
Establish BleachWatch networks;<br />
Climate Change <strong>Response</strong> Programme - GBRMPA 12
<strong>Great</strong> <strong>Barrier</strong> <strong>Reef</strong> <strong>Coral</strong> <strong>Bleaching</strong> <strong>Response</strong> <strong>Plan</strong> 2005/2006<br />
<br />
<br />
<br />
<br />
Monitor weather conditions and sea temperatures and compare against thresholds;<br />
Update assessment of conditions and predicted levels of stress to corals;<br />
Solicit and coordinate information about early signs of bleaching through BleachWatch;<br />
Advise Senior Management and Minister of any increase in bleaching risk or bleaching reports.<br />
5.1.2 Responsive Tasks<br />
Confirm bleaching reports (site inspections)<br />
Advise Senior Management, Minister, stakeholder groups and the community of onset of coral<br />
bleaching;<br />
Implement broad-scale synoptic surveys to assess bleaching extent;<br />
Deploy bleaching survey team to measure extent and severity of bleaching;<br />
Monitor ecological impacts of bleaching.<br />
5.2 Definition of Event Triggers for Implementation <strong>Plan</strong><br />
The triggers for monitoring tasks and briefings outlined in the Implementation <strong>Plan</strong> (Tables 2 and 3) are<br />
defined below.<br />
‘High bleaching risk’ is defined as:<br />
• Persistence of strong hotspots (anomaly > 1.5 deg C) for 2 weeks or very strong hotspots<br />
(anomaly > 2 deg C) for 1 week over majority of GBR region;<br />
• Degree heating days index is greater than 21 at multiple sites;<br />
• <strong>Bleaching</strong> thresholds exceeded at inshore and offshore sites; or<br />
• There are anecdotal reports of bleaching from multiple sites.<br />
‘Low bleaching level’ is defined as:<br />
• Reliable reports of low coral bleaching (1-10% of colonies completely white) from multiple sites<br />
from multiple locations spanning at least two GBR <strong>Marine</strong> <strong>Park</strong> sectors; or<br />
• Reliable reports of mild bleaching (10-50%) from a few sites only, scattered throughout the GBR or<br />
concentrated in only one sector.<br />
‘Moderate bleaching level’ is defined as:<br />
• Reliable reports of moderate coral bleaching (10-50% of colonies completely white) from multiple<br />
sites from multiple locations spanning at least two GBR <strong>Marine</strong> <strong>Park</strong> sectors; or<br />
• Reliable reports of severe bleaching (>50%) from a few sites only, scattered throughout the GBR or<br />
concentrated in only one sector.<br />
‘Severe bleaching level’ is defined as:<br />
• Reliable reports of severe to extreme coral bleaching (>50% of colonies completely white) from<br />
multiple sites spanning multiple GBR sectors.<br />
6. References<br />
Wilkinson, C. (2004). Status of <strong>Coral</strong> <strong>Reef</strong>s of the World: 2004 Summary, AIMS.<br />
Climate Change <strong>Response</strong> Programme - GBRMPA 13
<strong>Great</strong> <strong>Barrier</strong> <strong>Reef</strong> <strong>Coral</strong> <strong>Bleaching</strong> <strong>Response</strong> <strong>Plan</strong> 2005/2006<br />
Climate Change <strong>Response</strong> Programme - GBRMPA 15
Table 4. <strong>Coral</strong> <strong>Bleaching</strong> <strong>Response</strong> <strong>Plan</strong>: Task Schedule<br />
Trigger type Timing Information<br />
Routine - weekly Monday Check GBRMPA <strong>Reef</strong>Temp and NOAA HotSpot maps<br />
on web<br />
Receive updated GBR sea temperature graphs from<br />
AIMS (operational)<br />
Receive high resolution sea temperature maps for GBR (2<br />
km resolution) from BoM<br />
Get weather summary for week, e.g. air temperatures,<br />
cloud cover and wind (BoM)<br />
Review bleaching reports received via BleachWatch and<br />
update maps<br />
Review bleaching reports and images received via<br />
BleachWatch (Aerial) surveys and update maps<br />
Print out <strong>Reef</strong>Temp and NOAA HotSpot maps for STIG<br />
Director to brief SMT<br />
Routine –<br />
weekly/fortnightly<br />
Routine –<br />
weekly/fortnightly<br />
Routine -<br />
weekly/fortnightly<br />
Event-based<br />
Event-based<br />
Tuesday<br />
Wednesday<br />
Constant<br />
Substantial<br />
increase in<br />
environmental<br />
stress 1<br />
Moderate<br />
bleaching<br />
event detected 1<br />
Summarise weather, sea and coral conditions and draft<br />
updated <strong>Bleaching</strong> Risk Current Conditions Report for<br />
website. Include any recent images that may be available<br />
Have updated Current Conditions Report reviewed,<br />
approved and published on external web<br />
Send brief update to all-staff and other lists (ACRS;<br />
DDM, AIMS, CRC <strong>Reef</strong>, <strong>Coral</strong>-List and BleachWatch<br />
participants)<br />
Monitor extent of bleaching using existing information<br />
channels and evaluate for trends (i.e. is the bleaching<br />
situation worsening/improving)<br />
Advise Senior Management and Minister if dramatic<br />
worsening of conditions is evident<br />
Actively seek and solicit confirmatory bleaching reports<br />
from reliable sources, including BleachWatch<br />
participants, DDM Field officers, AIMS, other<br />
researchers, etc.<br />
Alert relevant project coordinators and managers<br />
Brief Senior Management<br />
Brief Executive and Minister<br />
Prepare media position, draft statement and consult with<br />
Media Coordinator and Executive<br />
Brief all staff and stakeholders<br />
Brief collaborators (especially AIMS, NOAA, DDM)<br />
Release media statement<br />
Actively promote and solicit submissions to online<br />
bleaching reports to provide wide spatial coverage<br />
Implement <strong>Bleaching</strong> Assessment and Monitoring<br />
component<br />
1 see Section 6.2 for description of thresholds for event-based tasks.
Appendix A – BleachWatch Reporting Form
Appendix B – Rapid Assessment Survey Data Sheet
<strong>Great</strong> <strong>Barrier</strong> <strong>Reef</strong> <strong>Coral</strong> <strong>Bleaching</strong> <strong>Response</strong> <strong>Plan</strong> 2005/2006<br />
Appendix C – Code tables for key variables<br />
Table 6. Site bleaching category table<br />
Index % Description Visual Assessment<br />
0 < 1 No <strong>Bleaching</strong> No bleaching observed, or only very occasional,<br />
scattered bleached colonies (one or two per dive)<br />
1 1-10 Low level<br />
<strong>Bleaching</strong><br />
Bleached colonies seen occasionally and are<br />
conspicuous, but vast majority of colonies not<br />
bleached<br />
Bleached colonies frequent but less than half of all<br />
colonies<br />
2 10-50 Moderate level<br />
bleaching<br />
3 50-90 Severe <strong>Bleaching</strong> <strong>Bleaching</strong> very frequent and conspicuous, most<br />
corals bleached<br />
4 >90 Extreme <strong>Bleaching</strong> <strong>Bleaching</strong> dominates the landscape, unbleached<br />
colonies not common. The whole reef looks white<br />
Table 7. Colony bleaching table (for use in Line Intercept or Video Transect surveys)<br />
Category Description<br />
0 No bleaching evident<br />
1 Partially bleached (surface/tips);<br />
or pale but not white<br />
2 White<br />
3 Bleached + partly dead<br />
4 Recently dead<br />
Climate Change <strong>Response</strong> Programme - GBRMPA 19
<strong>Great</strong> <strong>Barrier</strong> <strong>Reef</strong> <strong>Coral</strong> <strong>Bleaching</strong> <strong>Response</strong> <strong>Plan</strong> 2005/2006<br />
Appendix D – Schematic representations of percent cover<br />
Category 0<br />
absent (0%)<br />
Category 1<br />
1-10%<br />
Category 2<br />
11-30%<br />
Category 3<br />
31-50%<br />
Category 4<br />
51-75%<br />
Category 5<br />
76-100%<br />
(Adapted from English et al. 1997; after Dahl 1981 – Category 0 added)<br />
Climate Change <strong>Response</strong> Programme - GBRMPA 20