modelling of an automotive air conditioning system using anfis
modelling of an automotive air conditioning system using anfis
modelling of an automotive air conditioning system using anfis

You also want an ePaper? Increase the reach of your titles
YUMPU automatically turns print PDFs into web optimized ePapers that Google loves.
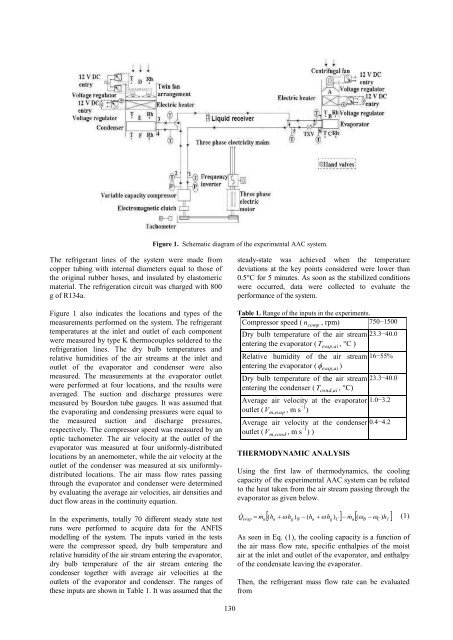
Figure 1. Schematic diagram <strong>of</strong> the experimental AAC <strong>system</strong>.<br />
The refriger<strong>an</strong>t lines <strong>of</strong> the <strong>system</strong> were made from<br />
copper tubing with internal diameters equal to those <strong>of</strong><br />
the original rubber hoses, <strong>an</strong>d insulated by elastomeric<br />
material. The refrigeration circuit was charged with 800<br />
g <strong>of</strong> R134a.<br />
Figure 1 also indicates the locations <strong>an</strong>d types <strong>of</strong> the<br />
measurements performed on the <strong>system</strong>. The refriger<strong>an</strong>t<br />
temperatures at the inlet <strong>an</strong>d outlet <strong>of</strong> each component<br />
were measured by type K thermocouples soldered to the<br />
refrigeration lines. The dry bulb temperatures <strong>an</strong>d<br />
relative humidities <strong>of</strong> the <strong>air</strong> streams at the inlet <strong>an</strong>d<br />
outlet <strong>of</strong> the evaporator <strong>an</strong>d condenser were also<br />
measured. The measurements at the evaporator outlet<br />
were performed at four locations, <strong>an</strong>d the results were<br />
averaged. The suction <strong>an</strong>d discharge pressures were<br />
measured by Bourdon tube gauges. It was assumed that<br />
the evaporating <strong>an</strong>d condensing pressures were equal to<br />
the measured suction <strong>an</strong>d discharge pressures,<br />
respectively. The compressor speed was measured by <strong>an</strong><br />
optic tachometer. The <strong>air</strong> velocity at the outlet <strong>of</strong> the<br />
evaporator was measured at four uniformly-distributed<br />
locations by <strong>an</strong> <strong>an</strong>emometer, while the <strong>air</strong> velocity at the<br />
outlet <strong>of</strong> the condenser was measured at six uniformlydistributed<br />
locations. The <strong>air</strong> mass flow rates passing<br />
through the evaporator <strong>an</strong>d condenser were determined<br />
by evaluating the average <strong>air</strong> velocities, <strong>air</strong> densities <strong>an</strong>d<br />
duct flow areas in the continuity equation.<br />
In the experiments, totally 70 different steady state test<br />
runs were performed to acquire data for the ANFIS<br />
<strong>modelling</strong> <strong>of</strong> the <strong>system</strong>. The inputs varied in the tests<br />
were the compressor speed, dry bulb temperature <strong>an</strong>d<br />
relative humidity <strong>of</strong> the <strong>air</strong> stream entering the evaporator,<br />
dry bulb temperature <strong>of</strong> the <strong>air</strong> stream entering the<br />
condenser together with average <strong>air</strong> velocities at the<br />
outlets <strong>of</strong> the evaporator <strong>an</strong>d condenser. The r<strong>an</strong>ges <strong>of</strong><br />
these inputs are shown in Table 1. It was assumed that the<br />
steady-state was achieved when the temperature<br />
deviations at the key points considered were lower th<strong>an</strong><br />
0.5°C for 5 minutes. As soon as the stabilized conditions<br />
were occurred, data were collected to evaluate the<br />
perform<strong>an</strong>ce <strong>of</strong> the <strong>system</strong>.<br />
Table 1. R<strong>an</strong>ge <strong>of</strong> the inputs in the experiments.<br />
Compressor speed ( n comp , rpm) 750−1500<br />
Dry bulb temperature <strong>of</strong> the <strong>air</strong> stream 23.3−40.0<br />
entering the evaporator ( T , , °C )<br />
evap ai<br />
Relative humidity <strong>of</strong> the <strong>air</strong> stream 16−55%<br />
entering the evaporator ( )<br />
evap, ai<br />
Dry bulb temperature <strong>of</strong> the <strong>air</strong> stream 23.3−40.0<br />
entering the condenser ( T , , °C)<br />
cond ai<br />
Average <strong>air</strong> velocity at the evaporator 1.0−3.2<br />
outlet ( V , , m s −1 )<br />
m evap<br />
Average <strong>air</strong> velocity at the condenser 0.4−4.2<br />
outlet ( V , , m s −1 ) )<br />
m cond<br />
THERMODYNAMIC ANALYSIS<br />
Using the first law <strong>of</strong> thermodynamics, the cooling<br />
capacity <strong>of</strong> the experimental AAC <strong>system</strong> c<strong>an</strong> be related<br />
to the heat taken from the <strong>air</strong> stream passing through the<br />
evaporator as given below.<br />
evap<br />
a<br />
( h h ) ( h h ) <br />
m<br />
(<br />
<br />
h <br />
Q m<br />
) (1)<br />
a<br />
g<br />
B<br />
a<br />
g C<br />
As seen in Eq. (1), the cooling capacity is a function <strong>of</strong><br />
the <strong>air</strong> mass flow rate, specific enthalpies <strong>of</strong> the moist<br />
<strong>air</strong> at the inlet <strong>an</strong>d outlet <strong>of</strong> the evaporator, <strong>an</strong>d enthalpy<br />
<strong>of</strong> the condensate leaving the evaporator.<br />
Then, the refriger<strong>an</strong>t mass flow rate c<strong>an</strong> be evaluated<br />
from<br />
a<br />
B<br />
C<br />
f<br />
130