Boardwalk REIT Second Quarter 2004
Boardwalk REIT Second Quarter 2004
Boardwalk REIT Second Quarter 2004

You also want an ePaper? Increase the reach of your titles
YUMPU automatically turns print PDFs into web optimized ePapers that Google loves.
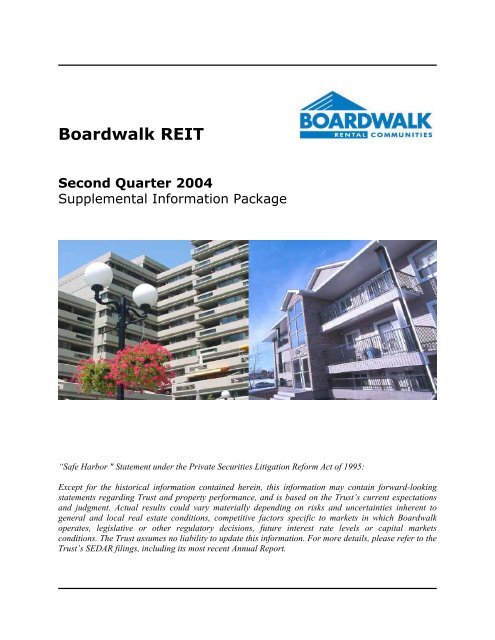
<strong>Boardwalk</strong> <strong>REIT</strong><br />
<strong>Second</strong> <strong>Quarter</strong> <strong>2004</strong><br />
Supplemental Information Package<br />
“Safe Harbor " Statement under the Private Securities Litigation Reform Act of 1995:<br />
Except for the historical information contained herein, this information may contain forward-looking<br />
statements regarding Trust and property performance, and is based on the Trust’s current expectations<br />
and judgment. Actual results could vary materially depending on risks and uncertainties inherent to<br />
general and local real estate conditions, competitive factors specific to markets in which <strong>Boardwalk</strong><br />
operates, legislative or other regulatory decisions, future interest rate levels or capital markets<br />
conditions. The Trust assumes no liability to update this information. For more details, please refer to the<br />
Trust’s SEDAR filings, including its most recent Annual Report.
<strong>Boardwalk</strong> <strong>REIT</strong><br />
Supplemental Information Package for the Period Ended June 30, <strong>2004</strong><br />
Table of Contents<br />
Investor Information……………………………………………………………………………………… 3<br />
Key Summary Financial and Operating Data……………….………………………………. 4<br />
Balance Sheet……………………………………………………………….………………………………. 5<br />
Statement of Earnings………..…………………………………………………………………….….. 6<br />
Funds Flow from Operations and Statement of Cash Flows……………………….. 7<br />
Debt Summary – Maturities………………………………………………………………………….. 8<br />
Debt Summary – By Property……………………………………………………………………….. 9<br />
Portfolio Geographic Breakdown…..………………………………………………………………. 11<br />
Portfolio Statistics………………………………………………………………………………………….. 13<br />
Stabilized Property Information……………………………………………………………………. 15<br />
Acquisition and Disposition Activity………………………………………………………………. 16<br />
Acquisitions Highlights……………………………………………….…………………………………. 17<br />
Cumulative Unit Count………………………………………………………………………………….. 21<br />
Property Portfolio…………………………………………………………………………………………… 22<br />
Corporate Information………….………………………………………………………………………. 26<br />
Supplemental Information Package 2 <strong>Second</strong> <strong>Quarter</strong> <strong>2004</strong><br />
<strong>Boardwalk</strong> <strong>REIT</strong>
Investor Information<br />
Contacts:<br />
<strong>Boardwalk</strong> Real Estate Investment Trust<br />
200, 1501 – 1 Street S.W.<br />
Calgary, Alberta, Canada T2R 0W1<br />
Phone: (403) 531-9255<br />
Facsimile: (403) 531-9565<br />
Email: investor@bwalk.com<br />
World Wide Web: www.<strong>Boardwalk</strong><strong>REIT</strong>.com<br />
Roberto A. Geremia Senior Vice President, Finance & Chief Financial Officer<br />
Paul Moon Director of Corporate Communications<br />
Research Coverage:<br />
Acumen Capital Partners Brian Purdy (403) 571-0685<br />
CIBC World Markets Rossa O’Reilly (416) 594-7296<br />
Nelson Mah (416) 594-8179<br />
Desjardins Securities Frank Mayer (416) 867-3764<br />
Mark Rothschild (416) 867-2051<br />
National Bank Financial Michael Smith (416) 869-8022<br />
Jimmy Shan (416) 869-8025<br />
RBC Dominion Securities Neil Downey (416) 842-7835<br />
Raymond James Ltd. Gail Mifsud (416) 777-7084<br />
Alex Avery (416) 777-7042<br />
Scotia Capital Himalaya Jain (416) 863-7218<br />
Mario Saric (416) 863-7824<br />
Supplemental Information Package 3 <strong>Second</strong> <strong>Quarter</strong> <strong>2004</strong><br />
<strong>Boardwalk</strong> <strong>REIT</strong>
Key Summary Financial and Operating Data<br />
Selected <strong>Quarter</strong>ly Operating Data ($MM except as indicated)<br />
Jun. 30 Mar. 31 Dec. 31 Sept. 30 Jun. 30<br />
<strong>2004</strong> <strong>2004</strong> 2003 2003 2003<br />
(1)<br />
Rental Revenues 70.0 69.8 69.9 68.7 66.7<br />
Total Revenues 70.0 69.8 69.9 68.7 66.7<br />
Property Net Operating Income (NOI) 46.9 42.4 44.9 46.5 44.1<br />
Property NOI Margin 67.0% 60.8% 64.2% 67.7% 66.1%<br />
Administration Expenses 6.0 5.9 5.8 5.9 5.8<br />
Administration Expenses as a % of Rental Revenues 8.6% 8.5% 8.2% 8.5% 8.7%<br />
EBITDA (continuing ops/ex. profits on sales) 40.9 37.3 39.1 40.7 38.3<br />
Operating Earnings Before Income Taxes 1.7 -0.1 6.0 7.6 5.7<br />
Net Earnings 3.0 -1.2 -1.5 4.9 2.6<br />
Funds From Operations - Continuing Operations 20.8 16.5 18.3 19.7 17.1<br />
Funds From Operations - Discontinued Operations (2) 0.0 0.0 0.0 0.0 0.0<br />
Funds From Operations - Total 20.8 16.5 18.3 19.7 17.1<br />
EBITDA (cont. ops.; ex. profits on sales)/ Interest Expense 2.17 1.93 2.03 2.10 2.01<br />
Selected Balance Sheet Data ($MM except as indicated)<br />
Revenue Producing Properties 1,731.3 1,718.9 1,713.2 1,714.8 1,665.4<br />
Properties Held For Development and Resale 7.7<br />
7.6<br />
7.5<br />
7.4<br />
7.3<br />
Total Assets 1,837.8 1,828.0 1,803.4 1,789.9 1,741.1<br />
Mortgages Payable 1,409.3 1,394.2 1,387.1 1,382.6 1,336.5<br />
Bank Indebtedness -<br />
-<br />
-<br />
-<br />
-<br />
Total Debt 1,409.3 1,394.2 1,387.1 1,382.6 1,336.5<br />
Shareholders' Equity 387.4 325.8 308.5 308.9 307.2<br />
Total Capitalization 1,796.8 1,720.1 1,695.6 1,691.5 1,643.7<br />
Debt to Equity 3.64 4.28 4.50 4.48 4.35<br />
Debt as % Total Capitalization 78.4% 81.1% 81.8% 81.7% 81.3%<br />
Portfolio Statistics<br />
Units - end of period 31,780<br />
Share and Share Price<br />
31,425<br />
31,239<br />
31,239<br />
Supplemental Information Package 4 <strong>Second</strong> <strong>Quarter</strong> <strong>2004</strong><br />
<strong>Boardwalk</strong> <strong>REIT</strong><br />
30,593<br />
Share/Unit Price - Close at period end $15.85 $17.70 $17.92 $15.36 $15.26<br />
Shares/Units Outstanding - period end (MM) 53.124 52.727 50.868 50.481 50.437<br />
Shares/Units Outstanding - weighted average (MM) 53.091 51.699 50.603 50.458 50.356<br />
Market Capitalization ($MM except as indicated)<br />
Market Value of Common Equity 842.0 933.3 911.6 775.4 769.7<br />
Total Debt 1,409.3 1,394.2 1,387.1 1,382.6 1,336.5<br />
Total Market Capitalization 2,251.3 2,327.5 2,298.6 2,158.0 2,106.2<br />
Total Debt / Total Market Capitalization 62.6% 59.9% 60.3% 64.1% 63.5%<br />
(1) Information for the period ended June 30, <strong>2004</strong> combines information from <strong>Boardwalk</strong> <strong>REIT</strong> and it's predecessor.<br />
Please see notes 2 and 4 in the press release dated Aug. 13, <strong>2004</strong>.<br />
(2) Includes gains on disposition of properties after Jan. 1, 2003.
Balance Sheet<br />
(Thousands of dollars)<br />
Assets<br />
Jun. 30 Mar.31 Dec. 31 Sep. 30 Jun. 30<br />
<strong>2004</strong> <strong>2004</strong> 2003 2003 2003<br />
(Unaudited) (Unaudited) (Unaudited) (Unaudited) (Unaudited)<br />
(1)<br />
Revenue producing properties $1,731,322 $1,718,931 $1,713,171 $ 1,714,227 $ 1,665,381<br />
Properties held for development and resale 7,695 7,601 7,493 7,386<br />
Deferred financing costs 39,135 38,650 38,044 37,161<br />
Other assets 16,070 18,479 14,652 13,036<br />
Supplemental Information Package 5 <strong>Second</strong> <strong>Quarter</strong> <strong>2004</strong><br />
<strong>Boardwalk</strong> <strong>REIT</strong><br />
7,263<br />
36,175<br />
13,113<br />
Future income taxes 224 - - - -<br />
Mortgages & accounts receivable 13,321 13,687 13,126 10,975<br />
Segregated tenants' security deposits 6,680 6,771 6,771 7,039<br />
Cash and cash equivalents 23,393 23,851 10,123 32<br />
Liabilities<br />
10,943<br />
7,153<br />
1,121<br />
$1,837,840 $1,827,970 $1,803,380 $ 1,789,856 $ 1,741,149<br />
Mortgages payable $1,409,330 $1,394,241 $1,387,067 $ 1,382,602 $ 1,336,490<br />
Accounts payable and accrued liabilities 28,452 19,864 19,801 16,119<br />
Refundable security deposits and other 9,687 9,800 9,730 10,013<br />
Capital lease obligations 2,931 3,205 3,515 3,795<br />
Future income taxes - 75,046 74,765 68,173<br />
Unitholders' Equity<br />
16,120<br />
10,097<br />
4,069<br />
67,183<br />
$1,450,400 $1,502,156 $1,494,878 $ 1,480,702 $ 1,433,959<br />
Unitholders' capital $ 295,041 $ 297,986 $ 275,509 $ 270,894 $ 270,290<br />
Accumulated earnings 92,399 27,828 32,993 38,260<br />
$387,440 325,814 308,502 309,154<br />
36,900<br />
307,190<br />
$1,837,840 $1,827,970 $1,803,380 $ 1,789,856 $ 1,741,149<br />
(1) Information for the period ended June 30, <strong>2004</strong> combines information from <strong>Boardwalk</strong> <strong>REIT</strong> and it's predecessor.<br />
Please see notes 2 and 4 in the press release dated Aug. 13, <strong>2004</strong>.
Statement of Earnings<br />
INFORMATION FOR THE THREE AND SIX MONTHS ENDED JUNE 30, <strong>2004</strong> COMBINES INFORMATION FROM<br />
BOARDWALK REAL ESTATE INVESTMENT TRUST AND ITS PREDECESSOR<br />
(CDN$ THOUSANDS, EXCEPT PER UNIT AMOUNTS)<br />
(Unaudited)<br />
Revenue<br />
3 months<br />
ended<br />
June 30,<br />
<strong>2004</strong><br />
3 months<br />
ended<br />
June 30,<br />
2003<br />
6 months<br />
ended<br />
June 30,<br />
<strong>2004</strong><br />
6 months<br />
ended<br />
June 30,<br />
2003<br />
Rental income $70,040 $66,675 $139,865 $132,382<br />
Expenses<br />
Revenue producing properties:<br />
Operating expenses 7,908 8,141 16,302 16,379<br />
Utilities 8,438 8,061 20,687 18,294<br />
Utility rebate - - (812) -<br />
Property taxes 6,784 6,37<br />
13,529 12,88<br />
6<br />
9<br />
Administration 6,040 5,826 11,963 11,678<br />
Financing costs 18,810 19,002 38,155 37,975<br />
Deferred financing costs amortization 824 1,169 1,525 1,833<br />
Amortization 19,565 12,442 36,938 24,617<br />
Earnings from continuing operations before income taxes 1,671<br />
68,369 61,017 138,287 123,665<br />
5,658 1,578<br />
Large corporations taxes 408 1,018 1,200 1,840<br />
Future income taxes (recovery) (1,718) 2,085 (1,376) 3,555<br />
Earnings from continuing operations 2,981<br />
Earnings from discontinued operations, net of tax -<br />
Net earnings for the period $2,981<br />
Basic earnings per unit<br />
2,555 1,754<br />
- -<br />
$2,555 $1,754<br />
- from continuing operations $0.06 $0.05 $0.03 $0.07<br />
- from discontinued operations - - - 0.01<br />
Basic earnings per unit $0.06 $0.05 $0.03 $0.08<br />
Diluted earnings per unit<br />
- from continuing operations $0.06 $0.05 $0.03 $0.07<br />
- from discontinued operations - - - 0.01<br />
Diluted earnings per unit $0.06 $0.05 $0.03 $0.08<br />
Supplemental Information Package 6 <strong>Second</strong> <strong>Quarter</strong> <strong>2004</strong><br />
<strong>Boardwalk</strong> <strong>REIT</strong><br />
8,717<br />
3,322<br />
751<br />
$4,073
Funds Flow From Operations and Statement of Cash Flows<br />
INFORMATION FOR THE THREE AND SIX MONTHS ENDED JUNE 30, <strong>2004</strong> COMBINES INFORMATION FROM<br />
BOARDWALK REAL ESTATE INVESTMENT TRUST AND ITS PREDECESSOR<br />
(CDN$ THOUSANDS)<br />
(Unaudited)<br />
3 months<br />
ended<br />
June 30,<br />
<strong>2004</strong><br />
3 months<br />
ended<br />
June 30,<br />
2003<br />
6 months<br />
ended<br />
June 30,<br />
<strong>2004</strong><br />
6 months<br />
ended<br />
June 30,<br />
2003<br />
Operating activities<br />
Net earnings for the period $2,981 $2,555 $1,754 $4,073<br />
Earnings from discontinued operations, net of tax - - - (751)<br />
Future income taxes (recovery) (1,718) 2,085 (1,376) 3,555<br />
Amortization 19,565 12,442 36,938 24,617<br />
Funds from continuing operations 20,828 17,082 37,316 31,494<br />
Funds from discontinued operations - - - 33<br />
Net change in operating working capital 155 2,828 (2,259) 324<br />
Net change in properties held for resale (94) 1,783 (202) 1,672<br />
Total operating cash flows 20,889 21,693 34,855 33,523<br />
Financing activities<br />
Issue of trust units (net of issue costs) 6,165 1,310 28,642 4,013<br />
Unit repurchase program (610) - (610) (628)<br />
Distributions paid (10,940) (1,008) (14,878) (2,010)<br />
Financing of revenue producing properties 34,656 46,061 69,855 88,864<br />
Repayment of debt on revenue producing properties (29,978) (51,982) (66,473) (75,888)<br />
Deferred financing costs incurred (net of amortization) (1,504) (664) (2,967) (937)<br />
(2,211) (6,283) 13,569 13,414<br />
Investing activities<br />
Purchases of revenue producing properties (13,089) (3,915) (22,263) (46,433)<br />
Project improvements to revenue producing properties (5,938) (11,812) (12,025) (23,299)<br />
Net cash proceeds from sale of properties - - - 1,223<br />
Technology for real estate operations (109) (648) (866) (938)<br />
(19,136) (16,375) (35,154) (69,447)<br />
Net increase (decrease) in cash and cash equivalents balance during period (458)<br />
(965) 13,270<br />
(22,510)<br />
Cash and cash equivalents, beginning of period 23,851 2,086 10,123 23,631<br />
Cash and cash equivalents, end of period $23,393 $1,121 $23,393 $1,121<br />
Supplementary cash flow information:<br />
Taxes paid $336 $918 $1,242 $1,734<br />
Interest paid $18,901 $19,235 $38,291 $38,088<br />
Supplemental Information Package 7 <strong>Second</strong> <strong>Quarter</strong> <strong>2004</strong><br />
<strong>Boardwalk</strong> <strong>REIT</strong>
Debt Summary – Maturities<br />
$400,000<br />
$350,000<br />
$300,000<br />
$250,000<br />
$200,000<br />
$150,000<br />
$100,000<br />
$50,000<br />
$-<br />
Fiscal Year<br />
Mortgage Balance<br />
Jun. 30, <strong>2004</strong> (000's)<br />
Interest Rate Maturity %<br />
<strong>2004</strong> $ 82,193 5.13% 6%<br />
2005 $ 165,780 4.73% 12%<br />
2006 $ 194,596 4.74% 14%<br />
2007 $ 243,383 5.43% 17%<br />
2008 $ 254,292 6.08% 18%<br />
2009 $ 193,190 5.80% 14%<br />
2010 $ 90,312 6.23% 6%<br />
2011 $ 86,093 6.19% 6%<br />
2012 $ 30,565 6.19% 2%<br />
2013 $ 36,863 5.46% 3%<br />
2014 $ 4,704 5.91% 0%<br />
Subsequent $ 27,360 6.59% 2%<br />
Grand Total $ 1,409,331 5.54% 100%<br />
<strong>2004</strong><br />
2005<br />
2006<br />
2007<br />
2008<br />
2009<br />
2010<br />
2011<br />
2012<br />
2013<br />
2014<br />
Subsequent<br />
Weighted Average Interest rate 5.54%<br />
Average maturity 4.0 years<br />
8.00%<br />
7.00%<br />
6.00%<br />
5.00%<br />
4.00%<br />
3.00%<br />
2.00%<br />
1.00%<br />
0.00%<br />
Mortgage Balance<br />
Jun. 30, <strong>2004</strong><br />
(000's)<br />
Interest Rate<br />
Supplemental Information Package 8 <strong>Second</strong> <strong>Quarter</strong> <strong>2004</strong><br />
<strong>Boardwalk</strong> <strong>REIT</strong>
Debt Summary – Mortgage Balance By Property<br />
Ci<br />
Banf<br />
ty/Province Building Interest Rate<br />
Mortgage Balance<br />
as at Jun. 30, <strong>2004</strong> City/Province Building Interest Rate<br />
Mortgage Balance<br />
as at Jun. 30, <strong>2004</strong><br />
f, AB<br />
Calgary,<br />
AB<br />
Elk Valley Estates<br />
Beltline Towers<br />
6.50%<br />
5.95%<br />
5,278,559<br />
6,160,144<br />
Habitat Village<br />
Imperial Tower<br />
6.17%<br />
5.94%<br />
8,073,237<br />
5,217,796<br />
<strong>Boardwalk</strong> Heights 5.89% 10,672,950<br />
Kew Place 5.94% 4,690,193<br />
Brentview Towers 4.95% 16,136,841<br />
Lansdown Park 6.29% 2,652,913<br />
Cedar Court Gardens 3.66% 3,968,488<br />
Leewood Village 4.70% 7,522,548<br />
Centre Point West 6.39% 7,091,865<br />
Lord Byron 1 6.40% 1,922,745<br />
Century Towers 4.06% 6,123,897<br />
Lord Byron 2 6.40% 1,957,277<br />
Chateau Apartments 6.32% 8,581,992<br />
Lord Byron 3 6.40% 3,553,173<br />
Elbow Towers 7.80% 6,909,692<br />
Lord Byron Townhouses 6.58% 7,961,867<br />
First West Place 7.92% 1,781,280<br />
Lorilei House 4.73% 3,716,325<br />
Flint Ridge 6.14% 3,417,044<br />
Maple Gardens 5.98% 4,948,895<br />
Glamis Green 5.67% 8,035,670<br />
Marlborough Manor 7.04% 2,002,604<br />
Glamorgan 6.24% 4,340,748<br />
Maureen Manor 6.17% 3,713,578<br />
Heritage Garden 6.38% 4,599,556<br />
Meadowside Estates 7.63% 4,487,939<br />
Hillside Estates 6.17% 4,251,867<br />
Meadowview 6.19% 17,503,243<br />
Lakeside 5.92% 4,442,683<br />
Monterey Pointe 5.07% 3,757,201<br />
Leighton House 6.36% 1,960,661<br />
Morningside 6.17% 11,765,609<br />
McKinnon Court 5.94% 2,089,215<br />
Northridge Estates 3.51% 6,113,698<br />
McKinnon Manor 5.89% 2,614,846<br />
Oak Tower 6.24% 3,427,701<br />
Northwest Pointe 5.10% 9,271,748<br />
Palisades 7.32% 4,732,379<br />
Oak Hill 4.65% 17,455,264<br />
Parkside Towers 5.67% 11,207,314<br />
O'Neil Towers 5.98% 12,723,471<br />
Parkview Estates 6.39% 4,722,615<br />
Patrician Village 6.93% 23,041,567<br />
Pembroke 6.04% 9,128,491<br />
Pineridge 5.69% 4,229,875<br />
Pinetree Village 5.33% 5,494,806<br />
Prominence Place 4.05% 4,372,207<br />
Point West Townhouse 6.42% 3,510,633<br />
Radisson Village 3 6.67% 3,399,189<br />
Primrose Lane 4.50% 8,852,042<br />
Radissons 1 5.86% 6,959,954<br />
Prominence Place 4.06% 4,842,953<br />
Radissons 2 5.89% 7,089,583<br />
Redwood 4.06% 6,560,633<br />
Ridgeview Gardens 3.50% 9,647,118<br />
Riverview Manor 6.75% 5,050,402<br />
Royal Park Plaza 6.06% 4,714,587<br />
Royal Heights 6.24% 2,437,932<br />
Russet Court 5.96% 10,370,473<br />
Sandstone 6.48% 3,867,177<br />
Skygate 5.91% 9,336,195<br />
Sir William Place 7.03% 9,841,760<br />
Spruce Ridge Estates 5.67% 21,319,189<br />
Solano House 6.46% 4,357,096<br />
Tower Lane Terrace 5.85% 7,983,393<br />
Southgate Tower 6.00% 8,115,865<br />
Travois Place 7.08% 3,967,063<br />
Summerlea Place 3.99% 2,697,488<br />
Vista Gardens 5.06% 7,618,086<br />
Suncourt Place 6.17% 2,419,159<br />
Edmonton,<br />
AB<br />
Westwinds Village<br />
Willow Park Gardens<br />
Alexander Plaza<br />
6.52%<br />
7.32%<br />
5.94%<br />
9,476,771<br />
3,796,134<br />
7,834,909<br />
Tamarack<br />
Terrace Gardens<br />
Terrace Towers<br />
3.66%<br />
3.50%<br />
6.15%<br />
8,399,675<br />
4,891,330<br />
3,078,068<br />
Aspen Court 4.80% 4,336,663<br />
Tower Hill 6.50% 3,063,093<br />
<strong>Boardwalk</strong> Centre 3.06% 32,961,500<br />
Tower on the Hill 3.85% 6,432,553<br />
<strong>Boardwalk</strong> Village 1 7.32% 7,005,846<br />
Valley Ridge Tower 6.00% 1,909,335<br />
<strong>Boardwalk</strong> Village 2 7.32% 4,385,672<br />
Victorian Arms 6.11% 3,764,161<br />
<strong>Boardwalk</strong> Village 3 7.32% 7,408,827<br />
Viking Arms 3.75% 15,624,431<br />
Breton Manor 7.63% 2,702,113<br />
Village Acres 6.66% 6,410,534<br />
Briarwynd 6.38% 6,672,144<br />
Village Plaza 7.03% 3,720,185<br />
Brookside Terrace 5.79% 7,734,782<br />
Warwick 4.73% 3,185,559<br />
Cambrian Place 5.77% 4,339,853<br />
West Edmonton Court 6.00% 2,915,775<br />
Camelot 6.11% 2,368,543<br />
Westborough Court 5.97% 2,646,454<br />
Capital View Towers 5.49% 6,556,377<br />
Westbrooke Estates 4.85% 8,370,197<br />
Carmen 6.11% 2,368,543<br />
Westmoreland 6.33% 2,609,321<br />
Castle Court 5.77% 3,222,392<br />
Westmount 6.03% 5,401,744<br />
Castleridge 4.73% 6,544,693<br />
Westpark Ridge 5.10% 5,914,643<br />
Cedarville 6.04% 5,475,761<br />
Westridge 'B' 5.94% 3,671,295<br />
Christopher Arms 5.89% 1,563,486<br />
Westridge 'C' 5.93% 3,235,903<br />
Corian Apts 5.99% 6,786,416<br />
Westridge Manor 2.75% 3,119,558<br />
Deville Apartments 5.96% 2,119,419<br />
Westwinds of Summerlea 3.99% 3,283,550<br />
Erminskin Place 3.66% 9,078,966<br />
Willowglen 6.17% 4,295,580<br />
Fairmont Village 5.71% 15,905,801<br />
Wimbledon, The 6.64% 7,616,871<br />
Fontana 6.55% 3,047,849<br />
Fort Gary House 5.96% 3,656,598<br />
Galbraith House 6.54% 6,852,738<br />
Garden Oaks 7.32% 3,761,949<br />
Granville Square 6.03% 2,160,408<br />
Greentree Village 6.25% 6,711,211<br />
Supplemental Information Package 9 <strong>Second</strong> <strong>Quarter</strong> <strong>2004</strong><br />
<strong>Boardwalk</strong> <strong>REIT</strong>
Debt Summary – Mortgage Balance By Property cont.<br />
Ci<br />
For<br />
G<br />
G<br />
Kitc<br />
Lond<br />
Mont<br />
Q<br />
Red Deer<br />
Regina,<br />
Mortgage Balance<br />
Mortgage Balance<br />
ty/Province<br />
t McMurray, AB<br />
Building<br />
Birchwood Manor<br />
Chanteclair<br />
Interest Rate<br />
5.87%<br />
5.67%<br />
as at Jun. 30, <strong>2004</strong><br />
665,695<br />
5,169,731<br />
City/Province Building<br />
Saskatoon, SK Carlton Towers<br />
Chancellor Gate<br />
Interest Rate<br />
6.08%<br />
6.38%<br />
as at Jun. 30, <strong>2004</strong><br />
7,712,339<br />
2,885,608<br />
Edelweiss Terrace 5.87% 899,203<br />
Dorchester Towers 5.88% 2,264,240<br />
Granada, The 6.49% 2,122,426<br />
Heritage Pointe 5.27% 5,182,835<br />
Heatherton Apt 6.21% 640,532<br />
Lawson Village 5.95% 2,131,799<br />
Hillside Manor 6.21% 831,488<br />
Meadow Park 5.56% 10,000,298<br />
Mallard Arms 7.45% 1,515,782<br />
Palace Gate 5.94% 7,606,597<br />
McMurray Manor 5.97% 1,203,309<br />
Penthouse 2.95% 3,066,242<br />
atineau, QC<br />
rande Prairie, AB<br />
Valencia, The<br />
Parc de la Montagne<br />
Parkview Homes<br />
6.49%<br />
5.59%<br />
6.53%<br />
1,962,948<br />
13,666,134<br />
1,315,300<br />
Regal Towers I<br />
Regal Towers II<br />
Reid Park Estates<br />
5.10%<br />
5.10%<br />
6.14%<br />
2,634,513<br />
2,937,804<br />
4,622,630<br />
hener, ON<br />
Parkview Portfolio<br />
Kings Tower<br />
6.05%<br />
3.05%<br />
16,247,416<br />
4,468,929<br />
St. Charles<br />
St. James<br />
4.86%<br />
5.92%<br />
4,961,649<br />
2,982,934<br />
on, ON<br />
Westheights<br />
Abbey Estates<br />
Bristol, The<br />
3.77%<br />
7.00%<br />
8.85%<br />
5,446,701<br />
2,527,759<br />
3,502,543<br />
Stonebridge 1<br />
Stonebridge 2<br />
Stonebridge Apts<br />
5.84%<br />
5.84%<br />
5.98%<br />
2,926,109<br />
1,396,570<br />
6,058,054<br />
Bristol, The VTB 3.00% 1,527,929<br />
Wildwood 5.84% 2,327,618<br />
Castlegrove 5.01% 4,693,466 Windsor, ON Anchorage Apts 6.40% 4,989,897<br />
Forest City Estates 6.74% 6,091,214<br />
Askin Towers 6.41% 3,020,982<br />
Heritage Square 6.28% 9,408,451<br />
Buckingham Tower 6.41% 2,003,692<br />
Landmark Towers 6.48% 6,692,858<br />
Caron Tower 7.24% 1,850,396<br />
Maple Ridge on the Parc 4.09% 5,022,245<br />
Empress Court Apts 6.39% 1,298,437<br />
Meadowcrest 6.38% 4,066,724<br />
Frances Tower 7.24% 2,080,886<br />
Noel Meadows 3.84% 3,168,281<br />
Glenwood Apartments 6.41% 1,553,064<br />
Ridgewood 7.20% 1,258,987<br />
Janisse Tower 4.10% 3,170,796<br />
Sandford 4.10% 3,171,870<br />
Lauzon Towers 6.41% 9,500,313<br />
Topping Lane Towers 7.17% 6,718,476<br />
Marine Court 6.41% 3,222,475<br />
real, QC<br />
Villages of Hyde Park<br />
Domaine d'Iberville<br />
3.65%<br />
5.76%<br />
2,569,691<br />
25,770,359<br />
Randal Court<br />
Regency Colonnade<br />
6.87%<br />
7.00%<br />
1,923,389<br />
6,468,165<br />
La Quatre Cente 6.53% 9,132,379<br />
Riverdale Manor 6.41% 5,057,587<br />
Les Jardins Bourassa 5.25% 2,997,682<br />
Rivershore Tower 6.57% 3,589,816<br />
uebec City, QC<br />
600 Cote Vertu<br />
Nuns' Island<br />
Complexe Laudance<br />
6.33%<br />
5.23%<br />
5.24%<br />
4,253,998<br />
147,658,389<br />
12,511,340<br />
Sandilands Tower<br />
Seaway Tower<br />
Sun Ray Manor<br />
6.87%<br />
6.41%<br />
6.87%<br />
1,923,389<br />
7,336,330<br />
1,374,091<br />
Le Laurier 6.97% 4,601,049<br />
University Towers 6.41% 2,427,647<br />
Les Appartements du Verdier 5.96% 6,725,535<br />
Les Jardins de Merici 3.25% 21,933,197<br />
Place Charlesbourg 6.72% 3,068,993<br />
, AB<br />
Place du Parc<br />
Place Samuel de Champlain<br />
Canyon Pointe<br />
6.10%<br />
6.22%<br />
6.10%<br />
3,664,970<br />
5,396,086<br />
6,209,262<br />
Cloverhill Terrace 5.80% 5,650,836<br />
Ingelwood Terrace 6.68% 2,937,153<br />
Riverbend Village 6.67% 6,241,048<br />
Saratoga Towers 5.90% 2,096,039<br />
Taylor Heights 2.71% 5,440,409<br />
Watson Towers 5.90% 1,635,948<br />
SK<br />
Westridge Estates<br />
Ashok Portfolio<br />
<strong>Boardwalk</strong> Estates<br />
4.45%<br />
6.39%<br />
6.18%<br />
5,667,962<br />
4,463,468<br />
16,006,727<br />
<strong>Boardwalk</strong> Manor 5.53% 2,264,833<br />
Centenial South 6.44% 7,503,912<br />
Centennial West 6.18% 1,855,410<br />
Eastside Estates 5.98% 5,252,038<br />
Evergreen Estates 6.10% 5,295,030<br />
Grace Manor 5.27% 3,410,122<br />
Green Briar 5.49% 2,851,304<br />
Lockwood Arms 5.83% 2,881,975<br />
Meadows, The 6.24% 1,140,820<br />
Pines of Normanview 5.77% 5,196,493<br />
Qu'Appelle 1 & 2 5.77% 5,886,570<br />
Qu'Appelle 3 5.77% 6,986,173<br />
Southpoint Plaza 5.98% 5,591,279<br />
Wascana 5.56% 15,647,237<br />
Supplemental Information Package 10 <strong>Second</strong> <strong>Quarter</strong> <strong>2004</strong><br />
<strong>Boardwalk</strong> <strong>REIT</strong>
Portfolio Geographic Breakdown<br />
Province Number of Units % of Units<br />
By Province<br />
Net Rentable Square Footage % of Square Footage Average Unit Size<br />
Alberta 17,045 54% 14,406,729 54% 845<br />
Saskatchewan 4,660 15% 3,855,658 14% 827<br />
Ontario 4,167 13% 3,339,045 12% 801<br />
Quebec 5,908 19% 5,146,026 19% 871<br />
Total 31,780 100% 26,747,458 100% 842<br />
Ontario<br />
13%<br />
Unit Breakdown by Province<br />
Quebec<br />
19%<br />
Saskatchewan<br />
15%<br />
Alberta<br />
53%<br />
Supplemental Information Package 11 <strong>Second</strong> <strong>Quarter</strong> <strong>2004</strong><br />
<strong>Boardwalk</strong> <strong>REIT</strong>
Portfolio Geographic Breakdown (cont’d)<br />
Core cities Number of Units<br />
By City<br />
% of Units Net Rentable Square Footage % of Square Footage Average Unit Size<br />
Calgary, AB 4,648 14.6% 3,774,685 14% 812<br />
Edmonton, AB 10,554 33.2% 9,140,423 34% 866<br />
Fort McMurray, AB 352 1.1% 281,954 1% 801<br />
Grande Prairie, AB 401 1.3% 337,060 1% 841<br />
Red Deer, AB 851 2.7% 688,347 3% 809<br />
other-AB 239 0.8% 184,260 1% 771<br />
Regina, SK 2,672 8.4% 2,163,015 8% 810<br />
Saskatoon, SK 1,988 6.3% 1,692,643 6% 851<br />
Gatineau, QC 321 1.0% 204,055 1% 636<br />
Montreal, QC 4,345 13.7% 3,943,144 15% 908<br />
Quebec City, QC 1,242 3.9% 998,827 4% 804<br />
Kitchener, ON 329 1.0% 263,020 1% 799<br />
London, ON 2,256 7.1% 1,867,146 7% 828<br />
Windsor, ON 1,582 5.0% 1,208,879 5% 764<br />
Total 31,780 100% 26,747,458 100% 842<br />
Regina<br />
8.4%<br />
Saskatoon<br />
6.3%<br />
Montreal<br />
13.7%<br />
London<br />
7.1%<br />
Unit Breakdown by City<br />
Quebec City<br />
3.9%<br />
Windsor Other-AB<br />
5.0%<br />
Kitchener<br />
5.8%<br />
1.0%<br />
Gatineau<br />
1.0%<br />
Calgary<br />
14.6%<br />
Edmonton<br />
33.2%<br />
Supplemental Information Package 12 <strong>Second</strong> <strong>Quarter</strong> <strong>2004</strong><br />
<strong>Boardwalk</strong> <strong>REIT</strong>
Portfolio Statistics – Customer and Associate Turnovers<br />
Units<br />
2500<br />
2000<br />
1500<br />
1000<br />
500<br />
0<br />
Jan-00<br />
Apr-00<br />
Jul-00<br />
Oct-00<br />
Jan-01<br />
Apr-01<br />
Jul-01<br />
Seasonal Trend Analysis<br />
Oct-01<br />
Jan-02<br />
Apr-02<br />
Jul-02<br />
Supplemental Information Package 13 <strong>Second</strong> <strong>Quarter</strong> <strong>2004</strong><br />
<strong>Boardwalk</strong> <strong>REIT</strong><br />
Oct-02<br />
Jan-03<br />
Apr-03<br />
Total Move Outs Total Rented Vacancy<br />
Month<br />
Total Move Outs (Units)<br />
<strong>2004</strong> 2003 % change<br />
Total Rented (Units)<br />
<strong>2004</strong> 2003 % change <strong>2004</strong><br />
Vacancy<br />
2003 % change<br />
Jan 933 945 -1.3% 1067 1056 1.0% 4.19% 5.39% -22.4%<br />
Feb 1097 1056 3.9% 1009 1211 -16.7% 4.08% 5.18% -21.2%<br />
Mar 1299 1165 11.5% 1410 1561 -9.7% 4.52% 4.98% -9.3%<br />
Apr 1810 1645 10.0% 1575 1510 4.3% 4.66% 4.37% 6.6%<br />
May 1637 1566 4.5% 1449 1561 -7.2% 5.58% 4.86% 14.8%<br />
Jun 1857 1773 4.7% 1664 1728 -3.7% 6.07% 4.96% 22.5%<br />
Jul 1553 1478 5.1% 1953 1853 5.4% 6.60% 5.12% 28.8%<br />
Total/YTD 10186 9628 5.8% 10127 10480 -3.4% 5.10% 4.98% 2.4%<br />
Associate Turnovers<br />
<strong>Quarter</strong> <strong>2004</strong> 2003<br />
Q1 6.6% 4.3%<br />
Q2 8.2% 6.6%<br />
Q3 - 8.6%<br />
Q4 - 7.7%<br />
Total/YTD 14.2% 24.9%<br />
Jul-03<br />
Oct-03<br />
Jan-04<br />
Apr-04<br />
Jul-04<br />
9.00%<br />
8.00%<br />
7.00%<br />
6.00%<br />
5.00%<br />
4.00%<br />
3.00%<br />
2.00%<br />
1.00%<br />
0.00%<br />
Vacancy
Portfolio Statistics – Vacancy and Rental Revenues<br />
City Q2 <strong>2004</strong> Q2 2003 Q1 <strong>2004</strong> Q4 2003 Q3 2003 Q2 2003<br />
Calgary 5.77% 7.21% 4.94% 5.19% 5.56% 7.21%<br />
Edmonton 6.64% 4.99% 5.15% 4.03% 3.66% 4.99%<br />
Gatineau 8.54% 3.12% 6.04% 3.02% 2.40% 3.12%<br />
Laval 5.47% 3.04% 3.70% 3.85% 3.65% 3.04%<br />
Kitchener 0.77% - - - - -<br />
London 3.55% 4.08% 3.32% 3.04% 2.99% 4.08%<br />
Montreal<br />
1.74% 1.68% 2.47% 2.47% 2.27% 1.68%<br />
Other Alberta 4.29% 9.32% 2.87% 3.99% 6.48% 9.32%<br />
Quebec City 2.63% 0.78% 3.20% 2.15% 1.24% 0.78%<br />
Regina 4.63% 4.32% 2.58% 2.36% 2.76% 4.32%<br />
Saskatoon 6.90% 6.73% 5.61% 3.45% 2.85% 6.73%<br />
Windsor 9.04% 4.06% 4.92% 3.75% 3.42% 4.06%<br />
Grand Total 5.67% 4.99% 4.32% 3.67% 3.66% 4.99%<br />
Rental Revenue Statistics<br />
$727<br />
$739<br />
Prior <strong>Quarter</strong>s<br />
$778<br />
$790<br />
680 700 720 740 760 780 800<br />
Market Rent per unit / Current Occupied Rent per unit<br />
Avg. Rent <strong>2004</strong> - 6 months Avg. Rent 2003 - 6 months<br />
Supplemental Information Package 14 <strong>Second</strong> <strong>Quarter</strong> <strong>2004</strong><br />
<strong>Boardwalk</strong> <strong>REIT</strong>
Stabilized Property Information (Properties held in excess of 24 months)<br />
Unstabilized<br />
9%<br />
Units<br />
Stabilized<br />
91%<br />
Gross Rental Revenue Analysis<br />
Stabilized<br />
90%<br />
Three Months Ended Jun. 30, <strong>2004</strong> vs. Three Months Ended Jun. 30, 2003<br />
Rental<br />
Other Total<br />
Revenues Utilities Expenses Expenses NOI % of NOI<br />
Calgary -0.2% 3.5% -18.3% -10.6% 4.0% 20%<br />
Edmonton -0.2% 8.5% -13.0% -4.9% 1.9% 36%<br />
Other Alberta -0.2% -27.2% -15.7% -20.8% 11.5% 6%<br />
Saskatchewan 1.1% 8.1% -2.1% 0.7% 1.3% 12%<br />
Ontario 2.4% -9.5% -4.5% -6.3% 9.4% 12%<br />
Montreal 4.2% 27.2% -21.2% -5.7% 9.0% 14%<br />
Total 0.9% 3.9% -11.8% -6.3% 4.6% 100%<br />
Six Months Ended Jun. 30, <strong>2004</strong> vs. Six Months Ended Jun. 30, 2003<br />
Rental<br />
Other Total<br />
Revenues Utilities Expenses Expenses NOI % of NOI<br />
Calgary -0.1% 3.9% -9.0% -4.2% 1.5% 20%<br />
Edmonton 0.2% 4.7% -14.4% -6.6% 3.8% 37%<br />
Other Alberta 4.3% -1.1% 23.6% 14.3% -0.8% 5%<br />
Saskatchewan 1.6% 17.0% -4.6% 2.2% 1.2% 12%<br />
Ontario 3.7% -12.5% -2.7% -6.5% 13.8% 12%<br />
Montreal 4.3% 7.3% -11.0% -4.5% 8.3% 14%<br />
Total 1.5% 2.7% -7.5% -3.6% 4.4% 100%<br />
Unstabilized<br />
10%<br />
Supplemental Information Package 15 <strong>Second</strong> <strong>Quarter</strong> <strong>2004</strong><br />
<strong>Boardwalk</strong> <strong>REIT</strong>
Acquisition and Disposition Activity<br />
A<br />
Buil<br />
Q1 2<br />
Com<br />
cquisitions<br />
ding Name<br />
004<br />
plexe Laudance<br />
Date Aquired<br />
2/11/04<br />
City<br />
Saint-Foy/Quebec City, QC<br />
Units<br />
183<br />
Purchase<br />
Price<br />
$ 16,850,000<br />
Price/<br />
Unit<br />
$92,077<br />
Going in<br />
Cap Rate<br />
7.96%<br />
Avg.<br />
Sq. Ft.<br />
735<br />
Price/<br />
Sq.Ft.<br />
$ 125.3<br />
For<br />
Residenc<br />
Q2 <strong>2004</strong><br />
Domaine<br />
du Rocher<br />
est Glade Townhomes<br />
5/13/<strong>2004</strong><br />
5/17/<strong>2004</strong><br />
Levis/Quebec City, QC<br />
Windsor, ON<br />
64<br />
31<br />
$ 3,500,000<br />
$ 2,500,000<br />
$54,688<br />
$80,645<br />
7.65%<br />
9.53%<br />
1065<br />
1250<br />
$ 51.3<br />
$ 64.5<br />
e le Quatre Cent<br />
Q2<br />
Total<br />
5/26/<strong>2004</strong> Laval/Montreal, QC 259<br />
354<br />
$ 17,300,000<br />
$ 23,300,000<br />
$66,795<br />
$65,819<br />
8.01%<br />
8.08%<br />
593<br />
736<br />
$ 112.6<br />
$ 89.4<br />
Total<br />
537 $ 40,150,000 $74,767 8.04% 736 $ 101.6<br />
Supplemental Information Package 16 <strong>Second</strong> <strong>Quarter</strong> <strong>2004</strong><br />
<strong>Boardwalk</strong> <strong>REIT</strong>
Q1 Acquisition Highlight<br />
Complexe Laudance<br />
850 Rue Laudance, Quebec City (Sainte-Foy), QC<br />
Acquisition date: February 11, <strong>2004</strong><br />
Description:<br />
The property is a luxurious apartment complex consisting of<br />
183 units within two mid-rise concrete buildings, one 6<br />
storey and one 4 storey, with the buildings constructed and<br />
completed in 1989 and 1990.<br />
The average unit size is approximately 750 square feet.<br />
Location/Amenities:<br />
The surrounding area consists mainly of multifamily<br />
residences, condominiums, and various retail stores.<br />
The existing tenant base, the majority of whom are retired or<br />
semi-retired, have a number of services offered to them by<br />
the building including medical care services, pharmacist, bus<br />
transportation to various shopping districts, chapel and a<br />
library.<br />
Supplemental Information Package 17 <strong>Second</strong> <strong>Quarter</strong> <strong>2004</strong><br />
<strong>Boardwalk</strong> <strong>REIT</strong>
Q2 Acquisition Highlight<br />
Domaine du Rocher<br />
300 – 454 rue Hector-Fabre, Quebec City (Levis), QC<br />
Acquisition date: May 13, <strong>2004</strong><br />
Description:<br />
This 64-unit property consists of 12 buildings ranging from 2<br />
to 3 storeys in height. Average unit size is over 1,000 sq. ft.<br />
per unit, with all of the buildings constructed between 1995<br />
and 1996.<br />
Location/Amenities:<br />
Domaine du Rocher is located east of Chemin des Iles and<br />
south of Rive-Sud Boulevard. The area includes houses and<br />
apartments buildings of recent construction. Nearby<br />
Ultramar refinery, Pointe-Lévis Marina, as well as a few<br />
stores on Rive-Sud Boulevard make for a desirable location<br />
for residents.<br />
Supplemental Information Package 18 <strong>Second</strong> <strong>Quarter</strong> <strong>2004</strong><br />
<strong>Boardwalk</strong> <strong>REIT</strong>
Q2 Acquisition Highlight<br />
Forest Glade Townhomes<br />
2932 – 2992 Wildwood Drive, Windsor, ON<br />
Acquisition date: May 17, <strong>2004</strong><br />
Description:<br />
This 2 storey townhouse property consists of 31 units, each<br />
with 3 bedrooms. Each unit has approximately 1,250 sq. ft<br />
with 1 ½ baths, living room, and kitchen with dining room.<br />
Each unit also has rear patios which are divided by wood<br />
fencing for added privacy.<br />
Location/Amenities:<br />
Forest Glade Townhomes are located in a good residential<br />
neighbourhood in East Windsor just south of Tecumseh<br />
Road East.<br />
Supplemental Information Package 19 <strong>Second</strong> <strong>Quarter</strong> <strong>2004</strong><br />
<strong>Boardwalk</strong> <strong>REIT</strong>
Q2 Acquisition Highlight<br />
Résidence le Quatre Cent<br />
400 Place Juge-Desnoyers, Montreal (Laval), QC<br />
Acquisition date: May 26, <strong>2004</strong><br />
Description:<br />
This 16-storey brick and concrete building was constructed in<br />
1980. The building contains 259 units with a variety of suite<br />
sizes and types including studio, one and two bedroom units.<br />
Commercial units, administrative offices and a recreation<br />
room occupy the ground floor of the building.<br />
Location/Amenities:<br />
Résidence le Quatre Cent is located in the city of Laval and<br />
is strategically set close to the Bridge-Viau which connects<br />
Laval to Montreal. The property also is near the<br />
intersection of Laurentides Boulevard and Cartier Boulevard<br />
which make various services available.<br />
Supplemental Information Package 20 <strong>Second</strong> <strong>Quarter</strong> <strong>2004</strong><br />
<strong>Boardwalk</strong> <strong>REIT</strong>
Cumulative Unit Count<br />
35,000<br />
30,000<br />
25,000<br />
20,000<br />
15,000<br />
10,000<br />
5,000<br />
-<br />
5/31/1994<br />
974<br />
5/31/1995<br />
2,654 2,338<br />
5/31/1996<br />
5/31/1997<br />
8,787<br />
Total Portfolio - Units<br />
5/31/1998<br />
19,480<br />
5/31/1999<br />
24,937 24,821<br />
22,441<br />
25,889<br />
5/31/2000<br />
12/31/2000<br />
12/31/2001<br />
Cumulative Number of units<br />
12/31/2002<br />
31,239<br />
29,326<br />
31,780<br />
12/31/2003<br />
Q2 <strong>2004</strong><br />
Supplemental Information Package 21 <strong>Second</strong> <strong>Quarter</strong> <strong>2004</strong><br />
<strong>Boardwalk</strong> <strong>REIT</strong>
Property Portfolio<br />
Number of Net Rentable Square<br />
City/Province<br />
Calgary, AB<br />
Property Name Building Type<br />
Units<br />
Footage<br />
Beltline Towers Highrise 115 80,424<br />
<strong>Boardwalk</strong> Heights Highrise 202 160,894<br />
Brentview Towers Highrise 239 151,440<br />
Cedar Court Gardens Townhouse 65 58,560<br />
Centre Point West Highrise 123 110,611<br />
Century Towers Highrise 90 73,411<br />
Chateau Apartments Highrise 145 110,545<br />
Elbow Towers Highrise 158 108,280<br />
Flintridge Place Highrise 68 55,023<br />
Glamis Green Townhouse 156 173,881<br />
Glamorgan Manor Garden 86 63,510<br />
Heritage Gardens Highrise 91 64,250<br />
Hillside Estates Garden 76 58,900<br />
Lakeside Estates Garden 89 77,732<br />
Leighton House Highrise 38 27,352<br />
McKinnon Court Garden 48 36,540<br />
McKinnon Manor Garden 60 43,740<br />
Northwest Pointe Garden 150 102,750<br />
Oakhill Townhouse 240 236,040<br />
O'Neil Towers Highrise 187 131,281<br />
Patrician Village Garden 392 295,600<br />
Pineridge Apartments Garden 76 52,275<br />
Prominence Place Garden 75 55,920<br />
Radisson I Townhouse 124 108,269<br />
Radisson II Townhouse 124 108,015<br />
Radisson III Townhouse 118 124,379<br />
Ridgeview Gardens Townhouse 160 151,080<br />
Royal Park Plaza Highrise 86 66,137<br />
Russet Court Townhouse 206 213,264<br />
Skygate Tower Highrise 142 113,350<br />
Spruce Ridge Estates Garden 284 196,464<br />
Travois Apartments Garden 89 61,350<br />
Vista Gardens Garden 100 121,040<br />
Westwinds Village Garden 180 137,815<br />
Willow Park Gardens Garden 66 44,563<br />
Edmonton, AB<br />
4,648 3,774,685<br />
Alexander Plaza Garden 252 203,740<br />
Aspen Court Garden 80 68,680<br />
<strong>Boardwalk</strong> Arms A & B Garden 78 64,340<br />
<strong>Boardwalk</strong> Centre Highrise 597 471,871<br />
<strong>Boardwalk</strong> Village I II & III Townhouse 255 258,150<br />
Breton Manor Garden 66 57,760<br />
Briarwynd Court Townhouse 172 144,896<br />
Brookside Terrace Garden 131 196,779<br />
Cambrian Place Garden 105 105,008<br />
Camelot Garden 64 54,625<br />
Capital View Towers Highrise 115 71,281<br />
Carmen Garden 64 54,625<br />
Castle Court Garden 89 93,950<br />
Castleridge Estates Townhouse 108 124,524<br />
Cedarville Garden 144 122,120<br />
Christopher Arms Garden 45 29,900<br />
Corian Apartments Garden 153 167,400<br />
Deville Apartments Highrise 66 47,700<br />
Ermineskin Place Highrise 226 181,788<br />
Fairmont Village Garden 424 362,184<br />
Fontana Highrise 62 40,820<br />
Fort Garry House Highrise 93 70,950<br />
Galbraith House Highrise 163 110,400<br />
Average Unit<br />
Size<br />
Supplemental Information Package 22 <strong>Second</strong> <strong>Quarter</strong> <strong>2004</strong><br />
<strong>Boardwalk</strong> <strong>REIT</strong><br />
699<br />
797<br />
634<br />
901<br />
899<br />
816<br />
762<br />
685<br />
809<br />
1,115<br />
738<br />
706<br />
775<br />
873<br />
720<br />
761<br />
729<br />
685<br />
984<br />
702<br />
754<br />
688<br />
746<br />
873<br />
871<br />
1,054<br />
944<br />
769<br />
1,035<br />
798<br />
692<br />
689<br />
1,210<br />
766<br />
675<br />
812<br />
808<br />
859<br />
825<br />
790<br />
1,012<br />
875<br />
842<br />
1,502<br />
1,000<br />
854<br />
620<br />
854<br />
1,056<br />
1,153<br />
848<br />
664<br />
1,094<br />
723<br />
804<br />
854<br />
658<br />
763<br />
677
City/Province Property Name Building Type<br />
Number of<br />
Units<br />
Net Rentable Square<br />
Footage<br />
Garden Oaks Garden 56 47,250<br />
Granville Townhouse 48 53,376<br />
Greentree Village Garden 192 156,000<br />
Habitat Village Townhouse 151 129,256<br />
Imperial Tower Highrise 138 112,050<br />
Kew Place Townhouse 108 105,776<br />
Lansdowne Park Highrise 62 48,473<br />
Leewood Garden 142 129,375<br />
Lord Byron I II & III Highrise 158 133,994<br />
Lord Byron Townhomes Townhouse 145 170,969<br />
Lorelei House Garden 78 65,870<br />
Maple Gardens Garden 181 163,840<br />
Marlborough Manor Garden 56 49,582<br />
Maureen Manor Highrise 91 64,918<br />
Meadowside Estates Garden 148 104,036<br />
Meadowview Manor Garden 348 284,490<br />
Monterey Pointe Garden 104 83,548<br />
Morningside Garden 220 165,562<br />
Northridge Estates Garden 180 103,270<br />
Oak Tower Highrise 70 51,852<br />
Parkside Towers Highrise 179 162,049<br />
Parkview Estates Townhouse 104 88,432<br />
Pembroke Estates Garden 198 198,360<br />
Pinetree Village Garden 142 106,740<br />
Pointe West Townhouses Townhouse 69 72,810<br />
Primrose Lane Apartment Garden 153 151,310<br />
Prominence Place Highrise 91 73,310<br />
Redwood Court Garden 116 107,680<br />
Riverview Manor Garden 81 62,092<br />
Royal Heights Highrise 74 41,550<br />
Sandstone Pointe Garden 81 83,800<br />
Sir William Place Garden 220 126,940<br />
Solano House Highrise 91 79,325<br />
Southgate Tower Highrise 170 153,385<br />
Summerlea Place Garden 39 43,297<br />
Suncourt Place Garden 62 55,144<br />
Tamarack East and West Townhouse 132 212,486<br />
Terrace Gardens Garden 114 101,980<br />
Terrace Towers Highrise 84 66,000<br />
The Palisades Highrise 94 77,200<br />
The Westmount Highrise 133 124,825<br />
Tower Hill Appartments Highrise 82 46,360<br />
Tower on the Hill Highrise 100 85,008<br />
Valley Ridge Tower Highrise 49 30,546<br />
Victorian Arms Garden 96 91,524<br />
Viking Arms Highrise 240 257,410<br />
Village Acres Garden 186 156,464<br />
Village Plaza Townhouse 68 65,280<br />
Warwick Apartments Garden 60 49,092<br />
West Edmonton Court Garden 82 73,209<br />
Westborough Court Garden 60 50,250<br />
Westbrook Estates Garden 172 148,616<br />
Westmoreland Apartments Garden 56 45,865<br />
Westpark Ridge Garden 102 99,280<br />
Westridge Estates B Garden 91 56,950<br />
Westridge Estates C Garden 90 56,950<br />
Westridge Manor Townhouse 64 69,038<br />
Westwinds of Summerlea Garden 48 53,872<br />
Willow Glen Apartments Garden 88 71,800<br />
Wimbledon Highrise 165 117,216<br />
10,554 9,140,423<br />
Average Unit<br />
Size<br />
Supplemental Information Package 23 <strong>Second</strong> <strong>Quarter</strong> <strong>2004</strong><br />
<strong>Boardwalk</strong> <strong>REIT</strong><br />
844<br />
1,112<br />
813<br />
856<br />
812<br />
979<br />
782<br />
911<br />
848<br />
1,179<br />
844<br />
905<br />
885<br />
713<br />
703<br />
818<br />
803<br />
753<br />
574<br />
741<br />
905<br />
850<br />
1,002<br />
752<br />
1,055<br />
989<br />
806<br />
928<br />
767<br />
561<br />
1,035<br />
577<br />
872<br />
902<br />
1,110<br />
889<br />
1,610<br />
895<br />
786<br />
821<br />
939<br />
565<br />
850<br />
623<br />
953<br />
1,073<br />
841<br />
960<br />
818<br />
893<br />
838<br />
864<br />
819<br />
973<br />
626<br />
633<br />
1,079<br />
1,122<br />
816<br />
710<br />
866
City/Province Property Name Building Type<br />
Fort McMurray, AB<br />
London, ON<br />
Montreal,QC<br />
Quebec City, QC<br />
Red Deer, AB<br />
Regina, SK<br />
Number of<br />
Units<br />
Net Rentable Square<br />
Footage<br />
Birchwood Manor Garden 24 18,120<br />
Chanteclair Garden 79 68,138<br />
Edelweiss Terrace Apts Garden 32 27,226<br />
Heatherton Garden 23 16,750<br />
Hillside Manor Garden 30 21,248<br />
Mallard Arms Garden 36 30,497<br />
McMurray Manor Garden 44 30,350<br />
The Granada Garden 44 35,775<br />
The Valencia Garden 40 33,850<br />
352 281,954<br />
Average Unit<br />
Size<br />
Abbey Estates Townhouse 53 59,794 1,128<br />
Castlegrove Estates Highrise 144 126,420<br />
878<br />
Forest City Estates Highrise 272 221,000<br />
813<br />
Heritage Square Garden/Highrise 359 270,828<br />
754<br />
Landmark Tower Highrise 213 173,400<br />
814<br />
Maple Ridge On The Parc Highrise 257 247,166<br />
962<br />
Meadow Crest Apts Garden 162 110,835<br />
684<br />
Noel Meadows Garden 105 72,600<br />
691<br />
Ridgewood Estates Townhouse 29 31,020 1,070<br />
Sanford Apts Highrise 96 77,594<br />
808<br />
The Bristol Highrise 138 109,059<br />
790<br />
Topping Lane Towers Highrise 189 177,880<br />
941<br />
Villages of Hyde Park Townhouse 60 57,850<br />
964<br />
Westmount Ridge Highrise 179 131,700<br />
736<br />
2,256 1,867,146 828<br />
Cote-Vertu (St. Laurent, QC) Midrise 88 67,750 770<br />
Domaine d’Iberville Apts (Longueuil, QC) Highrise 720 560,880 779<br />
Les Jardins Bourassa Midrise 178 85,874 482<br />
Nuns' Island Portfolio Garden/Highrise/Townhouse 3,100 3,075,140 992<br />
Residence le Quatre Cent (Laval, QC) Highrise 259 153,500 593<br />
4,345 3,943,144 908<br />
Complexe Laudance (Sainte-Foy, QC) Midrise 183 134,480 735<br />
Domaine du Rocher (Levis, QC) Walk-up 64 68,184 1,065<br />
Le Laurier Highrise 105 74,995<br />
714<br />
Les Appartements Du Verdier (Sainte-Foy, QC) Garden 195 152,645<br />
783<br />
Les Jardins de Merici Highrise 346 300,000<br />
867<br />
Place Charlesbourg Midrise 108 82,624 765<br />
Place du Parc Highrise 111 81,746<br />
736<br />
Place Samuel de Champlain Highrise 130 104,153<br />
801<br />
1,242 998,827 804<br />
Canyon Pointe Apartments Garden 163 114,039<br />
Cloverhill Terrace Highrise 120 102,225<br />
Inglewood Terrace Garden 68 42,407<br />
Riverbend Village Apartments Garden 150 114,750<br />
Saratoga Highrise 48 53,762<br />
Taylor Heights Apartments Garden 140 103,512<br />
Watson Highrise 50 43,988<br />
Westridge Estates Townhouse 112 113,664<br />
851 688,347<br />
Ashok Portfolio Garden 164 95,000<br />
<strong>Boardwalk</strong> Estates Garden 687 467,696<br />
<strong>Boardwalk</strong> Manor Garden 72 60,360<br />
Centennial South Townhouse 170 129,080<br />
Centennial West Garden 60 46,032<br />
Eastside Estates Townhouse 150 167,550<br />
Evergreen Estates Garden 150 125,660<br />
Supplemental Information Package 24 <strong>Second</strong> <strong>Quarter</strong> <strong>2004</strong><br />
<strong>Boardwalk</strong> <strong>REIT</strong><br />
755<br />
863<br />
851<br />
728<br />
708<br />
847<br />
690<br />
813<br />
846<br />
801<br />
700<br />
852<br />
624<br />
765<br />
1,120<br />
739<br />
880<br />
1,015<br />
809<br />
579<br />
681<br />
838<br />
759<br />
767<br />
1,117<br />
838
City/Province Property Name Building Type<br />
Saskatoon, SK<br />
Windsor, ON<br />
Other<br />
Number of<br />
Units<br />
Net Rentable Square<br />
Footage<br />
Grace Manor Townhouse 72 69,120<br />
Greenbriar Apts Garden 72 57,600<br />
Lockwood Arms Garden 96 69,000<br />
Pines of Normanview Townhouse 133 115,973<br />
Qu'appelle Village I & II Garden 154 133,200<br />
Qu'appelle Village III Garden 180 144,160<br />
Southpointe Plaza Highrise 140 117,560<br />
The Meadows Townhouse 52 57,824<br />
Wascanna Park Estates Townhouse 320 307,200<br />
2,672 2,163,015<br />
Carleton Towers Highrise 158 155,138<br />
Chancellor Gate Garden 138 126,396<br />
Dorchester Towers Highrise 52 48,608<br />
Heritage Pointe Estates Townhouse 104 99,840<br />
Lawson Village Garden 96 75,441<br />
Meadow Parc Estates Townhouse 200 192,000<br />
Palace Gate Garden 206 142,525<br />
Penthouse Apartments Highrise 82 61,550<br />
Regal Tower 1 & 2 Highrise 161 122,384<br />
Reid Park Estates Garden 179 128,700<br />
St. Charles Place Garden 156 123,000<br />
St. James Place Garden 140 105,750<br />
Stonebridge Apartments Garden 162 131,864<br />
Stonebridge Townhomes I & II Townhouse 100 135,486<br />
Wildwood Ways B Garden 54 43,961<br />
1,988 1,692,643<br />
Anchorage Apartments Highrise 135 110,245<br />
Anchorage on the Park Townhouse 31 38,750<br />
Askin Tower Highrise 60 39,675<br />
Buckingham Towers Highrise 34 30,805<br />
Caron Towers Highrise 47 36,947<br />
Empress Garden 40 28,250<br />
Frances Tower Apartments Highrise 53 43,906<br />
Glenwood Apartments Highrise 33 25,619<br />
Janisse Tower Highrise 75 45,000<br />
Karita Tower Highrise 41 28,950<br />
Lauzon Towers Highrise 178 137,784<br />
Marine Court Highrise 68 49,206<br />
Randal Court Garden 47 38,775<br />
Regency Colonade Highrise 133 113,205<br />
Riverdale Manor Townhouse 97 77,850<br />
Rivershore Tower Apts Highrise 96 63,300<br />
Sandilands Tower Highrise 47 38,775<br />
Sanwich Tower Highrise 66 40,650<br />
Seaway Tower Highrise 152 112,037<br />
Sun Crest Tower Highrise 58 43,100<br />
Sun Ray Manor Highrise 41 29,950<br />
University Towers Highrise 50 36,100<br />
1,582 1,208,879<br />
Average Unit<br />
Size<br />
<strong>Boardwalk</strong> Park Estates 2 (Grande Prairie, AB) Townhouse 32 30,210<br />
944<br />
Elk Valley Estates (Banff, AB) Garden 76 53,340<br />
702<br />
Kings Tower (Kitchener, ON) Highrise 226 171,100<br />
757<br />
Parc de la Montagne (Gatineau, QC) Highrise 321 204,055<br />
636<br />
Parkview Portfolio (Grande Prairie, AB) Garden 369 306,850<br />
832<br />
Tower Lane I & II (Airdrie, AB) Garden 163 130,920<br />
803<br />
Westheights Place (Kitchener, ON) Highrise 103 91,920<br />
892<br />
1,290 988,395 766<br />
Supplemental Information Package 25 <strong>Second</strong> <strong>Quarter</strong> <strong>2004</strong><br />
<strong>Boardwalk</strong> <strong>REIT</strong><br />
960<br />
800<br />
719<br />
872<br />
865<br />
801<br />
840<br />
1,112<br />
960<br />
810<br />
982<br />
916<br />
935<br />
960<br />
786<br />
960<br />
692<br />
751<br />
760<br />
719<br />
788<br />
755<br />
814<br />
1,355<br />
814<br />
851<br />
817<br />
1,250<br />
661<br />
906<br />
786<br />
706<br />
828<br />
776<br />
600<br />
706<br />
774<br />
724<br />
825<br />
851<br />
803<br />
659<br />
825<br />
616<br />
737<br />
743<br />
730<br />
722<br />
764<br />
Total 31,780 26,747,458 842
Corporate Information<br />
Executive Offices:<br />
Calgary<br />
First West Professional Building<br />
Suite 200, 1501 – 1 Street SW<br />
Calgary, Alberta, Canada T2R 0W1<br />
Telephone: (403) 531-9255<br />
Facsimile: (403) 531-9565<br />
www.<strong>Boardwalk</strong><strong>REIT</strong>.com<br />
Corporate Directory:<br />
Sam Kolias, President and CEO Roberto Geremia, Senior Vice President<br />
Telephone: (403) 531-9255 Finance & Chief Financial Officer<br />
Facsimile: (403) 531-9565 Telephone: (403) 531-9255<br />
E-mail: sam@bwalk.com Facsimile: (403) 531-9565<br />
E-mail: rob@bwalk.com<br />
Paul Moon, Director of Corporate<br />
Communications<br />
Telephone: (403) 206-6808<br />
Facsimile: (403) 261-9269<br />
E-mail: pmoon@bwalk.com<br />
Registrar and Transfer Agent:<br />
Computershare Trust Company of Canada<br />
600, 530 – 8 Avenue SW<br />
Calgary, Alberta, Canada T2P 3S8<br />
Telephone: (403) 267-6800<br />
Share Listing:<br />
Auditors:<br />
Toronto Stock Exchange Symbol: BEI.UN<br />
Deloitte & Touche LLP<br />
3000, 700 – 2 Street SW<br />
Calgary, Alberta, Canada T2P 0S7<br />
Supplemental Information Package 26 <strong>Second</strong> <strong>Quarter</strong> <strong>2004</strong><br />
<strong>Boardwalk</strong> <strong>REIT</strong>