2012 annual - Boardwalk REIT
2012 annual - Boardwalk REIT
2012 annual - Boardwalk REIT

You also want an ePaper? Increase the reach of your titles
YUMPU automatically turns print PDFs into web optimized ePapers that Google loves.
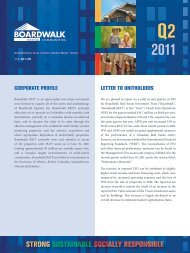
TSX: BEI.UN Annual Report <strong>2012</strong><br />
Delivering Value<br />
<strong>Boardwalk</strong> Real Estate Investment tRUst
<strong>Boardwalk</strong> reit<br />
Letter to Unitholders (page 2)<br />
Delivering Value<br />
Delivering<br />
Value<br />
Customers (page 18)<br />
<strong>Boardwalk</strong> is committed to<br />
delivering the best value possible<br />
to our Customers.<br />
<strong>2012</strong> Annual Report<br />
Our Dedicated Associates (page 22)<br />
<strong>Boardwalk</strong> firmly believes that our<br />
success can be attributed to our team of<br />
hard-working and talented Associates.<br />
Community (page 26)<br />
<strong>2012</strong> was <strong>Boardwalk</strong>’s Year of Community.<br />
1 Highlights<br />
5 Letter to Unitholders<br />
10 Table of Qualitative and Quantitative<br />
Goals and Targets<br />
18 Customers<br />
20 Unitholders<br />
22 Associates<br />
25 Health and Safety<br />
26 Community<br />
28 Environment and Sustainability<br />
30 Portfolio Summary<br />
34 Good Corporate Governance<br />
35 Financial Review<br />
36 Management’s Discussion and Analysis<br />
92 Management’s Report<br />
93 Independent Auditors’ Report<br />
94 Financial Statements<br />
98 Notes to Financial Statements<br />
140 Five Year Summary<br />
142 Quarterly Results<br />
144 Market and Unitholder Information<br />
145 Corporate Information<br />
photo: Homes of Hope, Tijuana, Mexico<br />
<strong>Boardwalk</strong> <strong>REIT</strong> / AR <strong>2012</strong>
<strong>2012</strong> Highlights<br />
Funds From Operations<br />
Per Unit (Cdn$)<br />
2.87<br />
2.51 2.47 2.52<br />
2.39<br />
2.07<br />
1.43 1.41<br />
1.64<br />
04 05 06 07 08 09 10 11 12<br />
Rental Revenue (Cdn$ millions)<br />
420 417 420 423 440<br />
375<br />
279 297 319<br />
04 05 06 07 08 09 10 11 12<br />
Total Return Index<br />
(Jan.1, <strong>2012</strong> to Dec. 31, <strong>2012</strong>)<br />
9.4%<br />
28.3%<br />
Operating Results<br />
▲<br />
▲<br />
▲<br />
Rental revenues increased by 4.1% to $439.9 million.<br />
Net Operating Income (“NOI”) increased by 5.1% to $276.1 million.<br />
Funds From Operations (“FFO”) from continuing operations increased<br />
by 14.1% to $150.3 million.<br />
Performance<br />
▲<br />
▲<br />
▲<br />
<strong>Boardwalk</strong> Trust Units provided 28.3% total return to investors during<br />
fiscal <strong>2012</strong>.<br />
The Trust increased its distribution twice during fiscal <strong>2012</strong> to a total<br />
of $1.96 per outstanding Trust Unit on an <strong>annual</strong>ized basis.<br />
The Trust demonstrated one of the lowest distribution payout ratios<br />
among Canadian <strong>REIT</strong>s during fiscal <strong>2012</strong> at approximately 65% of<br />
FFO.<br />
Financing<br />
▲ The Trust renewed $454.9 million, and up financed $35.2 million<br />
in CMHC Insured Mortgages in fiscal <strong>2012</strong> and reduced its average<br />
interest rate on these mortgages from 4.64% to 2.91%.<br />
▲ The Portfolio Weighted Average interest rate has been reduced to<br />
3.69%.<br />
▲<br />
▲<br />
99% of the Trust’s mortgages are NHA-Insured.<br />
At December 31, <strong>2012</strong>, the Trust had $138.7 million in cash liquidity on<br />
its balance sheet in addition to a $196 million undrawn credit facility.<br />
2.8%<br />
S&P/TSX<br />
Composite<br />
S&P/TSX<br />
Capped<br />
Real Estate<br />
BEI.UN<br />
<strong>Boardwalk</strong> <strong>REIT</strong> / AR <strong>2012</strong> Highlights / 1
Fort McMurray<br />
352 units<br />
1.0% of portfolio<br />
St. Albert<br />
280 units<br />
0.8% of portfolio<br />
Grand Prairie<br />
645 units<br />
1.8% of portfolio<br />
Spruce Grove<br />
160 units<br />
0.5% of portfolio<br />
•<br />
Edmonton<br />
12,057 units<br />
34.2% of portfolio<br />
•<br />
Red Deer<br />
939 units<br />
2.7% of portfolio<br />
Banff<br />
76 units<br />
0.2% of portfolio<br />
•• •<br />
•<br />
•<br />
• • Saskatoon<br />
1,988 units<br />
5.6% of portfolio<br />
•<br />
•<br />
Airdrie<br />
163 units<br />
0.5% of portfolio<br />
•<br />
Victoria<br />
161 units<br />
0.5% of portfolio<br />
Vancouver<br />
472 units<br />
1.3% of portfolio<br />
Calgary<br />
5,071 units<br />
14.4% of portfolio<br />
Regina<br />
2,648 units<br />
7.5% of portfolio<br />
Our Mission:<br />
“To serve and provide our Residents with quality rental communities.”<br />
Corporate Profile<br />
<strong>Boardwalk</strong> <strong>REIT</strong> is Canada’s friendliest landlord and currently owns and operates more than 225 properties with 35,277 residential units<br />
(as at December 31, <strong>2012</strong>) totaling approximately 30 million net rentable square feet. <strong>Boardwalk</strong>’s principal objectives are to provide<br />
its Residents with the best quality communities and superior Customer Service, while providing Unitholders with sustainable monthly<br />
cash distributions, and increase the value of its Trust Units through selective acquisition, disposition, and effective management of<br />
its residential multi-family properties. <strong>Boardwalk</strong> <strong>REIT</strong> is vertically integrated and is Canada’s leading owner/operator of Multi-Family<br />
Communities with 1,600 Associates bringing Customers home to properties located in Alberta, Saskatchewan, Ontario, Quebec, and<br />
British Columbia.<br />
2 / highlIGHTS<br />
<strong>Boardwalk</strong> <strong>REIT</strong> / AR <strong>2012</strong>
Quebec City<br />
1,319 units<br />
3.7% of portfolio<br />
•<br />
•<br />
London<br />
2,256 units<br />
6.4% of portfolio<br />
Montreal<br />
4,681 units<br />
13.3% of portfolio<br />
•<br />
•<br />
Windsor<br />
1,680 units<br />
4.7% of portfolio<br />
•<br />
Kitchener<br />
329 units<br />
0.9% of portfolio<br />
<strong>Boardwalk</strong> <strong>REIT</strong> – Total Number of Units<br />
19,480<br />
22,441<br />
24,821 25,889<br />
29,326<br />
31,239 32,159<br />
33,298 34,207<br />
36,487 36,785 36,419<br />
35,277 35,277 35,277<br />
8,787<br />
1997 1998 1999 2000 2001 2002 2003 2004 2005 2006 2007 2008 2009 2010 2011 <strong>2012</strong><br />
<strong>Boardwalk</strong> <strong>REIT</strong> / AR <strong>2012</strong> Highlights / 3
Delivering Value<br />
We are pleased to report on a positive year for <strong>Boardwalk</strong> <strong>REIT</strong> (“<strong>Boardwalk</strong>” or the “Trust”). In <strong>2012</strong>, we<br />
continued to focus on Creating Community for our Residents by providing the best value in rental housing.<br />
The continued commitment by each of our Associates throughout the year helped drive our superior Customer<br />
Service, and as result, has allowed the Trust to report Funds from Operation (“FFO”) performance of $2.87 per<br />
Trust Unit on a diluted basis for <strong>2012</strong>. The success of our Customer Friendly approach is being reflected with<br />
historically sustainable long-term growth and providing additional value for all of our Stakeholders.<br />
4 / Letter to SHAREHolders<br />
<strong>Boardwalk</strong> <strong>REIT</strong> / AR <strong>2012</strong>
Letter to Unitholders<br />
Throughout <strong>2012</strong>, the Trust continued its commitment to providing the best Customer<br />
Experience for its Residents by developing and hosting over 45 innovative events<br />
for our Customers across the Country. In addition, we continue to provide Customer<br />
friendly programs including our Internal Subsidy Program, which will provide rental<br />
increase forgiveness to Customers who can prove financial hardship occasioned by a<br />
rental increase and our Self-Imposed Rent Protection Program, which limits the amount<br />
of a rental increase to a sustainable level for any given year for existing Residents.<br />
Both programs have contributed to further our Customer loyalty. The quality of our<br />
Communities continues to be a top priority and with this, we have increased our <strong>annual</strong><br />
investment to approximately $90 million in <strong>2012</strong> to further enhance our Communities.<br />
We believe this continued focus has set <strong>Boardwalk</strong> apart and, to date, our Residents have<br />
rewarded us with lower turnover and higher occupancy as we continue to build longterm<br />
relationships with our Residents.<br />
<strong>2012</strong> Economic Environment<br />
Demand for rental housing in <strong>2012</strong> was strong in most of the Trust’s markets as the<br />
Canadian Economy continued to outperform its peers. During the year, vacancy rates in<br />
our core markets decreased, which allowed the Trust to continue its Rental Strategy of<br />
maintaining high occupancy, through the continuous monitoring of occupancy levels,<br />
adjusting market rents, and offering suite specific incentives to optimize revenue.<br />
(From left to right):<br />
William Wong, Chief Financial Officer; Van Kolias,<br />
Senior Vice President, Quality Control; Sam Kolias,<br />
Chief Executive Officer and Chairman of the Board;<br />
William Chidley, Senior Vice President, Corporate<br />
Development; Roberto Geremia, President; and<br />
Dean Burns, General Counsel and Secretary.<br />
The Canadian Real Estate market continued to be strong in <strong>2012</strong> as multi-family asset<br />
transactions showed that capitalization rates continued to decrease resulting in significant<br />
increases in prices for investment grade apartments. Debt financing continued to<br />
be healthy in <strong>2012</strong> with no shortage of demand for both Canadian Government and<br />
Corporate backed debt in Canadian Capital Markets and, as a result, we saw many of our<br />
<strong>REIT</strong> peers access equity markets to obtain additional capital. Debt financing continued<br />
to be readily available for CMHC-insured financing for Multi-Family Real Estate as the<br />
Trust was able to capitalize further on the low interest rate environment by renewing our<br />
maturing mortgages at interest rates well below the maturing rates.<br />
The resource driven Prairie Provinces led economic growth in <strong>2012</strong> and, as a result, presented<br />
good rental fundamentals for the Trust. Migration in Alberta and Saskatchewan in<br />
<strong>2012</strong> increased its pace and have exceeded in migration levels seen in 2007. A report from<br />
Canada Mortgage and Housing Corporation (“CMHC”) estimates that as a result of the<br />
positive net migration in Alberta and Saskatchewan, each province is expected to carry<br />
the lowest unemployment rates in Canada, near 4% in <strong>2012</strong>. In addition, wage growth is<br />
expected to increase as the job market tightens. Home ownership and the home resale<br />
market appear to be under balanced conditions despite the tightening of mortgage criteria<br />
in <strong>2012</strong>. There remains a significant spread between the price of Alberta Crude and<br />
market pricing for comparable crude. These factors have contributed to higher wage and<br />
operating expenses inflation in <strong>2012</strong>, which tempered the Trust’s net operating income<br />
growth.<br />
<strong>Boardwalk</strong> <strong>REIT</strong> / AR <strong>2012</strong><br />
Letter to UnitholdERS / 5
Balanced and Sustainable Growth<br />
The Trust did not acquire any apartment units in <strong>2012</strong>; however, <strong>Boardwalk</strong> continued<br />
to deliver solid organic growth throughout the year. With approximately 65% of its over<br />
35,000 apartment units in Alberta and Saskatchewan, the Trust is well-positioned in<br />
historically higher-growth markets, while remaining diversified with properties in British<br />
Columbia, Ontario and Quebec. In <strong>2012</strong>, the Trust increased its monthly cash distribution<br />
on two occasions, to $1.92 per Trust Unit on an <strong>annual</strong>ized basis, or an increase of 6.7%<br />
since the beginning of the year, yet remained with a conservative payout ratio of 65% of<br />
<strong>2012</strong> FFO. The Trust continues to be in a solid position to continue to deliver stable cash<br />
distributions, while providing Unitholders with long-term growth and sustainability.<br />
We continue to benefit from high occupancy as a result of the Trust’s Rental Strategy<br />
of monitoring vacancy, adjusting market rents, and offering suite specific incentives<br />
to optimize revenue. The Trust reported occupancy levels for the <strong>2012</strong> year of 98.19%,<br />
an increase from 97.47% in 2011. The Trust was successful in increasing occupied rents<br />
throughout the year in a progressive fashion; however, we continue to have a considerable<br />
mark-to-market opportunity as market rents have continued to increase as well.<br />
$1,150<br />
Portfolio Highlights<br />
▲ Occupancy for the year<br />
ended <strong>2012</strong> was 98.45%, up<br />
from 97.98% in 2011.<br />
▲ Average Market Rent for the<br />
end of <strong>2012</strong> was $1,105 per<br />
unit per month, up from<br />
$1,053 in 2011.<br />
▲ Average Occupied Rent for<br />
the end of <strong>2012</strong> was $1,081<br />
per unit per month, up from<br />
$1,033 in the same period<br />
last year.<br />
▲ Interest coverage ratio for<br />
fiscal <strong>2012</strong> was 2.76 times<br />
compared to 2.42 for the<br />
same period last year.<br />
$1,100<br />
$1,050<br />
$1,033<br />
$1,053<br />
$1,042<br />
$1,065<br />
$1,055<br />
$1,087<br />
$1,067<br />
$1,100<br />
$1,081<br />
$1,105<br />
$1,000<br />
$950<br />
$900<br />
December<br />
2011<br />
March<br />
<strong>2012</strong><br />
June<br />
<strong>2012</strong><br />
September<br />
<strong>2012</strong><br />
December<br />
<strong>2012</strong><br />
Occupied Rent<br />
Market Rent<br />
The Trust’s average market rent to end <strong>2012</strong> was $1,105 per month, versus the average<br />
occupied rent of $1,081 per month for the same period. The narrowing of this loss to lease<br />
gap continues to be a key revenue growth opportunity for the Trust, however, we believe<br />
the best method of closing this loss to lease opportunity is through the Trust’s Rental<br />
Strategy of maintaining occupancy, adjusting rent, and offering suite specific incentives<br />
to optimize revenue.<br />
The Trust has commenced construction of its first development project on excess land<br />
the Trust owns. The 109-unit, wood-frame building in Calgary, Alberta is expected to cost<br />
approximately $19 million. The Trust has been approved for a rent subsidy grant from<br />
the Province of Alberta in the amount of $7.5 million to assist in the construction of this<br />
building. In partnership, <strong>Boardwalk</strong> has committed to provide 54 of these 109 units as<br />
‘affordable’, with rental rates 10% below market rents for 20 years. We estimate that the<br />
6 / Letter to UnitholdERS <strong>Boardwalk</strong> <strong>REIT</strong> / AR <strong>2012</strong>
Financial and<br />
Operating Highlights<br />
▲ Rental revenues of $439.9<br />
million, an increase of 4.1%<br />
compared to $422.7 million<br />
for the twelve-month period<br />
ended December 31, <strong>2012</strong>.<br />
▲ Net Operating Income of<br />
$276.1 million, representing<br />
a 5.1% increase from $262.7<br />
million in the same period<br />
last year.<br />
▲ FFO from continuing<br />
operations of $150.3<br />
million, an increase of 14.1%<br />
compared to $131.8 million<br />
year-over-year.<br />
▲ FFO per unit from continuing<br />
operations of $2.87 on a<br />
diluted basis, up 13.9%<br />
compared to $2.52 for the<br />
twelve-month period ended<br />
December 31, <strong>2012</strong>.<br />
▲ AFFO from continuing<br />
operations was $134.5<br />
million, an increase of 16.0%<br />
compared to $115.9 million<br />
year-over-year.<br />
▲ AFFO per unit from<br />
continuing operations was<br />
$2.57 on a diluted basis, up<br />
15.8% compared to $2.22 for<br />
the twelve-month period<br />
ended December 31, <strong>2012</strong>.<br />
capitalization rate of this project to be approximately 6.1%, after including an allocation<br />
of $4.25 million for the excess land allocated to this project.<br />
The Trust is continuing to explore the viability of other potential development on excess<br />
land the Trust currently owns. The combination of low capitalization rates, low interest<br />
rates, and relatively low construction costs may provide the Trust an opportunity to enhance<br />
value to our Unitholders by increasing the quality of the Trust’s portfolio from the<br />
development of new multi-family assets.<br />
Financial Strength and Flexibility<br />
In January of <strong>2012</strong>, the Trust retired its $112 million unsecured debenture with liquidity<br />
on hand. At the end of <strong>2012</strong>, the Trust had approximately $335 million in available<br />
liquidity, comprised of $139 million in cash, and access to an undrawn $196 million<br />
credit facility. Ample liquidity and balance sheet strength is an important element in<br />
the execution of the Trust’s overall strategy as it provides maximum flexibility should a<br />
potential opportunity arise.<br />
As interest rates continued to remain low throughout <strong>2012</strong>, the Trust was able to renew<br />
over $454 million in mortgage maturities, as well as obtain an additional $35.2 million<br />
of mortgage funds with an average term of 7.5 years at a weighted average interest<br />
rate of 2.91%, a decrease from the 4.64% maturing rate on these mortgages, and a<br />
significant decrease in the Trust’s interest expense. As of early February of 2013, estimated<br />
CMHC-insured 5- and 10-year mortgage rates were estimated to be 2.30% and 2.90%<br />
respectively. The Trust was able to execute forward locking of interest rates on select<br />
mortgages to crystalize interest savings on a portion of the Trust’s maturities in <strong>2012</strong>. The<br />
Trust’s mortgage program in <strong>2012</strong> had a bias towards longer mortgage terms to provide<br />
long term benefit to the Trust’s interest expense.<br />
<strong>Boardwalk</strong>’s Debt (net of cash) to Fair Value at the end of <strong>2012</strong> was a conservative 40%.<br />
The Trust’s Fair Value as of December 31, <strong>2012</strong> was $5.5 billion, an increase from $4.8 billion<br />
a year ago, as a result both capitalization rate compression and growth in the Trust’s<br />
Net Operating Income. Our interest coverage ratio, measured as Earnings Before Interest,<br />
Taxes, Depreciation, and Amortization (“EBITDA”) to interest expense (excluding gains) for<br />
the current year, increased to 2.76 times versus 2.42 times for the same period last year.<br />
The Trust achieved an increase of 5.0% in Stabilized Building Net Operating Income<br />
in <strong>2012</strong>, which was within our revised guidance range. The Trust’s rental strategy of<br />
maintaining high occupancy coupled with the increase in occupied and market rents<br />
provided positive revenue growth in <strong>2012</strong>. These revenue gains were tempered, however,<br />
by an increase in operating expenses mainly attributable to higher wages and salaries as<br />
well as inflationary pressures of other expense items throughout the year.<br />
<strong>Boardwalk</strong> Stabilized NOI Growth for <strong>2012</strong><br />
Original Guidance 1% - 4%<br />
Revised Guidance 3 % - 5%<br />
Actual Results, <strong>2012</strong> 5.0%<br />
<strong>Boardwalk</strong> <strong>REIT</strong> / AR <strong>2012</strong><br />
Letter to UnitholdERS / 7
In Summary<br />
Our focus on our Communities in <strong>2012</strong> by each of our 1,600 Associates resulted in a<br />
positive year for the Trust. We continue to strive towards long-term relationships with<br />
our Residents by providing the best in product quality and service, while building a<br />
foundation for continued long term sustainable growth for our stakeholders.<br />
For fiscal <strong>2012</strong>, our reported FFO increased by approximately 14% versus the same period<br />
last year at $2.87, and finished at the high end of our revised guidance range of $2.80 -<br />
$2.90 per Trust Unit. The positive FFO growth can be attributed to the positive NOI growth<br />
the Trust was able to achieve, combined with continued reduction in interest expense.<br />
Funds from Operations – <strong>2012</strong><br />
Original Guidance $2.65 to $2.85<br />
Revised Guidance $2.80 to $2.90<br />
Actual Results, <strong>2012</strong> $2.87<br />
2013 Outlook<br />
Unit Breakdown by Province<br />
<strong>2012</strong> was a positive year for the Trust.<br />
As<br />
We<br />
at Dec<br />
continue<br />
31, <strong>2012</strong><br />
to build long term relationships with<br />
our Residents while further enhancing our product and service. We believe we are wellpositioned<br />
to continue to close the mark-to-market gap on rents BC 1.8% with sustainable rent<br />
increases in most of our markets, while maintaining the high occupancy levels with which<br />
AB 56.0%<br />
we have been rewarded. This organic growth opportunity combined with management<br />
of inflationary expenses will continue to drive NOI results in 2013. SK 13.1%<br />
ON 12.1%<br />
A continued low interest rate environment will additionally add to FFO growth as<br />
approximately $288 million of mortgages will mature in 2013 QC with 17.0% an average interest<br />
rate of 4.45%, representing a significant interest savings opportunity. Although consensus<br />
estimates forecast that interest rates will remain low through 2013, the Trust is constantly<br />
monitoring the credit market and, if it feels it is warranted, the Trust may forward commit<br />
to interest rate locks to crystallize interest rate savings; however, a balanced approach to<br />
the Trust’s mortgage program will be undertaken.<br />
With this in mind, we are optimistic for 2013. As is customary, at the end of the third<br />
quarter of <strong>2012</strong>, the Trust provided a financial outlook for the upcoming year to increase<br />
transparency in our financial reporting by sharing our own perspectives on the Trust’s<br />
current position and objectives. This guidance is updated on a quarterly basis and is first<br />
reported during our quarterly conference calls and press releases.<br />
Description<br />
2013 Guidance<br />
No new apartment acquisitions<br />
Acquisitions<br />
or dispositions<br />
Stabilized Building noI Growth 1% to 4%<br />
FFO Per Trust Unit $2.95 to $3.15<br />
AFFO per Trust Unit – based on $475/yr/apt $2.63 to $2.83<br />
Unit Breakdown by Province<br />
As at Dec 31, <strong>2012</strong><br />
NOI Breakdown by Province<br />
As at Dec 31, <strong>2012</strong><br />
BC 1.8%<br />
AB 56.0%<br />
SK 13.1%<br />
ON 12.1%<br />
QC 17.0%<br />
BC 1.9%<br />
AB 61.4%<br />
SK 14.3%<br />
ON 7.5%<br />
QC 14.9%<br />
8 / Letter to UnitholdERS <strong>Boardwalk</strong> <strong>REIT</strong> / AR <strong>2012</strong>
Rental Revenue Cycle<br />
Move-outs > Move-ins<br />
In 2013, we expect to remain well capitalized, and foresee a solid year with FFO in the<br />
range of $2.95 to $3.15 and Stabilized Building NOI growth of 1% to 4%. At this time,<br />
we are not anticipating any new apartment acquisitions in 2013, as we continue to<br />
believe our largest opportunity remains in organic growth and investment in our existing<br />
communities.<br />
Rents Increase<br />
Incentives<br />
Decrease<br />
Vacancy Rises<br />
Incentives<br />
Increase<br />
In February of 2013, <strong>Boardwalk</strong>’s Board of Trustees approved an increase to <strong>Boardwalk</strong>’s<br />
distributions to $1.98 per Trust Unit on an <strong>annual</strong>ized basis, an increase of 3.1% from the<br />
previous distribution of $1.92 per Trust Unit on an <strong>annual</strong>ized basis, effective with the<br />
commencement of the February 28, <strong>2012</strong> record date. The Board of Trustees will continue<br />
to review the distributions made on the Trust’s Units on a quarterly basis.<br />
Vacancy Drops<br />
Move-ins > Move-outs<br />
Rents Decrease<br />
A Special Thank You<br />
We would like to take this opportunity to thank our 1,600 Associates across Canada for<br />
their dedication and commitment to our vision and values in providing our Residents<br />
with the best quality communities.<br />
We would also like to thank our Board of Trustees for their invaluable guidance and<br />
continued focus on governance.<br />
Thank you to our stakeholders as well as financial and operating partners for their<br />
continued support. We would especially like to thank CMHC, our largest financial partner,<br />
as they continue to provide mortgage insurance products, which maintain low interest<br />
rates and mitigates renewal risks, and allows <strong>Boardwalk</strong> to provide the best value in rental<br />
housing for Canadians.<br />
As always, thank you to our Residents for continuing to call <strong>Boardwalk</strong> home and<br />
entrusting us with your loyalty as we strive to provide the best communities, while also<br />
delivering value.<br />
Respectfully,<br />
Sam Kolias<br />
Chairman and CEO<br />
<strong>Boardwalk</strong> <strong>REIT</strong> / AR <strong>2012</strong><br />
Letter to UnitholdERS / 9
Table of Qualitative and Quantitative Goals and Targets<br />
<strong>Boardwalk</strong> adapts and creates strategies and implements policies that help to achieve our mission, “To serve<br />
and provide our Residents with quality communities.” By doing this, <strong>Boardwalk</strong> believes that the benefits will<br />
be felt by our Customers, our Associates, our Organization, our Communities and our Unitholders. We believe<br />
that these benefits include:<br />
▲<br />
▲<br />
▲<br />
▲<br />
Continued appreciation of our property values, as well as the ability to obtain cash flow that is both<br />
sustainable and long-term. The results of this will enhance value for our Unitholders;<br />
An opportunity to create and establish a work environment for our Associates across Canada that is<br />
dependable, rewarding, safe and healthy;<br />
The opportunity and ability to be a positive influence in our immediate and global communities; and<br />
To remain Canada’s leading residential landlord by diversifying geographically. We will do this through<br />
strategic and accretive acquisitions, as well as internally with the implementation of creative and innovative<br />
work practices.<br />
Our goals and targets are outlined in the table below, <strong>Boardwalk</strong> aims to exceed these goals and targets. Outside market forces often<br />
have an effect on our expenses and returns, and as a result, we must recognize that exceeding our targets is not always achievable in each<br />
area. However, as an organization, we continue to strive to overcome these obstacles and improve where and when we can. We would<br />
like to note that our goals and targets, as explained below, are all intricately intertwined with one another. One stakeholder may place<br />
importance on one target, whiles others may place priority on another.<br />
<strong>Boardwalk</strong> firmly believes in holding ourselves accountable and as such, we hope that our goals, targets and performance will encourage<br />
and inspire discussion between all of our stakeholders. <strong>Boardwalk</strong> actively pursues all of our goals and targets as we believe that by<br />
doing so, we are creating positive results for all of our stakeholders, as well as creating strong and lasting community and value for our<br />
Customers and Associates.<br />
Key:<br />
✓<br />
✓<br />
✓<br />
✗<br />
= Achieved, and Aim to Improve Still Further<br />
= Achieved<br />
= Partly Achieved<br />
= Did Not Achieve<br />
10 / Goals and TARGETS <strong>Boardwalk</strong> <strong>REIT</strong> / AR <strong>2012</strong>
Customers: To work proactively to ensure <strong>Boardwalk</strong> remains Canada’s multi-family residential landlord of choice.<br />
<strong>2012</strong> Targets <strong>2012</strong> Results 2013 Targets<br />
Continually improve the<br />
Customer Service we<br />
provide.<br />
✓ ✓<br />
<strong>Boardwalk</strong> prides itself on providing outstanding Customer Service,<br />
and to ensure this is met, we have a Customer Call Centre that<br />
provides nationwide service 24 hours a day, seven days a week.<br />
Through our Customer Call Centre, our Customers are able to reach<br />
us either by phone, email or live chat. In <strong>2012</strong>, our Call Centre received<br />
149,400 phone calls, 66,250 emails and 25,772 live chats, an increase in<br />
each from 2011.<br />
<strong>Boardwalk</strong> also offers Customers 24 hour on-call maintenance at<br />
each building across Canada. This is also accompanied by a 72-hour<br />
maintenance guarantee. This states that any standard maintenance<br />
requests will be completed within 3 business days. Should it not be<br />
completed, every additional day that it is not completed the Customer<br />
will receive a free day of rent.<br />
<strong>Boardwalk</strong> tracks the reason that Customers move out throughout<br />
the year in order to find out ways in which we can better serve our<br />
Customers. In <strong>2012</strong> our move-outs totalled 13,183, a decrease from<br />
13,882 in 2011 and 14,903 in 2010. The number of Customers who cited<br />
“rent too expensive” as their reason of moving has continued to<br />
decline from 205 in 2011 to 196 in <strong>2012</strong>.<br />
In <strong>2012</strong> <strong>Boardwalk</strong> continued administering our automated telephone<br />
survey. These surveys are given to Customers who have just moved in,<br />
or recently had maintenance work completed. We analyze the results<br />
to see how was can improve in the service we provide. In <strong>2012</strong> we sent<br />
out 12,380 Customer feedback surveys and received a 75% response<br />
rate, of which 87% were positive results.<br />
<strong>2012</strong> saw the launch of the new <strong>Boardwalk</strong> Customer Website. This is<br />
a secure website where Customers can log in to review their account,<br />
add maintenance requests and communicate with Customer Service.<br />
The website provides Customers with a variety of useful tools and<br />
features. Throughout 2013 we will be looking for ways to increase the<br />
usability and functionality for Customers.<br />
Continually improve the<br />
Customer Service we<br />
provide.<br />
<strong>Boardwalk</strong> <strong>REIT</strong> / AR <strong>2012</strong><br />
Goals and TARGETS / 11
Customers: (continued)<br />
<strong>2012</strong> Targets <strong>2012</strong> Results 2013 Targets<br />
Develop innovative ways<br />
to further improve our long<br />
term relationships with our<br />
Customers.<br />
Respond to the changing<br />
priorities of our Customers.<br />
✓ ✓<br />
In <strong>2012</strong> <strong>Boardwalk</strong> continued its Internal Subsidy program to offer<br />
assistance to Customers in need. We believe that providing programs<br />
like this helps to establish strong relationships with our Customers.<br />
We also continued to maintain our Internal Rent Control that limits the<br />
amount we will raise rents in a given year. In 2013, we have made some<br />
improvements to this program to ensure that we continue to protect<br />
the rents of our Customers and ensure that our Residents are only<br />
receiving reasonable and sustainable rental increases in any given<br />
year.<br />
In <strong>2012</strong> <strong>Boardwalk</strong> continued to place an emphasis on strengthening<br />
our communities. Throughout the year we hosted over 45 Customer<br />
Appreciate Events across Canada. We will continue this effort<br />
through 2013 to establish strong and lasting relationships with our<br />
Customers. At these events we handed out Customer Feedback cards.<br />
This feedback focused around community events, what Customers<br />
would like to see and how we can continue to build and create our<br />
communities. We analyze the feedback and have started to implement<br />
the suggestions we have received.<br />
This year also saw <strong>Boardwalk</strong> hosting its first ever Monopoly<br />
Tournament in Calgary, AB. A two month competition between<br />
Customers ended with 3 winners advancing to the final round and<br />
playing against CEO Sam Kolias. The first place winner received six<br />
months free rent, second place one month free rent and third place<br />
an iPad.<br />
In <strong>2012</strong> we also continued to invite Customers to attend our Tijuana<br />
Homes of Hope excursions. Over the two trips <strong>Boardwalk</strong> participated<br />
in, we were pleased to bring 18 Customers with us.<br />
In <strong>2012</strong> <strong>Boardwalk</strong> also began developing an internal Customer<br />
Magazine. Thus far, we have conducted research and focus groups<br />
with Customers with regards to the magazine to discover what they<br />
want and need from it. In 2013 we plan to launch this to our Residents<br />
across Canada.<br />
✓ ✓<br />
Throughout <strong>2012</strong> we continued to update our website<br />
www.bwalk.com with new pages that house information about<br />
<strong>Boardwalk</strong>. As compared to 2011, our <strong>2012</strong> visits to www.bwalk.com<br />
have increased by nearly 30%. As always, we continue to look for ways<br />
to improve the functionality of our website to ensure that current and<br />
potential Customers are able to find all of the information needed.<br />
In <strong>2012</strong> we completed our redesign of our secure Customer Website<br />
and launched it to the public. The new site has features designed to<br />
make our Customers lives easier. On the site they are able to enter<br />
and track maintenance requests, submit comments, view upcoming<br />
events and much more. The site allows <strong>Boardwalk</strong> the opportunity to<br />
better and more easily communicate with Residents across Canada.<br />
Throughout 2013 we have plans to add more functionality and<br />
usability to the site to continue to create an online environment for<br />
our Customers.<br />
Develop innovative ways<br />
to further improve our long<br />
term relationships with our<br />
Customers.<br />
Respond to the changing<br />
priorities of our Customers.<br />
12 / Goals and TARGETS <strong>Boardwalk</strong> <strong>REIT</strong> / AR <strong>2012</strong>
Associates: Invest in our people to provide them with supportive, engaging, long-term employment.<br />
<strong>2012</strong> Targets <strong>2012</strong> Results 2013 Targets<br />
Strive to cultivate a<br />
corporate culture of<br />
on-going, open, two-way<br />
dialogue between all levels<br />
of staff.<br />
Continue to implement<br />
our new communications<br />
strategic plan.<br />
Encourage a positive<br />
workplace that effectively<br />
engages Associates.<br />
Encourage work-life balance.<br />
Constantly adjust internal<br />
policy and focuses to the<br />
changing priorities of our<br />
Associates, innovatively<br />
maintaining a balance<br />
between our Associates,<br />
Customers, Unitholders and<br />
Communities.<br />
Foster safe and respectful<br />
work practices and<br />
environments, and further<br />
develop the training,<br />
orientation and support<br />
offered to new Associates.<br />
✓ ✓<br />
In <strong>2012</strong> we continued to add to and update our intranet. The site aims<br />
to provide continuous information to our Associates about events<br />
around Canada as well as important Human Resources and Health and<br />
Safety information.<br />
We continued to distribute our quarterly Associate newsletter in <strong>2012</strong>.<br />
The newsletter has continued to be a success among Associates.<br />
<strong>Boardwalk</strong> finds that the internal newsletter is an excellent way to<br />
unite Associates across Canada. This newsletter will continue through<br />
2013 as we look to further expand the content and ensure that it<br />
remains an important tool for Associates to learn information about<br />
<strong>Boardwalk</strong>.<br />
Once again, we held our <strong>annual</strong> Luncheons for Associates and<br />
Executives in <strong>2012</strong>. We continued to shift the focus towards<br />
celebrating Associates achievements in Customer Service. We take<br />
the opportunity of having Associates gathered together to conduct<br />
a survey to get their thoughts and opinions not just on how we<br />
can improve the events, but in general. We were pleased to collect<br />
valuable feedback and are making plans to implement this in the near<br />
future.<br />
✓ ✓<br />
In <strong>2012</strong> <strong>Boardwalk</strong> continued a Site Staff and Corporate Compensation<br />
Plan that include a Profit Share program as well as our High Potential<br />
Program that we introduced in 2011. <strong>Boardwalk</strong> wants to ensure that<br />
Associates are being offered competitive salaries and benefits.<br />
<strong>Boardwalk</strong> has an internal committee that is dedicated to raising<br />
funds to provide gifts of hope to Associates and their families in<br />
times of need. There is a committee in each Region across Canada<br />
and <strong>Boardwalk</strong> matches 100% of the fundraising efforts for these<br />
committees.<br />
At the beginning of <strong>2012</strong> we introduced new benefits to our Associates<br />
including: Critical Illness Update, additional charities for our Charitable<br />
Donations program and Online Training. In 2013 we once again<br />
updated our benefits to include an additional grace day for each<br />
Associate as well as an update to our fitness reimbursement so that it<br />
coincides with the year, as well as an increase in the amount covered.<br />
✓ ✓<br />
In <strong>2012</strong> <strong>Boardwalk</strong> invested $136,172 in Associate training and<br />
development. These funds cover items such as books, tuition and<br />
membership fees so that we can continue to provide opportunities for<br />
our Associates to grow and learn.<br />
<strong>Boardwalk</strong> invested over $2,000,000 in comprehensive group benefits<br />
for Associates in <strong>2012</strong>, an increase from 2011. <strong>Boardwalk</strong> also offers<br />
a Group RRSP Employer Match program, and in <strong>2012</strong> invested over<br />
$1,961,500 in this program.<br />
Throughout <strong>2012</strong> we continued our efforts to create building<br />
information manuals for each of our properties. These manuals<br />
contain important emergency procedures and protocols, mechanical<br />
equipment shutdown procedures, and detailed site specific<br />
information for site Associates to reference during daily operational<br />
duties. We have completed 30% of these manuals across Canada and<br />
100% for Southern Alberta. The development and research to optimize<br />
the building manuals, combining them with reserve fund studies to<br />
form <strong>Boardwalk</strong> Building Systems Management, is in its preliminary<br />
stages and will be focused upon over the next few years.<br />
Strive to cultivate a<br />
corporate culture of<br />
on-going, open, two-way<br />
dialogue between all levels<br />
of staff.<br />
Continue to implement our<br />
internal communications<br />
plan.<br />
Encourage a positive<br />
workplace that effectively<br />
engages Associates.<br />
Encourage work-life balance.<br />
Constantly adjust internal<br />
policy and focuses to the<br />
changing priorities of our<br />
Associates, innovatively<br />
maintaining a balance<br />
between our Associates,<br />
Customers, Unitholders and<br />
Communities.<br />
Foster safe and respectful<br />
work practices and<br />
environments, and further<br />
develop the training,<br />
orientation and support<br />
offered to new Associates.<br />
<strong>Boardwalk</strong> <strong>REIT</strong> / AR <strong>2012</strong><br />
Goals and TARGETS / 13
Associates: (continued)<br />
<strong>2012</strong> Targets <strong>2012</strong> Results 2013 Targets<br />
Educate and enforce<br />
our Health and Safety<br />
Procedures to all Associates<br />
Strive to constantly enhance<br />
our ability to attract,<br />
support, encourage and<br />
recognize high-performing<br />
and innovative team<br />
members.<br />
Decrease turn-over to<br />
15-25%, retain long term<br />
Associates, and further<br />
develop succession planning<br />
policy and procedures<br />
✓ ✓<br />
As a continuation from 2011, our Zero Injury Campaign focused on our<br />
goal of eliminating all workplace injuries and illnesses, with a specific<br />
focus on those that are classified as lost-time or disabling injuries.<br />
All Associates had a Health and Safety objective added to their<br />
performance reviews in order to reemphasize the importance of being<br />
safe in the workplace. Sites that remain injury free for a period of one<br />
year will be recognized at our <strong>annual</strong> lunches with our Executive team,<br />
on our internal website and in our internal newsletter. In <strong>2012</strong>, we were<br />
pleased to have 195 sites remain injury free.<br />
In <strong>2012</strong> <strong>Boardwalk</strong> conducted an Internal Health and Safety Audit<br />
for Alberta. <strong>Boardwalk</strong> achieved an overall mark of 99%. After this<br />
extensive audit we were able to find areas and collect ideas on how<br />
we can continually improve in providing our Associates with a safe<br />
place to work. With our continued commitment to Health and Safety,<br />
we have seen a significant decrease in all of our Claims Costs through<br />
WCB Alberta.<br />
✓ ✓<br />
In <strong>2012</strong> <strong>Boardwalk</strong> was pleased to present nine Associates with<br />
Foundation of Excellence Awards. The recipients of these awards are<br />
nominated by their peers. Foundations of Excellence Awards are given<br />
to those individuals who strive to live <strong>Boardwalk</strong>’s Mission, Vision and<br />
Values every day.<br />
<strong>Boardwalk</strong> awarded 24 Chairman Scholarships in <strong>2012</strong> to the children<br />
of Associates across Canada, four more scholarships than were<br />
awarded in 2011. These scholarships amounted to over $100,000.<br />
<strong>Boardwalk</strong> continued the Bravo program in <strong>2012</strong>. This program<br />
recognizes Associates who go above and beyond in Customer Service.<br />
In <strong>2012</strong> we awarded over 350 Bravos to Associates as the result of<br />
receiving a compliment from a <strong>Boardwalk</strong> Customer.<br />
In <strong>2012</strong> <strong>Boardwalk</strong> continued their Associate Referral Bonus. Associates<br />
who refer friends and family to work at <strong>Boardwalk</strong> are eligible to<br />
receive a monetary bonus. This program will stay in place throughout<br />
2013.<br />
<strong>Boardwalk</strong> continues to conduct research and review compensation to<br />
ensure that our Associates are receiving wages and benefits that align<br />
with market trends and standards.<br />
✓ ✓<br />
<strong>Boardwalk</strong> wants to ensure that all Associates are well trained and feel<br />
comfortable with their day to day roles. As such, we have a Mentorship<br />
Program which we expanded in 2010 and continue to improve<br />
upon. Our Mentor Guides are updated quarterly with any policy or<br />
procedure changes. In <strong>2012</strong> we posted Mentor Guides online as well as<br />
had Mentors start to use online review and testing processes with new<br />
Associates.<br />
To plan for the future, as well as provide Associates the opportunity<br />
to excel we continued our succession planning in <strong>2012</strong>. This program<br />
requires all Leaders to select a successor for their role as well as to set<br />
a time frame in which their successor will be ready to take on this role.<br />
<strong>Boardwalk</strong> currently has over 1,600 Associates. Of these Associates,<br />
38% have been with <strong>Boardwalk</strong> for over five years, 19% of them have<br />
been with <strong>Boardwalk</strong> for over 10 years. In <strong>2012</strong> Associate turnover was<br />
20.86%.<br />
Continue to create a safe<br />
work environment by<br />
educating our Associates<br />
and enforcing our Health<br />
and Safety Procedures.<br />
Strive to constantly enhance<br />
our ability to attract,<br />
support, encourage and<br />
recognize high-performing<br />
and innovative team<br />
members.<br />
Maintain turn-over of 15-25%,<br />
retain long term Associates,<br />
and further develop<br />
succession planning policy<br />
and procedures<br />
14 / Goals and TARGETS <strong>Boardwalk</strong> <strong>REIT</strong> / AR <strong>2012</strong>
Community: To positively impact the communities in which we operate and in the larger global community.<br />
<strong>2012</strong> Targets <strong>2012</strong> Results 2013 Targets<br />
Expand and continue to<br />
focus on our Community<br />
Development Department<br />
in order to further foster<br />
collaboration with<br />
Government and Social<br />
Services.<br />
Continue to assist our<br />
Customers who are in<br />
financial need.<br />
Focus on encouraging<br />
corporate and individual<br />
contribution and<br />
involvement in our<br />
communities.<br />
✓ ✓<br />
<strong>Boardwalk</strong> is proud to commit housing units to a program called<br />
Housing First. This program allows us the opportunity to help<br />
homeless individuals in Alberta find affordable housing. In <strong>2012</strong> we<br />
committed 328 units in Edmonton and 140 units in Calgary.<br />
We have a total rent supplement number of 1,000. This number<br />
represents the number of rent supplements from government<br />
agencies that are paid directly to <strong>Boardwalk</strong>.<br />
<strong>Boardwalk</strong> is always looking for ways to contribute further in the<br />
creation of affordable housing and as a result we also partner<br />
with municipal housing companies that include: Calgary Housing<br />
Company, Capital Region Housing Corporation and the London<br />
Middlesex Housing Corporation. Through these partnerships we are<br />
pleased to provide over 1,000 units of affordable housing.<br />
✓ ✓<br />
In an effort to assist Customers who are in financial need <strong>Boardwalk</strong><br />
offers an Internal Subsidy Program. In <strong>2012</strong> we have approximately 25<br />
suites on internal subsidy which amount to a total of approximately<br />
$22,000 per year. The number of suites in the program fluctuates<br />
throughout the year as new families are added or removed.<br />
<strong>Boardwalk</strong> also continues to impose an internal rent control. This<br />
program limits the amount that <strong>Boardwalk</strong> can or will increase rents<br />
in any given month. This program began in 1999 and we continue<br />
to evaluate and improve this program to ensure its continued<br />
sustainability for our Residents.<br />
✓ ✓<br />
Once again, <strong>Boardwalk</strong> hosted its National Week of Caring in<br />
December <strong>2012</strong>. Throughout this week, each Associate across Canada<br />
is given the opportunity and is encouraged to volunteer in their<br />
community for up to four hours of paid work time. In <strong>2012</strong> nearly 400<br />
Associates took part in the Week of Caring and donated over 1,300<br />
hours of their time.<br />
<strong>Boardwalk</strong> gives each Associate the opportunity to participate in a<br />
Company Matched Payroll Charitable Deduction program. Associates<br />
who participate in this program select the charity that they wish<br />
to donate to, and <strong>Boardwalk</strong> will match 100% of each Associates<br />
contribution up to $1,000 per year, per Associate. In <strong>2012</strong> <strong>Boardwalk</strong><br />
matched over $28,000, an increase from 2011.<br />
<strong>Boardwalk</strong> introduced a new program in <strong>2012</strong> called “<strong>Boardwalk</strong><br />
Angels”. <strong>Boardwalk</strong> Angels is to recognize Associates and Customers<br />
contributions to charitable events in an effort to better the lives of<br />
others. Buildings that have Associates and Customers participate<br />
in Angel events will be recognized with a plaque in their Leasing<br />
Office to mark the events in which they take part in. As a part of this<br />
program, in <strong>2012</strong> we invited Associates and Customers to participate<br />
in Feed the Hungry events across Canada. Associates and Customers<br />
volunteered to serve lunch or dinner to those in need and <strong>Boardwalk</strong><br />
provided the meals.<br />
Expand and continue to<br />
focus on our Community<br />
Development Department<br />
in order to further foster<br />
collaboration with<br />
Government and Social<br />
Services.<br />
Continue to assist our<br />
Customers who are in<br />
financial need.<br />
Focus on encouraging<br />
corporate and individual<br />
contribution and<br />
involvement in our<br />
communities.<br />
<strong>Boardwalk</strong> <strong>REIT</strong> / AR <strong>2012</strong><br />
Goals and TARGETS / 15
Community: (continued)<br />
<strong>2012</strong> Targets <strong>2012</strong> Results 2013 Targets<br />
To expand our boundaries<br />
by taking an active role in<br />
our global community.<br />
✓ ✓<br />
In <strong>2012</strong> <strong>Boardwalk</strong> continued to invite Customers and Associates to<br />
go to Tijuana, Mexico with a program called Homes of Hope through<br />
YWAM. <strong>Boardwalk</strong> was able to make two trips to Tijuana, during which<br />
a combined total of six houses were built. There were 123 Associates<br />
who went on these trips, and 18 Customers were able to attend as well.<br />
These trips will continue throughout 2013.<br />
In <strong>2012</strong> <strong>Boardwalk</strong> Associates participated in Operation Christmas<br />
Child, and this year, we invited Customers to participate as well.<br />
Together, <strong>Boardwalk</strong> Associates and Customers put together 2,123<br />
shoeboxes for children in need around the world; this is almost 200<br />
more shoeboxes than <strong>Boardwalk</strong> packed in 2011.<br />
To expand our boundaries<br />
by taking an active role in<br />
our global community.<br />
The Environment: To positively impact the environment through sustainable practices.<br />
<strong>2012</strong> Targets <strong>2012</strong> Results 2013 Targets<br />
Increase corporate<br />
sustainability by creating<br />
opportunities for positive<br />
environmental change.<br />
✓ ✓<br />
<strong>Boardwalk</strong> has electrically metered over 5,500 suites in an effort<br />
to continue to make our Customers aware of their impact on the<br />
environment. We continue to purchase and install low-flow shower<br />
heads and toilets in our suites, as well as use paint with low voC and<br />
that meets all of the standards to ensure that it is environmentally<br />
friendly. <strong>Boardwalk</strong> also purchases energy star appliances.<br />
The mechanical systems that <strong>Boardwalk</strong> uses are energy efficient.<br />
<strong>Boardwalk</strong> sites use timers and photocells in outdoor lighting to<br />
ensure lights do not stay on all of the time, as well as LED lights in<br />
emergency fixtures. In 2013 we will be beginning a project in Ontario<br />
that involves replacing all light fixtures with CFL fixtures.<br />
<strong>Boardwalk</strong> ensures that all Investor materials are made available<br />
online on our Investor Website www.<strong>Boardwalk</strong><strong>REIT</strong>.com which helps<br />
us to reduce our paper usage tremendously. In <strong>2012</strong> we distributed our<br />
2011 Annual Report exclusively online. For our <strong>2012</strong> Annual Report we<br />
will be printing limited copies as well as providing an online version.<br />
We continue to encourage our Investors to register online to receive<br />
our Annual Report and other Investor materials.<br />
We use FSC-certified mixed sources paper for our <strong>annual</strong> reports.<br />
Increase corporate<br />
sustainability by creating<br />
opportunities for positive<br />
environmental change.<br />
16 / Goals and TARGETS <strong>Boardwalk</strong> <strong>REIT</strong> / AR <strong>2012</strong>
Corporate Governance: To provide fully transparent, on-going corporate information to all stakeholders, meeting or exceeding the guidelines set out by the TSX regarding<br />
effective corporate governance.<br />
<strong>2012</strong> Targets <strong>2012</strong> Results 2013 Targets<br />
Maintain independence of<br />
the Board.<br />
✓<br />
<strong>Boardwalk</strong> added another independent Trustee in <strong>2012</strong>. Currently the<br />
Trust has 6 Trustees, 5 of whom are independent.<br />
Maintain independence of<br />
the Board.<br />
Strive to continually improve<br />
transparency and open,<br />
honest dialogue with all<br />
Unitholders.<br />
Further enhance<br />
procedures and systems<br />
for the consistent, timely<br />
dissemination of corporate<br />
and industry information.<br />
✓ ✓<br />
We provide the public with the opportunity to call in and listen to all<br />
of our quarterly conference calls. There is also an audio recording of<br />
our webcasts made available for one week after the teleconference.<br />
Our senior management as well as our dedicated Investor Relations<br />
team have committed to making ourselves available to answer and<br />
address specific Unitholder questions.<br />
✓ ✓<br />
In <strong>2012</strong>, we continued to see success and improvement with our<br />
quarterly reporting format. We are always looking for ways in which to<br />
make our reporting format more efficient.<br />
We provide webcasts of all of our quarterly conference calls to the<br />
public. We also strive to make all of our documents and webcasts<br />
easily accessible. There are links to all of our current and past<br />
documents containing our corporate information on our investor<br />
website.<br />
Strive to continually improve<br />
transparency and open,<br />
honest dialogue with all<br />
Unitholders.<br />
Further enhance<br />
procedures and systems<br />
for the consistent, timely<br />
dissemination of corporate<br />
and industry information.<br />
Unitholders: To provide a consistent, sustainable and attractive investment option focused on providing stable monthly cash flow and increasing overall returns for<br />
Unitholders.<br />
<strong>2012</strong> Targets <strong>2012</strong> Results 2013 Targets<br />
Realize FFO target of $2.65 to<br />
$2.85 per Trust Unit.<br />
Stabilized Buildings noI<br />
growth of 1% to 4%.<br />
✓ ✓<br />
<strong>Boardwalk</strong> exceeded its original FFO expectation for the year and<br />
achieved FFO of $2.87 per Trust Unit for <strong>2012</strong>. The Trust did update its<br />
guidance each quarter in <strong>2012</strong>, and fell within our revised guidance of<br />
$2.80 to $2.90 per Trust Unit.<br />
✓ ✓<br />
Stabilized Buildings NOI increased 5.0%, and exceeded our original<br />
target. The Trust also revised its noI target through the year and did<br />
finish within its revised target range of 3% to 5% noI growth.<br />
Realize FFO target of $2.95<br />
to $3.15.<br />
Stabilized Buildings noI<br />
growth of 1% to 4%.<br />
Realize a total return on the<br />
<strong>REIT</strong> units that outperforms<br />
the S&P / TSX Composite and<br />
the S&P / TSX Capped Real<br />
Estate Indices.<br />
We have no plans to acquire<br />
new units at this time, as we<br />
feel it is more advantageous<br />
to invest in our existing<br />
assets through our Unit<br />
Buyback program.<br />
Complete performance<br />
enhancing transactions to<br />
maximize Unitholder value.<br />
✓ ✓<br />
In <strong>2012</strong>, <strong>Boardwalk</strong> Unitholders realized a total return of 28.3% on<br />
their <strong>REIT</strong> units, compared to posted returns of 2.8% for the S&P / TSX<br />
Composite and 9.4% for the S&P / TSX Capped Real Estate Indices.<br />
✓ ✓<br />
No units were acquired or sold in <strong>2012</strong>. The <strong>REIT</strong> continues to feel<br />
that investing in the Trust’s existing portfolio through quality<br />
enhancements and through the Trust’s Unit Buyback Program are the<br />
most accretive for Unitholders.<br />
✓ ✓<br />
In <strong>2012</strong>, the Trust continued to focus on Customer Service, and<br />
enhanced Unitholder value through organic growth. In addition, the<br />
Trust continued to renew existing mortgage financing at accretive<br />
levels as the maturing interest rates continue to be significantly higher<br />
than current CMHC mortgage rates.<br />
Realize a total return on the<br />
<strong>REIT</strong> units that outperforms<br />
the S&P / TSX Composite and<br />
the S&P / TSX Capped Real<br />
Estate Indices.<br />
We have no plans to acquire<br />
new units at this time and<br />
continue to focus on organic<br />
growth through a continued<br />
focus on improving our<br />
Communities and Customer<br />
experience.<br />
Complete performance<br />
enhancing transactions to<br />
maximize Unitholder value.<br />
<strong>Boardwalk</strong> <strong>REIT</strong> / AR <strong>2012</strong><br />
Goals and TARGETS / 17
Customers<br />
<strong>Boardwalk</strong> is committed to delivering the best value possible to Customers. In <strong>2012</strong> <strong>Boardwalk</strong><br />
focused on Customer retention and continued to build and strengthen the communities in which<br />
our Customers live as well as provide exceptional Customer Service. <strong>Boardwalk</strong> believes that<br />
through all of our efforts we continue to make Customers feel at home while with <strong>Boardwalk</strong>.<br />
<strong>Boardwalk</strong> has a Customer Call Centre that is open 24 hours a day,<br />
seven days week and provides nationwide service. Customers are<br />
able to reach us here by phone, email or live chat, to ensure that<br />
any questions or comments are addressed as soon as possible.<br />
In <strong>2012</strong> <strong>Boardwalk</strong>’s Customer Call Centre received over 149,000<br />
calls, 66,000 emails and 25,000 live chats.<br />
In order to ensure that all Customer concerns are dealt with in a<br />
timely manner, in addition to our Customer Call Centre, <strong>Boardwalk</strong><br />
also offers 24-hour on call maintenance at each of our buildings.<br />
<strong>Boardwalk</strong> offers a 72-hour maintenance guarantee that states<br />
that any standard maintenance request made by a Customer will<br />
be completed within three business days. For any additional days<br />
that it may take to complete a standard maintenance request,<br />
Customers will receive a day free of rent.<br />
After a Customer has had maintenance work done in their suite,<br />
or after they have just moved in, <strong>Boardwalk</strong> follows up with an<br />
automated telephone survey. We use this survey to better understand<br />
our Customers and how we can continue to improve upon<br />
the service we provide them. Any negative responses received<br />
through these surveys are followed up on until the Customer is<br />
completed satisfied. <strong>Boardwalk</strong> administered over 12,000 surveys<br />
to Customers in <strong>2012</strong> and received a response rate of 75%. Of<br />
these responses, <strong>Boardwalk</strong> is proud to say that 87% were positive.<br />
<strong>Boardwalk</strong> also monitors the reasons for which Customers<br />
decide to move out of their <strong>Boardwalk</strong> building. Our move outs<br />
decreased from 13,882 in 2011 to 13,138 in <strong>2012</strong>, and the number<br />
of Customers who cited that rent was too expensive as the reason<br />
they moved out declined by over 200 year over year to 196 individuals<br />
in <strong>2012</strong>.<br />
In <strong>2012</strong> <strong>Boardwalk</strong> was proud to launch the redesign of our secure<br />
Customer Website. The launch took place in May <strong>2012</strong> and<br />
<strong>Boardwalk</strong> is pleased to announce that our new Customer Website<br />
currently has more Customers registered than our previous site<br />
did. The goal of this website is to create an online <strong>Boardwalk</strong><br />
community and to provide our Customers with one more way to<br />
communicate with us. Through the Customer Website, Residents<br />
are able to review their account, submit and track maintenance<br />
18 / Operations RevIEW <strong>Boardwalk</strong> <strong>REIT</strong> / AR <strong>2012</strong>
equests, communicate with Customer<br />
Service and much more. Throughout 2013<br />
we have plans to continue to promote and<br />
need from a Customer Magazine. In 2013<br />
we plan to launch this magazine across<br />
Canada, both in paper and online.<br />
expand this site to ensure that it remains<br />
up to date and useful for Customers.<br />
<strong>Boardwalk</strong> also saw continued success<br />
with www.bwalk.com, adding new pages<br />
and new features to ensure we are providing<br />
current and potential Customers with<br />
the information they need.<br />
<strong>Boardwalk</strong> is always looking for innovative<br />
ways to establish relationships with<br />
Customers, and in <strong>2012</strong> we continued to<br />
invite Customers to be a part of our trips<br />
to Tijuana, Mexico with Homes of Hope<br />
through YWAM. In <strong>2012</strong> <strong>Boardwalk</strong> participated<br />
in two Homes of Hope trips and<br />
<strong>Boardwalk</strong> prides itself on being Canada’s<br />
friendliest landlord and we believe that<br />
this goes a long way in building Customer<br />
retention. In <strong>2012</strong> we continued programs<br />
as well as introduced some new initiatives<br />
to continue to build and strengthen<br />
our relationship with our<br />
took 123 Associates and 18 Customers<br />
to Tijuana and built six houses. The year<br />
<strong>2012</strong> also saw <strong>Boardwalk</strong> host its very<br />
first Monopoly Tournament in Calgary,<br />
AB. Customers were invited to register for<br />
the tournament on <strong>Boardwalk</strong>’s Customer<br />
Website. In the first two<br />
Customers. This includes<br />
our Internal Subsidy program<br />
Throughout <strong>2012</strong><br />
<strong>Boardwalk</strong> hosted<br />
rounds, Customers played<br />
against one another, after<br />
which provides relief<br />
which we were left with<br />
over 45 Customer<br />
to Customers who may<br />
three finalists who played<br />
be experiencing financial Appreciation Events against CEO, Sam Kolias,<br />
hardships. <strong>Boardwalk</strong> continued<br />
our internal rent<br />
across Canada. in the final round. Each<br />
finalist received a prize depending<br />
control throughout <strong>2012</strong> and in 2013 we<br />
have made improvements to this program<br />
to ensure that we provide sustainable<br />
increases to the amount we will increase<br />
rent for our Residents.<br />
on which place they finished in;<br />
Sam was ineligible for a prize. First place<br />
received six months free rent, second<br />
place one month free rent and third place<br />
an iPad. <strong>Boardwalk</strong> found this event to be<br />
very successful and is looking to expand it<br />
Throughout <strong>2012</strong> <strong>Boardwalk</strong> hosted over<br />
to other cities in 2013.<br />
45 Customer Appreciation Events across<br />
Canada. These events included ideas<br />
such as; barbeques, zoo days and private<br />
access to skating rinks. At each of these<br />
events <strong>Boardwalk</strong> distributed Customer<br />
feedback cards to collect feedback on<br />
how we can continue to connect with<br />
our Customers. This data has provided us<br />
with valuable feedback which we have<br />
taken in to consideration and are trying to<br />
In 2013 <strong>Boardwalk</strong> aims to continue to<br />
build and develop our relationship with<br />
our Customers. We continue to look for<br />
innovative ways to engage our Customers<br />
in activities in their local and global communities.<br />
By taking an interest in their<br />
thoughts and establishing a relationship<br />
with them, we ensure that we are able to<br />
deliver the best possible value.<br />
implement. In addition to this, <strong>Boardwalk</strong><br />
is also in the beginning phases of creating<br />
a Customer focused magazine. <strong>Boardwalk</strong><br />
used <strong>2012</strong> as an opportunity to hold<br />
focus groups with Customers and collect<br />
feedback on what they would want and<br />
<strong>Boardwalk</strong> <strong>REIT</strong> / AR <strong>2012</strong><br />
Operations RevIEW / 19
Unitholders<br />
<strong>Boardwalk</strong> has cultivated a diverse portfolio of assets spanning over 18<br />
major centres and consisting of over 225 properties. The diversity of our<br />
portfolio allows us to weather regional volatility, as well as mitigate risks<br />
of individual markets. Conversely, we still maintain a significant presence<br />
in each of our communities allowing us to achieve operating efficiencies<br />
in conjunction with gains in our strategically located markets. With over<br />
60% of the Trust’s portfolio located in Alberta and Saskatchewan, the<br />
Trust is well positioned to take advantage of these two growth markets<br />
as the resource sector has historically driven economic growth. We<br />
are, however, not immune to global market instability and, as such,<br />
have remained prudent in ensuring that the financial position of the<br />
Trust remains strong with ample liquidity to ensure that we are able to<br />
capitalize on potential opportunities.<br />
20 / Operations RevIEW <strong>Boardwalk</strong> <strong>REIT</strong> / AR <strong>2012</strong>
Les Jardins de Merici, Quebec QC<br />
Brentview Towers, Calgary AB<br />
The Trust continues to monitor the marketplace<br />
for acquisition opportunities<br />
and, through diligent analysis, will ensure<br />
that any acquisitions are accretive under<br />
the appropriate conditions. Portfolio<br />
growth through acquisitions has not been<br />
prevalent in recent years for the Trust, as<br />
the actual cost of acquisition when risk<br />
adjusted were not in the best interest of<br />
the Trust. The low interest rate environment<br />
has however, presented<br />
a unique opportunity for The Trust was<br />
the Trust to potentially use<br />
able to increase<br />
excess land in its portfolio to<br />
distributions twice<br />
increase the density of some<br />
of its assets through the development<br />
of new<br />
in <strong>2012</strong>.<br />
apartment<br />
buildings. <strong>Boardwalk</strong> has undertaken its<br />
first development project at its Spruce<br />
Ridge Estates project in Calgary, AB; and<br />
continues to evaluate the viability of other<br />
development projects in other regions.<br />
Organic growth within the Trust’s portfolio<br />
remains a significant opportunity for<br />
the Trust to enhance value to Unitholders.<br />
The closing of the Trust’s loss-to-lease (the<br />
difference between market rents and the<br />
actual rent received) on rents grew to $24<br />
per unit per month at the end of <strong>2012</strong>;<br />
and represents nearly $10 million in <strong>annual</strong>ized<br />
revenue. As the Trust continues<br />
to maintain high occupancy, with rent<br />
adjustments, and suite specific incentives<br />
in its revenue optimization strategy; the<br />
closing of this loss-to-lease presents a<br />
significant opportunity for the Trust.<br />
<strong>2012</strong> FFO per unit was strong at $2.87 per<br />
Trust Unit. The Trust was able to increase<br />
distributions twice in <strong>2012</strong> to provide<br />
our Unitholders with $1.92 per Unit, on<br />
an <strong>annual</strong>ized basis, an increase of 6.7%<br />
since the beginning of the year, of regular<br />
cash distribution, which equated to 65%<br />
of FFO in <strong>2012</strong>, and remains one of the<br />
most conservative payout ratios among<br />
our peers. In total, the Trust distributed<br />
$98.3 million in <strong>2012</strong>, with an estimated<br />
45% allocated to a return of capital and<br />
55% allocated to income.<br />
As interest rates remained historically low<br />
for much of <strong>2012</strong>, <strong>Boardwalk</strong> is pleased to<br />
have renewed approximately $454 million<br />
of maturing CMHC mortgage principal.<br />
The weighted average new interest rate<br />
on these funds was 2.91%, versus the maturing<br />
rate of 4.64%, a significant<br />
decrease to <strong>Boardwalk</strong>’s<br />
interest expense. The average<br />
term of these renewals<br />
was over 7 years.<br />
Moving into 2013, interest<br />
rates are expected to remain<br />
exceptionally low and present an excellent<br />
opportunity for the Trust to continue<br />
to reduce the maturing interest rates on<br />
2013 mortgages. The Trust will continue<br />
to proactively monitor interest rate markets,<br />
and has prepared optional forward<br />
interest rate fix contracts on a significant<br />
number of mortgage maturities in 2013,<br />
should interest rates increase.<br />
With the Trust’s seasoned management<br />
team, <strong>Boardwalk</strong> continues to be an industry<br />
leader in transparency and financial<br />
disclosure. <strong>Boardwalk</strong>’s quarterly financial<br />
reports are an excellent source of information,<br />
which we encourage all of our<br />
stakeholders to review. All of the Trust’s financial<br />
reports can be found on our website:<br />
www.boardwalkreit.com. <strong>Boardwalk</strong><br />
also continues to be one of the few <strong>REIT</strong>s<br />
who provide financial guidance on a<br />
quarterly basis. Full transparency allows<br />
prospective and current Unitholders the<br />
opportunity to fully evaluate the Trust’s<br />
long-term value proposition including,<br />
but not limited to: the Trust’s stable cash<br />
distributions, healthy balance sheet, and<br />
conservative fiscal management.<br />
<strong>Boardwalk</strong> <strong>REIT</strong> / AR <strong>2012</strong><br />
Operations RevIEW / 21
Associates<br />
With over 1,600 Associates, <strong>Boardwalk</strong> firmly believes that our success<br />
can be attributed to our team of hard-working and talented Associates.<br />
<strong>Boardwalk</strong> Associates are dedicated to providing outstanding Customer<br />
Service across Canada and ensuring that they are delivering the best<br />
value to our Customers. As a result of our continued dedication to our<br />
Associates, <strong>Boardwalk</strong> strives to ensure that we are providing Associates<br />
with the best value when it comes to the company and environment in<br />
which they work.<br />
22 / Operations RevIEW <strong>Boardwalk</strong> <strong>REIT</strong> / AR <strong>2012</strong>
Throughout <strong>2012</strong>, <strong>Boardwalk</strong> continued<br />
using various mediums to ensure that<br />
our Associates are provided with timely<br />
and up to date information. The biggest<br />
challenge <strong>Boardwalk</strong> faces with internal<br />
communications is a team of Associates<br />
that are spread out across Canada, for<br />
this reason we have tailored our internal<br />
communications so that they are relevant<br />
and useful to all Associates, regardless of<br />
Region that <strong>Boardwalk</strong> operates in has an<br />
internal committee that is dedicated to<br />
Associates. These committees raise money<br />
to provide gifts of hope to Associates<br />
and their families in times of need, and<br />
<strong>Boardwalk</strong> is proud to match all of the<br />
funds raised. <strong>Boardwalk</strong> also has an extensive<br />
list of benefits for our Associates.<br />
In <strong>2012</strong> we added the following to<br />
our benefits: an update to our Critical<br />
location. One facet of <strong>Boardwalk</strong>’s internal Illness coverage, additional charities<br />
communications is our intranet which is a<br />
secure website where Associates can go<br />
to learn about events across Canada as<br />
well as important Human<br />
for our Charitable Donations program<br />
and Online Training for Associates, and<br />
throughout the year <strong>Boardwalk</strong> invested<br />
over $2,000,000 in comprehensive<br />
Resources and Health As <strong>Boardwalk</strong><br />
group benefits. In<br />
and Safety information. Associates are the key 2013, we have once again<br />
In <strong>2012</strong> we added a new<br />
added to our benefits, we<br />
to success, one of our<br />
feature to this site, a<br />
are offering each Associate<br />
best investments is in<br />
blog from our CEO Sam<br />
an additional Grace Day as<br />
Kolias to communicate<br />
directly with Associates.<br />
our Associates. well as increased the amount<br />
of our fitness reimbursement.<br />
<strong>Boardwalk</strong> also continued to distribute<br />
our quarterly magazine which aims to create<br />
a sense of unity between Associates.<br />
<strong>Boardwalk</strong> also continues to offer<br />
Associates a Group RRSP Employer Match<br />
and in <strong>2012</strong>, <strong>Boardwalk</strong> invested over<br />
Finally, <strong>Boardwalk</strong> also held <strong>annual</strong> $1,961,500 in this program.<br />
luncheons for Associates with senior executives<br />
called “TEAM” which stands for<br />
The Executive Associate Meetings. These<br />
events give Associates across Canada the<br />
opportunity to interact with members<br />
from senior management and to get an<br />
update on <strong>Boardwalk</strong> events and financials<br />
from executives.<br />
<strong>Boardwalk</strong> encourages all Associates to<br />
continue to learn and grow in their chosen<br />
field, and in <strong>2012</strong> we were pleased to<br />
invest over $136,000 in Associate training<br />
and development. These funds were used<br />
to cover items such as text books, tuition<br />
and membership fees. We also want to ensure<br />
that we continue to offer a work environment<br />
<strong>Boardwalk</strong> strives to provide Associates<br />
with the best work environment. In <strong>2012</strong><br />
we continued to provide our Associates<br />
with a Profit Share Program as well as<br />
continued to conduct research to ensure<br />
we are providing Associates with competitive<br />
wages. <strong>Boardwalk</strong> also continued the<br />
High Potential Program that recognizes<br />
Associates who go above and beyond.<br />
that allows Associates to excel<br />
and grow, and as a result we continue to<br />
update our Mentor Guides on a quarterly<br />
basis, as well as now offer online review<br />
and testing processes for new Associates.<br />
In addition to these programs, we also<br />
continue our succession planning. This<br />
requires all <strong>Boardwalk</strong> Leaders to select a<br />
successor for their role and the time frame<br />
in which this individual will be ready for<br />
As <strong>Boardwalk</strong> Associates are the key to<br />
success, we believe that one of our best<br />
investments is in our Associates. Each<br />
the role. <strong>Boardwalk</strong> finds that through<br />
these programs, Associates are inclined<br />
and able to continue to learn and grow.<br />
<strong>Boardwalk</strong> <strong>REIT</strong> / AR <strong>2012</strong><br />
Operations RevIEW / 23
A key factor to appreciating Associates,<br />
is recognition, as a result, <strong>Boardwalk</strong><br />
believes in celebrating and acknowledging<br />
Associates who go above and<br />
beyond in their day to day work. Each year<br />
<strong>Boardwalk</strong> presents certain Associates<br />
with Foundation of Excellence awards.<br />
These awards are peer voted and go to<br />
individuals who are committed to living<br />
<strong>Boardwalk</strong>’s Mission, Vision and Values<br />
each day. In <strong>2012</strong>, we were pleased to<br />
award nine Associates with these awards,<br />
along with one Leader of Excellence<br />
award. We also recognize Associates<br />
who receive compliments from our<br />
Customers through our Bravo program.<br />
The Bravo program continued in <strong>2012</strong>,<br />
and we were pleased to award over 350<br />
of our Associates with Bravos. In addition<br />
to celebrating <strong>Boardwalk</strong> Associates<br />
achievements, we extend this to the<br />
families of our Associates by offering<br />
Chairman’s Scholarships to the children of<br />
<strong>Boardwalk</strong> Associates. In <strong>2012</strong> <strong>Boardwalk</strong><br />
awarded 24 children with scholarships,<br />
amounting to over $100,000.<br />
With all of these programs in place to<br />
ensure that <strong>Boardwalk</strong> has the best corporate<br />
culture and work environment for<br />
Associates across Canada, we are happy<br />
to see our team continue to grow to over<br />
1,600 Associates. Of these Associates,<br />
<strong>Boardwalk</strong> is pleased to say that 38% of<br />
Associates have been with us for over five<br />
years, and 19% over 10 years. <strong>Boardwalk</strong><br />
Associate turnover in <strong>2012</strong> was 20.86%,<br />
which remained relatively the same as<br />
2011.<br />
Chairman’s Scholarship Recipients<br />
Student Name<br />
Clarisse Pascua<br />
Francis Gareau<br />
Anne-Sophie St. Jean<br />
Alvyn Labertino<br />
Krizia Chavez<br />
Cynthie Beisson<br />
Jennifer Nebeling<br />
John Richard Dutton<br />
Carlos Afanador<br />
Jyllel Majorenos<br />
David Cabana<br />
Andrew Wionzek<br />
Hector Enrique Aldana<br />
Claudine Costa<br />
Marco Bellusci<br />
Yulia Stalevski<br />
Megan Eglauer<br />
David Cerda<br />
Jann Mapalo<br />
Rose Carreon<br />
Alejandra Devia<br />
Ella Sun<br />
Osman Fahia<br />
Bryan David<br />
Associate Name<br />
Renate Pascua<br />
Guy Gareau<br />
Sylvain St. Jean<br />
Oscar Labertino<br />
Christopher Chavez<br />
Kristine Dault<br />
Patrick Nebeling<br />
Lynn Rideout<br />
Felipe Afanador<br />
Joel Majorenos<br />
Helene Thomas<br />
Laurie Wionzek<br />
Hector Aldana<br />
Constantino Costa<br />
Lorenzo Bellusci<br />
Serguei Stalevski<br />
Leonard Eglauer<br />
Elma Cerda Sanchez<br />
Wilfredo Mapalo<br />
Orlando Carreon<br />
Claudia Devia<br />
Lihong Sun<br />
Asma Mahamud<br />
Julius David<br />
24 / Operations RevIEW <strong>Boardwalk</strong> <strong>REIT</strong> / AR <strong>2012</strong>
Health<br />
and Safety<br />
The dedication and commitment <strong>Boardwalk</strong> shows towards<br />
Health and Safety continued through <strong>2012</strong>, and will continue<br />
throughout 2013. At the beginning of 2011, <strong>Boardwalk</strong> launched<br />
a Zero Injury Campaign, a goal to eliminate all workplace injuries<br />
and illnesses. This campaign remained in place in <strong>2012</strong> with<br />
a Health and Safety section being added to each Associates<br />
performance review.<br />
In <strong>2012</strong> <strong>Boardwalk</strong> conducted an internal Health and Safety audit<br />
in Alberta and was pleased to receive an overall mark of 99%.<br />
Throughout this extensive audit, we were able to pinpoint areas<br />
where we can continue to improve in making <strong>Boardwalk</strong> a safe<br />
and healthy place for all Associates. <strong>Boardwalk</strong>’s Health and Safety<br />
programs helped to see a significant decrease in our Claims cost<br />
through WCB in Alberta.<br />
Part of our continued dedication to Health and Safety is ensuring<br />
that our Associates are educated on the best practices to ensure<br />
that they are being safe in their day to day work. <strong>Boardwalk</strong> takes<br />
advantage of many different methods to communicate Health<br />
and Safety to Associates. These methods include; a monthly<br />
Health and Safety bulletin delivered to each Associate, a page<br />
dedicated to Health and Safety on our intranet, a quarterly Health<br />
and Safety update in our internal magazine, as well as discussion<br />
of Health and Safety practices in our <strong>annual</strong> luncheons.<br />
Throughout <strong>2012</strong> we continued our efforts to create building<br />
information manuals for each of our properties. These manuals<br />
contain important emergency procedures and protocols,<br />
mechanical equipment shutdown procedures, and detailed site<br />
specific information for site Associates to reference during daily<br />
operational duties. We have completed 30% of these manuals<br />
across Canada and 100% for Southern Alberta. The development<br />
and research to optimize the building manuals, combining them<br />
with reserve fund studies to form <strong>Boardwalk</strong> Building Systems<br />
Management, is in its preliminary stages and will be focused upon<br />
over the next few years.<br />
<strong>Boardwalk</strong> continues to have the following programs in place to<br />
ensure that our Associates receive the appropriate training and<br />
education that allows them to do their work in a safe manner.<br />
Health and Safety Programs<br />
Asbestos Management Plan<br />
Associate Training<br />
Bed Bugs<br />
Bodily Fluids & Dead Animal Cleanup<br />
Chainsaw Safety<br />
Communication<br />
Company Vehicle Safety<br />
Confined Spaces<br />
Electrical Safety<br />
Emergency Response<br />
Environmental Policy<br />
Fall Protection<br />
Firearms / Weapons Found on Site<br />
First Aid<br />
Forklift Safety<br />
Hazard Detection Program<br />
Hazardous Materials, Storage and Disposal<br />
Housekeeping<br />
Incident Reporting<br />
Indoor Air Quality<br />
Job Hazard Analysis<br />
Joint Health & Safety Committee<br />
Ladder Safety<br />
Lockout and Tagging<br />
Material Safety Data Sheets (MSDS)<br />
Modified Duties<br />
Monthly Site Safety Inspections<br />
Mould Remediation<br />
Needle / Syringe Safety<br />
Noise Exposure & Hearing Conservation<br />
Office Ergonomics<br />
Pandemic Response<br />
Personal Protective Equipment<br />
Pesticides<br />
Pool Safety<br />
Power Tool Safety<br />
Respirator Code of Practice<br />
Right to Refuse Unsafe Work<br />
Safety Infractions<br />
Site Safety Meetings<br />
Slip, Trip & Fall<br />
Snow Shoveling<br />
Sun & Heat Protection<br />
Transportation of Dangerous Goods<br />
Visitor Policy<br />
Workplace Hazardous Materials<br />
Information Systems (WHMIS)<br />
Working Alone<br />
Workplace Violence<br />
Zero Injury Campaign<br />
<strong>Boardwalk</strong> <strong>REIT</strong> / AR <strong>2012</strong><br />
Operations RevIEW / 25
Community<br />
<strong>2012</strong> was the year of Community for <strong>Boardwalk</strong>. We focused our efforts<br />
on building and maintaining strong local and global communities. Part<br />
of delivering value and making <strong>Boardwalk</strong> the best place to live, is our<br />
commitment to our surrounding communities. <strong>Boardwalk</strong> continues to<br />
commit to building better communities.<br />
photos this page:<br />
Homes of Hope, Tijuana, Mexico<br />
<strong>Boardwalk</strong> offers a Company Matched Payroll Charitable Deduction program. Associates<br />
who wish to take part in this program will select the charity they wish to donate to from<br />
our list of registered charities. Their donation is automatically deducted from their pay<br />
each month, and <strong>Boardwalk</strong> will match their donations up to $1,000 per Associate, per<br />
year. In <strong>2012</strong> <strong>Boardwalk</strong> was proud to match $28,000 of Associate contributions.<br />
To encourage Associates and Customers to get involved in their communities and<br />
volunteer, <strong>Boardwalk</strong> introduced a new program; <strong>Boardwalk</strong> Angels. This program acts<br />
as an umbrella under which all of <strong>Boardwalk</strong>’s charitable events fall. Throughout <strong>2012</strong><br />
we took part in many events and invited Customers and Associates to participate. These<br />
events included numerous Feed the Hungry events across Canada where Associates and<br />
Customers served lunch to local individuals in need and <strong>Boardwalk</strong> provided the meal.<br />
Buildings who have been involved with <strong>Boardwalk</strong> Angel events will receive a plaque to<br />
proudly display in their Leasing Offices.<br />
26 / Operations RevIEW <strong>Boardwalk</strong> <strong>REIT</strong> / AR <strong>2012</strong>
Free the Children, We Day Alberta<br />
Daffodil Month, Quebec<br />
Santa’’s Anonymous, Edmonton, Alberta<br />
Once again, <strong>Boardwalk</strong> held its National<br />
Week of Caring in December of <strong>2012</strong>.<br />
Throughout this week Associates are<br />
encouraged to volunteer in their communities<br />
and are offered the opportunity<br />
to volunteer for up to four hours of paid<br />
work time. There were 392 Associates who<br />
took advantage of this opportunity and<br />
volunteered for a collective total of 1,300<br />
work hours and almost 80 personal hours.<br />
During the Holiday Season, <strong>Boardwalk</strong><br />
Associates and Customers once again participated<br />
in Samaritan’s Purse Operation<br />
Christmas Child. In <strong>2012</strong>, Associates and<br />
Customers packed over 2,000 shoeboxes<br />
for children in need around the world.<br />
To encourage Associates and<br />
Customers to get involved<br />
in their communities and<br />
volunteer, <strong>Boardwalk</strong><br />
introduced a new program;<br />
<strong>Boardwalk</strong> Angels.<br />
<strong>Boardwalk</strong> aims to help our immediate<br />
community by assisting our Customers<br />
who are in financial need. We have an<br />
Internal Subsidy Program for these<br />
Customers. In <strong>2012</strong> we had approximately<br />
25 suites on <strong>Boardwalk</strong> internal subsidy,<br />
which amounts to approximately $22,000<br />
per year. The number of suites in this program<br />
fluctuates throughout the year as<br />
new families are added or removed.<br />
In an effort to impact our world and<br />
global community, <strong>Boardwalk</strong> continues<br />
to be involved with YWAM and Homes<br />
of Hope, a program in which we travel<br />
to Tijuana, Mexico to build homes for<br />
families in need. In <strong>2012</strong>, <strong>Boardwalk</strong> was<br />
happy to take part in two trips and build<br />
six homes for families in Tijuana. Over 140<br />
individuals volunteered to attend these<br />
trips to help our global communities, and<br />
included 18 Customers.<br />
In <strong>2012</strong>, <strong>Boardwalk</strong> was pleased to work<br />
with Free the Children and sponsor We<br />
Day Alberta. This event targets youth and<br />
aims to educate and empower them to<br />
realize the potential they have and how<br />
they can positively impact not only their<br />
future, but also the impact they can have<br />
on our world. This event was incredibly<br />
rewarding, not only for <strong>Boardwalk</strong> to be a<br />
part of, but for each individual who was in<br />
attendance. In 2013, <strong>Boardwalk</strong> is pleased<br />
to explore ways to continue to be a part<br />
of the efforts of Free the Children and<br />
We Day.<br />
<strong>Boardwalk</strong> counts <strong>2012</strong> as an incredible<br />
year for community, where Associates<br />
and Customers were able to build relationships<br />
while helping out in their<br />
surrounding communities. We continue<br />
to look forward to 2013 where we plan to<br />
continue our efforts in building, strengthening<br />
and delivering value to our local<br />
and global communities.<br />
<strong>Boardwalk</strong> <strong>REIT</strong> / AR <strong>2012</strong><br />
Operations RevIEW / 27
Environment and Sustainability<br />
<strong>Boardwalk</strong> makes every effort to ensure<br />
that while providing the best value possible<br />
to Customers, Associates, the Community<br />
and Unitholders, we remain conscience of<br />
our effects on the environment. We believe<br />
that being sustainable does not just mean<br />
conducting our organization in a way that<br />
provides environmental stability, but also<br />
in a way that ensures the value we provide<br />
is sustainable both socially and financially.<br />
While we are always working to ensure that<br />
our organization is the best it can be for<br />
our Customers, Associates, Community and<br />
Unitholders in the present, we continue to look<br />
forward to the future to ensure that we are not<br />
only always improving, but also that our value<br />
remains sustainable in the time to come.<br />
28 / Operations RevIEW <strong>Boardwalk</strong> <strong>REIT</strong> / AR <strong>2012</strong>
Environment<br />
<strong>Boardwalk</strong> encourages Customers to<br />
remain conscience of the effect they have<br />
on the environment. Currently we have<br />
electrically sub-metered over 5,500 suites.<br />
All of <strong>Boardwalk</strong>’s meters meet Canada<br />
Measurement Certification Requirements.<br />
Further to this, <strong>Boardwalk</strong> purchases<br />
and installs low flow shower heads and<br />
toilets as well as energy efficient fixtures.<br />
<strong>Boardwalk</strong> uses timers and photocells for<br />
outdoor lighting to ensure that lights do<br />
not stay on all of the time, we also use LED<br />
lights in our emergency fixtures. In 2013,<br />
we are beginning a project in Ontario to<br />
replace the light fixtures at each of our<br />
buildings with CFL fixtures. <strong>Boardwalk</strong><br />
also purchases energy star appliances and<br />
uses paint that is low in VOC.<br />
In our Regional Offices across Canada,<br />
we continue to encourage Associates to<br />
ensure that their lights and computers are<br />
shut off at the end of each day and not<br />
running needlessly through the night and<br />
weekends. We also have recycling programs<br />
at all of our offices for cardboard,<br />
paper, plastic and computer and printer<br />
parts.<br />
We continue to look for ways to cut down<br />
on our paper usage. All of our internal<br />
communication materials are posted<br />
online on our intranet for Associates<br />
across Canada to access, and externally,<br />
all of our Investor materials are placed on<br />
line and our investors are encouraged to<br />
access them there rather than requesting<br />
a paper copy. By making use of our<br />
Customer Website in 2013 we hope to be<br />
able to further decrease the amount of<br />
printed materials we are distributing to<br />
our Customers.<br />
Sustainability<br />
<strong>Boardwalk</strong> aims to achieve sustainability<br />
in three areas; environmental, social and<br />
financial. Our efforts to remain environmentally<br />
sustainable are explained previously,<br />
while our social sustainability is led<br />
by our Associates. <strong>Boardwalk</strong> aims to empower<br />
Associates and provide them with<br />
the opportunity to get involved and give<br />
back to their communities, and by doing<br />
so, help to promote social sustainability.<br />
In <strong>2012</strong>, we encouraged our Associates to<br />
take more of a leadership role in social sustainability<br />
by working to get Customers<br />
involved in our efforts. <strong>Boardwalk</strong> is proud<br />
of the effort our Associates and Customers<br />
have put into their local and global communities,<br />
and continues to support and<br />
encourage them in these endeavours.<br />
Another aspect to our social sustainability<br />
is our Customers. <strong>Boardwalk</strong> tries to<br />
support Customers going through financial<br />
instability when possible through<br />
programs like our internal subsidies and<br />
internal rent control. We believe that<br />
these programs not only promote social<br />
sustainability, but help create strong and<br />
lasting relationships with our Customers.<br />
<strong>Boardwalk</strong>’s financial stability is driven<br />
by the Trust’s Board of Directors,<br />
Management Team and most importantly,<br />
our Stakeholders. The Trust maintains a<br />
strong balance sheet and employs conservative<br />
fiscal management. Through<br />
these and other measures, the Trust<br />
remains able to provide our Unitholders<br />
with sustainable cash distributions.<br />
Through <strong>Boardwalk</strong>’s continued commitment<br />
to delivering value, our organization<br />
remains environmentally, socially and<br />
financially sustainable.<br />
<strong>Boardwalk</strong> <strong>REIT</strong> / AR <strong>2012</strong><br />
Operations RevIEW / 29
Portfolio Summary<br />
(above) Nuns Island, Montreal QC<br />
Radisson Village,<br />
Calgary AB<br />
30 / Operations RevIEW <strong>Boardwalk</strong> <strong>REIT</strong> / AR <strong>2012</strong>
Oakhill Estates, Calgary AB<br />
Spruce Ridge Estates, Calgary AB<br />
<strong>Boardwalk</strong> Centre, Edmonton AB<br />
Property Name<br />
Building<br />
Type<br />
Number<br />
of Units<br />
Net<br />
Rentable<br />
Square<br />
Footage<br />
Average<br />
Unit Size<br />
Property Name<br />
Building<br />
Type<br />
Number<br />
of Units<br />
Net<br />
Rentable<br />
Square<br />
Footage<br />
Average<br />
Unit Size<br />
Calgary, AB<br />
Beltline Towers Highrise 115 80,424 699<br />
<strong>Boardwalk</strong> Heights Highrise 202 160,894 797<br />
Brentview Towers Highrise 239 151,440 634<br />
Centre Pointe West Highrise 123 110,611 899<br />
Chateau Highrise 145 110,545 762<br />
Elbow Tower Highrise 158 108,280 685<br />
Flintridge Place Highrise 68 55,023 809<br />
Glamorgan Manor Garden 86 63,510 738<br />
Hillside Estates Garden 76 58,900 775<br />
Lakeside Estates Garden 89 77,732 873<br />
Lakeview Walkup 120 107,680 897<br />
McKinnon Court Garden 48 36,540 761<br />
McKinnon Manor Garden 60 43,740 729<br />
Northwest Pointe Garden 150 102,750 685<br />
Oak Hill Estates Townhouse 240 236,040 984<br />
O’Neil Tower Highrise 187 131,281 702<br />
Patrician Village Garden 392 295,600 754<br />
Pineridge Garden 76 52,275 688<br />
Prominence Place Apts. Garden 75 55,920 746<br />
Radisson Village I Townhouse 124 108,269 873<br />
Radisson Village II Townhouse 124 108,015 871<br />
Radisson Village III Townhouse 118 124,379 1,054<br />
Ridgeview Gardens Townhouse 160 151,080 944<br />
Royal Park Plaza Highrise 86 66,137 769<br />
Russet Court Townhouse 206 213,264 1,035<br />
Sarcee Trail Place<br />
Highrise/<br />
Midrise 376 301,720 802<br />
Skygate Tower Highrise 142 113,350 798<br />
Spruce Ridge Estates Garden 284 196,464 692<br />
Travois Garden 89 61,350 689<br />
Varsity Place Walk-up 70 47,090 673<br />
Varsity Square<br />
Midrise/<br />
Lowrise 297 241,128 812<br />
Vista Gardens Garden 100 121,040 1,210<br />
Westwinds Village Garden 180 137,815 766<br />
Willow Park Gardens Garden 66 44,563 675<br />
5,071 4,074,849 804<br />
Edmonton, AB<br />
Alexander Plaza Garden 252 203,740 808<br />
Aspen Court Garden 80 68,680 859<br />
<strong>Boardwalk</strong> Arms A & B Garden 78 64,340 825<br />
<strong>Boardwalk</strong> Centre Highrise 597 471,871 790<br />
<strong>Boardwalk</strong> Village I II & III Townhouse 255 258,150 1,012<br />
Breton Manor Garden 66 57,760 875<br />
Briarwynd Court Townhouse 172 144,896 842<br />
Brookside Terrace Garden 131 196,779 1,502<br />
Cambrian Place Garden 105 105,008 1,000<br />
Edmonton, AB (continued)<br />
Camelot Garden 64 54,625 854<br />
Capital View Tower Highrise 115 71,281 620<br />
Carmen Garden 64 54,625 854<br />
Castle Court Garden 89 93,950 1,056<br />
Castleridge Estates Townhouse 108 124,524 1,153<br />
Cedarville Garden 144 122,120 848<br />
Christopher Arms Garden 45 29,900 664<br />
Corian Garden 153 167,400 1,094<br />
Deville Highrise 66 47,700 723<br />
Ermineskin Place Highrise 226 181,788 804<br />
Fairmont Village Garden 424 362,184 854<br />
Fontana Place Highrise 62 40,820 658<br />
Fort Garry House Highrise 93 70,950 763<br />
Galbraith House Highrise 163 110,400 677<br />
Garden Oaks Garden 56 47,250 844<br />
Granville Square Townhouse 48 53,376 1,112<br />
Greentree Village Garden 192 156,000 813<br />
Habitat Village Townhouse 151 129,256 856<br />
Imperial Tower Highrise 138 112,050 812<br />
Kew Place Townhouse 108 105,776 979<br />
Lansdowne Park Highrise 62 48,473 782<br />
Leewood Village Garden 142 129,375 911<br />
Lord Byron I II & III Highrise 158 133,994 848<br />
Lord Byron Townhouses Townhouse 147 172,369 1,173<br />
Lorelei House Garden 78 65,870 844<br />
Maple Gardens Garden 181 163,840 905<br />
Marlborough Manor Garden 56 49,582 885<br />
Maureen Manor Highrise 91 64,918 713<br />
Meadowside Estates Garden 148 104,036 703<br />
Meadowview Manor Garden 348 284,490 818<br />
Monterey Pointe Garden 104 83,548 803<br />
Morningside Estates Garden 221 166,315 753<br />
Northridge Estates Garden 180 103,270 574<br />
Oak Tower Highrise 70 51,852 741<br />
Parkside Tower Highrise 179 162,049 905<br />
Parkview Estates Townhouse 104 88,432 850<br />
Pembroke Estates Garden 198 198,360 1,002<br />
Pinetree Village Garden 142 106,740 752<br />
Point West Townhouses Townhouse 69 72,810 1,055<br />
Primrose Lane Garden 153 151,310 989<br />
Prominence Place Highrise 91 73,310 806<br />
Redwood Court Garden 116 107,680 928<br />
Riverview Manor Garden 81 62,092 767<br />
Royal Heights Highrise 74 41,550 561<br />
Sandstone Pointe Garden 81 83,800 1,035<br />
Sir William Place Garden 220 126,940 577<br />
Solano House Highrise 91 79,325 872<br />
<strong>Boardwalk</strong> <strong>REIT</strong> / AR <strong>2012</strong><br />
Operations RevIEW / 31
West Edmonton Village, Edmonton AB<br />
Westmount Ridge, London ON<br />
Complexe Laudance, Quebec City QC<br />
Property Name<br />
Building<br />
Type<br />
Number<br />
of Units<br />
Net<br />
Rentable<br />
Square<br />
Footage<br />
Average<br />
Unit Size<br />
Property Name<br />
Building<br />
Type<br />
Number<br />
of Units<br />
Net<br />
Rentable<br />
Square<br />
Footage<br />
Average<br />
Unit Size<br />
Edmonton, AB (continued)<br />
Southgate Tower Highrise 170 153,385 902<br />
Summerlea Place Garden 39 43,297 1,110<br />
Suncourt Place Garden 62 55,144 889<br />
Tamarack East & West Townhouse 132 212,486 1,610<br />
Terrace Garden Estates Garden 114 101,980 895<br />
Terrace Tower Highrise 84 66,000 786<br />
The Palisades Highrise 94 77,200 821<br />
The Westmount Highrise 133 124,825 939<br />
Tower Hill Highrise 82 46,360 565<br />
Tower On The Hill Highrise 100 85,008 850<br />
Valley Ridge Tower Highrise 49 30,546 623<br />
Victorian Arms Garden 96 91,524 953<br />
Viking Arms Highrise 240 257,410 1,073<br />
Village Plaza Townhouse 68 65,280 960<br />
Warwick Garden 60 49,092 818<br />
West Edmonton Court Garden 82 73,209 893<br />
West Edmonton Village Various 1,176 1,138,368 968<br />
Westborough Court Garden 60 50,250 838<br />
Westbrook Estates Garden 172 148,616 864<br />
Westmoreland Garden 56 45,865 819<br />
Westpark Ridge Garden 102 99,280 973<br />
Westridge Estates B Garden 91 56,950 626<br />
Westridge Estates C Garden 90 56,950 633<br />
Westridge Manor Townhouse 64 69,038 1,079<br />
Westwinds of Summerlea Garden 48 53,872 1,122<br />
Whitehall Square<br />
Highrise/<br />
Walkup 598 545,934 913<br />
Wimbledon Highrise 165 117,216 710<br />
12,057 10,598,614 879<br />
Fort mCmUrray, AB<br />
Birchwood Manor Garden 24 18,120 755<br />
Chanteclair Garden 79 68,138 863<br />
Edelweiss Terrace Garden 32 27,226 851<br />
Heatherton Garden 23 16,750 728<br />
Hillside Manor Garden 30 21,248 708<br />
Mallard Arms Garden 36 30,497 847<br />
McMurray Manor Garden 44 30,350 690<br />
The Granada Garden 44 35,775 813<br />
The Valencia Garden 40 33,850 846<br />
352 281,954 801<br />
London, ON<br />
Abbey Estates Townhouse 53 59,794 1,128<br />
Castlegrove Estates Highrise 144 126,420 878<br />
Forest City Estates Highrise 272 221,000 813<br />
Heritage Square<br />
Garden/<br />
Highrise 359 270,828 754<br />
London, ON (continued)<br />
Landmark Towers Highrise 213 173,400 814<br />
Maple Ridge On The Parc Highrise 257 247,166 962<br />
Meadowcrest Garden 162 110,835 684<br />
Noel Meadows Garden 105 72,600 691<br />
Ridgewood Estates Townhouse 29 31,020 1,070<br />
Sandford Highrise 96 77,594 808<br />
The Bristol Highrise 138 109,059 790<br />
Topping Lane Terrace Highrise 189 177,880 941<br />
Villages of Hyde Park Townhouse 60 57,850 964<br />
Westmount Ridge Highrise 179 131,700 736<br />
2,256 1,867,146 828<br />
MontrEAl, QC<br />
Domaine d’Iberville Apartments<br />
(Longueuil, QC) Highrise 720 560,880 779<br />
Le Bienville (Brossard, QC) Walk-up 168 115,600 688<br />
Les Jardins Viva (Longueuil, QC) Walk-up 112 91,000 813<br />
Nuns’ Island Portfolio<br />
Garden/<br />
Highrise/<br />
Townhouse 3,100 3,075,140 992<br />
Complexe Deguire<br />
(St. Laurent, QC) Highrise 322 276,324 858<br />
Residence le Quatre Cent<br />
(Laval, QC) Highrise 259 153,500 593<br />
4,681 4,272,444 913<br />
Quebec City, QC<br />
Complexe Laudance<br />
(Sainte-Foy, QC) Midrise 183 134,480 735<br />
Les Appartements Du Verdier<br />
(Sainte-Foy, QC) Garden 195 152,645 783<br />
Les Jardins de Merici Highrise 346 300,000 867<br />
Place Charlesbourg Midrise 108 82,624 765<br />
Place du Parc Highrise 111 81,746 736<br />
Place Samuel de Champlain Highrise 130 104,153 801<br />
Place Chamonix Townhouse 246 236,630 962<br />
1,319 1,092,278 828<br />
Red Deer, AB<br />
Canyon Pointe Garden 163 114,039 700<br />
Cloverhill Terrace Highrise 120 102,225 852<br />
Inglewood Terrace Garden 68 42,407 624<br />
Parke Avenue Square Walk-up 88 87,268 992<br />
Riverdale Manor Garden 150 114,750 765<br />
Saratoga Tower Highrise 48 53,762 1,120<br />
Taylor Heights Garden 140 103,512 739<br />
Watson Tower Highrise 50 43,988 880<br />
Westridge Estates Townhouse 112 113,664 1,015<br />
939 775,615 826<br />
32 / Operations RevIEW <strong>Boardwalk</strong> <strong>REIT</strong> / AR <strong>2012</strong>
Riverdale Manor, Windsor ON<br />
Christie Point Apartments, Victoria BC<br />
<strong>Boardwalk</strong> Park Estates, Grande Prairie AB<br />
Property Name<br />
Building<br />
Type<br />
Number<br />
of Units<br />
Net<br />
Rentable<br />
Square<br />
Footage<br />
Average<br />
Unit Size<br />
Property Name<br />
Building<br />
Type<br />
Number<br />
of Units<br />
Net<br />
Rentable<br />
Square<br />
Footage<br />
Average<br />
Unit Size<br />
Regina, SK<br />
Ashok Portfolio Garden 140 81,098 579<br />
<strong>Boardwalk</strong> Estates Garden 687 467,696 681<br />
<strong>Boardwalk</strong> Manor Garden 72 60,360 838<br />
Centennial South Townhouse 170 129,080 759<br />
Centennial West Garden 60 46,032 767<br />
Eastside Estates Townhouse 150 167,550 1,117<br />
Evergreen Estates Garden 150 125,660 838<br />
Grace Manors Townhouse 72 69,120 960<br />
Greenbriar Garden 72 57,600 800<br />
Lockwood Arms Garden 96 69,000 719<br />
Pines of Normanview Townhouse 133 115,973 872<br />
Qu’appelle Village I & II Garden 154 133,200 865<br />
Qu’appelle Village III Garden 180 144,160 801<br />
Southpointe Plaza Highrise 140 117,560 840<br />
The Meadows Townhouse 52 57,824 1,112<br />
Wascana Park Estates Townhouse 320 307,200 960<br />
2,648 2,149,113 812<br />
Saskatoon, SK<br />
Carlton Tower Highrise 158 155,138 982<br />
Chancellor Gate Garden 138 126,396 916<br />
Dorchester Tower Highrise 52 48,608 935<br />
Heritage Townhomes Townhouse 104 99,840 960<br />
Lawson Village Garden 96 75,441 786<br />
Meadow Park Estates Townhouse 200 192,000 960<br />
Palace Gates Garden 206 142,525 692<br />
Penthouse Highrise 82 61,550 751<br />
Regal Tower I & II Highrise 161 122,384 760<br />
Reid Park Estates Garden 179 128,700 719<br />
St. Charles Place Garden 156 123,000 788<br />
St. James Place Garden 140 105,750 755<br />
Stonebridge Garden 162 131,864 814<br />
Stonebridge Townhomes I & II Townhouse 100 135,486 1,355<br />
Wildwood Ways B Garden 54 43,961 814<br />
1,988 1,692,643 851<br />
VancoUVEr, BC<br />
Horizon Towers (Burnaby, BC) Highrise 206 139,160 676<br />
Surrey Village (Surrey, BC) Highrise 266 162,371 610<br />
472 301,531 639<br />
Windsor, on<br />
Anchorage Highrise 135 110,245 817<br />
Anchorage on the Park Townhouse 31 38,750 1,250<br />
Askin Tower Highrise 60 39,675 661<br />
Buckingham Tower Highrise 34 30,805 906<br />
Caron Tower Highrise 47 36,947 786<br />
Empress Court Garden 40 28,250 706<br />
Frances Tower Highrise 53 43,906 828<br />
Glenwood Highrise 33 25,619 776<br />
Janisse Tower Highrise 75 45,000 600<br />
Karita Tower Highrise 41 28,950 706<br />
Lauzon Tower Highrise 178 137,784 774<br />
Marine Court Highrise 68 49,206 724<br />
Randal Court Garden 47 38,775 825<br />
Regency Colonade Highrise 133 113,205 851<br />
Riverdale Manor Townhouse 97 77,850 803<br />
Rivershore Tower Highrise 96 63,300 659<br />
Sandilands Tower Highrise 47 38,775 825<br />
Sandwich Tower Highrise 66 40,650 616<br />
Seaway Tower Highrise 152 112,037 737<br />
Sun Crest Tower Highrise 58 43,100 743<br />
Sun Ray Manor Highrise 41 29,950 730<br />
Tecumseh Terrace Highrise 98 71,606 731<br />
University Tower Highrise 50 36,100 722<br />
1,680 1,280,485 762<br />
Other<br />
<strong>Boardwalk</strong> Park Estates 2<br />
(Grande Prairie, AB) Townhouse 32 30,210 944<br />
Parkview Portfolio<br />
(Grande Prairie, AB) Garden 369 306,850 832<br />
Prairie Sunrise Portfolio<br />
(Grande Prairie, AB) - see Note 1<br />
Walk-up/<br />
Highrise 244 201,992 828<br />
Elk Valley Estates (Banff, AB) Garden 76 53,340 702<br />
Tower Lane I & II (Airdrie, AB) Garden 163 130,920 803<br />
Springwood Place Apartments<br />
(Spruce Grove, AB) Low Rise 160 122,640 767<br />
Sturgeon Point Villas<br />
(St. Albert, AB) Walk-up 280 284,953 1,018<br />
Christie Point Apartments<br />
(Victoria, BC)<br />
Townhouse/<br />
Walk-up 161 155,405 965<br />
Kings Tower (Kitchener, on) Highrise 226 171,100 757<br />
Westheights Place<br />
(Kitchener, on) Highrise 103 91,920 892<br />
1,814 1,549,330 854<br />
Total - As at Dec 31, <strong>2012</strong> 35,277 29,936,001 849<br />
Total - As at Dec 31, 2011 35,277 29,936,001 849<br />
<strong>Boardwalk</strong> <strong>REIT</strong> / AR <strong>2012</strong><br />
Operations RevIEW / 33
Good Corporate Governance<br />
One of <strong>Boardwalk</strong>’s corporate values is integrity. Accordingly, we<br />
pride ourselves on striving to be honest, accountable and transparent<br />
in all of our corporate reporting. As a result of our commitment<br />
to integrity, good corporate governance has been the<br />
foundation of all of <strong>Boardwalk</strong>’s successes over the past 28 years.<br />
We were proud to be recognized by The Journal of the Institute<br />
of Corporate Directors for effective communication regarding our<br />
transition to International Financial Reporting Standards (IFRS).<br />
We aim to provide our stakeholders with important information<br />
in a timely manner, and encourage open and honest dialogue<br />
between, and with, our stakeholders in an effort to ensure<br />
<strong>Boardwalk</strong>’s continued success. Our Board of Trustees follows a<br />
mandate described in their Statement of Corporate Governance<br />
Practices that explicitly defines the expectations and limits of<br />
both the Board and management. This comprehensive statement<br />
of our governance principles gives authority and autonomy to<br />
the Board through the articulation of key issues, including: specific<br />
functions of the Board, Board independence and integrity,<br />
selection and composition of the Board, and Board committees.<br />
As a publicly traded Trust listed on the Toronto Stock Exchange<br />
(TSX), <strong>Boardwalk</strong> either meets or exceeds the guidelines set out by<br />
the TSX and Canadian Securities Administrators regarding effective<br />
corporate governance. The governance of our Trust is based<br />
on the mandate of our Board of Trustees, our Code of Business<br />
Conduct, as well as the guiding Mission, Vision and Values that all<br />
Associates and management are expected to uphold. These guiding<br />
principles, derived from the Golden Rule of “treating others as<br />
we would like to be treated,” provide a framework for our Trustees<br />
and Associates as they deal with the often complex and sensitive<br />
issues that arise over the normal course of our business.<br />
As per the mandate, a majority of Trustees must be independent<br />
of management and free from any business or other relationship<br />
which could, or could reasonably be perceived to, materially<br />
interfere with the Trustee’s ability to act with a view to the best<br />
interests of the Trust and its Unitholders. Currently, five (5) of the<br />
six (6) Board members are independent. In addition to assuming<br />
responsibility for the stewardship of the Trust, <strong>Boardwalk</strong>’s Board<br />
is specifically charged with:<br />
▲<br />
▲<br />
▲<br />
▲<br />
▲<br />
Reviewing, discussing and approving the Trust’s strategic<br />
plan, which takes into account, among other things, the<br />
opportunities and risks of the business.<br />
Identifying the principal risks of the Trust’s business, and<br />
ensuring implementation of appropriate systems to manage<br />
those risks. (Among other things, the Board reviews risk management<br />
policies and processes, including those concerning<br />
credit risk, market risk, liquidity risk and operational risk.)<br />
Reviewing the performance of the CEO and other senior<br />
executives of the Trust.<br />
Creating and maintaining the communication policy of the<br />
Trust, including<br />
– Approving the contents of major disclosure documents<br />
of the Trust.<br />
– Reviewing policies and programs related to the image<br />
of the Trust and ensuring appropriate processes are in<br />
place for communicating with all stakeholders.<br />
– Reviewing how the Trust communicates and interacts<br />
with analysts and the public to avoid selective disclosure.<br />
Managing the integrity of internal controls and management<br />
information systems.<br />
In addition to its other accountabilities, the Board is responsible<br />
for two committees, the Compensation, Governance and<br />
Nominations Committee, as well as the Audit and Risk Management<br />
Committee, each of which is composed solely of outside and<br />
independent Trustees. The Compensation, Governance and<br />
Nominations Committee is charged with the responsibilities of<br />
identifying and evaluating candidates to fill Board vacancies,<br />
and assessing Board and committee effectiveness. The Audit and<br />
Risk Management Committee assists the Board in overseeing the<br />
integrity of the Board’s financial statements, the performance<br />
of the Trust’s external auditors, the adequacy and effectiveness<br />
of internal controls and compliance with legal and regulatory<br />
matters.<br />
34 / Operations RevIEW <strong>Boardwalk</strong> <strong>REIT</strong> / AR <strong>2012</strong>
Financial Review<br />
Management’s Discussion and Analysis<br />
Forward-Looking Statements................................. 36<br />
▲ executive Summary ............................... 37<br />
Business Overview. ........................................ 37<br />
MD&A Overview. .......................................... 37<br />
Outlook................................................... 37<br />
Declaration of Trust........................................ 38<br />
Values, Vision and Objectives. .............................. 39<br />
Non-GAAP Financial Measures. ............................. 41<br />
Investment Philosophy..................................... 42<br />
Hedging Activities. ........................................ 44<br />
Performance Review Of <strong>2012</strong>. .............................. 45<br />
▲ consolidated Operations and Earnings Review. .... 48<br />
Overall Review ............................................ 48<br />
Segmented Operational Review............................ 49<br />
Operational Sensitivities ................................... 52<br />
Stabilized Property Results. ................................ 54<br />
Financing Costs ........................................... 56<br />
Administration. ........................................... 58<br />
Depreciation and Amortization. ............................ 58<br />
Other Income and Expenses. ............................... 59<br />
▲ Financial Condition. .............................. 60<br />
Review of Consolidated Statements of Cash Flows ........... 60<br />
Review of Consolidated Statements of Financial Position. .... 62<br />
Capital Structure and Liquidity ............................. 64<br />
▲ Risks and Risk Management ....................... 67<br />
General Risks................................................. 67<br />
Specific Risks................................................. 69<br />
Additional Risks and Uncertainties............................ 73<br />
Certain Tax Risks ............................................. 73<br />
Risks Associated with Disclosure Controls and Procedures<br />
& Internal Control over Financial Reporting................... 75<br />
▲ accounting and Control Matters. ................. 76<br />
Critical Accounting Policies. ................................ 76<br />
Future Changes in Critical Accounting Policies............... 87<br />
International Financial Reporting Standards (“IFRS”}. ......... 89<br />
Disclosure Controls and Procedures<br />
& Internal Control over Financial Reporting ................. 89<br />
▲ <strong>2012</strong> Financial Outlook and Market Guidance ...... 90<br />
Selected Consolidated Financial Information . ............... 90<br />
Financial Statements<br />
▲ Management’s Report. ............................ 92<br />
▲ independent Auditors’ Report. .................... 93<br />
▲ Financial Statements ............................. 94<br />
▲ notes to Financial Statements. . . . . . . . . . . . . . . . . . . . .98<br />
Supplemental InfoRMation<br />
▲ Five Year SuMMary. .............................. 140<br />
▲ Quarterly SuMMary. ............................. 142<br />
▲ Market InfoRMation. ............................ 144<br />
▲ corporate InfoRMation. ......................... 145<br />
<strong>Boardwalk</strong> <strong>REIT</strong> / ar <strong>2012</strong><br />
MANAGEMENT’s DISCUSSION and analySIS / 35
Management’s Discussion and Analysis<br />
For the Year Ended December 31, <strong>2012</strong><br />
Forward-Looking Statements<br />
Caution regarding forward-looking statements:<br />
The terms “<strong>Boardwalk</strong>”, “<strong>Boardwalk</strong> <strong>REIT</strong>”, the “Trust”, “we”, “us” and “our” in the following Management’s Discussion and Analysis (“MD&A”) refer to<br />
<strong>Boardwalk</strong> Real Estate Investment Trust, its consolidated financial position, and results of operations for the years ended December 31, <strong>2012</strong> and 2011.<br />
Financial data provided has been prepared in accordance with International Financial Reporting Standards (“IFRS”), as issued by the International<br />
Accounting Standards Board (“IASB”) and as required by all Publicly Accountable Enterprises to be adopted effective January 1, 2011. This MD&A is current<br />
as of February 13, 2013 unless otherwise stated, and should be read in conjunction with <strong>Boardwalk</strong>’s audited <strong>annual</strong> consolidated financial statements<br />
for the years ended December 31, <strong>2012</strong> and 2011, which have been prepared in accordance with IFRS, together with the MD&A related thereto, copies of<br />
which have been filed electronically with securities regulators in Canada through the System for Electronic Document Analysis and Retrieval (“SEDAR”)<br />
and may be accessed through the SEDAR web site at www.sedar.com. Historical results and percentage relationships contained in the <strong>annual</strong> consolidated<br />
financial statements and MD&A related thereto, including trends, which might appear, should not be taken as indicative of future operations.<br />
Unless otherwise indicated, all amounts are expressed in Canadian dollars.<br />
Forward-Looking Statement Advisory:<br />
Certain information included in this MD&A contains forward-looking statements within the meaning of applicable securities laws. These statements<br />
include, but are not limited to, statements made concerning <strong>Boardwalk</strong>’s objectives, its strategies to achieve those objectives, as well as statements<br />
with respect to management’s beliefs, plans, estimates, intentions, and similar statements concerning anticipated future events, results, circumstances,<br />
performance, or expectations that are not historical facts. Forward-looking statements generally can be identified by the use of forward-looking<br />
terminology such as “outlook”, “objective”, “may”, “will”, “would”, “expect”, “intend”, “estimate”, “anticipate”, “believe”, “should”, “plan”, “continue”, or<br />
similar expressions suggesting future outcomes or events. Such forward-looking statements reflect management’s current beliefs and are based on<br />
information currently available to management. All forward-looking statements in this MD&A are qualified by these cautionary statements.<br />
These forward-looking statements are not guarantees of future events or performance and, by their nature, are based on <strong>Boardwalk</strong>’s current estimates<br />
and assumptions, which are subject to risks and uncertainties, including those described in the MD&A of <strong>Boardwalk</strong> <strong>REIT</strong>’s <strong>2012</strong> Annual Report under the<br />
heading “Risks and Challenges”, which could cause actual events or results to differ materially from the forward-looking statements contained in this<br />
MD&A. Those risks and uncertainties include, but are not limited to, those related to liquidity in the global marketplace associated with current economic<br />
conditions, tenant concessions, occupancy levels, access to debt and equity capital, interest rates, joint ventures/partnerships, the relative illiquidity<br />
of real property, unexpected costs or liabilities related to acquisitions, construction, environmental matters, legal matters, reliance on key personnel,<br />
Unitholder liability, income taxes and the ability of <strong>Boardwalk</strong> to qualify for the <strong>REIT</strong> Exemption (as defined below). Material factors or assumptions that<br />
were applied in drawing a conclusion or making an estimate set out in the forward-looking information may include, but are not limited to, the rental<br />
environment compared to several years ago, relatively stable interest costs, access to equity and debt capital markets to fund (at acceptable costs), the<br />
future growth program to enable the Trust to refinance debts as they mature, the availability of purchase opportunities for growth in Canada, and the<br />
impact of accounting principles adopted by the Trust effective January 1, 2011 under IFRS. Although the forward-looking information contained in this<br />
MD&A is based upon what management believes are reasonable assumptions, there can be no assurance actual results will be consistent with these<br />
forward-looking statements. Certain statements included in this MD&A may be considered “financial outlook” for purposes of applicable securities<br />
laws, and such financial outlook may not be appropriate for purposes other than this MD&A.<br />
The Income Tax Act (Canada) (the “Act”) contains legislation affecting the tax treatment of publicly traded trusts (the “SIFT Legislation”). The SIFT<br />
Legislation provides for a transition period until 2011 for publicly traded trusts, such as <strong>Boardwalk</strong>, which existed prior to November 1, 2006. In addition,<br />
the SIFT Legislation generally will not impose tax on a trust which qualifies under such legislation as a real estate investment trust (the “<strong>REIT</strong> Exemption”)<br />
provided all of the Trust’s income each year is paid, or made payable to, its Unitholders. <strong>Boardwalk</strong> qualified for the <strong>REIT</strong> Exemption commencing<br />
January 1, 2011. Further discussion of this is contained in this MD&A.<br />
Except as required by applicable law, <strong>Boardwalk</strong> undertakes no obligation to publicly update or revise any forward-looking statement, whether as a<br />
result of new information, future events, or otherwise.<br />
36 / MANAGEMENT’s DISCUSSION and analySIS <strong>Boardwalk</strong> <strong>REIT</strong> / ar <strong>2012</strong>
Executive Summary<br />
Business Overview<br />
<strong>Boardwalk</strong> Real Estate Investment Trust (“<strong>Boardwalk</strong> <strong>REIT</strong>”, “<strong>Boardwalk</strong>” or the “Trust”) is an unincorporated, open-ended real estate<br />
investment trust created pursuant to a Declaration of Trust, dated January 9, 2004, and as amended and restated on May 3, 2004,<br />
May 10, 2006, May 10, 2007, May 13, 2008, May 13, 2009, May 18, 2010, May 12, 2011 and May 15, <strong>2012</strong> (the “Declaration of Trust” or “DOT”),<br />
under the laws of the Province of Alberta. <strong>Boardwalk</strong> <strong>REIT</strong> was created to invest in revenue producing multi-family residential<br />
properties, or interests, initially through the acquisition of assets and operations of <strong>Boardwalk</strong> Equities Inc. (the “Corporation”).<br />
On May 3, 2004, the Corporation sold all of its assets and undertakings to <strong>Boardwalk</strong> <strong>REIT</strong>. <strong>Boardwalk</strong> <strong>REIT</strong> Units trade on the Toronto<br />
Stock Exchange (“TSX”) under the trading symbol ‘BEI.UN’. <strong>Boardwalk</strong> <strong>REIT</strong>’s principal objectives are to provide its Unitholders<br />
(“Unitholders”) with stable and growing monthly cash distributions, partially on a Canadian income tax-deferred basis, and to increase<br />
the value of its units through the effective management of its residential Multi-Family Investment Properties and the acquisition of<br />
additional, accretive properties. At the end of <strong>2012</strong>, <strong>Boardwalk</strong> <strong>REIT</strong> owned and operated in excess of 225 properties, comprising 35,277<br />
residential units and totaling approximately 30 million net rentable square feet. As of December 31, <strong>2012</strong>, <strong>Boardwalk</strong> <strong>REIT</strong>’s property<br />
portfolio was concentrated in the provinces of British Columbia, Alberta, Saskatchewan, Ontario and Quebec.<br />
At December 31, <strong>2012</strong>, the fair value of <strong>Boardwalk</strong>’s Investment Property assets was approximately $5.5 billion, which generated a<br />
profit of $138.2 million and $120.3 million for the years ended December 31, <strong>2012</strong> and 2011 (before fair value gains and income tax<br />
recovery), respectively. Each of these figures was calculated based on the application of IFRS, which the Trust was required to adopt<br />
along with all Publicly Accountable Enterprises, effective January 1, 2011. During the years ended December 31, <strong>2012</strong> and 2011, the<br />
Trust earned $150.3 million and $131.8 million, respectively, of Funds From Operations (“FFO”), or $2.87 and $2.52 per Unit on a diluted<br />
basis. Adjusted Funds From Operations (“AFFO”) for the years ended December 31, <strong>2012</strong> and 2011 were $134.5 million and $115.9 million,<br />
respectively, or $2.57 and $2.22 per Unit on a diluted basis.<br />
MD&A Overview<br />
This MD&A focuses on key areas from the audited consolidated financial statements and pertains to major known risks and uncertainties<br />
relating to the real estate industry, in general, and the Trust’s business, in particular. This discussion should not be considered<br />
all-inclusive as it excludes changes that may occur in general economic, political, and environmental conditions. Additionally, other<br />
elements may or may not occur, which could affect the organization in the future. To ensure that the reader is obtaining the best<br />
overall perspective, this discussion should be read in conjunction with material contained in other parts of the Annual Report, the<br />
audited consolidated financial statements for the years ended December 31, <strong>2012</strong> and 2011 and the Annual Information Form (“AIF”)<br />
dated February 13, 2013, along with all other publicly posted information on the Corporation and <strong>Boardwalk</strong> <strong>REIT</strong>. It is not our intent<br />
to reproduce information that is located in these other reported documents, but rather to highlight some of the key points and refer<br />
you to these documents for more detailed information.<br />
Outlook<br />
The <strong>2012</strong> year proved to be a successful year for <strong>Boardwalk</strong> <strong>REIT</strong> and the multi-family real estate rental market in Canada. <strong>Boardwalk</strong><br />
continues to maintain a healthy liquidity position and has begun to allocate a portion of this to new development opportunities, yet<br />
is still well positioned to take advantage of future acquisitions or value-added opportunities. Recent property transactions continue<br />
to demonstrate that there is an increased demand to own apartments in major Canadian markets, and in <strong>2012</strong> the apartment industry<br />
<strong>Boardwalk</strong> <strong>REIT</strong> / ar <strong>2012</strong><br />
MANAGEMENT’s DISCUSSION and analySIS / 37
continued to to witness a further compression of Capitalization Rates, resulting in significant increases in the prices of properties in<br />
this asset class. Although <strong>Boardwalk</strong> did not acquire any new apartment units during <strong>2012</strong>, we remain active in the bidding process;<br />
however, <strong>Boardwalk</strong> has not been able to conclude that acquiring these assets at the offered selling prices would be in the best<br />
interest of the Trust on a risk-adjusted basis.<br />
The Canadian multi-family real estate sector continues to have access to a very low cost of debt through the use of Government<br />
of Canada-backed debt with the National Housing Act (“NHA”) program, which is administered by Canada Mortgage and Housing<br />
Corporation (“CMHC”). With the continued turmoil in the world markets, Canada continues to be a country of high regard and, as a<br />
result, is experiencing historical low interest rates in the bond markets. This has translated into historically low interest rates for those<br />
who choose to use the NHA vehicle.<br />
<strong>Boardwalk</strong> <strong>REIT</strong> believes the fundamentals of its asset class, and, in particular, its specific assets, generally remain strong, mainly<br />
due to the affordability of renting versus the cost of owning a home. This fact has kept overall occupancy at reasonable levels and,<br />
when combined with the non-exposure to any one or small group of Customers or Members, has kept revenue stable and risks low.<br />
In the debt capital market, the fact that close to 100% of the Trust’s secured debt carries NHA insurance, the benefits of which will be<br />
detailed later in this report, has significantly assisted in renewing and obtaining new financing on its assets at rates better than the<br />
maturing interest rates. The Trust continues to be well positioned with a regular distribution payout ratio of approximately 65.4%<br />
of FFO for the year ended December 31, <strong>2012</strong>. This is below the 71.3% for the year ended December 31, 2011. This improvement can<br />
be attributed to stronger operating performance in <strong>2012</strong> as well the ability to refinance maturing mortgages at significantly lower<br />
interest rates. The Trust continues to have access to low-rate Government of Canada-backed debt in the form of NHA insurance.<br />
As the Trust moves forward, <strong>Boardwalk</strong> continues to look for ways to further enhance the returns provided to our stakeholders. The<br />
Trust continues to focus inward on our operations, continuously looking for ways to reduce costs while simultaneously focusing on<br />
our Members. In addition, we continue to maintain a conservative balance sheet with a Debt-to-Market Value at approximately 40%.<br />
With the assistance of a Province of Alberta government grant, <strong>Boardwalk</strong> has commenced the development of a 109-unit project in<br />
Southwest Calgary. <strong>Boardwalk</strong> is also currently in the process of investigating the development potential of new multi-family rental<br />
projects on excess land density that exists on other properties it owns.<br />
Declaration of Trust<br />
The investment guidelines of the Trust are outlined in the Trust’s DOT, a copy of which is available on request to all Unitholders.<br />
Further information of the DOT can also be located on page 40 of the AIF. Some of the main financial guidelines and operating<br />
policies set out in the DOT are as follows:<br />
Investment Guidelines<br />
1. Acquire, develop, and operate multi-family residential property; and,<br />
2. No investment will be made that would disqualify <strong>Boardwalk</strong> <strong>REIT</strong> as a “mutual fund trust” or a “registered investment” as defined<br />
in the Income Tax Act (Canada).<br />
Operating Policies<br />
1. Interest Coverage Ratio of at least 1.5 to 1;<br />
2. No guaranteeing of third-party debt unless related to direct or indirect ownership or acquisition of real property, including<br />
potential joint venture partner structures;<br />
3. Third-party surveys of structural and environmental conditions are required prior to the acquisition of a multi-family asset; and,<br />
38 / MANAGEMENT’s DISCUSSION and analySIS <strong>Boardwalk</strong> <strong>REIT</strong> / ar <strong>2012</strong>
4. Commitment to expending at least 8.5% of its gross consolidated <strong>annual</strong> rental revenues generated from properties that<br />
have been insured by CMHC on on-site maintenance compensation to Associates, repairs and maintenance, as well as capital<br />
upgrades.<br />
Distribution Policy<br />
<strong>Boardwalk</strong> <strong>REIT</strong> may distribute to holders of <strong>REIT</strong> Units on or about each Distribution Date (1) , respectively, such percentage of Funds<br />
From Operations for the calendar month then ended as the Trustees determine in their discretion. Distributions will not be less than<br />
<strong>Boardwalk</strong> <strong>REIT</strong>’s taxable income, unless the Trustees, in their absolute discretion, determine another amount.<br />
Compliance with DOT<br />
At December 31, <strong>2012</strong>, the Trust was in material compliance with all investment guidelines and operating policies as stipulated in the<br />
DOT as amended. More details will be provided later in this document with respect to certain detailed calculations.<br />
At <strong>Boardwalk</strong> <strong>REIT</strong>’s May 15, <strong>2012</strong> Annual and Special Meeting, certain amendments to the organization’s Declaration of Trust were<br />
proposed and received Unitholder approval. One such amendment replaced the operating policy (with regards to the maximum<br />
debt capacity not to exceed 70% of Gross Book Value) with an interest coverage ratio limit of 1.5 times. This is more operationally<br />
focused and would be a more direct test of the Trust’s cash flow; it is a test widely used and understood in the unsecured and secured<br />
debt markets, and is a test that would not discriminate between secured and unsecured debt. Further details and discussion on this<br />
topic are available in our <strong>2012</strong> Management Information Circular available at www.sedar.com.<br />
For the year ended December 31, <strong>2012</strong>, <strong>Boardwalk</strong> <strong>REIT</strong>’s overall interest coverage ratio of adjusted EBITDA (i.e. Earnings Before<br />
Interest, Taxes, Depreciation and Amortization) to interest expense, excluding distributions on LP B Units and fair value gains and<br />
losses, was 2.76.<br />
Values, Vision and Objectives<br />
<strong>Boardwalk</strong> <strong>REIT</strong> is a fully integrated, Customer-oriented, multi-family residential real estate owner and property management<br />
organization. The Trust was built by focusing on its values and vision.<br />
A Commitment to Value<br />
<strong>Boardwalk</strong> <strong>REIT</strong>’s Vision and business strategy are targeted on effectively meeting the needs of our Customers, or Resident Members.<br />
It is our belief that this focus will result in long-term value creation for all our stakeholders. Our key stakeholders include our Associates,<br />
major financial and mortgage partners, including CMHC, strategic operational partners and Unitholders.<br />
Our Vision<br />
<strong>Boardwalk</strong> <strong>REIT</strong>’s Vision is to be Canada’s leading provider of multi-family residential housing. We believe we will accomplish this<br />
through the continued careful cultivation of internal growth, combined with a targeted and disciplined external acquisition program.<br />
(1) ‘’Distribution Date’’ means with respect to a distribution by <strong>Boardwalk</strong> <strong>REIT</strong>, a business day determined by the Trustees for any calendar month to be on or about the<br />
15th day of the following month.<br />
<strong>Boardwalk</strong> <strong>REIT</strong> / ar <strong>2012</strong><br />
MANAGEMENT’s DISCUSSION and analySIS / 39
Our Associates are expected to adhere to the following guiding principles:<br />
We will:<br />
▲<br />
▲<br />
Work together in a team environment of mutual respect, trust and honesty between all Associates and Resident Members;<br />
Serve our Resident Members’ need for an affordable, quality, well-kept home;<br />
▲<br />
▲<br />
▲<br />
▲<br />
Maintain building exteriors and landscaping, thereby increasing “curb appeal”, have well-kept common areas and ensure our<br />
homes are clean and well maintained;<br />
Maintain a balance between the needs of our Resident Members, Associates, Unitholders, communities and families;<br />
Nurture and promote a learning environment where our Associates’ skills and capabilities grow with the needs of both the Trust<br />
and our Resident Members, and accept that these needs will be consistently evolving and improving the definition of “Rental<br />
Communities”;<br />
Provide access to the latest tools and technology and utilize the latest tools and technology designed to increase the operating<br />
efficiency of the Trust as a whole.<br />
We value:<br />
▲<br />
Integrity<br />
We will be honest, accountable, transparent, respectful, and trusting in our dealings with others, appreciating their views and<br />
differences.<br />
▲<br />
Teamwork<br />
We will effectively work as a team, appreciating and benefiting from each other’s unique talents and skills in an open environment<br />
while recognizing that the team’s successes are our successes.<br />
▲<br />
Resident Member Service<br />
We will promptly respond to Resident Member concerns and needs with thoughtfulness, compassion and innovation. We will<br />
strive to develop proactive solutions through a support network and a positive service attitude.<br />
▲<br />
Social Responsibility<br />
We will contribute to our communities and encourage our Associates to contribute in ways that reflect our Golden Rule of<br />
‘treating others in a way we would wish to be treated’, balancing our needs with those of others, our Golden Goal is to ‘be good’,<br />
our Golden Mission Is ‘have fun’, and our Golden Vision is to ‘love community’.<br />
▲<br />
Our Associates<br />
We will provide a safe and respectful work environment that attracts, supports, develops, and recognizes high-performing and<br />
innovative team members.<br />
We believe that by adhering to our Vision and Values, and implementing strategies consistent with these principles, <strong>Boardwalk</strong> <strong>REIT</strong><br />
will produce higher sustainable operating cash flows and a continued appreciation of its property values. The result will be enhanced<br />
value for all our stakeholders.<br />
40 / MANAGEMENT’s DISCUSSION and analySIS <strong>Boardwalk</strong> <strong>REIT</strong> / ar <strong>2012</strong>
Achieving this goal requires the full integration of our core strategies of focused investing, superior property management and the<br />
implementation and effective use of new technologies. <strong>Boardwalk</strong> <strong>REIT</strong> can best achieve this goal by strategically:<br />
▲<br />
▲<br />
▲<br />
▲<br />
▲<br />
Maximizing Resident Member satisfaction by providing an above-average level of service and accommodation;<br />
Acquiring selected multi-family residential properties;<br />
Selling properties (“Non-Core”) with lower future growth prospects or, on a limited basis, the conversion of properties into<br />
condominium units for sale, and the reinvesting of these funds back into other accretive opportunities;<br />
Purchasing Trust Units on the open market;<br />
Enhancing property values, operating returns and cash flows through pro-active management, property stabilization and<br />
capital improvements;<br />
▲<br />
▲<br />
▲<br />
▲<br />
Reviewing and considering the development of new selective multi-family projects if the economics support such projects;<br />
Managing capital prudently while maintaining a conservative financial structure;<br />
Pursuing opportunities to form selective partnership joint ventures or an exchange of assets; and<br />
Reinvesting the released equity from asset sales back into the Trust’s portfolio to create additional value-added opportunities.<br />
To support our overall operating strategy, it is necessary to:<br />
▲<br />
▲<br />
▲<br />
▲<br />
▲<br />
▲<br />
Ensure ample capital is available at all times for acquisitions and value-added enhancements;<br />
Appropriately allocate available capital to existing project enhancement and on-going new acquisitions;<br />
Utilize appropriate levels of debt leverage;<br />
Determine and utilize sources with the lowest cost of capital;<br />
Actively manage our exposure to interest rate and debt renewal risk;<br />
Optimize the use of NHA insurance, which is administered by CMHC, to access more cost-effective debt capital.<br />
Non-gaap Financial Measures<br />
<strong>Boardwalk</strong> <strong>REIT</strong> assesses and measures operating results based on performance measures referred to as “Funds From Operations”<br />
(“FFO”), and Adjusted Funds From Operations (“AFFO”). FFO is a widely accepted supplemental measure of the performance of a<br />
Canadian real estate entity; however, it is not a measure defined by IFRS. In recent periods, additional attention has been given to<br />
AFFO as a supplemental measurement. FFO does not have any standardized meaning prescribed by IFRS and, therefore, may not<br />
be comparable to similar measures presented by other entities. The IFRS measurement most comparable to FFO is Profit. We define<br />
FFO, after the adoption of IFRS, as income before fair value adjustments, distributions on the LP B Units, gains (losses) on the sale of<br />
Investment Properties, depreciation, deferred income tax, and certain other non-cash adjustments, if any. The reconciliation from<br />
Profit under IFRS to FFO can be found below, under the section titled “Performance Measures”. The reconciliation from FFO to AFFO<br />
can be found in the section titled “Maintenance of Productive Capacity”. FFO and AFFO, however, should not be construed as an<br />
alternative to profit determined in accordance with IFRS as indicators of <strong>Boardwalk</strong> <strong>REIT</strong>’s performance. In addition, <strong>Boardwalk</strong> <strong>REIT</strong>’s<br />
calculation methodology for FFO and AFFO may differ from that of other real estate companies and trusts.<br />
<strong>Boardwalk</strong> <strong>REIT</strong> / ar <strong>2012</strong><br />
MANAGEMENT’s DISCUSSION and analySIS / 41
Investment Philosophy<br />
Throughout <strong>Boardwalk</strong> <strong>REIT</strong>’s history, the Trust has constantly looked for opportunities to create value for the Trust Unitholders. This<br />
is achieved by investing managerial resources and capital in activities that increase FFO per unit and AFFO per unit on a sustaining<br />
basis and/or increase Net Asset Value (“NAV”) per unit. Prior to 2008, a large part of this opportunity was focused on investment<br />
opportunities, both in capital improvements of our existing portfolio and in acquisition of additional properties. However, our investment<br />
strategy is not simply one by which we are constantly looking to expand our existing footprint, but rather one by which we are<br />
constantly looking to create value. Starting in 2008, but more pronounced during 2009 and 2010, it was evident to us that the Trust’s<br />
investment opportunities were not in the acquisition of additional apartment units, but rather in the sale of Non-Core properties<br />
and the deployment of capital to acquire additional <strong>Boardwalk</strong> <strong>REIT</strong> Trust Units in the public markets through our published Normal<br />
Course Issuer Bids (“NCIBs”).<br />
As part of its capital allocation program, there have been times in the past where Management and the Board determined, based<br />
on the trading price of our Trust Units, that an allocation was warranted to the purchase of these Trust Units in the public market for<br />
cancellation. The following table reports our investment in this area from fiscal 2007 to the present:<br />
Year Ended December 31,<br />
Cumulative Number of<br />
Trust Units Purchased<br />
and Cancelled<br />
Cumulative<br />
Purchase Cost<br />
Average Cost<br />
per Trust Unit<br />
2007 856,447 $ 38,577 $ 45.04<br />
2008 2,312,000 85,412 $ 36.94<br />
2009 790,000 22,756 $ 28.80<br />
2010 423,400 17,024 $ 40.21<br />
2011 160,900 6,740 $ 41.89<br />
<strong>2012</strong> – – –<br />
4,542,747 $ 170,509 $ 37.53<br />
Cumulatively, since 2007, <strong>Boardwalk</strong> <strong>REIT</strong> purchased and cancelled approximately 4.5 million Trust Units for a total purchase price of<br />
$170.5 million, or an average cost of $37.53 per Trust Unit.<br />
As previously highlighted, the Trust has an on-going program of selling Non-Core properties in its portfolio and re-deploying the<br />
released capital to acquiring additional properties, reinvesting in its existing properties to achieve superior returns and/or purchasing<br />
its Trust Units for cancellation. The Trust continues to review all available options that management believes will provide the<br />
greatest return to our Unitholders.<br />
In fiscal 2011 and <strong>2012</strong>, <strong>Boardwalk</strong> <strong>REIT</strong> adopted a cautious approach to the disposition of Non-Core properties as a result of the<br />
ambiguity of the income tax treatment of gains on the disposition of real or immovable properties. On October 24, <strong>2012</strong>, legislation to<br />
amend the SIFT Legislation previously announced in December 2010 were released clarifying the treatment of income generated on<br />
the sale of real estate assets. Once the legislation is passed by the Canadian government, the Trust will, if it wishes, be able to continue<br />
its strategy of selling Non-Core assets without the risk of losing its <strong>REIT</strong> Exemption status. Additional information regarding the SIFT<br />
Legislation and the Trust’s qualification as a <strong>REIT</strong> under this legislation can be found in the section titled, “Income Tax Expense” later<br />
in this report.<br />
42 / MANAGEMENT’s DISCUSSION and analySIS <strong>Boardwalk</strong> <strong>REIT</strong> / ar <strong>2012</strong>
Cost of Capital<br />
In understanding <strong>Boardwalk</strong> <strong>REIT</strong>’s investment strategy, it is also necessary to review its cost of capital. The Trust’s cost of capital<br />
is generally defined as its weighted average cost of raising incremental capital and, thus, its hurdle rate for evaluating incremental<br />
investment opportunities. In other words, it can be thought of as the rate of return that the Trust would otherwise be able to earn<br />
given the same level of risk. As with most real estate entities, the cost of capital is the combination of the cost of debt and the<br />
cost of equity. As will be discussed in a later section, the Trust currently has access to a lower cost of debt through its access to the<br />
NHA insured market. However, even this market has different levels of risk that are mainly priced through the term selected on the<br />
related mortgage. That is, the longer the mortgage finance term, the longer the borrower is removing the interest rate risk from the<br />
investment. It is our view that on those investments where you do not have the benefit of hindsight, for example with the actual purchase,<br />
ownership and management of a particular building, there is an increased level of performance risk. To moderate this risk, it is<br />
necessary to hedge the interest rate risk, by taking a longer-term mortgage to allow you time to better understand the performance<br />
risk of the specific property investment. The other major component in the cost of capital relates to the cost of equity required for<br />
the investment. The determination of this cost has a number of different models and definitions. However, for simplicity purposes,<br />
<strong>Boardwalk</strong> determines its current cost of equity as the amount of AFFO reported compared to its current market capitalization. For<br />
<strong>2012</strong>, the Trust reported AFFO per Unit of $2.57 on a fully diluted basis. When compared to the Trust Unit’s market price of $64.53 as at<br />
December 31, <strong>2012</strong>, this equates to approximately 3.98% as its cost of equity.<br />
Once we have determined the cost of capital, management then analyzes and evaluates the opportunities available to the Trust<br />
against a base case scenario. The base case will be determined on two distinct criteria:<br />
(i)<br />
(ii)<br />
whether the investment is accretive to the Trust’s implied Capitalization Rate (“Cap Rate”) adjusting for related risk, and<br />
given the existing leverage of the Trust, whether the investment is accretive on a FFO basis given its existing portfolio’s<br />
internal growth profile.<br />
The investment is also evaluated on a stabilized basis, that is, after considering the impact of funding deferred capital expenditures<br />
and leasing up the property. The base case of the Cap Rate test focuses on the implied Cap Rate on the Trust’s underlying portfolio<br />
because the Trust best understands the operations and risk profile of its own apartment units, and its ability to purchase its own real<br />
estate through the use of NCIBs. In general, for an investment to be accretive, not only does it have to generate a return above this<br />
level, it must also be of equivalent (or better) quality and location. The amount of expectation above this base rate is the anticipated<br />
risk premium adjustment. Each investment is looked at in isolation and evaluated accordingly. In response to the second question,<br />
it is necessary to understand that multi-family rental real estate has historically been an investment based on leverage. As such, it is<br />
necessary for us to analyze the underlying ability to obtain debt and the cost of that debt. <strong>Boardwalk</strong> currently does have access to<br />
NHA insurance from the Government of Canada, the details of which are discussed later in this document. As with other debt in most<br />
instances, the longer the proposed term maturity, the higher the price typically paid for this debt. This difference is the adjustment<br />
the market puts on the risk that the interest rates will be higher during the term of the loan. Accordingly, the investment consideration<br />
for the Trust also adjusts for this risk by building into its current cost of debt a balanced strategy of mortgage maturities of terms<br />
ranging from three to ten years.<br />
<strong>Boardwalk</strong> <strong>REIT</strong> / ar <strong>2012</strong><br />
MANAGEMENT’s DISCUSSION and analySIS / 43
Hedging Activities<br />
There were no new hedging activities in the fiscal year ended December 31, <strong>2012</strong>.<br />
In 2008, the Trust entered into forward hedging arrangements with respect to some of its mortgage interest obligations. The strategy<br />
consisted of hedging, or locking in, the interest rates on the underlying bonds used to set mortgage interest rates while layering an<br />
interest rate swap on top of this to reduce overall interest rates and variability in cash flows from fluctuating interest rates. The effect<br />
on the current and prior year’s financial results is outlined below.<br />
Bond Forward Transaction<br />
In 2008, the Trust entered into a bond forward transaction (the “Transaction”) with a major Canadian financial institution. In total,<br />
the Transaction, which comprised of bond forward contracts on specific mortgages that matured and was renewed in 2008, was for<br />
a total notional amount of $101.6 million with a weighted average term and interest rate of 7.2 years and 3.63%, respectively. One of<br />
the bond forward contracts in the Transaction, which was assessed to be an effective hedge, was settled for a loss of $284 thousand.<br />
This bond forward contract continues to be assessed as “effective” under IFRS and this loss continues to be amortized over the term<br />
of the new financing. As at December 31, <strong>2012</strong>, the unamortized amount of this effective hedge was approximately $156 thousand.<br />
Interest Rate Swap<br />
In 2008, <strong>Boardwalk</strong> <strong>REIT</strong> entered into an interest rate swap agreement on the mortgages of specific properties within its portfolio in<br />
an effort to hedge the variability in cash flows attributed to fluctuating interest rates. These interest rate swap agreements were designated<br />
as cash flow hedges on March 11, 2008. The effective date of the hedges was May 1, 2008, and will continue to be designated as<br />
such until the May 1, 2015 date of maturity. Hedge accounting has been applied to these agreements in accordance with International<br />
Accounting Standard (“IAS”) -39: Financial Instruments: Recognition and Measurement (“IAS 39”).<br />
<strong>Boardwalk</strong> <strong>REIT</strong> has determined that there is no ineffectiveness in its hedging of its interest rate exposure in accordance with IFRS<br />
standards. The effectiveness of the hedging relationship is reviewed on a quarterly basis and measured at fair value. Any gains or<br />
losses, which arise as a result of the “effectiveness” of the hedge, will be recognized in Other Comprehensive Income (“OCI”). The<br />
ineffective portion of the hedging gain or loss on the swap transaction will be recognized immediately in profit. On recognition<br />
of the financial liability of the hedged item on the consolidated statement of financial position, the associated gains or losses that<br />
were recognized in OCI would be reclassified into income in the same period, or periods, during which the interest payments of<br />
the hedged item affect profit. However, if all, or a portion, of the loss recognized in OCI will not be recovered in one or more future<br />
periods, this amount will be immediately reclassified into income.<br />
As at December 31, <strong>2012</strong>, the interest rate swap agreement was assessed to be an effective hedge in accordance with IFRS and, any<br />
gains or losses on the interest rate swap agreement were recognized in income in the periods during which the interest payments<br />
on the hedged items were recognized. For the year ended December 31, <strong>2012</strong>, a gain of $2.8 million was recognized in OCI (December<br />
31, 2011 – loss of $1.9 million).<br />
Unsecured Debentures<br />
In January 2005, the Trust issued unsecured debentures with a face value of $120.0 million with a maturity date of January 23, <strong>2012</strong>.<br />
During the first quarter of 2009, the Trust acquired in the open market at a discount to face value a total of $7.6 million of its unsecured<br />
debentures for cancellation.<br />
The unsecured debentures, with a coupon interest rate of 5.61% and a principal balance of $112.4 million, matured on January 23, <strong>2012</strong>,<br />
and were repaid with cash on hand at maturity.<br />
44 / MANAGEMENT’s DISCUSSION and analySIS <strong>Boardwalk</strong> <strong>REIT</strong> / ar <strong>2012</strong>
PeRFoRMance Review of <strong>2012</strong><br />
<strong>Boardwalk</strong> <strong>REIT</strong> generates revenues, cash flows, and earnings from two separate sources: rental operations and the sale of “Non-Core”<br />
real estate properties.<br />
<strong>Boardwalk</strong> <strong>REIT</strong>’s most consistent and largest source of income comes from its rental operations. Income from this source is derived<br />
from leasing individual apartment units to Members who have varying lease terms ranging from month-to-month to twelve-month<br />
leases.<br />
In the past, <strong>Boardwalk</strong> <strong>REIT</strong> has generated additional income from the periodic sale of selective Non-Core real estate properties. The<br />
sale of these properties is part of <strong>Boardwalk</strong> <strong>REIT</strong>’s overall operating strategy whereby the equity generated through the sale is then<br />
utilized by <strong>Boardwalk</strong> <strong>REIT</strong> for the acquisition of new rental properties, to assist in its property value enhancement program, or for the<br />
acquisition of <strong>Boardwalk</strong> <strong>REIT</strong>’s Trust Units in the public market. Recently introduced legislation better clarifies the nature of income<br />
generated on the sale of these non core properties and will allow the Trust, if it wishes, to continue with this program. More details<br />
on this will be discussed later in the Management Discussion and Analysis.<br />
Performance Measures<br />
It continues to be the intention of the Trust to pay out, at a minimum, all taxable income to Unitholders in the form of monthly distributions,<br />
unless the Board of Trustees, in its absolute discretion, determines a different amount. In <strong>2012</strong>, the Trust distributed $1.92 per<br />
outstanding Trust and LP B Unit on an <strong>annual</strong>ized basis (or $0.16 per Trust and LP B Unit on a monthly basis).<br />
For the year ended December 31, <strong>2012</strong>, the Trust declared regular distributions of $98.3 million (inclusive of distributions paid to the LP<br />
Class B Unitholders), representing approximately 65.4% of FFO. The reader should note the overall operating performance of the first<br />
and fourth quarters tend to generate the highest payout ratio, mainly due to the high seasonality in operating expenses. In particular,<br />
these quarters tend to be the highest demand periods for natural gas, a major operational cost for the Trust. The reader should not<br />
simply <strong>annual</strong>ize these reported results. On a quarterly basis, the Trust’s Board of Trustees reviews the current level of distributions<br />
and determines if any adjustment to the distributed amount is warranted.<br />
Although the Trust believes it is important to distribute a significant portion of its FFO, it also maintains it should withhold a portion<br />
of the available cash flow to assist with the execution of its business strategy. On an overall basis, the Trust aims to maintain a<br />
conservative payout ratio and reviews this with its Board of Trustees on a quarterly basis.<br />
In a recent meeting subsequent to year-end, the Board of Trustees approved an increase to <strong>Boardwalk</strong>’s regular distributions to $1.98<br />
per Trust Unit (or $0.165 per Trust Unit on a monthly basis), an increase of 3.1% from the previous distribution of $1.92 per Trust Unit on<br />
an <strong>annual</strong>ized basis, effective with the commencement of the February 28, 2013 record date. This represents approximately 69.0% of<br />
<strong>2012</strong> FFO and 77.0% of <strong>2012</strong> AFFO.<br />
Over the past few years, AFFO has begun to surface as an additional performance measurement. AFFO is determined by taking the<br />
amounts reported as FFO and deducting what is commonly referred to as ‘Maintenance Capital Expenditures’. Maintenance Capital<br />
Expenditures are referred to as expenditures that, by standard Accounting definitions, are accounted for as capital in that the expenditure<br />
itself has a useful life in excess of the current financial year and also adds or maintains the value of the related asset. A more<br />
detailed discussion of this topic will be provided in the Maintenance of Productive Capacity section later in this document.<br />
<strong>Boardwalk</strong> <strong>REIT</strong> / ar <strong>2012</strong><br />
MANAGEMENT’s DISCUSSION and analySIS / 45
How Did We Do?<br />
At the beginning of the <strong>2012</strong> fiscal year, certain selective performance targets were set out for fiscal <strong>2012</strong>. The assumptions used in<br />
these performance targets were reviewed on a quarterly basis and the full-year guidance was adjusted if such assumptions changed.<br />
The following table compares our forecasted performance to our actual results in fiscal <strong>2012</strong>.<br />
<strong>2012</strong> Actual<br />
<strong>2012</strong> Objectives<br />
Revised in Q3 <strong>2012</strong><br />
<strong>2012</strong> Objectives<br />
Revised in Q2 <strong>2012</strong><br />
<strong>2012</strong> Original<br />
Objectives<br />
FFO per Trust Unit $2.87 $2.80 to $2.90 $2.75 to $2.90 $2.65 to $2.85<br />
AFFO per Trust Unit $2.57 $2.50 to $2.60 $2.45 to $2.60 $2.35 to $2.55<br />
No new apartment No new apartment No new apartment No new apartment<br />
Acquisitions<br />
acquisitions<br />
acquisitions<br />
acquisitions<br />
acquisitions<br />
Stabilized Building NOI Growth 5.0% 3% to 5% 3% to 5% 1% to 4%<br />
The reader is cautioned the financial objectives, when generated, were considered forward-looking information and that actual<br />
results may vary materially from these objectives reported.<br />
Both actual FFO and AFFO for fiscal <strong>2012</strong> were within the revised guidance reported as part of the Trust’s disclosures for the third<br />
quarter of <strong>2012</strong>.<br />
FFO Reconciliation from 2011 to <strong>2012</strong><br />
The following table shows a reconciliation of changes in FFO from December 31, 2011 to December 31, <strong>2012</strong>. It should be noted that<br />
FFO, as disclosed in the table below, reflects FFO derived from the Trust’s consolidated financial statements prepared in accordance<br />
with IFRS. As previously noted, we define the calculation of FFO, under IFRS, as net income before fair value adjustments, distributions<br />
on the LP Class B Units, gains (losses) on the sale of Investment Properties, depreciation, deferred income taxes, and certain other<br />
non-cash items. A more detailed disclosure of the calculation of FFO will be provided later in this report.<br />
FFO Reconciliation<br />
12 Months<br />
FFO Opening – Dec 31, 2011 $ 2.52<br />
NOI from Stabilized Properties $ 0.25<br />
Financing Costs (1) $ 0.15<br />
Administration and other $ (0.05)<br />
FFO Closing – Dec 31, <strong>2012</strong> $ 2.87<br />
(1) Financing costs above exclude the distribution payments for LP Class B Units which are classified as financial liabilities under IFRS. Further discussion<br />
related to this can be found later in this report.<br />
Liquidity<br />
The access to liquidity is an important element of the Trust as it allows the Trust to implement its overall strategy. The current low<br />
interest rate environment has allowed <strong>Boardwalk</strong> to renew its existing maturing mortgages at more favorable interest rates than the<br />
maturing interest rates. In addition, <strong>Boardwalk</strong> has been able to access additional capital from its properties through the continued<br />
use of the current NHA insurance program, which is being offered at attractive rates.<br />
The Trust’s cash position was $138.7 million at December 31, <strong>2012</strong>, compared to $255.9 million reported on December 31, 2011. The<br />
decrease in cash is largely due to the repayment of the Trust’s unsecured debenture ($112.4 million), which matured on January 23,<br />
<strong>2012</strong>. The Trust continues to renew existing maturing NHA-insured mortgages at rates well below the maturing rates while at the<br />
same time is able to raise additional funds for future opportunities. However, there is an opportunity cost to having this much liquidity<br />
on the statement of financial position, which is currently earning a relatively low but safe investment return.<br />
46 / MANAGEMENT’s DISCUSSION and analySIS <strong>Boardwalk</strong> <strong>REIT</strong> / ar <strong>2012</strong>
FFO Reconciliations<br />
The Trust’s adoption of IFRS standards, effective January 1, 2011, has resulted in significant changes to the financial information presented,<br />
including the way the Trust reconciles FFO from its consolidated financial statements prepared in accordance with IFRS.<br />
In the following table, <strong>Boardwalk</strong> <strong>REIT</strong> provides a reconciliation of FFO (a non-IFRS measure) to profit for the period, its closely related<br />
financial statement measurement for the years ended December 31, <strong>2012</strong> and December 31, 2011. Adjustments, which have arisen as a<br />
result of the adoption of IFRS, are explained in the notes below.<br />
FFO Reconciliation<br />
In $000’s, except per unit amounts 12 months <strong>2012</strong> 12 months 2011 % Change<br />
Profit for the period $ 688,514 $ 1,225,086<br />
Adjustments<br />
Fair value gains (1) (549,986) (364,389)<br />
Add back distributions to LP Class B Units recorded as<br />
financing charges (2) 8,413 8,055<br />
Deferred income tax recovery (223) (740,393)<br />
Other income (135) –<br />
Depreciation expense on PP&E 3,760 3,449<br />
Funds from operations $ 150,343 $ 131,808 14.1%<br />
Funds from operations – per unit $ 2.87 $ 2.52 13.9%<br />
(1) Under IFRS, the Trust has a number of Statement of Financial Position items, which are measured using a fair value model with fluctuations related to<br />
these fair value amounts from period to period flowing through the Statement of Comprehensive Income. These fair value adjustments are considered<br />
“non-cash items” and are added back in the calculation of FFO.<br />
(2) Under IFRS, the LP Class B Units are considered financial instruments in accordance with IAS 32 - Financial Instruments: Presentation (“IAS 32”). As a<br />
result of this classification, their corresponding distribution amounts are considered “financing charges” under IFRS. The Trust believes these distribution<br />
payments do not truly represent “financing charges”, as these amounts are only payable if the Trust declares distributions, and only for the amount of any<br />
distributions declared, both of which are at the discretion of the Board of Trustees as outlined in the DOT. Therefore, these distributions are excluded from<br />
the calculation of FFO, consistent with the treatment of distributions paid to all other Unitholders.<br />
All other adjustments in the calculation of FFO above are consistent with those adjustments made in the calculation of FFO previously<br />
derived from financial statements under pre-IFRS Canadian GAAP.<br />
Overall, <strong>Boardwalk</strong> <strong>REIT</strong> earned FFO of $150.3 million for fiscal <strong>2012</strong> compared to $131.8 million for the same period in 2011. FFO on a per<br />
unit fully diluted basis for the current year ended December 31, <strong>2012</strong>, increased approximately 13.9%, compared to the prior year, from<br />
$2.52 to $2.87. The increase was primarily the result of higher rental revenue and lower financing costs.<br />
New Property Acquisitions<br />
For the 2011 and <strong>2012</strong> years, there were no new property acquisitions.<br />
Dispositions<br />
For the 2011 and <strong>2012</strong> years, there were no dispositions of the Trust’s investment properties.<br />
<strong>Boardwalk</strong> <strong>REIT</strong> / ar <strong>2012</strong><br />
MANAGEMENT’s DISCUSSION and analySIS / 47
Financial Performance Summary<br />
At a Glance<br />
In $000’s, except per unit amounts <strong>2012</strong> 2011 % Change<br />
Total Assets $ 5,675,302 $ 5,089,023 11.5%<br />
Total Rental Revenue $ 439,901 $ 422,727 4.1%<br />
Profit $ 688,514 $ 1,225,086 (43.8)%<br />
Total Funds From Operations $ 150,343 $ 131,808 14.1%<br />
Profit Per Unit $ 14.40 $ 24.40 (40.2)%<br />
Funds From Operations Per Unit $ 2.87 $ 2.52 13.9%<br />
Total Assets increased from the amounts reported in the prior year, mainly due to the continued compression of cap rates as investment<br />
properties are now carried at fair value. Total Rental Revenue increased by 4.1%, the result of the improving occupancy and<br />
rental rates. Profit decreased significantly, due to the recovery in 2011 of previously recorded deferred income tax liabilities.<br />
Consolidated Operations and Earnings Review<br />
Overall Review<br />
Consolidated Statements of Comprehensive Income<br />
Rental Operations<br />
<strong>Boardwalk</strong> <strong>REIT</strong>’s rental revenue strategy focuses on enhancing overall rental revenues through the balance between market rents,<br />
rental incentives, and occupancy losses. The application of this strategy is ongoing, on a market-by-market analysis, again with the<br />
focus on obtaining the optimal balance of these variables given existing market conditions.<br />
In $000’s, except number of suites<br />
12 Months<br />
<strong>2012</strong><br />
12 Months<br />
2011 % Change<br />
Total rental revenue $ 439,901 $ 422,727 4.1%<br />
Expenses<br />
Operating expenses $ 87,143 $ 84,400 3.3%<br />
Utilities $ 39,921 $ 40,340 (1.0)%<br />
Property taxes $ 36,773 $ 35,328 4.1%<br />
$ 163,837 $ 160,068 2.4%<br />
Net operating income $ 276,064 $ 262,659 5.1%<br />
Operating margins 62.8% 62.1%<br />
Number of suites at Dec. 31 35,277 35,277<br />
Overall, <strong>Boardwalk</strong> <strong>REIT</strong>’s rental operations for the year ended December 31, <strong>2012</strong> reported higher results compared to the same<br />
period in the prior year, with total rental revenue increasing 4.1% for the year ended December 31, <strong>2012</strong> compared to the prior year. The<br />
increase in rental revenue is the combined effect of increases to market rents combined with decreases in both suite-specific rental<br />
incentives and occupancy losses, as compared to the same period in 2011. Total rental expenses increased 2.4% for the year ended<br />
December 31, <strong>2012</strong>, compared to 2011, mainly due to higher onsite salaries and wages connected to our increased focus on customer<br />
service. As was noted in the Trust’s disclosure in previous periods, over the past year, the Trust continued to hire additional staff to<br />
assist in various Customer Service, quality control and internal capital projects.<br />
The Trust also continues to track in detail the actual work performed by our onsite Associates to assist in the operating effectiveness<br />
of its overall operations. This additional detail increased the accuracy of the amount allocated to its internal capital improvement<br />
48 / MANAGEMENT’s DISCUSSION and analySIS <strong>Boardwalk</strong> <strong>REIT</strong> / ar <strong>2012</strong>
program. <strong>Boardwalk</strong> continues to be committed to its internal capital program. This program results in overall lower costs while<br />
allowing the Trust greater control over the timing of its capital improvement projects, compared to contracting these same projects<br />
out to third parties. As with other estimates used by the Trust, key assumptions used in estimating the amount of salaries and wages<br />
to be capitalized are reviewed on a regular basis and, based on this review, Management will adjust the amount allocated to more<br />
accurately reflect how much internal resources were directed towards specific capital improvements. The Trust continues to work on<br />
improving the gathering of data in this area to further improve its operating efficiency and make the reported estimate even more<br />
accurate.<br />
Utility costs decreased by 1.0% for the year ended December 31, <strong>2012</strong> due primarily to lower pricing for natural gas, particularly in the<br />
provinces of Alberta, Ontario and Quebec. The reported increase in property taxes is mainly attributed to successful property tax<br />
appeals received on our Alberta portfolio during 2010 that lowered property taxes for 2011 along with reduced rates for some of our<br />
properties in our Ontario portfolio. The Trust is constantly reviewing property tax assessments and related charges and, where it feels<br />
appropriate, will appeal all, or a part, of the related assessment. It is not uncommon for the Trust to receive property tax refunds and<br />
adjustments; however, due to the uncertainty of the amount and timing of the refunds and adjustments, these amounts are only<br />
reported when they are received.<br />
Overall, the operating margin for the year increased slightly to 62.8%, when compared to 62.1% for the same period in 2011.<br />
<strong>Boardwalk</strong> <strong>REIT</strong> closely monitors and individually manages the performance of each of its rental properties. For the reader’s convenience,<br />
we have provided the following summary of our operations on a province-by-province basis.<br />
Segmented Operational Review<br />
British Columbia Rental Operations<br />
In $000’s, except number of suites<br />
12 Months<br />
<strong>2012</strong><br />
12 Months<br />
2011 % Change<br />
Total rental revenue $ 8,272 $ 8,105 2.1%<br />
Expenses<br />
Operating expenses $ 1,491 $ 1,341 11.2%<br />
Utilities $ 778 $ 805 (3.4)%<br />
Property taxes $ 476 $ 423 12.5%<br />
$ 2,745 $ 2,569 6.9%<br />
Net operating income $ 5,527 $ 5,536 (0.2)%<br />
Operating margins 66.8% 68.3%<br />
Number of suites at Dec. 31 633 633<br />
<strong>Boardwalk</strong> <strong>REIT</strong>’s British Columbia portfolio continued to report good, stable results. Total rental revenue increased by 2.1% and<br />
expenses increased by 6.9% for the year ended December 31, <strong>2012</strong>, compared to the prior year. The increase in operating expenses<br />
is largely due to higher repairs and maintenance expenses. Property taxes for the current year were higher due to a property tax<br />
adjustment received in the second quarter of the prior year. Operating margins for the year ended December 31, <strong>2012</strong> decreased to<br />
66.8%, compared to the 68.3% for the same period in 2011.<br />
<strong>Boardwalk</strong> <strong>REIT</strong> / ar <strong>2012</strong><br />
MANAGEMENT’s DISCUSSION and analySIS / 49
Alberta Rental Operations<br />
In $000’s, except number of suites<br />
12 Months<br />
<strong>2012</strong><br />
12 Months<br />
2011 % Change<br />
Total rental revenue $ 263,138 $ 249,534 5.5%<br />
Expenses<br />
Operating expenses $ 50,018 $ 47,683 4.9%<br />
Utilities $ 21,086 $ 21,541 (2.1)%<br />
Property taxes $ 19,735 $ 18,503 6.7%<br />
$ 90,839 $ 87,727 3.5%<br />
Net operating income $ 172,299 $ 161,807 6.5%<br />
Operating margins 65.5% 64.8%<br />
Number of suites at Dec. 31 19,743 19,743<br />
Alberta is <strong>Boardwalk</strong>’s largest operating segment, representing approximately 62.4% of total reported net operating income and<br />
56.0% of total apartment units. <strong>Boardwalk</strong> <strong>REIT</strong>’s Alberta operations for the year ended December 31, <strong>2012</strong>, reported a 5.5% increase in<br />
total rental revenue, when compared to the same period reported in 2011. The reported rental revenue change is the combined effect<br />
of changes to in-place occupied rents and an increase in overall occupancy levels, compared to the prior year. Total rental expenses<br />
have increased 3.5% for the year ended December 31, <strong>2012</strong>, compared to the prior year due to increases in operating expenses and<br />
property taxes. Operating expenses increased 4.9% from the prior year due to an increase in wages and salaries as well as increased<br />
expenses related to internet and cable services offered to the Trust’s Resident Members, offset by bad debt expense. Property taxes<br />
increased 6.7% for the year ended December 31, <strong>2012</strong>, compared to the prior year. In 2011, property taxes were lower, reflecting the<br />
successful 2010 property tax appeals on its Alberta property portfolio.<br />
Reported utilities for the year ended December 31, <strong>2012</strong> were down 2.1%. The reported decrease is mainly the result of lower reported<br />
natural gas expense, tempered somewhat by an increase in water, sewer, and electricity distribution costs.<br />
In 2010, the Trust entered into two contracts, one for 3 years and the other for 5 years, with two utility companies to supply the Trust<br />
with its electrical power needs for Alberta commencing October 1, 2010 and ending September 30, 2013 for the former and September<br />
30, 2015 for the latter. The blended rate of these electricity contracts is $0.06/kWh.<br />
Alberta’s operating margins for the year ended December 31, <strong>2012</strong> increased to 65.5%, compared to the 64.8% for the same period<br />
in 2011.<br />
Saskatchewan Rental Operations<br />
In $000’s, except number of suites<br />
12 Months<br />
<strong>2012</strong><br />
12 Months<br />
2011 % Change<br />
Total rental revenue $ 58,679 $ 56,652 3.6%<br />
Expenses<br />
Operating expenses $ 9,571 $ 9,418 1.6%<br />
Utilities $ 4,914 $ 4,725 4.0%<br />
Property taxes $ 3,978 $ 3,929 1.2%<br />
$ 18,463 $ 18,072 2.2%<br />
Net operating income $ 40,216 $ 38,580 4.2%<br />
Operating margins 68.5% 68.1%<br />
Number of suites at Dec. 31 4,636 4,636<br />
50 / MANAGEMENT’s DISCUSSION and analySIS <strong>Boardwalk</strong> <strong>REIT</strong> / ar <strong>2012</strong>
For year ended December 31, <strong>2012</strong>, <strong>Boardwalk</strong>’s Saskatchewan total rental revenue increased by 3.6%. The revenue increase is mainly<br />
the result of continuing strong rental market fundamentals in both Regina and Saskatoon. Rental expenses increased only slightly by<br />
2.2% for the year ended December 31, <strong>2012</strong>, compared to the prior year.<br />
Utility costs for the current year increased from the previous year due to higher electricity costs as well as higher water and sewer<br />
charges during the current period. The Trust had previously locked into a fixed price natural gas contract for its Saskatchewan natural<br />
gas consumption at a quoted price of $4.81/GJ. This contract expired in October of 2011 and the Trust negotiated a physical supply<br />
contract agreement for Saskatchewan, which covered the period from November 1, 2011 to October 31, <strong>2012</strong>. The supply contract<br />
provided the commodity at a price of $4.17/GJ. This physical supply contract was renewed for a further two-year term, commencing<br />
November 1, <strong>2012</strong>. The new supply contract provides the commodity at a price of $3.74/GJ. More details of this commitment are<br />
reported in Note 26 of the Trust’s consolidated financial statements for the year ended December 31, <strong>2012</strong>.<br />
Reported operating margins for the year ended December 31, <strong>2012</strong>, increased slightly to 68.5% compared to 68.1% reported for the<br />
prior year.<br />
Ontario Rental Operations<br />
In $000’s, except number of suites<br />
12 Months<br />
<strong>2012</strong><br />
12 Months<br />
2011 % Change<br />
Total rental revenue $ 40,090 $ 39,153 2.4%<br />
Expenses<br />
Operating expenses $ 6,926 $ 7,241 (4.4)%<br />
Utilities $ 6,849 $ 6,696 2.3%<br />
Property taxes $ 5,383 $ 5,385 (0.0)%<br />
$ 19,158 $ 19,322 (0.8)%<br />
Net operating income $ 20,932 $ 19,831 5.5%<br />
Operating margins 52.2% 50.7%<br />
Number of suites at Dec. 31 4,265 4,265<br />
<strong>Boardwalk</strong> <strong>REIT</strong>’s Ontario operations reported an increase in total rental revenue of 2.4% for the year ended December 31, <strong>2012</strong>, compared<br />
to the previous year, due to an increase in occupied rents. Total rental expenses decreased marginally by 0.8%, primarily as a<br />
result of decreases in repairs and maintenance and bad debts.<br />
The reported increase in utilities was the result of higher electricity costs and higher water and sewer charges, offset by a decrease in<br />
natural gas expense. For most of 2011, the Trust had two contracts covering 100% of Ontario’s natural gas usage at fixed prices ranging<br />
from $4.07/GJ to $4.11/GJ. In <strong>2012</strong>, the Trust had only one contract covering 50% of Ontario’s natural gas usage at a fixed price of $4.11/<br />
GJ that ended on October 31, <strong>2012</strong>. The balance of Ontario’s natural gas usage was on floating prices, which on average was lower than<br />
the Trust’s fixed price for the commodity. The details of the natural gas contracts are reported in Note 26 of the Trust’s consolidated<br />
financial statements for the year ended December 31, <strong>2012</strong>.<br />
<strong>Boardwalk</strong> <strong>REIT</strong> / ar <strong>2012</strong><br />
MANAGEMENT’s DISCUSSION and analySIS / 51
Quebec Rental Operations<br />
In $000’s, except number of suites<br />
12 Months<br />
2011<br />
12 Months<br />
2011 % Change<br />
Total rental revenue $ 69,567 $ 69,095 0.7%<br />
Expenses<br />
Operating expenses $ 14,744 $ 14,211 3.8%<br />
Utilities $ 5,906 $ 6,247 (5.5)%<br />
Property taxes $ 7,104 $ 6,999 1.5%<br />
$ 27,754 $ 27,457 1.1%<br />
Net operating income $ 41,813 $ 41,638 0.4%<br />
Operating margins 60.1% 60.3%<br />
Number of suites at Dec. 31 6,000 6,000<br />
<strong>Boardwalk</strong> <strong>REIT</strong>’s Quebec operations reported a marginal total rental revenue increase of 0.7% for the year ended December 31, <strong>2012</strong>,<br />
compared to the previous year.<br />
Total rental expenses for the year increased slightly by 1.1% compared to the prior year, mainly due to higher wages and salaries.<br />
The reported 5.5% decrease in utilities was the result of lower utility costs, particularly natural gas expense, in this region. For most<br />
of 2011, the Trust had two contracts covering 100% of Quebec’s natural gas usage at fixed prices ranging from $4.07/GJ to $4.11/GJ. In<br />
<strong>2012</strong>, the Trust had only one contract covering 50% of Quebec’s natural gas usage at a fixed price of $4.11/GJ that ended on October<br />
31, <strong>2012</strong>. The balance of Quebec’s natural gas usage was on floating prices, which on average was lower than the Trust’s fixed price for<br />
the commodity. The details of the natural gas contracts are reported in Note 26 of the Trust’s consolidated financial statements for<br />
the year ended December 31, <strong>2012</strong>.<br />
Property taxes for the year increased 1.5% compared to the prior year due to slightly higher property tax assessments received in <strong>2012</strong>.<br />
Operational Sensitivities<br />
<strong>Boardwalk</strong>’s Revenue Strategy<br />
<strong>Boardwalk</strong>’s rental revenue strategy focuses on optimizing rental revenues through actively managing three main variables: occupancy<br />
levels, market rents, and suite-specific incentives. It is important to note that these variables are in constant flux and may be<br />
different between regions, and between buildings within the same region. The main goal of our strategy is to optimize revenue<br />
throughout the year. In a more competitive market, the Trust locks in rentals on selective suites for future months, but does not<br />
collect revenues for certain months in the immediate future. This means the Trust may decide to rent a suite in December with<br />
the Customer not moving in until the following year. Although the suite is rented, it will not generate revenue until the Customer<br />
actually moves in, for example, in January, which corresponds to the next fiscal period. The percentages reported as occupancy levels<br />
(see table below) represent those occupied units generating revenue for the period noted. The Trust closely monitors ‘apartment<br />
availability’, which represents unoccupied units not generating revenue for the period, after taking into account forward-committed<br />
leases. Although occupancy rates provide a good indication of current revenue, apartment availability provides the reader a more<br />
relevant indication of future potential revenue.<br />
52 / MANAGEMENT’s DISCUSSION and analySIS <strong>Boardwalk</strong> <strong>REIT</strong> / ar <strong>2012</strong>
<strong>Boardwalk</strong> <strong>REIT</strong>’s Portfolio Occupancy<br />
City <strong>2012</strong> 2011<br />
Calgary 99.26% 98.08%<br />
Edmonton 98.06% 96.69%<br />
Fort McMurray 95.64% 95.45%<br />
Grande Prairie 98.00% 95.39%<br />
Kitchener 98.28% 98.78%<br />
London 97.69% 97.85%<br />
Montreal 95.67% 96.25%<br />
Quebec City 97.69% 98.10%<br />
Red Deer 99.20% 98.43%<br />
Regina 98.32% 97.97%<br />
Saskatoon 97.97% 97.14%<br />
Vancouver 98.23% 98.09%<br />
Victoria 97.36% 97.62%<br />
Verdun 99.17% 99.44%<br />
Windsor 97.58% 97.61%<br />
Total 98.19% 97.47%<br />
In fiscal <strong>2012</strong>, the Trust reported an increase in overall occupancy rate to 98.19% from 97.47% for the prior year. <strong>Boardwalk</strong>’s overall<br />
rental revenue strategy focuses on the Trust balancing the key inputs, including occupancy levels and existing rental market rates. As<br />
a strategy, the Trust is constantly adjusting market rents based on property-specific demand and supply.<br />
Supply versus Demand & Impact on Reported Occupancy<br />
Rentals / Move outs<br />
2,000<br />
1,800<br />
1,600<br />
1,400<br />
1,200<br />
1,000<br />
800<br />
600<br />
400<br />
200<br />
0<br />
JAN-08<br />
MAR-08<br />
Rentals Move Outs Occupancy %<br />
MAY-08<br />
JUL-08<br />
SEP-08<br />
NOV-08<br />
JAN-09<br />
MAR-09<br />
MAY-09<br />
JUL-09<br />
SEP-09<br />
NOV-09<br />
JAN-10<br />
MAR-10<br />
MAY-10<br />
JUL-10<br />
SEP-10<br />
NOV-10<br />
JAN-11<br />
MAR11<br />
MAY-11<br />
JUL-11<br />
SEP-11<br />
NOV-11<br />
JAN-12<br />
MAR-12<br />
MAY-12<br />
JUL-12<br />
The issue of demand and supply, as with any industry, is an important performance indicator for multi-family real estate. The above<br />
chart attempts to show the total move-outs (supply) compared to total move-ins (demand) and the resulting impact on reported<br />
occupancy relating to our portfolio. The cumulative impact of demand being greater than supply, or vice versa, is the primary driver<br />
in the reported occupancy rate. Because of limited pricing power in the multi-family rental market in recent years, <strong>Boardwalk</strong> continued<br />
with its strategy of maintaining high occupancy levels by cautiously adjusting market rents upward only when warranted. This<br />
strategy continues to be viewed as a success; as a result, we have been able to increase the overall occupancy rate to 98.19% for the<br />
year ended <strong>2012</strong>, compared to the year ended 2011 when the occupancy rate was 97.47%. <strong>Boardwalk</strong> <strong>REIT</strong> will continue with this strategy;<br />
however, the Trust is now in the position where we may see some further upward rental adjustments in certain selective markets.<br />
The reader is cautioned that adjusting market rental rates is an ongoing process for the Trust and is consistent with its overall strategy<br />
of optimizing overall reported revenues; consequently, it will adjust rents upward or downward when it is deemed necessary.<br />
SEP-12<br />
NOV-12<br />
100%<br />
99.0%<br />
98.0%<br />
97.0%<br />
96.0%<br />
95.0%<br />
94.0%<br />
93.0%<br />
<strong>Boardwalk</strong> <strong>REIT</strong> / ar <strong>2012</strong><br />
MANAGEMENT’s DISCUSSION and analySIS / 53
Vacancy Loss and Incentives<br />
$8,000<br />
$7,000<br />
$6,000<br />
Vacancy Loss<br />
Incentives<br />
Total<br />
$5,000<br />
$000's<br />
$4,000<br />
$3,000<br />
$2,000<br />
$1,000<br />
$-<br />
Q1<br />
2009<br />
Q2<br />
2009<br />
Q3<br />
2009<br />
Q4<br />
2009<br />
Q1<br />
2010<br />
Q2<br />
2010<br />
Q3<br />
2010<br />
Q4<br />
2010<br />
Q1<br />
2011<br />
Q2<br />
2011<br />
Q3<br />
2011<br />
Q4<br />
2011<br />
Q1<br />
<strong>2012</strong><br />
Q2<br />
<strong>2012</strong><br />
Q3<br />
<strong>2012</strong><br />
Q4<br />
<strong>2012</strong><br />
Vacancy loss and rental incentives are strong indicators of current and future revenue performance. Depending on specific market<br />
conditions, to best manage overall economic rental revenue, the correct balance between rental incentives and vacancy loss is<br />
important. On a quarterly basis, the chart details rental incentives versus vacancy loss. The reported decrease in vacancy loss (by<br />
increasing occupancy levels), coupled with a decrease in incentives during both 2011 and <strong>2012</strong>, was mainly the result of <strong>Boardwalk</strong><br />
<strong>REIT</strong>’s continued strategy of optimizing overall revenues through the management of the key revenue variables, notably, market<br />
rents, occupancy levels, and suite-selective incentives, which are all positive signs of strength returning to the market. We continue<br />
to focus on maximizing overall revenues through the optimization of these key revenue variables.<br />
Occupancy Sensitivity<br />
As with all real estate rental operators, <strong>Boardwalk</strong> <strong>REIT</strong>’s financial performance is sensitive to occupancy rates. Based on the current<br />
reported market rents, a 1% <strong>annual</strong>ized change in reported occupancy is estimated to impact overall rental revenue by approximately<br />
$4.6 million, or $0.09 per Trust Unit on a diluted basis.<br />
Stabilized Property Results<br />
<strong>Boardwalk</strong> defines stabilized property as one that has been owned by the Trust for a period of 24 months or more from the reporting<br />
date. <strong>Boardwalk</strong> <strong>REIT</strong>’s overall percentage of stabilized properties was 100% of its total rental unit portfolio as at December 31, <strong>2012</strong>,<br />
or a total of 35,277 units. The table below provides a regional breakdown on these properties for fiscal <strong>2012</strong>, as compared to fiscal 2011.<br />
Dec 31 <strong>2012</strong> – 12 M<br />
# of Units<br />
% Revenue<br />
Growth<br />
% Operating<br />
Expense Growth<br />
% Net Operating<br />
Income Growth<br />
% of NOI<br />
Calgary 5,310 6.5% 4.8% 7.2% 18.6%<br />
Edmonton 12,497 4.9% 3.2% 5.9% 37.2%<br />
Fort McMurray 352 0.9% -2.5% 2.3% 2.0%<br />
Grande Prairie 645 9.7% -3.7% 21.0% 1.5%<br />
Red Deer 939 7.4% 10.6% 5.2% 2.1%<br />
British Columbia 633 2.1% 6.9% -0.2% 1.9%<br />
Ontario 4,265 2.4% -0.8% 5.5% 7.5%<br />
Quebec 6,000 0.7% 1.1% 0.4% 14.9%<br />
Saskatchewan 4,636 3.6% 2.2% 4.2% 14.3%<br />
35,277 4.1% 2.5% 5.0% 100.0%<br />
54 / MANAGEMENT’s DISCUSSION and analySIS <strong>Boardwalk</strong> <strong>REIT</strong> / ar <strong>2012</strong>
Stabilized revenue increased by 4.1% for the year ended December 31, <strong>2012</strong>, compared to the prior year. Operating expenses reported<br />
for the year increased by 2.5% from 2011, resulting in a NOI increase of 5.0% compared to the prior year. The increase in reported<br />
stabilized revenue was driven by an increase in occupancy levels and higher in-place occupied rents, particularly in Alberta, which<br />
accounts for approximately 61.4% of the Trust’s reported stabilized Net Operating Income.<br />
Stabilized Revenue Growth<br />
# of Units<br />
Q4 <strong>2012</strong> vs.<br />
Q3 <strong>2012</strong><br />
Q4 <strong>2012</strong> vs.<br />
Q2 <strong>2012</strong><br />
Q4 <strong>2012</strong> vs.<br />
Q1 <strong>2012</strong><br />
Q4 <strong>2012</strong> vs.<br />
Q4 2011<br />
Calgary 5,310 1.7% 3.2% 4.6% 6.7%<br />
Edmonton 12,497 1.5% 3.4% 5.3% 6.0%<br />
Fort McMurray 352 (0.7)% (1.0)% 0.7% 2.2%<br />
Grande Prairie 645 3.4% 7.5% 8.7% 10.3%<br />
Red Deer 939 1.1% 3.2% 6.7% 8.3%<br />
British Columbia 633 0.4% 1.3% 0.7% 1.2%<br />
Ontario 4,265 1.6% 1.9% 2.4% 3.0%<br />
Quebec 6,000 (0.2)% 0.2% 0.0% 0.0%<br />
Saskatchewan 4,636 1.5% 2.5% 4.0% 4.7%<br />
35,277 1.3% 2.5% 3.8% 4.6%<br />
The reader is cautioned that, due to seasonality and the timing of these related expenses, a better gauge of the performance of the<br />
stabilized properties is on a yearly basis. On a sequential basis, stabilized revenues reported in the fourth quarter of <strong>2012</strong> increased<br />
slightly by 1.3% over Q3 <strong>2012</strong>, increased by 2.5% compared to Q2 <strong>2012</strong>, increased 3.8% compared to Q1 <strong>2012</strong> and increased by 4.6% compared<br />
to Q4 2011. The Trust strives toward balancing the optimum level of rental incentives and occupancy rates in order to achieve<br />
its revenue strategy while controlling operating expenses at the same time.<br />
Estimated Loss-to-Lease Calculation<br />
<strong>Boardwalk</strong> <strong>REIT</strong>’s estimated loss-to-lease, representing the difference between estimated market rents and actual occupied rents<br />
in December <strong>2012</strong>, adjusted for current occupancy levels, totaled approximately $10.0 million on an <strong>annual</strong>ized basis, representing<br />
$0.19 per outstanding Unit (Trust & LP B Units). For the most part, <strong>Boardwalk</strong> <strong>REIT</strong>’s rental lease agreements last no longer than twelve<br />
months. On physical turnover, the rental units are then re-leased directly at current market rent. If market rents are increasing and a<br />
<strong>Boardwalk</strong> Resident Member wishes to renew and is able to demonstrate<br />
real financial hardship at the end of the lease agreement, the Trust’s<br />
Incentives & Vacancy Loss<br />
self-imposed rent control and Rental Increase Forgiveness program<br />
Q4 <strong>2012</strong><br />
Q4 2011<br />
Total Market Rent Total Market Rent<br />
will reduce rental increases as appropriate, recognizing the long term<br />
$110.9M<br />
$107.3M<br />
benefits of such goodwill. By providing sustainable rental increases to $2,500<br />
our Resident Members, the Trust and all its Stakeholders have historically<br />
$2,186<br />
benefited from lower turnover, reduced expenses, and higher occupancy.<br />
$2,000<br />
The reader should note estimated loss-to-lease, measured at a point<br />
$1,639<br />
$1,500<br />
in time, is a non-GAAP measure, and that reported market rents can be<br />
$1,491<br />
very seasonal, and, as such, will vary from quarter to quarter. The significance<br />
$1,000<br />
of this change could materially affect <strong>Boardwalk</strong> <strong>REIT</strong>’s “estimated<br />
$716<br />
loss-to-lease” amount. The importance of this estimate, however, is that<br />
$500<br />
it can be an indicator of future rental performance, assuming continuing<br />
economic conditions and trends. The reader should also note that it<br />
$900<br />
would take significant time for these market rents to be recognized by<br />
Q4 <strong>2012</strong><br />
Q4 2011<br />
the Trust due to internal and external limitations on its ability to charge<br />
these new market-based rents in the short term.<br />
Incentives Vacancy Loss<br />
<strong>Boardwalk</strong> <strong>REIT</strong> / ar <strong>2012</strong><br />
MANAGEMENT’s DISCUSSION and analySIS / 55
Dec <strong>2012</strong><br />
Occupied Rent*<br />
Dec <strong>2012</strong><br />
Market Rent*<br />
Mark to Market<br />
Per Month<br />
Annualized<br />
Mark to Market<br />
Adjusted for<br />
Current<br />
Occupancy levels<br />
($000’s)<br />
Weighted<br />
Average<br />
Apartment Units<br />
% of<br />
Portfolio<br />
Calgary $1,227 $1,300 $73 $4,687 5,310 15%<br />
Edmonton $1,142 $1,166 $24 $3,565 12,497 35%<br />
Fort McMurray $1,874 $1,935 $61 $256 352 1%<br />
Grande Prairie $965 $979 $14 $99 645 2%<br />
Red Deer $921 $941 $20 $227 939 3%<br />
Alberta Portfolio $1,162 $1,199 $37 $8,834 19,743 56%<br />
Saskatchewan $1,094 $1,106 $12 $664 4,636 13%<br />
Ontario $815 $815 $0 $0 4,265 12%<br />
Quebec $1,000 $1,003 $3 $160 6,000 17%<br />
British Columbia $1,031 $1,080 $49 $372 633 2%<br />
Total Portfolio $1,081 $1,105 $24 $10,030 35,277 100%<br />
* Ancillary rental revenue is included in the calculation of market and occupied rent<br />
The amount reports as mark to market of $24 represents 2.2% an amount which is reasonably attainable at lease maturity. The increase<br />
in the loss-to-lease for our portfolio, from $8.4 million at December 2011 to $10.0 million at December <strong>2012</strong>, was due primarily to the<br />
increase in market rents, particularly in Calgary and Edmonton, thus increasing the spread between occupied and market rents.<br />
The Trust previously adopted a focused strategy of reducing market rent prices in an attempt to increase overall occupancy, with the<br />
main focus on increasing overall rental revenue. In recent months, the Trust was able to increase market rents on specific properties<br />
by reducing incentives while maintaining, and in some cases increasing, occupancy levels. As with prior periods, <strong>Boardwalk</strong> <strong>REIT</strong> continues<br />
to focus on the optimization of all rental revenue, with attention to appropriate levels of market rents and certain occupancy<br />
level targets, as well as suite-selective incentives, when warranted.<br />
As was previously mentioned, the opportunity still exists to focus on reducing vacancy loss in the short term while minimizing the<br />
amount of suite-specific incentives. However, in recent months, <strong>Boardwalk</strong> has also been able to increase market rents in certain<br />
selective markets and on certain specific properties while maintaining occupancy levels.<br />
Investing In Our Properties<br />
<strong>Boardwalk</strong> is continually re-investing in its properties. A detailed analysis of this investment can be found later in the MD&A under<br />
the section titled, “Capital Improvements”. The purpose of the "Capital Improvements" section is to provide the reader with a consolidated<br />
view of what the Trust spent on its real estate asset base.<br />
Financing Costs<br />
Financing costs for the year ended December 31, <strong>2012</strong> decreased from the same period in the prior year, from $105.6 million to $98.1<br />
million, the combined effect of the Trust being able to renew maturing mortgages at interest rates substantially below the noted<br />
maturing rates and the retirement of its unsecured debenture. In January of <strong>2012</strong>, the Trust retired its publicly traded unsecured<br />
debenture, which carried an in-place interest rate of 5.61%. At December 31, <strong>2012</strong>, the reported weighted average interest rate of 3.69%<br />
was down from the weighted average interest rate of 4.14% at December 31, 2011. <strong>Boardwalk</strong> <strong>REIT</strong> has continued to take advantage<br />
of lower interest rates to refinance and renew certain mortgages, resulting in a lower overall weighted average interest rate. The<br />
average term to maturity of the Trust’s mortgage portfolio is approximately 3.8 years. This average term is expected to increase in<br />
56 / MANAGEMENT’s DISCUSSION and analySIS <strong>Boardwalk</strong> <strong>REIT</strong> / ar <strong>2012</strong>
subsequent periods as the Trust continues to renew maturing mortgages for significantly longer terms, ranging from 5 to 10 years<br />
with a heavier emphasis in the longer end of this range.<br />
<strong>Boardwalk</strong> <strong>REIT</strong> concentrates on multi-family residential real estate. It is therefore eligible to obtain government-backed insurance<br />
through the NHA program, administered by CMHC. The benefits of purchasing this insurance are two-fold.<br />
The first benefit of using CMHC insurance is <strong>Boardwalk</strong> <strong>REIT</strong> can normally obtain lower interest rate spreads on its property financing<br />
as compared to other financing alternatives in either the residential or any other real estate class, leading to lower overall cost of debt,<br />
after including the cost of the NHA insurance.<br />
The second benefit of the CMHC insurance relates to lowering <strong>Boardwalk</strong> <strong>REIT</strong>’s overall renewal risk. Once insurance is obtained<br />
on the related mortgage, the insurance is transferable and follows the mortgage for the complete amortization period, typically<br />
between 25 and 40 years, depending on the type of asset being insured. With the insurance being transferable between approved<br />
lenders, it lowers the overall risk of <strong>Boardwalk</strong> <strong>REIT</strong> not being able to refinance the asset on maturity.<br />
Management cannot over-emphasize the importance of this Government-backed mortgage insurance program administered by<br />
Canada Mortgage and Housing Corporation. Despite past volatility in the overall credit markets, the Trust has been able to find a<br />
number of mortgage lenders willing to assume, or underwrite, additional mortgages under this program.<br />
At December 31, <strong>2012</strong>, approximately 99% of <strong>Boardwalk</strong> <strong>REIT</strong>’s mortgages were backed by this NHA insurance, with a weighted average<br />
amortization period of approximately 31 years.<br />
As was previously noted, the adoption of IFRS has also had an impact on the amount of financing costs reported on the Trust's<br />
Consolidated Statement of Comprehensive Income. As a result of the Trust's LP Class B Units being classified as financial liabilities<br />
in accordance with IAS 32, the corresponding distributions paid to the Unitholders are classified as financing costs under IFRS. The<br />
Trust believes these distribution payments do not truly represent "financing charges" as these amounts are only payable if the Trust<br />
declares distributions, and only for the amount of any distributions declared, both of which are at the discretion of the Board of<br />
Trustees as outlined in the DOT. The total amount of distributions paid to the LP Class B Unitholders for the year ended December 31,<br />
<strong>2012</strong>, which have been recorded as financing charges, was $8.4 million ($8.1 million – December 31, 2011). Based on this rational, these<br />
amounts have been added back in the calculation of FFO.<br />
The reader should also note that under IFRS, financing charges are recorded net of interest income the Trust has earned for the year.<br />
The total amount of interest income earned for the current year was $2.1 million, compared to $2.7 million in the prior year.<br />
Interest Rate Sensitivity<br />
Although <strong>Boardwalk</strong> <strong>REIT</strong> manages its financing risk in a variety of ways, as discussed later in the MD&A, it is important the reader<br />
understands how significant interest rate changes could impact the Trust as a whole. Due to the size of <strong>Boardwalk</strong>’s overall mortgage<br />
portfolio, it has been prudent to spread out the maturity of these mortgages over a number of years. In fiscal 2013, the Trust anticipates<br />
having approximately $287.7 million of secured mortgages maturing with a weighted average rate of 4.45%. If we were to renew<br />
these mortgages today with a new 5-year term, we estimate, based upon interactions with possible lenders, the new rate would be<br />
approximately 2.30% (as of February 13, 2013), resulting in an estimated $6.2 million potential <strong>annual</strong>ized reduction in interest expense<br />
in our soon-to-mature mortgages.<br />
<strong>Boardwalk</strong> <strong>REIT</strong> / ar <strong>2012</strong><br />
MANAGEMENT’s DISCUSSION and analySIS / 57
Administration<br />
Included in administration expenses are costs associated with <strong>Boardwalk</strong> <strong>REIT</strong>’s centralized administrative functions. The amount<br />
reported for the year ended December 31, <strong>2012</strong>, which relates to corporate administration, was $28.9 million, compared to $26.3<br />
million for the same period in the prior year, an increase of approximately 9.9%.<br />
For the year ended December 31, <strong>2012</strong> and prior comparative periods, <strong>Boardwalk</strong> <strong>REIT</strong> allocated certain administration costs between<br />
corporate and rental operating expenses. The administration costs allocated to rental operating expenses consist primarily of specific<br />
amounts associated with operation-specific staff and related support initiatives. Total administration costs, combining rental operating<br />
and corporate, were $52.3 million for the year ended December 31, <strong>2012</strong>, compared to $49.1 million for the same period in the prior<br />
year. The increase in total administration costs of approximately $3.2 million was primarily the result of higher wages and salaries, as<br />
well as an increase in profit sharing and bonus accruals recorded. The higher amount of profit sharing and bonus accruals recorded<br />
in the current year is consistent with <strong>Boardwalk</strong>’s better-than-expected operating results. The allocation of administration expenses<br />
between corporate and operating general and administration costs, noted above, have not been materially impacted by the Trust's<br />
adoption of IFRS standards.<br />
Depreciation and Amortization<br />
Depreciation and amortization recorded on the Consolidated Statements of Comprehensive Income is made up of the depreciation<br />
of property, plant and equipment, and the amortization of deferred financing costs.<br />
Depreciation of property, plant and equipment<br />
The Trust has elected to use the cost model under IAS 16 - Property, Plant and Equipment ("IAS 16") to value its property, plant and<br />
equipment, and, as a result of this method, depreciation expense is a charge taken against earnings to reflect the estimated depreciation<br />
that has occurred to these assets as a result of their use during the reporting period in question.<br />
Amortization of Deferred Financing Costs<br />
The amortization of deferred financing costs relates primarily to the amortization of CMHC premiums, which are paid as part of<br />
mortgage financing. If <strong>Boardwalk</strong> <strong>REIT</strong> replaces an existing mortgage with a new mortgage, all costs associated with the original<br />
mortgage, including the unamortized balance of the CMHC premium, are required to be charged to income in the period that this<br />
occurs. As a result, and due to the variable timing and strategy of each mortgage at maturity, the amounts reported will vary. Rather<br />
than refinance the entire mortgage on term maturity to a higher amount, <strong>Boardwalk</strong> <strong>REIT</strong> continues to take advantage of supplementing,<br />
rather than extinguishing, the original mortgage to increase its leverage.<br />
For the year ended December 31, <strong>2012</strong>, approximately $49 thousand of deferred financing costs were written off due to the term<br />
maturity and payout of mortgages in <strong>Boardwalk</strong>’s secured debt portfolio.<br />
<strong>Boardwalk</strong> reviews its key depreciation and amortization estimates on an ongoing basis and, if warranted, will adjust these estimates<br />
on a prospective basis.<br />
The total amount reported as depreciation and amortization for the year ended December 31, <strong>2012</strong>, was $10.9 million, which was<br />
consistent with the $10.5 million recorded for the same period in the prior year.<br />
58 / MANAGEMENT’s DISCUSSION and analySIS <strong>Boardwalk</strong> <strong>REIT</strong> / ar <strong>2012</strong>
Other Income and Expenses<br />
Income Tax Expense<br />
<strong>Boardwalk</strong> <strong>REIT</strong> qualifies as a 'mutual fund trust' as defined in the Income Tax Act (Canada) (the “Tax Act”). The Tax Act also contains<br />
legislation affecting the tax treatment of publicly traded trusts (the “SIFT Legislation”). In fiscal 2011 and <strong>2012</strong>, the Trust qualified as<br />
a real estate investment trust ("<strong>REIT</strong>") and was, therefore, exempted from taxation under the SIFT Legislation. However, based on a<br />
detailed review of the SIFT Legislation, it could be interpreted that the Trust would not meet the criteria for the <strong>REIT</strong> exemption in<br />
accordance with the definition contained in the legislation prior to January 1, 2011. As such, the Trust reversed the estimate of its future<br />
income tax liability set up previously on January 1, 2011. The deferred tax liability related to the SIFT Legislation was approximately<br />
$740.4 million under IFRS as at December 31, 2010.<br />
On December 16, 2010, the Department of Finance announced proposed amendments to the real estate investment trust exemption<br />
rule and, on October 24, <strong>2012</strong>, released legislation to implement such amendments. These notable amendments follow:<br />
▲<br />
▲<br />
▲<br />
▲<br />
▲<br />
▲<br />
▲<br />
Allow <strong>REIT</strong> subsidiaries to hold certain non-capital property in respect of their real estate investment activities;<br />
Allow <strong>REIT</strong>s to hold up to 10% of their non-portfolio property as non-qualifying <strong>REIT</strong> property without losing <strong>REIT</strong> status (with an<br />
associated clarification of the circumstances under which property can be considered to be ancillary <strong>REIT</strong> property);<br />
Allow <strong>REIT</strong>s to derive up to 10% of their revenues from sources that are not qualifying sources;<br />
Clarify that a trust’s revenue for purposes of the two revenue tests in the definition “real estate investment trust” is to be computed<br />
on a gross, rather than net, basis and that it will include capital gains but will not include recapture or other amounts that<br />
are on account of capital;<br />
Allow <strong>REIT</strong>s to earn, as qualifying <strong>REIT</strong> revenue, gains realized by virtue of foreign currency fluctuations in respect of revenues<br />
derived from foreign real or immovable property including certain financing and hedging arrangements in respect of such<br />
property;<br />
Ensure that amounts distributed to a <strong>REIT</strong>, by an entity in which the <strong>REIT</strong> has a significant interest, will retain their character for<br />
purposes of the revenue tests; and,<br />
Allow an entity to hold investments in a <strong>REIT</strong> without those investments being treated as Canadian real, immovable, or resource<br />
property in determining whether the entity itself is a SIFT.<br />
Once the legislation Is passed by the Canadian government, the Trust will be able, if it wishes, to continue its strategy of selling Non-<br />
Core assets without the risk of losing its <strong>REIT</strong> Exemption status.<br />
LP Class B Units and the Deferred Unit Compensation Plan<br />
The LP Class B Units are non-transferable, except under certain circumstances, but are exchangeable, on a one-for-one basis, into<br />
<strong>Boardwalk</strong> <strong>REIT</strong> Units at any time at the option of the holder. The LP Class B Units and the deferred unit-based compensation plan are<br />
classified as financial liabilities in accordance with IFRS standards, and, as a result, are recorded at their fair value at each reporting<br />
date. As at December 31, <strong>2012</strong>, the Trust used a closing price of $64.53 based on the closing price of the TSX-listed <strong>Boardwalk</strong> <strong>REIT</strong><br />
Trust Units to determine the fair value of these financial liabilities at that date. The total fair value of these units recorded on the<br />
Consolidated Statements of Financial Position at December 31, <strong>2012</strong>, was $288.8 million, and a corresponding fair value loss of $63.1<br />
million (year ended December 31, 2011 – $41.1 million) was recorded on the Consolidated Statements of Comprehensive Income for<br />
the year ended December 31, <strong>2012</strong>.<br />
The deferred unit-based compensation plan had a fair value of $9.1 million, and a corresponding fair value loss of $3.4 million (year<br />
ended December 31, 2011 – $0.9 million) was recorded on the Consolidated Statements of Comprehensive Income for the year ended<br />
December 31, <strong>2012</strong>.<br />
<strong>Boardwalk</strong> <strong>REIT</strong> / ar <strong>2012</strong><br />
MANAGEMENT’s DISCUSSION and analySIS / 59
Financial Condition<br />
Review of Consolidated Statements of Cash Flows<br />
Operating Activities<br />
Cash Flow from Operations<br />
<strong>Boardwalk</strong> <strong>REIT</strong> prepares its financial statements in accordance with the recommendations of the Real Property Association of Canada<br />
("REALpac") and the Canadian Institute of Chartered Accountants (“CICA”). REALpac has adopted a measurement called Funds From<br />
Operations (“FFO”) to supplement profits or earnings as a measure of operating performance. This is considered to be a meaningful<br />
and useful measure of real estate operating performance. <strong>Boardwalk</strong> <strong>REIT</strong>’s presentation of FFO is materially consistent with the definition<br />
provided by REALpac. This measurement is not necessarily indicative of cash that is available to fund cash needs and should<br />
not be considered an alternative to cash flow as a measure of liquidity. FFO does not represent cash flow from operations as defined<br />
by IFRS. <strong>Boardwalk</strong> <strong>REIT</strong> considers FFO to be an appropriate measure of the performance of a publicly listed multi-family residential<br />
entity. In order to facilitate a clear understanding of the combined historical operating results of <strong>Boardwalk</strong> <strong>REIT</strong>, management feels<br />
FFO should be considered in conjunction with profit as presented in the audited consolidated financial statements. <strong>Boardwalk</strong> <strong>REIT</strong>'s<br />
computation of FFO is highlighted above in the section titled, "FFO Reconciliations".<br />
The reader is cautioned that <strong>Boardwalk</strong> <strong>REIT</strong>’s calculation of FFO may be different from other real estate corporations or <strong>REIT</strong>s and, as<br />
such, a straight comparison may not be warranted. For the fiscal year ended December 31, <strong>2012</strong>, <strong>Boardwalk</strong> <strong>REIT</strong> reported total FFO of<br />
$150.3 million, or $2.87 per fully diluted Trust Unit. This represented an increase of approximately 14.1% and 14.0%, respectively, compared<br />
to the $131.8 million, or $2.52 per fully diluted Trust Unit, reported for fiscal 2011. The increase is primarily due to rental revenue<br />
growth and interest expense savings.<br />
Financing Activities<br />
Distributions<br />
<strong>Boardwalk</strong> distributes payments on a monthly basis to its Unitholders. These payments are referred to as distributions. The distinct<br />
nature and classification of these payments are unique to each trust and the components of these distributions may have differing<br />
tax treatments. For fiscal <strong>2012</strong>, the Trust declared regular distributions of $98.3 million to its Unitholders compared to $94.0 million<br />
for fiscal 2011.<br />
Financing of Revenue Producing Properties<br />
During the year ended December 31, <strong>2012</strong>, the refinancing of existing properties totaled approximately $73.9 million versus $109.9<br />
million for the year ended December 31, 2011. During the financing and refinancing process, <strong>Boardwalk</strong> <strong>REIT</strong> was able to decrease the<br />
weighted average interest rate on its mortgage and debt portfolio from 4.14% at December 31, 2011 to 3.69% at December 31, <strong>2012</strong>.<br />
Acquisitions<br />
There were no new property acquisitions in <strong>2012</strong> and 2011.<br />
Due to the nature of multi-family residential real estate, the amount paid for apartment units may vary dramatically based on a number<br />
of parameters, including location, type of ownership (that is, free hold versus land lease) and type of construction. As required under<br />
IFRS, on acquisition, an analysis is performed on the mortgage debt assumed. The analysis focuses on the interest rates of the debt<br />
assumed. If it is determined that the in-place rates are materially below or above market rates, an adjustment is made to the book<br />
cost of the recorded asset. No mortgages were assumed in <strong>2012</strong> and 2011. Therefore, the adjustment for fiscal <strong>2012</strong> and 2011 was nil.<br />
60 / MANAGEMENT’s DISCUSSION and analySIS <strong>Boardwalk</strong> <strong>REIT</strong> / ar <strong>2012</strong>
Capital Improvements<br />
<strong>Boardwalk</strong> has a continuous internal capital program with respect to its investment properties. The program is designed to extend<br />
their useful lives and meet tenant expectations, as well as meet health and safety regulations.<br />
In <strong>2012</strong>, <strong>Boardwalk</strong> <strong>REIT</strong> invested approximately $89.3 million (comprised of $83.1 million on its investment properties and $6.2 million<br />
on property, plant and equipment) back into its properties in the form of equipment and project enhancements to upgrade existing<br />
suites, common areas, building exteriors, and systems, compared to the $73.7 million ($69.3 million on its investment properties and<br />
$4.5 million property, plant and equipment) invested in 2011. The amount of this investment will vary from year-to-year.<br />
A significant part of <strong>Boardwalk</strong>'s capital improvement program relates to projects that are carried out by <strong>Boardwalk</strong>'s Associates. This<br />
internal capital program was initiated in 1996 as a way to create more value for the Trust. The Trust recognizes that there are certain<br />
efficiencies and economies of scale available from having <strong>Boardwalk</strong> Associates performing certain capital projects ourselves, or<br />
"in-house". This results in the faster execution and greater control of these projects while at the same time eliminating the profit<br />
charged by third-party contractors. The Trust focuses on specific projects where there is the largest opportunity for value creation,<br />
like flooring and painting. Over the last few years, the Trust has intensified this focus of performing capital projects "in-house" rather<br />
than contracting such services. Included in capital improvements is approximately $19.4 million of on-site wages and salaries that<br />
have been incurred towards these projects for <strong>2012</strong>, compared to $19.8 million for 2011.<br />
Maintenance of Productive Capacity<br />
The Trust has two separate areas in which capital is invested back into its residential buildings. These are referred to as ‘maintenance<br />
capital expenditures’ and ‘stabilizing and value enhancing capital expenditures’.<br />
Maintenance capital expenditures are funded from operating cash flows. These expenditures are deducted from FFO in order to<br />
estimate a sustainable amount (AFFO) that can be distributed to Unitholders. Maintenance capital expenditures include those<br />
expenditures that are not considered betterments, and relate more to maintaining the existing earnings capacity of our property<br />
portfolio. In contrast, stabilizing and value enhancing capital expenditures are more discretionary in nature and focus on increasing<br />
the productivity of the property, with the goal of increasing the FFO generated at that location. In addition, the Trust invests funds in<br />
its portfolio in the form of ongoing repairs and maintenance as well as on-site maintenance Associates. Both of these expenditures<br />
are designed to maintain the operating capacity of our assets.<br />
The following table provides management’s estimate of these expenditure categories.<br />
in $000’s, except for per suite amounts<br />
12 Months<br />
Dec 31, <strong>2012</strong><br />
Per<br />
Suite<br />
12 Months<br />
Dec 31, 2011<br />
Per<br />
Suite<br />
Maintenance Capital Expenditures $ 15,875 $ 450 $ 15,875 $ 450<br />
Stabilizing & Value Enhancing Capital $ 67,245 $ 1,906 $ 53,390 $ 1,513<br />
$ 83,120 $ 2,356 $ 69,265 $ 1,963<br />
Items reported as capital are determined as investments in assets that have a useful life longer than the current reporting period.<br />
Management has estimated that for both fiscals <strong>2012</strong> and 2011, the amount allocated to maintenance capital was approximately<br />
$15.9 million, or $450 per apartment unit, with investment in value-enhancing expenditures totaling $67.2 million and $53.4 million,<br />
respectively, or $1,906 and $1,513 per apartment unit.<br />
As highlighted in our 2013 financial outlook later in this report, Management is estimating the amount allocated to maintenance<br />
capital to increase to approximately $16.8 million, or $475 per apartment unit. The increase from $450 to $475 per apartment unit is<br />
primarily driven by expected price inflation for 2013.<br />
<strong>Boardwalk</strong> <strong>REIT</strong> / ar <strong>2012</strong><br />
MANAGEMENT’s DISCUSSION and analySIS / 61
If we compare the funds generated by the Trust after adjusting for the required maintenance capital expenditures, we note the Trust<br />
is currently paying out an estimated 65.4% of reported FFO and 73.1% of AFFO for the year ended December 31, <strong>2012</strong>, compared to<br />
71.3% and 81.1%, respectively, for the previous year.<br />
(000’s)<br />
12 months<br />
Dec 31, <strong>2012</strong><br />
12 months<br />
Dec 31, 2011<br />
Funds From Operations (FFO) $ 150,343 $ 131,808<br />
Maintenance Capital Expenditures $ 15,875 $ 15,875<br />
Adjusted Funds From Operations (AFFO) $ 134,468 $ 115,933<br />
AFFO per unit (Trust and LP B Units) $ 2.57 $ 2.22<br />
Unitholder Distributions-Regular (Trust Units and LP B Units) $ 98,312 $ 94,008<br />
Distribution as a % of FFO 65.4% 71.3%<br />
Distribution as a % of AFFO 73.1% 81.1%<br />
Maintenance capital expenditures for our income-producing properties are dependent upon many factors, including, but not limited<br />
to, the number of suites, age and location of our properties, and the Trust’s policy of ongoing investment, resulting in safe and<br />
desirable apartments for its Resident Members and Associates.<br />
Review of Consolidated Statements of Financial Position<br />
Investment Properties<br />
As a result of the Trust’s adoption of IFRS and its election to use the fair value model in accordance with IAS 40, Investment Properties<br />
are carried at their fair value at the reporting date.<br />
External valuations were obtained from third-party appraisers (the “Appraisers”) based on a cross section of properties from different<br />
geographical locations and markets across the Trust’s rental portfolio, as determined by management, to corroborate the Trust’s<br />
internal fair value calculation for its entire investment property portfolio. External appraisals were obtained as follow:<br />
Date<br />
Number of<br />
properties<br />
Aggregate<br />
fair value<br />
Percentage of<br />
portfolio as of<br />
that date<br />
December 31, <strong>2012</strong> 7 $663,136 12.0%<br />
September 30, <strong>2012</strong> 6 181,850 3.3%<br />
June 30, <strong>2012</strong> 6 205,278 4.0%<br />
March 31, <strong>2012</strong> 7 375,083 7.5%<br />
The fair value of the Trust’s investment property portfolio was determined internally by the Trust using the same assumptions and<br />
valuation techniques used by the external valuation professionals. In addition to performing a valuation on a selection of Trust’s<br />
properties (and not performing a valuation on all of the Trust properties) to compare to the Trust’s internal valuation, the Appraisers<br />
provided the Trust with a summary of the major assumptions and market data by city in order for the Trust to complete its internal<br />
valuations.<br />
62 / MANAGEMENT’s DISCUSSION and analySIS <strong>Boardwalk</strong> <strong>REIT</strong> / ar <strong>2012</strong>
The key valuation metrics for the Trust’s investment properties are set out in the following tables:<br />
As at December 31, <strong>2012</strong> December 31, 2011<br />
Capitalization rate by city: Minimum Maximum Minimum Maximum<br />
Calgary 4.75% 5.50% 5.25% 6.00%<br />
Edmonton 5.00% 5.50% 5.50% 6.00%<br />
Other Alberta 5.75% 7.25% 6.00% 7.75%<br />
Vancouver 4.75% 6.25% 5.00% 6.50%<br />
Kitchener 5.75% 5.75% 6.00% 6.00%<br />
London 5.75% 6.00% 6.00% 6.25%<br />
Windsor 6.50% 7.00% 6.75% 7.25%<br />
Montreal 5.50% 6.25% 5.75% 6.75%<br />
Quebec City 5.75% 6.25% 5.75% 6.25%<br />
Regina 5.75% 6.00% 6.25% 6.50%<br />
Saskatoon 5.75% 6.00% 6.25% 6.50%<br />
4.75% 7.25% 5.00% 7.75%<br />
Land Lease 5.25% 12.69% 5.50% 11.50%<br />
Overall portfolio weighted average capitalization rates were 5.47% and 5.91% as at December 31, <strong>2012</strong>, and December 31, 2011,<br />
respectively.<br />
The “Overall Capitalization Rate” method requires a forecasted net operating income (“NOI”) be divided by a capitalization rate<br />
(“cap rate”) to determine a fair value. As such, fluctuations in both NOI and cap rates could significantly alter the fair value. Below<br />
summarizes the sensitivity impact of changes in both cap rates and NOI on the Trust’s fair value of its investment properties as at<br />
December 31, <strong>2012</strong>:<br />
As at December 31, <strong>2012</strong> (in 000’s)<br />
Net Operating Income -3% -1% As Forecasted +1% +3%<br />
$ 291,477 $ 297,487 $ 300,492 $ 303,497 $ 309,506<br />
Capitalization Rate<br />
-0.25% 5.22% $ 90,400 $ 205,531 $ 263,096 $ 320,662 $ 435,792<br />
Cap Rate As Reported 5.47% (164,803) (54,934) 5,493,448 54,934 164,803<br />
+0.25% 5.72% (397,699) (292,632) (240,098) (187,565) (82,498)<br />
Investment properties with a fair value of $482.5 million as at December 31, <strong>2012</strong> ($452.6 million – December 31, 2011) are situated on<br />
land held under ground (or land) leases.<br />
Investment properties with a fair value of $638.8 million as at December 31, <strong>2012</strong> (December 31, 2011 – $587.3 million) are pledged as<br />
security against the Trust’s committed revolving credit facility. In addition, investment properties with a fair value of $5.1 billion as at<br />
December 31, <strong>2012</strong> (December 31, 2011 – $4.5 billion) are pledged as security against the Trust’s mortgages payable.<br />
For the year ended December 31, <strong>2012</strong>, the Trust capitalized $83.1 million in building improvements and recorded a fair value gain<br />
of $616.4 million on its financial statements as a result of changes in the fair value of investment properties. Capitalized building<br />
improvements represent expenditures that provide future benefits to the Trust for a period greater than twelve months, some of<br />
which may not be immediately reflected in the fair value of the investment properties, under IFRS, for the current reporting period.<br />
Investment Property Development<br />
In the past, the development of multi-family apartment units by the Trust was not a significant part of its overall strategy. The main<br />
reason was due to management’s opinion that the anticipated return on development was far below other available risk adjusted<br />
<strong>Boardwalk</strong> <strong>REIT</strong> / ar <strong>2012</strong><br />
MANAGEMENT’s DISCUSSION and analySIS / 63
capital allocation alternatives, such as the acquisition of existing apartment units in the Trust’s target markets and/or the buyback<br />
of Trust Units for cancellation. Over the last number of years there has been a change in the multi family apartment environment in<br />
Canada. Over this period we have witnessed a significant increase in the market value of rental apartments. This increase, although<br />
somewhat helped by a steady increase in reported market rental rates, has been mainly driven by a significant compression in market<br />
capitalization rates, which in turn has been the result of a prolonged low interest rate environment here in Canada.<br />
With this increase in the market value of apartments, there has been a significant decrease in the expected returns from the above<br />
noted allocation alternatives to a level that warrants a measured allocation of capital to the area of new apartment development, particularly<br />
on excess land the Trust currently owns. Accordingly, the Trust has recently pursued new apartment development on some<br />
of its excess density. In <strong>2012</strong>, the Trust received development approval from the City of Calgary in Alberta, Canada, and commenced<br />
construction of a 109-unit four storey, elevatored, wood frame building in the southwest part of the city. The development itself is<br />
being constructed on excess land density the Trust currently has on its Spruce Ridge property. It is estimated the cost of this development<br />
will be approximately $19 million. To assist in the development cost of this property, the Trust had applied for, and received,<br />
approval of a grant from the Province of Alberta in the amount of $7.5 million. As at December 31, <strong>2012</strong>, approximately $2.3 million of<br />
the $7.5 million was received by the Trust. In return for this grant, the Trust has agreed to classify 54 of the 109 units as ‘affordable’, with<br />
market rents to be set at 10% below average market rates for Calgary for a term of 20 years. The remainder of the approximate $11.5<br />
million development funds required will come from <strong>Boardwalk</strong>’s cash on hand. We estimate the stabilized capitalization rate on this<br />
project will be approximately 6.10%, including an estimated allocation of $4.25 million, or $39 thousand per apartment unit, for the<br />
excess land allocated to this project. In accordance with IAS 20 – Accounting for Government Grants and Disclosure of Government<br />
Assistance under IFRS, this grant will be recognized in profit or loss on a systematic basis over the periods in which the Trust recognizes<br />
revenue from the 54 units classified as affordable units, resulting in achievable rents being much closer to market rents.<br />
It is our intention to continue to investigate further development opportunities; however, each future opportunity will require a<br />
separate analysis and, depending on the analysis and economic conditions, <strong>Boardwalk</strong> <strong>REIT</strong> will determine if additional development<br />
projects are warranted.<br />
Capital Structure and Liquidity<br />
Liquidity refers to the Trust’s ability to generate, and have available, sufficient cash to fund our ongoing operations and capital<br />
commitments as well as its distributions to Unitholders. Generally, distributions are funded from FFO. However, in common with the<br />
majority of real estate entities, we rely on lending institutions for a significant portion of capital required to fund mortgage principal<br />
payments, capital expenditures, acquisitions, unit buybacks, and repayment of maturing debt. Over the past number of years,<br />
<strong>Boardwalk</strong> has observed a significant increase in borrowing standards of many of our key lending partners as a result of heightened<br />
sensitivity to possible weaknesses in the economy. Although it appears we are beginning to see an improvement in the overall<br />
economy, <strong>Boardwalk</strong> has yet to witness a significant change in these more stringent standards.<br />
To mitigate the risk of renewal, the Trust utilizes NHA mortgage insurance, the benefits of which we discussed in detail above. In<br />
volatile times, the ability to access this product was very beneficial to the Trust as a whole.<br />
The Trust’s current liquidity position remains stable as the following table highlights:<br />
($000)<br />
Cash position December 31, <strong>2012</strong> $ 138,656<br />
Subsequent Committed Additional Financing $ 28,107<br />
Committed Revolving Credit Facility Available $ 196,276<br />
Total Available Liquidity $ 363,039<br />
64 / MANAGEMENT’s DISCUSSION and analySIS <strong>Boardwalk</strong> <strong>REIT</strong> / ar <strong>2012</strong>
In addition to this, the Trust currently has 2,949 rental apartment units of unencumbered assets, of which 855 units are pledged<br />
against the Trust’s committed revolving credit facility. It is estimated that the Trust could obtain an additional $232.9 million of new<br />
proceeds from the financing of its current unencumbered assets.<br />
Approximately 99% of <strong>Boardwalk</strong> <strong>REIT</strong>’s secured mortgages carry NHA insurance. Maturing mortgages already have commitments at<br />
interest rates lower than their existing (maturing) interest rates.<br />
The reader should also be aware that of the $287.7 million of secured mortgages coming due in 2013 (as shown in the table below), all<br />
have NHA insurance, and represent in aggregate approximately 53% of current estimated “underwriting” values on those individual<br />
secured assets. Currently, interest rates on NHA insured mortgages are well below the weighted average interest rate of the $287.7<br />
million maturing mortgages of 4.45%. The reader, however, is cautioned these rates do fluctuate and, by the time these maturing<br />
mortgages are set for renewal, with or without additional financing, interest rates may have changed materially.<br />
Mortgages and Debt Schedule<br />
<strong>Boardwalk</strong> <strong>REIT</strong>’s long-term debt consists entirely of low-rate, fixed-term secured mortgage financing. On January 23, <strong>2012</strong>, <strong>Boardwalk</strong><br />
<strong>REIT</strong> paid its maturing unsecured debentures, totalling $112.4 million. The maturity dates on the secured mortgages have been staggered<br />
to lower the overall interest rate risk on renewal.<br />
Total mortgages and debt payable (net of unamortized transaction costs) on December 31, <strong>2012</strong>, were $2.25 billion, compared to $2.33<br />
billion reported on December 31, 2011.<br />
<strong>Boardwalk</strong> <strong>REIT</strong>’s overall weighted average interest rate on its long-term debt has decreased from the prior year. The weighted average<br />
interest rate on December 31, <strong>2012</strong>, was 3.69% compared to 4.14% on December 31, 2011. To better maintain cost effectiveness and<br />
flexibility of capital, <strong>Boardwalk</strong> <strong>REIT</strong> continuously monitors short and long-term interest rates. If the environment warrants, the Trust<br />
will convert short-term, floating rate debt, if any, to longer term, fixed rate mortgages.<br />
Year of Maturity<br />
Principal<br />
Outstanding as<br />
at Dec 31, <strong>2012</strong><br />
Weighted Average<br />
Interest Rate<br />
By Maturity<br />
% of Total<br />
2013 $ 287,656 4.45% 12.33%<br />
2014 418,167 3.51% 17.92%<br />
2015 445,780 3.72% 19.10%<br />
2016 274,932 3.89% 11.78%<br />
2017 321,968 2.95% 13.80%<br />
2018 113,497 3.68% 4.86%<br />
2019 129,745 4.10% 5.55%<br />
2020 54,619 4.48% 2.33%<br />
2021 33,048 4.26% 1.43%<br />
2022 254,423 3.32% 10.90%<br />
Total Principal Outstanding $ 2,333,835 3.69% 100.00%<br />
Unamortized Deferred Financing Costs $ (85,659)<br />
Per Financial Statements $ 2,248,176<br />
As of February 13, 2013, the Trust renewed $28.0 million of the $287.7 million of secured mortgages maturing in 2013. This represents<br />
approximately 10% of the total debt maturing in fiscal 2013. On the renewed portion of the secured debt, the new weighted average<br />
interest rate was 2.31% as compared to the maturing rate of 5.24%. The weighted average term on these renewals was five (5) years.<br />
<strong>Boardwalk</strong> <strong>REIT</strong> / ar <strong>2012</strong><br />
MANAGEMENT’s DISCUSSION and analySIS / 65
Unsecured Debentures<br />
On January 21, 2005, <strong>Boardwalk</strong> <strong>REIT</strong> completed the issuance of unsecured debentures in a public offering in the aggregate amount<br />
of $120 million. The debentures carried a coupon rate of 5.61% (5.31% prior to July 30, 2008) and matured on January 23, <strong>2012</strong>. During<br />
the first quarter of 2009, the Trust acquired a total face value of $7.6 million of its unsecured debentures for cancellation at a discount<br />
in the open market.<br />
<strong>Boardwalk</strong> had a principal repayment of $112.4 million of unsecured debentures that matured on January 23, <strong>2012</strong>. The balance of<br />
these were repaid with cash on hand on maturity.<br />
Interest Coverage<br />
Notwithstanding the Trust’s current liquidity situation, <strong>Boardwalk</strong>’s liquidity and access to capital resources is constrained by certain<br />
tests that have been adopted in both its Declaration of Trust, as well as in its credit facility. Prior to May 15, <strong>2012</strong>, the most constraining<br />
test was what was referred to as its Debt-to-Gross Book Value. At the May 15, <strong>2012</strong> Annual and Special Meeting of Unitholders, the<br />
Debt-to-Gross Book Value test was replaced by an interest coverage ratio limit of 1.5 to 1. For the purpose of the interest coverage ratio<br />
calculation, distributions on the LP Class B Units are excluded from interest expense, despite the LP Class B Units being classified as a<br />
financial liability under IFRS.<br />
The following table sets out the Trust’s interest coverage ratio calculation as at December 31, <strong>2012</strong>, based on the most recently four<br />
completed fiscal quarters.<br />
As at December 31, <strong>2012</strong><br />
Consolidated EBITDA $247,155<br />
Consolidated Interest Expense 89,649<br />
Interest Coverage Ratio 2.76<br />
Minimum Threshold 1.50<br />
For the year ended December 31, <strong>2012</strong>, <strong>Boardwalk</strong> <strong>REIT</strong>’s overall interest coverage ratio of adjusted EBITDA (i.e. Earnings Before Interest,<br />
Taxes, Depreciation and Amortization) to interest expense, excluding distributions on LP B Units and fair value gains and losses, was<br />
2.76, compared to 2.42 for the previous year. The reader should note upon the adoption of IFRS standards, the distributions made<br />
to the LP Class B Unitholders are now considered financing charges and is the result of the reclassification of these units as financial<br />
liabilities. The calculation of the interest coverage ratio above does not include these distribution payments in the calculation of<br />
interest expense.<br />
Unitholders’ Equity<br />
The following table discloses the changes in <strong>REIT</strong> Trust Units issued and outstanding:<br />
Summary of Unitholders’ Capital Contributions<br />
Units<br />
December 31, 2010 47,891,133<br />
Units issued for vested deferred units 59,259<br />
Units purchased and cancelled (160,900)<br />
December 31, 2011 47,789,492<br />
Units issued for vested deferred units 62,175<br />
Units purchased and cancelled –<br />
December 31, <strong>2012</strong> 47,851,667<br />
<strong>Boardwalk</strong> <strong>REIT</strong> has one class of publicly traded voting securities known as “<strong>REIT</strong> Units”. As at December 31, <strong>2012</strong>, there were 47,851,667<br />
<strong>REIT</strong> Units issued and outstanding. In addition, there were 4,475,000 special voting units issued to holders of “Class B Units” of<br />
66 / MANAGEMENT’s DISCUSSION and analySIS <strong>Boardwalk</strong> <strong>REIT</strong> / ar <strong>2012</strong>
<strong>Boardwalk</strong> <strong>REIT</strong> Limited Partnership (“LP B Units”), each of which also has a special voting unit in the <strong>REIT</strong>. Each LP B Unit is exchangeable<br />
for a <strong>REIT</strong> Unit on a one-for-one basis at the option of the holder. Each LP B Unit, through the special voting unit, entitles the<br />
holder to one vote at any meeting of Unitholders. Accordingly, if all of the LP B Units were exchanged for <strong>REIT</strong> Units, the total issued<br />
and outstanding <strong>REIT</strong> Units would be 52,326,667. These LP Class B Units are classified as “FVTPL” financial liabilities under IFRS and are<br />
recorded at their fair value as liabilities on the Consolidated Statements of Financial Position.<br />
Equity<br />
<strong>Boardwalk</strong> has an equity market capitalization of approximately $3.4 billion based on the Trust Unit closing price of $64.53 on the<br />
Toronto Stock Exchange on December 31, <strong>2012</strong>.<br />
Enterprise Value<br />
With a total enterprise value of approximately $5.6 billion (consisting of total debt of $2.2 billion and market capitalization of $3.4<br />
billion) as at December 31, <strong>2012</strong>, <strong>Boardwalk</strong>’s total debt is approximately 40% of total enterprise value at the end of the year.<br />
Risks and Risk Management<br />
<strong>Boardwalk</strong> <strong>REIT</strong>, like most real estate rental entities, is exposed to a variety of risk areas. These areas are categorized between<br />
general and specific risks. General risks are the risks associated with general conditions in the real estate sector, and consist mainly<br />
of commonly exposed risks that affect the real estate industry. Specific risks focus more on risks uniquely identified with the Trust,<br />
such as credit, market, liquidity and operational risks. The following will address each of these risks. In addition, this section should<br />
be read in conjunction with the Trust’s AIF dated February 13, 2013, with reference to page 47 where additional risks and their related<br />
management are also noted.<br />
General Risks<br />
Real Estate Industry Risk: Real estate investments are generally subject to varying degrees of risk depending on the nature of the<br />
property. These risks include changes in general economic conditions (such as the availability and cost of mortgage funds), local<br />
conditions (such as an oversupply of space or a reduction in demand for real estate in the area), government regulations (such as<br />
new or revised residential tenant legislation), the attractiveness of the properties to tenants, competition from others with available<br />
space, and the ability of the owner to provide adequate maintenance at an economic cost. Currently, we operate in Canada, in the<br />
provinces of Alberta, British Columbia, Saskatchewan, Ontario and Quebec. Neither of Alberta and Saskatchewan is subject to rent<br />
control legislation; however, under Alberta legislation, a landlord is only entitled to increase rents once every twelve months. A more<br />
detailed discussion on rent controls will follow in a later section.<br />
Certain significant expenditures, including property taxes, maintenance costs, mortgage payments, insurance costs and related<br />
charges, must be made regardless of whether or not a property is producing sufficient income to service these expenses. <strong>Boardwalk</strong><br />
<strong>REIT</strong>’s properties are subject to mortgages, which require significant debt service payments. If the Trust were unable or unwilling to<br />
meet mortgage payments on any property, losses could be sustained as a result of the mortgagee’s exercise of its rights of foreclosure<br />
or of sale. Real estate is relatively illiquid. Such illiquidity will tend to limit our ability to vary our portfolio promptly in response to<br />
changing economic or investment conditions. In addition, financial difficulties of other property owners resulting in distress sales<br />
may depress real estate values in the markets in which the Trust operates.<br />
Multi-Family Residential Sector Risk: Income producing properties generate income through rent payments made by tenants of the<br />
properties. Upon the expiry of any lease, there can be no assurance that the lease will be renewed or the tenant replaced. The terms<br />
of any subsequent lease may be less favourable to us than the existing lease. To mitigate this risk, the Trust does not have any one<br />
<strong>Boardwalk</strong> <strong>REIT</strong> / ar <strong>2012</strong><br />
MANAGEMENT’s DISCUSSION and analySIS / 67
or small group of significant tenants. Each operating lease signed is for a period of twelve months or less. The Trust is dependent on<br />
leasing markets to ensure vacant residential space is leased, expiring leases are renewed and new tenants are found to fill vacancies.<br />
While it is not expected that markets will significantly change in the near future, a disruption in the economy could have a significant<br />
impact on how much space tenants will lease and the rental rates paid by tenants. This would affect the income produced by our<br />
properties as a result of downward pressure on rents.<br />
Environmental Risks: As an owner and manager of real property, <strong>Boardwalk</strong> <strong>REIT</strong> is subject to various Canadian federal, provincial,<br />
and municipal laws relating to environmental matters. These laws could encumber us with liability for the costs of removal and<br />
remediation of certain hazardous substances or wastes released or deposited on or in its properties or disposed of at other locations.<br />
The failure to remove or remediate such substances, if any, could adversely affect <strong>Boardwalk</strong>’s ability to sell its real estate, or to borrow<br />
using real estate as collateral, and could potentially also result in claims or other proceedings against <strong>Boardwalk</strong> <strong>REIT</strong>. <strong>Boardwalk</strong><br />
<strong>REIT</strong> is not aware of any material non-compliance with environmental laws at any of its properties. The Trust is also not aware of any<br />
pending or threatened investigations or actions by environmental regulatory authorities in connection with any of its properties or<br />
any material pending or threatened claims relating to environmental conditions at its properties. <strong>Boardwalk</strong> <strong>REIT</strong> has formal policies<br />
and procedures to review and monitor environmental exposure. The Trust has made, and will continue to make, the necessary capital<br />
expenditures for compliance with environmental laws and regulations. Environmental laws and regulations can change rapidly and<br />
may become subject to more stringent environmental laws and regulations in the future. Compliance with more stringent environmental<br />
laws and regulations could have a material adverse effect on our business, financial condition or results of operation.<br />
Ground Lease Risk: Five of our properties, located in Banff, Calgary, Edmonton, and two in Montreal, are subject to long-term ground<br />
(or land) leases and similar arrangements; in each instance, the underlying land is owned by a third party and leased to the Trust.<br />
Under the terms of a typical ground lease, the lessee must pay rent for the use of the land and is generally responsible for all costs<br />
and expenses associated with the building and improvements, including taxes, utilities, insurance, maintenance, repairs and replacements.<br />
Unless the lease term is extended, the land together with all improvements made will revert to the owner of the land upon<br />
the expiration of the lease term. These leases are set to expire between 2028 and 2096. Approximately 10% of the Trust’s FFO derives<br />
from the properties in its portfolio which are held as long-term ground leases. The Trust is and will actively seek to either renew the<br />
terms of such leases or purchase the freehold interest in the lands forming the subject matter of such leases prior to the expiry of their<br />
terms. However, if the Trust cannot or chooses not to renew such leases, or buy the land of which they form the subject matter, as<br />
the case may be, the net operating income and cash flow associated with such properties would no longer contribute to <strong>Boardwalk</strong>’s<br />
results of operations and could adversely impact its ability to make distributions to Unitholders. The ground lease for the largest<br />
Montreal property, known as the Nuns’ Island portfolio, is also subjected to a rent revision clause, which commenced on December<br />
1, 2008 (based on a valuation date of March 16, 2008). It is phased in on a property-by-property basis through to 2015, and is based on<br />
75% of the land value in its current use. After that revision, the land rent will remain constant thereafter through to 2064. An event of<br />
default by us, under the terms of a ground lease, could also result in a loss of the property, subject to such ground lease, should the<br />
default not be rectified in a reasonable period of time. The Trust is not aware of any default under the terms of the ground leases.<br />
Competition Risk: Each segment of the real estate business is competitive. Numerous other residential developers and apartment<br />
owners, compete in seeking tenants. Although it is our strategy to own multi-family properties in premier locations in each market<br />
in which it operates, some of the apartments of our competitors may be newer, better located or better capitalized. The existence<br />
of alternative housing could have a material adverse effect on our ability to lease space in its properties and on the rents charged or<br />
concessions granted, and could adversely affect <strong>Boardwalk</strong> <strong>REIT</strong>’s revenues and its ability to meet its obligations.<br />
General Uninsured Losses: <strong>Boardwalk</strong> <strong>REIT</strong> carries comprehensive general liability, fire, flood, extended coverage and rental loss<br />
insurance with policy specifications, limits and deductibles customarily carried for similar properties. There are, however, certain<br />
types of risks (generally of a catastrophic nature such as war or environmental contamination), which are either uninsurable or not<br />
68 / MANAGEMENT’s DISCUSSION and analySIS <strong>Boardwalk</strong> <strong>REIT</strong> / ar <strong>2012</strong>
economically insurable. <strong>Boardwalk</strong> <strong>REIT</strong> currently has insurance for earthquake risks, subject to certain policy limits, deductibles<br />
and self-insurance arrangements, and will continue to carry such insurance if it is economical to do so. Should an uninsured or<br />
underinsured loss occur, <strong>Boardwalk</strong> <strong>REIT</strong> could lose its investment in, and anticipated profits and cash flows from, one or more of its<br />
properties, and would continue to be obligated to repay any recourse mortgage indebtedness on such properties.<br />
Fluctuations of Cash Distributions: Although <strong>Boardwalk</strong> <strong>REIT</strong> intends to continue to make distributions, the actual amount of distributions<br />
in respect of the <strong>REIT</strong> Units will depend upon numerous factors, including, but not limited to, the amount of principal<br />
repayments, tenant allowances, leasing commissions, capital expenditures and <strong>REIT</strong> Unit redemptions and other factors that may<br />
be beyond the control of <strong>Boardwalk</strong> <strong>REIT</strong>. The distribution policy of <strong>Boardwalk</strong> <strong>REIT</strong> is established by the Trustees and is subject to<br />
change at the discretion of the Trustees. The recourse of Unitholders who disagree with any change in policy is limited and could<br />
require such Unitholders to seek to replace the Trustees. Distributions may exceed actual cash available to <strong>Boardwalk</strong> <strong>REIT</strong> from time<br />
to time because of items such as principal repayments, tenant allowances, leasing commissions, capital expenditures, and redemption<br />
of <strong>REIT</strong> Units, if any. <strong>Boardwalk</strong> <strong>REIT</strong> may be required to use part of its debt capacity or to reduce distributions in order to accommodate<br />
such items. <strong>Boardwalk</strong> <strong>REIT</strong> may temporarily fund such items, if necessary, through an operating line of credit in expectation<br />
of refinancing long-term debt on its maturity.<br />
Workforce Availability<br />
<strong>Boardwalk</strong>’s ability to provide services to its existing Customers is somewhat dependent on the availability of well-trained Associates<br />
and contractors to service our Customers as well as complete required maintenance and capital upgrades on our buildings. The Trust<br />
must also balance requirements to maintaining adequate staffing levels while balancing the overall cost to the Trust.<br />
Within <strong>Boardwalk</strong>, our most experienced Associates are employed full-time; this full-time force is supplemented by additional parttime<br />
Associates as well as specific contract services needed by the Trust. We are constantly reviewing existing overall market factors<br />
to ensure that our existing compensation program is in-line with existing levels of responsibility and, if warranted, we adjust the<br />
program accordingly. We also encourage Associate feedback in these areas to ensure the existing programs are meeting their personal<br />
needs.<br />
Specific Risks<br />
Credit Risk is the risk of loss due to failure of a contracted Customer to fulfill the obligation of required payments.<br />
For us, one of the key credit risks involves the possibility that our Resident Members will be unable or unwilling to fulfill their lease<br />
term commitments. Due to the very nature of the multi–family business, credit risk is not deemed to be very high. The Trust currently<br />
has 35,277 rental apartment units. The result of this is that we are not unduly reliant on any one Resident Member or lease. To further<br />
mitigate this risk, <strong>Boardwalk</strong> <strong>REIT</strong> continues to diversify its portfolio to various major centers across Canada. Further, each of our<br />
rental units has its own individual lease agreement, thus <strong>Boardwalk</strong> <strong>REIT</strong> has no material financial exposure to any particular Resident<br />
Member or group of Resident Members. The Trust continues to utilize extensive screening processes for all potential Resident<br />
Members including, but not limited to, detailed credit checks.<br />
Market Risk is the risk that the Trust could be adversely affected due to market changes in product supply, interest rates and regional rent controls.<br />
Our principal exposures to market risk are in the areas of new multi-family housing supply, changes to rent controls, utility price<br />
increases, property tax increases, higher interest rates and mortgage renewal risk.<br />
<strong>Boardwalk</strong> <strong>REIT</strong> / ar <strong>2012</strong><br />
MANAGEMENT’s DISCUSSION and analySIS / 69
Supply Risk is the risk that the Trust would be negatively affected by the new supply of, and demand for, multi-family residential units in its major<br />
market areas.<br />
Key drivers of demand include employment levels, population growth, demographic trends and consumer confidence. Any significant<br />
amount of new construction will typically result in an imbalance in supply and cause downward price pressure on rents. No<br />
signs of significant new rental construction are currently evident in any of our existing markets. Past studies have shown that in order<br />
to economically justify new rental construction in <strong>Boardwalk</strong> <strong>REIT</strong>’s major markets, an increase in existing rental rates of hundreds of<br />
dollars will be necessary. In recent years, however, there has been a change in the multi family apartment environment in Canada.<br />
During this period, we have witnessed a significant increase in the market value of rental apartments. This increase, although somewhat<br />
helped by a steady increase in reported market rental rates, has been mainly driven by a significant compression in market<br />
capitalization rates, which in turn has been the result of a prolonged low interest rate environment here in Canada. With this increase<br />
in the market value of apartments, there has been a significant decrease in the expected returns from the acquisition of existing<br />
multi-family rental properties to a level that warrants a measured allocation of capital to the area of new apartment development,<br />
particularly on excess the land <strong>Boardwalk</strong> <strong>REIT</strong> currently owns. Accordingly, the Trust has recently pursued new apartment development<br />
on some of its excess density.<br />
Risk Management for Supply<br />
Our performance will always be affected by the supply and demand for multi-family rental real estate in Canada. The potential for<br />
reduced rental revenue exists in the event that <strong>Boardwalk</strong> <strong>REIT</strong> is not able to maintain its properties at a high level of occupancy, or<br />
in the event of a downturn in the economy, which could result in lower rents or higher vacancy rates. <strong>Boardwalk</strong> <strong>REIT</strong> has minimized<br />
these risks by:<br />
▲<br />
▲<br />
▲<br />
▲<br />
▲<br />
▲<br />
▲<br />
▲<br />
▲<br />
Increasing Resident Member satisfaction;<br />
Diversifying its portfolio across Canada, particularly with the recent expansion into the eastern market, thus lowering its exposure<br />
to regional economic swings;<br />
Acquiring properties only in desirable locations, where vacancy rates for properties are higher than city-wide averages but can<br />
be reduced by repositioning the properties through better management and selective upgrades;<br />
Holding a balanced portfolio which includes a variety of multi-family building types including high-rise, townhouse, garden and<br />
walkups, each with its own market niche;<br />
Maintaining a wide variety of suite mix, including bachelor suites, one, two, three and four-bedroom units;<br />
Building a broad and varied Resident Member base, thereby avoiding economic dependence on larger-scale tenants;<br />
Focusing on affordable multi-family housing, which is considered a stable commodity;<br />
Developing a specific rental program characterized by rental adjustments that are the result of enhanced service and superior<br />
product; and,<br />
Developing regional management teams with significant experience in the local marketplace, and combining this experience<br />
with our existing operations and management expertise.<br />
70 / MANAGEMENT’s DISCUSSION and analySIS <strong>Boardwalk</strong> <strong>REIT</strong> / ar <strong>2012</strong>
Interest Risk is the combined risk that the Trust would experience a loss as a result of its exposure to a higher interest rate environment (Interest<br />
Rate Risk) and the possibility that at the term end of a mortgage the Trust would be unable to renew the maturing debt with either the existing or<br />
an additional lender (Renewal Risk).<br />
With the current world economic and financial situation, there is a heightened risk that not only will existing maturing mortgages be<br />
subject to increased interest rate changes but also the distinct possibility that maturing mortgages will themselves not be able to be<br />
renewed, or, if they are, they will be at significantly lower loan to value ratios. The Trust continues to manage this risk by maintaining<br />
a balanced maturing portfolio with no significant amount coming due in any one particular period. In addition, the majority of<br />
<strong>Boardwalk</strong> <strong>REIT</strong>’s debt is insured with NHA insurance. This insurance allows us to increase the overall credit quality of the mortgage<br />
and, as such, enable the Trust to obtain preferential interest rates as well as facilitating easier renewal on its due dates.<br />
The use of NHA insurance also assists <strong>Boardwalk</strong> <strong>REIT</strong> in managing its renewal risk. Given the increased credit quality of such debt,<br />
the probability of the Trust being unable to renew the maturing debt or transfer this debt to another accredited lending institution<br />
is significantly reduced.<br />
To date, the Trust has had no problem obtaining mortgage renewals on term maturing loans, and additional funds, if needed, continue<br />
to be available on its investment properties. Although we have seen fluctuations in the quoted interest spread over the corresponding<br />
benchmark bonds, the all-in quoted rates, due to a general decline in interest rates, continue to be at levels well below the<br />
term maturing interest rate and, as such, are accretive to the Trust as a whole.<br />
In <strong>2012</strong>, the Canadian government announced it would be capping the total amount of insurance that CMHC can have in force at $600<br />
billion. This decision has primarily affected the amount of portfolio or bulk insurance CMHC offers to banks, and, to date, has had a<br />
minimal impact on the renewal of <strong>Boardwalk</strong>’s mortgages, or the cost of secured debt capital. However, there is no assurance that<br />
the decision to cap the amount of CMHC insurance will not affect mortgages for multi-family residential properties in future periods.<br />
We continue to monitor this situation. Depending on the changes, if any, the Government of Canada places on the NHA insurance<br />
product, the impact on the Trust could vary. It is our understanding that this cap would not affect any pre-existing insurance agreements.<br />
Over 99% of <strong>Boardwalk</strong>’s secured debt have this insurance on it with an average of 31 years of amortization remaining. The<br />
larger risk may be the ability to issue new secured debt under this program at a much lower cost due to the use of this insurance, the<br />
proceeds of which the Trust uses to assist in the execution of its overall strategy.<br />
Structural Subordination<br />
Liabilities of a parent entity with assets held by various subsidiaries may result in the structural subordination of the lenders of the<br />
parent entity. The parent entity is entitled only to the residual equity of its subsidiaries after all debt obligations of its subsidiaries are<br />
discharged. In the event of a bankruptcy, liquidation or reorganization of the Trust, holders of indebtedness of the Trust may become<br />
subordinate to lenders to the subsidiaries of the Trust.<br />
Certain subsidiaries of the Trust will provide a form of guarantee pursuant to which the Indenture Trustee will, subject to the Trust<br />
Indenture, be entitled to seek redress from such subsidiaries for the guaranteed indebtedness. These guarantees are intended to<br />
eliminate structural subordination, which arises as a consequence of the Trust’s assets being held in various subsidiaries. Although<br />
all subsidiaries, which own material assets, will provide a guarantee, not all subsidiaries of the Trust will provide such a guarantee. In<br />
addition, there can be no assurance that the Indenture Trustee will, or will be able to, effectively enforce the guarantee.<br />
<strong>Boardwalk</strong> <strong>REIT</strong> / ar <strong>2012</strong><br />
MANAGEMENT’s DISCUSSION and analySIS / 71
Rent Control Risk is the risk of the implementation or amendment of new or existing legislative rent controls in the markets <strong>Boardwalk</strong> <strong>REIT</strong><br />
operates, which may have an adverse impact on the Trust’s operations.<br />
Under Ontario’s rent control legislation, commonly known as “rent de-control”, a landlord is entitled to increase the rent for existing<br />
tenants once every twelve months by no more than the “guideline amount” established by regulation. For the calendar years 2011<br />
and <strong>2012</strong>, the guideline amounts have been established at 0.7% and 3.1%, respectively, and for 2013 the guideline amount has been<br />
set at 2.5%. Further details on Ontario’s Annual Rental Increase Guidelines can be found at http://www.ontariotenants.ca/research/<br />
rent-increase.html. This adjustment is meant to take into account the income of the building, the municipal and school taxes, the<br />
insurance bills, the energy costs, maintenance, and service costs. Landlords may apply to the Ontario Rental Housing Tribunal for<br />
an increase above the guideline amounts if <strong>annual</strong> costs for heat, hydro, water, or municipal taxes have increased significantly, or if<br />
building security costs have increased. When a unit is vacated, however, the landlord is entitled to lease the unit to a new tenant at<br />
any rental amount, after which <strong>annual</strong> increases are limited to the applicable guideline amount. The landlord may also be entitled to<br />
a greater increase in rent for a unit under certain circumstances, including, for example, where extra expenses have been incurred as<br />
a result of a renovation of that unit.<br />
British Columbia has a similar rent control regime to Ontario’s, with the guideline amounts there being two percent (2%) over <strong>annual</strong><br />
inflation. For 2011 and <strong>2012</strong>, this guideline amount has been set at 2.3% and 4.3%, respectively, and for 2013 the guideline amount is<br />
3.8%. Further details on British Columbia’s Annual Rental Increase Guidelines can be found at http://www.rto.gov.bc.ca/content/<br />
news/default.aspx.<br />
Under Quebec’s rent control legislation, a landlord is entitled to increase the rent for existing tenants once a year for the rent period<br />
starting after April 1st of the current year but before April 1st of the following year. There is no fixed rate increase specified by the<br />
regulation. Rent increases also take into account a return on capital expenditures (for 2013 this return is 2.6% compared to 2.9% for<br />
<strong>2012</strong>, 3.0% for 2011 and 2.9% for 2010), if such expenditures were incurred, and an indexing of the net income of the building. Average<br />
rent increase estimates for the period starting after April 1st, 2013 and before April 2nd, 2014, before any consideration for increases to<br />
municipal and school taxes as well as capital expenditures, are: 0.9% for electricity heated dwellings, 0.2% for gas heated dwellings,<br />
1.7% for oil heated dwellings and 0.9% for non-heated dwellings.<br />
Presently, rent control legislation does not exist in, and is not planned for, Alberta or Saskatchewan, although in April of 2007, the<br />
province of Alberta amended its existing rental legislation the details of which will be discussed in more detail later in this document.<br />
To manage this risk prior to entering a market where rent controls are in place, an extensive amount of time is spent researching the<br />
existing rules, and, where possible, the Trust will ensure it employs Associates who are experienced in working in these controlled<br />
environments. In addition, the Trust adjusts forecast assumptions on new acquisitions to ensure they are reasonable given the rent<br />
control environment.<br />
Utility and Property Tax Risk relates to the potential loss the Trust may experience as a result of higher resource prices and well as its exposure to<br />
significant increases in property taxes.<br />
Over the past few years, property taxes have increased as a result of re-valuations of municipal properties and their adherent tax<br />
rates. For us, these re-valuations have resulted in significant increases in some property assessments due to enhancements, which<br />
are not represented on our balance sheet (as such representations are contrary to existing GAAP reporting standards). To address this<br />
risk, <strong>Boardwalk</strong> <strong>REIT</strong> has compiled a specialized team of property reviewers who, with the assistance of outside authorities, constantly<br />
review property tax assessments and, where warranted, appeal them.<br />
72 / MANAGEMENT’s DISCUSSION and analySIS <strong>Boardwalk</strong> <strong>REIT</strong> / ar <strong>2012</strong>
Utility expenses, mainly consisting of natural gas and electricity service charges, have been subject to considerable price fluctuations<br />
over the past several years. Any significant increase in these resource costs that <strong>Boardwalk</strong> <strong>REIT</strong> cannot pass on to the Customer may<br />
have a negative material impact on the Trust. To mitigate this risk, the Trust (and its predecessor) has begun to play a more active<br />
role in controlling the fluctuation and predictability of this risk. Through the combined use of financial instruments and resource<br />
contracts with varying maturity dates, exposure to these fluctuations has been reduced. In addition to this, the following steps have<br />
been implemented:<br />
▲<br />
▲<br />
Where possible, economical electrical sub-metering devices are being installed, passing on the responsibility for electricity<br />
charges to the end Customer.<br />
In other cases, rents have been, or will be, adjusted upward to cover these increased costs.<br />
Operational Risk is the risk that a direct or indirect loss may result from an inadequate or failed technology, from a human process, or from<br />
external events. The impact of this loss may be financial loss, loss of reputation, or legal and regulatory proceedings.<br />
The Trust endeavors to minimize losses in this area by ensuring that effective infrastructure and controls exist. These controls are<br />
constantly reviewed and improvements are implemented, if deemed necessary.<br />
Certain Tax Risks<br />
Mutual Fund Trust Status<br />
<strong>Boardwalk</strong> currently qualifies as a mutual fund trust for Canadian income tax purposes. It is the current policy of <strong>Boardwalk</strong> to<br />
<strong>annual</strong>ly distribute all of its taxable income to Unitholders and is therefore generally not subject to tax on such amount. In order to<br />
maintain its current mutual fund trust status, <strong>Boardwalk</strong> is required to comply with specific restrictions regarding its activities and the<br />
investments held by it. If <strong>Boardwalk</strong> was to cease to qualify as a mutual fund trust, the consequences could be adverse.<br />
In accordance with the Income Tax Act (Canada) (the “Tax Act”), for fiscal 2011 and <strong>2012</strong>, the Trust qualified as a real estate investment<br />
trust (“<strong>REIT</strong>”) for income tax purposes and, as such, was exempted from the specified investment flow-through rules (the “SIFT Rules”).<br />
However, prior to January 1, 2011, based on a detailed review of the legislation affecting the tax treatment of publicly traded trusts, it<br />
could be interpreted that the Trust would not qualify as a <strong>REIT</strong>. The Trust, therefore, reversed its deferred tax liability related to the<br />
SIFT Rules on January 1, 2011. This deferred tax liability was approximately $740.4 million under IFRS as at December 31, 2010.<br />
On December 16, 2010, the Department of Finance announced proposed amendments to the real estate investment trust exemption<br />
rule and, on October 24, <strong>2012</strong>, released legislation to implement such amendments. These notable amendments:<br />
▲<br />
Allow <strong>REIT</strong> subsidiaries to hold certain non-capital property in respect of their real estate investment activities;<br />
▲<br />
Allow <strong>REIT</strong>s to hold up to 10% of their non-portfolio property as non-qualifying <strong>REIT</strong> property without losing <strong>REIT</strong> status (with an<br />
associated clarification of the circumstances under which property can be considered to be ancillary <strong>REIT</strong> property);<br />
▲<br />
Allow <strong>REIT</strong>s to derive up to 10% of their revenues from sources that are not qualifying sources;<br />
▲<br />
Clarify that a trust’s revenue for purposes of the two revenue tests in the definition “real estate investment trust” is to be<br />
computed on a gross, rather than net, basis and that it will include capital gains but will not include recapture or other amounts<br />
that are on account of capital;<br />
<strong>Boardwalk</strong> <strong>REIT</strong> / ar <strong>2012</strong><br />
MANAGEMENT’s DISCUSSION and analySIS / 73
▲<br />
Allow <strong>REIT</strong>s to earn, as qualifying <strong>REIT</strong> revenue, gains realized by virtue of foreign currency fluctuations in respect of revenues<br />
derived from foreign real or immovable property including certain financing and hedging arrangements in respect of such<br />
property;<br />
▲<br />
Ensure that amounts distributed to a <strong>REIT</strong>, by an entity in which the <strong>REIT</strong> has a significant interest, will retain their character for<br />
purposes of the revenue tests; and,<br />
▲<br />
Allow an entity to hold investments in a <strong>REIT</strong> without those investments being treated as Canadian real, immovable, or resource<br />
property in determining whether the entity itself is a SIFT.<br />
The legislation, once passed, will allow the Trust to qualify for the <strong>REIT</strong> Exemption for Canadian income tax purposes with greater<br />
certainty, even if the Trust sells or disposes of any real property. This will allow the Trust to continue, if it wishes, its strategy of selling<br />
Non-Core assets without the risk of losing its <strong>REIT</strong> Exemption status.<br />
A <strong>REIT</strong> is defined under the SIFT Rules as a trust that is resident in Canada throughout the taxation year and that satisfies all of the<br />
following criteria:<br />
(a)<br />
at each time in the taxation year the total fair market value at that time of all non-portfolio properties that are qualified <strong>REIT</strong><br />
properties held by the trust is at least 90% of the total fair market value at that time of all non-portfolio properties held by the<br />
trust;<br />
(b) not less than 90% of the trust’s gross <strong>REIT</strong> revenue for the taxation year is from one or more of the following: rent from real or<br />
Immovable properties, interest, dispositions of real or immovable properties that are capital properties, dividends, royalties, and<br />
dispositions of eligible resale properties;<br />
(c)<br />
not less than 75% of the trust’s gross <strong>REIT</strong> revenue for the taxation year is from one or more of the following: rent from real or<br />
immovable properties, interest from mortgages, or hypothecs, on real or Immovable properties, and dispositions of real or<br />
immovable properties that are capital properties,<br />
(d) at each time in the taxation year an amount, that is equal to 75% or more of the equity value of the trust at that time, is the<br />
amount that is the total fair market value of all properties held by the trust each of which is a real or immovable property that is a<br />
capital property, an eligible resale property, an indebtedness of a Canadian corporation represented by a bankers’ acceptance, a<br />
property described by either paragraph (a) or (b) of the definition “qualified investment” In section 204, or a deposit with a credit<br />
union; and,<br />
(e)<br />
investments in the trust are, at any time in the taxation year, listed or traded on a stock exchange or other public market.<br />
For this purpose, “real or immovable property” includes a security of any trust, corporation or partnership that itself satisfies the above<br />
criteria, but does not include any depreciable property of a prescribed class for which the rate of capital cost allowance exceeds 5%.<br />
If <strong>Boardwalk</strong> <strong>REIT</strong>, or any other trust, does not qualify as a real estate investment trust, it will no longer be able to deduct for tax purposes<br />
its taxable distributions, and, as such, will be required to pay tax on this amount prior to distribution. Any amount distributed<br />
that is determined to be a return of capital would not be subject to this tax.<br />
74 / MANAGEMENT’s DISCUSSION and analySIS <strong>Boardwalk</strong> <strong>REIT</strong> / ar <strong>2012</strong>
Existing Tax Filing Positions<br />
Although <strong>Boardwalk</strong> <strong>REIT</strong> is of the view that all expenses to be claimed by <strong>Boardwalk</strong> <strong>REIT</strong>, the Operating Trust and the Partnership<br />
will be reasonable and deductible, that the cost amount and capital cost allowance claims of entities indirectly owned by <strong>Boardwalk</strong><br />
<strong>REIT</strong> will have been correctly determined and that the allocation of the Partnership’s income for purposes of the Tax Act among its<br />
partners is reasonable, there can be no assurance that the Tax Act or the interpretation of the Tax Act will not change, or that the<br />
Canada Revenue Agency (“CRA”) will agree. If the CRA successfully challenges the deductibility of such expenses or the allocation of<br />
such income, the Partnership’s allocation of income to the Operating Trust, and indirectly the taxable income of <strong>Boardwalk</strong> <strong>REIT</strong> and<br />
the Unitholders, may be adversely affected. The extent to which distributions will be tax-deferred in the future will depend in part on<br />
the extent to which entities indirectly owned by <strong>Boardwalk</strong> <strong>REIT</strong> are able to deduct capital cost allowance relating to the Contributed<br />
Assets held by them.<br />
Since the Partnership acquired the relevant properties on a tax-deferred basis, its tax cost in certain properties may be less than<br />
their fair market value. Accordingly, if one or more properties are disposed of, the gain recognized by the Partnership may be in<br />
excess of that which it would have realized if it had acquired the properties at their fair market values. Immediately prior to the Plan<br />
of Arrangement becoming effective, the Corporation transferred the Contributed Assets to the Partnership and received, as consideration<br />
therefore, (i) an assumption of all of the indebtedness of the Corporation associated with the Contributed Assets (other than<br />
the Retained Debt), (ii) the LP Note, and (iii) a credit to the capital accounts in respect of each of the LP Class B Units and the LP Class C<br />
Units, all of which were owned at that time by the Corporation. See “Overview of the Acquisition and the Arrangement Replacing the<br />
Corporation as a Public Entity with <strong>Boardwalk</strong> <strong>REIT</strong> – Pre-Arrangement Reorganization” in the AIF dated February 13, 2013. The transfer<br />
and contribution were effected as a “rollover” under subsection 97(2) of the Tax Act, and the Corporation, based on the advice of legal<br />
counsel, is of the view that there is no income tax payable in connection therewith. There can be no assurance that the CRA will not<br />
take a contrary view; however, the Corporation has been advised by counsel that, in such event, the CRA would not be successful.<br />
If, contrary to this, the CRA successfully challenges the rollover, income tax may be payable by the Corporation in connection with<br />
the transfer and contribution of the Contributed Assets at the applicable tax rate on the value of the capital contribution in respect<br />
of the LP Class C Units. The Partnership has agreed to indemnify the Corporation for all liabilities incurred by it in connection with<br />
the Acquisition and the Arrangement, including the transfer and contribution of the Contributed Assets to the Partnership and any<br />
associated tax that might be payable by the Corporation in respect thereof. See “Overview of the Acquisition and the Arrangement<br />
replacing the Corporation as a Public Entity with <strong>Boardwalk</strong> <strong>REIT</strong> – Ancillary Agreements in Connection with the Arrangement” in<br />
the AIF dated February 13, 2013. The amount of such indemnification would be significant and have a material adverse effect on the<br />
amount of distributable cash of the Partnership and, consequently, on the distributions of <strong>Boardwalk</strong> <strong>REIT</strong>.<br />
Risks Associated with Disclosure Controls and Procedures & Internal Control over Financial Reporting<br />
Our business could be adversely impacted if we have deficiencies in our disclosure controls and procedures or internal control over<br />
financial reporting.<br />
The design and effectiveness of our disclosure controls and procedures and internal control over financial reporting may not prevent<br />
all errors, misstatements or misrepresentations. While management continues to review the design and effectiveness of our<br />
disclosure controls and procedures and internal control over financial reporting, we cannot assure you that our disclosure controls<br />
and procedures or internal control over financial reporting will be effective in accomplishing all control objectives all of the time.<br />
Deficiencies, particularly material weaknesses, in internal control over financial reporting which may occur in the future could result<br />
in misstatements of our results of operations, restatements of our financial statements, a decline in our trust unit price, or otherwise<br />
materially adversely affect our business, reputation, results of operation, financial condition or liquidity.<br />
<strong>Boardwalk</strong> <strong>REIT</strong> / ar <strong>2012</strong><br />
MANAGEMENT’s DISCUSSION and analySIS / 75
ACCOUNTING AND CONTROL MatteRS<br />
Critical Accounting Policies<br />
The Trust adopted IFRS as its basis of financial reporting, effective January 1, 2011. The significant accounting policies followed on the<br />
adoption of IFRS are included in Note 2 of the notes to the audited Consolidated Financial Statements for the year ended December<br />
31, <strong>2012</strong>.<br />
These statements were prepared in accordance with the recommendations of the International Financial Reporting Standards<br />
(“IFRS”) and the International Accounting Standards Board (“IASB”) and with the recommendations of the Real Property Association<br />
of Canada (“REALpac”). In applying these policies, in certain cases, it is necessary to use estimates and judgments. In determining<br />
estimates, management uses the information available to the Trust at the time. Management reviews key estimates on a quarterly<br />
basis to determine their appropriateness. Any change to these estimates is applied prospectively in compliance with IFRS. We believe<br />
that the application of judgments and assessments is consistently applied and produces financial information that fairly depicts<br />
the results of operations for all periods presented. <strong>Boardwalk</strong> <strong>REIT</strong> considers the following policies to be critical in determining the<br />
judgments that are involved in the preparation of the consolidated financial statements and the uncertainties that could affect the<br />
reported results.<br />
(a) Investment properties<br />
Investment properties consist of multi-family residential properties held to earn rental income, and include interests held under<br />
long-term operating land leases. Investment properties are measured initially at cost. Cost includes all amounts relating to the acquisition<br />
(excluding transaction costs related to a business combination) and improvement of the properties. All costs associated with<br />
upgrading and extending the economic life of the existing facilities, other than ordinary repairs and maintenance, are capitalized to<br />
investment property. Included in these costs are amounts that are internal amounts, which are capitalized to the extent that they<br />
upgrade or extend the economic life of the asset.<br />
Subsequent to initial recognition, investment properties are recorded at fair value in accordance with International Accounting<br />
Standard (“IAS”) 40 - Investment Property (“IAS 40”). Fair value is determined based on a combination of internal and external processes<br />
and valuation techniques. Gains or losses arising from differences between current period fair value and the sum of previously<br />
measured fair value and capitalized costs as described above are recorded in profit or loss in the period in which they arise.<br />
Any directly attributable costs incurred on investment properties under development are capitalized. Such costs include direct<br />
development costs, property taxes and other costs directly attributable to the development.<br />
Properties owned by the Trust where a significant portion of the property is used for administrative purposes by the entity are<br />
considered “Property, Plant and Equipment” and, therefore, fall within the scope of IAS 16 – Property, Plant and Equipment (“IAS 16”)<br />
and are recorded in accordance with that standard. Where part of a building is used for administrative purposes by the Trust, but this<br />
portion is considered insignificant, this space is included as part of the Investment Property under IAS 40.<br />
Investment properties are reclassified to ‘Assets held for sale’ when the criteria set out in IFRS 5 – Non-Current Assets Held for Sale and<br />
Discontinued Operations (“IFRS 5”) are met.<br />
An investment property is derecognized upon disposal or when the investment property is permanently withdrawn from use and no<br />
future economic benefits are expected from the disposal. Prior to its disposal, the carrying value of the investment property is adjusted<br />
to reflect its fair value as outlined in the purchase and sale agreement (as the purchase and sale agreement is the best evidence<br />
of fair value). This adjustment shall be recorded as a fair value gain (loss). Any remaining gain or loss arising on derecognition of the<br />
76 / MANAGEMENT’s DISCUSSION and analySIS <strong>Boardwalk</strong> <strong>REIT</strong> / ar <strong>2012</strong>
property (calculated as the difference between the net disposal proceeds and the carrying amount of the asset) is included in profit<br />
or loss in the period in which the property is derecognized.<br />
Excess land represents land owned by the Trust located contiguous to land included as Investment Property. The Trust has the ability<br />
to develop additional multi-family residential buildings on this land or sell it separately from the investment property at a later date.<br />
Excess land is held for capital appreciation and is, therefore, treated as Investment Property and recorded in accordance with IAS 40<br />
as outlined above. When determining the fair value of a project with excess land, the capitalization rate used in determining the value<br />
is adjusted accordingly.<br />
(b) Property, plant and equipment<br />
Tangible assets that are held for use in the production or supply of goods and services, or for administrative purposes, and are expected<br />
to be used during more than one period, except when another accounting standard requires or permits a different accounting<br />
treatment, are recorded in accordance with IAS 16 using the cost model. IAS 16, therefore, excludes tangible assets that are accounted<br />
for in accordance with IAS 40.<br />
In accordance with IAS 16, the cost model, after initial recognition of the property, plant and equipment, requires the tangible asset to<br />
be carried at its costs less accumulated depreciation and any accumulated impairment losses (see NOTE 2(h)). Depreciation is recognized<br />
in a manner that reflects the pattern in which the future economic benefits of the tangible asset are expected to be consumed<br />
and realized by the Trust. The amount of depreciation will be charged systematically to the consolidated statement of comprehensive<br />
income and is the cost less residual value of the tangible asset over its useful economic life. IAS 16 also requires that the cost and useful<br />
economic life of each significant component of a depreciable tangible asset be determined based on the circumstances of each<br />
tangible asset. The method of depreciation, residual values and estimates of the useful economic life of a depreciable tangible asset,<br />
or other property, plant and equipment, are reviewed at each financial year-end and any changes are accounted for as a change in<br />
accounting estimate in accordance with IAS 8 – Accounting Policies, Changes in Accounting Estimates and Errors (“IAS 8”).<br />
Property, Plant and Equipment (“PP&E”) is valued using the cost model under IAS 16. PP&E is categorized into the following classes<br />
and their respective useful economic life is used to calculate the amount of depreciation or amortization for each period. Categories<br />
of PP&E with the same or similar useful lives are included in the same class.<br />
PP&E Class Useful Life Depreciation method used<br />
Administrative building 40 years Straight-line<br />
Site equipment 15% Declining balance<br />
Automobile 20% Declining balance<br />
Warehouse assets 10% to 20% Declining balance<br />
Corporate assets 10% to 20% Declining balance<br />
Computer hardware 35% Declining balance<br />
Computer software* 35% Declining balance<br />
(c) Business combinations<br />
In accordance with IFRS 3 – Business Combinations (“IFRS 3”), the acquisition of an asset or group of assets is recorded as a business<br />
combination if the assets acquired and the liabilities assumed constitute a business. A business is defined as an integrated set of<br />
activities and assets that is capable of being conducted and managed for the purpose of providing a return in the form of dividends,<br />
lower costs or other economic benefit. Building and other asset acquisitions, which meet the above definition of a business, are<br />
recorded as business combinations and the acquisition method of accounting for these transactions is applied. Building and other<br />
asset acquisitions, which do not meet the above definition, are recorded as an asset addition based on the purchase price.<br />
<strong>Boardwalk</strong> <strong>REIT</strong> / ar <strong>2012</strong><br />
MANAGEMENT’s DISCUSSION and analySIS / 77
The acquisition method requires that an acquirer be identified, a specific acquisition date be determined (which is typically the<br />
date in which control changes), all identifiable assets and liabilities assumed, as well as any non-controlling interest in the acquiree,<br />
be recognized and measured, and any goodwill or gains from a bargain purchase price are recognized and measured at fair value,<br />
including contingent liabilities when these contingent considerations are part of the consideration being transferred. All acquisition<br />
costs associated with a transaction, if identified as a business combination, are expensed as incurred.<br />
Goodwill is measured as the excess of the sum of the consideration transferred, the amount of any non-controlling interest in the<br />
acquiree, and the fair value of the acquirer’s previously held equity interest in the acquiree (if any) over the net of the acquisition-date<br />
amounts of the identifiable assets acquired and the liabilities assumed. If, after reassessment, the net of the acquisition-date amounts<br />
of the identifiable assets acquired and liabilities assumed exceeds the sum of the consideration transferred, the amount of any<br />
non-controlling interests in the acquiree and the fair value of the acquirer’s previously held interest in the acquiree (if any), the excess<br />
is recognized immediately in profit as a bargain purchase gain.<br />
Non-controlling interests that are present ownership interests and entitle their holders to a proportionate share of the entity’s net<br />
assets in the event of liquidation may be initially measured either at fair value or at the non-controlling interests’ proportionate<br />
share of the recognized amounts of the acquiree’s identifiable net assets. The choice of measurement basis is made on a transaction-by-transaction<br />
basis. Other types of non-controlling interests are measured at fair value or, when applicable, on the basis<br />
specified in another IFRS.<br />
When the consideration transferred by the Trust in a business combination includes assets or liabilities resulting from a contingent<br />
consideration arrangement, the contingent consideration is measured at its acquisition date fair value and included as part of<br />
the consideration transferred in a business combination. Changes in the fair value of the contingent consideration that qualify as<br />
measurement period adjustments are adjusted retrospectively, with corresponding adjustments against goodwill. Measurement<br />
period adjustments are adjustments that arise from additional information obtained during the ‘measurement period’ (which cannot<br />
exceed one year from the acquisition date and is shorter than one year if all information is received) about facts and circumstances<br />
that existed at the acquisition date.<br />
The subsequent accounting for changes in the fair value of the contingent consideration that do not qualify as measurement period<br />
adjustments depends on how the contingent consideration is classified. Contingent consideration classified as equity is not remeasured<br />
at subsequent reporting dates and its subsequent settlement is accounted for within equity. Contingent consideration classified<br />
as an asset or a liability is remeasured at subsequent reporting dates in accordance with IAS 39 – Financial Instruments: Recognition<br />
and Measurement, or IAS 37 - Provisions, Contingent Liabilities and Contingent Assets, as appropriate, with the corresponding gain or<br />
loss being recognized in profit or loss in the consolidated statement of comprehensive income.<br />
When a business combination is achieved in stages, the Trust’s previously held equity interest in the acquiree is remeasured to fair<br />
value at the acquisition date (i.e. the date when the Trust obtains control) and the resulting gain or loss, if any, is recognized in profit<br />
or loss in the consolidated statement of comprehensive income. Amounts arising from interests in the acquiree prior to the acquisition<br />
date, and that have previously been recognized in other comprehensive income, are reclassified to profit or loss where such<br />
treatment would be appropriate if that interest was disposed of.<br />
If the initial accounting for a business combination is incomplete by the end of the reporting period in which the combination occurs,<br />
the Trust reports provisional amounts for the items for which the accounting is incomplete. These provisional amounts are adjusted<br />
during the measurement period (see above), or additional assets or liabilities are recognized, to reflect new information obtained<br />
about facts and circumstances that existed at the acquisition date that, if known, would have affected the amounts recognized at<br />
that date.<br />
78 / MANAGEMENT’s DISCUSSION and analySIS <strong>Boardwalk</strong> <strong>REIT</strong> / ar <strong>2012</strong>
(d) Assets held for sale and discontinued operations<br />
(i) Assets (or disposal groups) held for sale<br />
Non-current assets and groups of assets and liabilities, which comprise disposal groups, are categorized as assets held for sale<br />
where the asset (or disposal group) is available for sale in its present condition, and the sale is highly probable. For this purpose,<br />
a sale is highly probable: (a) if management is committed to a plan to achieve the sale, (b) there is an active program to find a<br />
buyer, (c) the non-current asset (or disposal group) is being actively marketed at a reasonable price, (d) the sale is anticipated<br />
to be completed within one year from the date of classification, and (e) it is unlikely there will be changes to the plan. Where<br />
an asset (or disposal group) is acquired with a view to resale, it is classified as a non-current asset (or disposal group) held for<br />
sale if the disposal is expected to take place within one year of the acquisition and it is highly likely that the other conditions<br />
referred to above will be met within a short period following the acquisition. Retrospective application is not required; therefore,<br />
comparative figures will not be adjusted to reflect non-current assets held for sale. The gains or losses arising on a sale of assets<br />
(or disposal groups) that does not meet the definition of discontinued operations will be recognized as part of continuing operations<br />
while the gains or losses arising on a sale of assets (or disposal groups) that meet the definition of discontinued operations<br />
will be reported as part of discontinued operations in the consolidated statement of comprehensive income.<br />
(ii) Discontinued operations<br />
An asset or group of assets will be classified as a discontinued operation when it is a component of an entity that has either been<br />
disposed of or is classified as held for sale and represents a separate major line of business, it is part of a single coordinated plan<br />
to dispose of a separate major line of business or geographical area of operations, or it is a subsidiary acquired exclusively with a<br />
view to resell. Profits and gains or losses related to the disposal of discontinued operations are measured based on fair value less<br />
cost to sell or on the disposal of the assets (or disposal groups) and are presented in the financial statements on an after tax basis<br />
in accordance with IFRS 5. In addition, retrospective application is required; therefore, comparative figures will be changed to<br />
reflect discontinued operations. As an individual building does not constitute a major line of business, individual building sales<br />
are not treated as discontinued operations.<br />
(e) Impairment of assets<br />
At the end of each reporting period, assets, other than those identified in the standard as not being applicable to IAS 36 – Impairment<br />
of Assets (“IAS 36”), such as investment properties recorded at fair value, are assessed for any indication of impairment. Should the<br />
indication of impairment exist, the recoverable amount of the asset is estimated in order to determine the extent of the impairment<br />
loss (if any). Where it is not possible to estimate the recoverable amount of an individual asset, the Trust estimates the recoverable<br />
amount of the cash-generating unit to which the asset belongs. Where a reasonable and consistent basis of allocation can be identified,<br />
corporate assets are also allocated to individual cash-generating units, otherwise they are allocated to the smallest group of<br />
cash-generating units for which a reasonable and consistent allocation basis can be identified.<br />
Recoverable amount is defined as the higher of an asset’s “fair value less cost to sell” and its “value-in-use”. In assessing value-inuse,<br />
the estimated future cash flows are discounted to their present value using a pre-tax discount rate that reflects current market<br />
assessments of the time value of money and the risks specific to the asset for which the estimate of future cash flows have not been<br />
adjusted.<br />
Where the carrying amount of an asset exceeds the recoverable amount determined, an impairment loss is recognized in the consolidated<br />
statement of comprehensive income. After the recognition of an impairment loss, the depreciation charge related to that<br />
asset is also revised for the adjusted carrying amount on a systematic basis over the remaining useful life of the asset. Should this<br />
impairment loss be determined to have reversed in a future period (with the exception of goodwill), a reversal of the impairment<br />
<strong>Boardwalk</strong> <strong>REIT</strong> / ar <strong>2012</strong><br />
MANAGEMENT’s DISCUSSION and analySIS / 79
loss is recorded in profit or loss. However, in accordance with IAS 36, the reversal of an impairment loss will not increase the carrying<br />
amount that would have been determined (net of amortization) had no impairment loss been recognized.<br />
(f) Inventories<br />
Inventories are measured at the lower of cost and net realizable value. The costs of inventories comprise the purchase price, import<br />
duties and other taxes (other than those subsequently recoverable by the entity from the taxing authorities), and third-party transport,<br />
handling and other costs directly attributable to the acquisition of goods and materials, less any trade discounts, rebates and<br />
other similar items, using the first-in, first-out method of cost assignment. Net realizable value represents the estimated selling price<br />
for inventories less all estimated costs necessary to make the sale.<br />
(g) Taxation<br />
For fiscal 2011 and <strong>2012</strong>, <strong>Boardwalk</strong> <strong>REIT</strong> was a “mutual fund trust” and qualified as a real estate investment trust (“<strong>REIT</strong>”) as defined<br />
under the Income Tax Act (Canada) (the “Tax Act”). Accordingly, the Trust is not taxable on its income to the extent that its taxable<br />
income is distributed to its Unitholders.<br />
Current tax<br />
The tax currently payable is based on taxable profit for the year for certain corporate subsidiaries of the Trust. Taxable profit differs<br />
from profit as reported in the consolidated statement of comprehensive income because of items of income or expense that are<br />
taxable or deductible in other years and items that are never taxable or deductible. The Trust’s liability for current tax is calculated<br />
using tax rates that have been enacted or substantively enacted by the end of the reporting period.<br />
Deferred tax<br />
Deferred tax is recognized on temporary differences between the carrying amounts of assets and liabilities in the consolidated<br />
financial statements and the corresponding tax bases used in the computation of taxable profit.<br />
Deferred income tax liabilities are generally recognized for all taxable temporary differences. Deferred income tax assets are recognized<br />
for all deductible temporary differences, carry forward of unused tax credits and unused tax losses, to the extent that it is<br />
probable that deductions, tax credits and tax losses can be utilized. The carrying amount of deferred income tax assets are reviewed<br />
at each reporting date and reduced to the extent it is no longer probable that the income tax assets will be recovered. Deferred<br />
income tax assets and liabilities are measured at the tax rates that are expected to apply in the year when the asset is realized or<br />
the liability settled, based on tax rates and laws that have been enacted or substantively enacted at the reporting date. In addition<br />
deferred income tax assets and liabilities are measured using the rate that is consistent with the expected manner of recovery (i.e.<br />
using the asset versus selling the asset). Where applicable, current and deferred income taxes relating to items recognized directly in<br />
equity or comprehensive income are also recognized directly in equity or comprehensive income, respectively.<br />
(h) Provisions<br />
In accordance with IAS 37 – Provisions, Contingent Liabilities and Contingent Assets (“IAS 37”), a provision is a liability of uncertain<br />
timing or amount. Provisions are recognized when the entity has a present legal or constructive obligation as a result of past events, it<br />
is probable that an outflow of resources will be required to settle the obligation and the amount can be reliably estimated. Provisions<br />
are not recognized for future operating losses. Provisions are measured at the present value of the expenditures expected to be<br />
required to settle the obligation using a discounted rate that reflects current market assessment of the time value of money and the<br />
risks and uncertainties specific to the obligation. Provisions are re-measured at each reporting date using the current discount rate.<br />
The increase in the provision due to the passage of time is recognized as a financing cost.<br />
80 / MANAGEMENT’s DISCUSSION and analySIS <strong>Boardwalk</strong> <strong>REIT</strong> / ar <strong>2012</strong>
(i) Unit-based payments<br />
Equity-settled unit-based payments to employees and Trustees are measured at the fair value of the deferred unit at the grant date<br />
and expensed over the vesting period based on the Trust’s estimate of the deferred units that will actually vest. At the end of each<br />
reporting period, the Trust revises its estimate of the number of equity instruments expected to vest. The impact of the revision<br />
of the original estimates, if any, is recognized in profit or loss prospectively such that the cumulative expense reflects the revised<br />
estimate. In accordance with IAS 32 - Financial Instruments: Presentation (“IAS 32”), the deferred units are presented as a liability on<br />
the statement of financial position as the Trust is obliged to provide the holder with <strong>REIT</strong> Units once the deferred units vest. Under<br />
IAS 39 - Financial Instruments: Recognition and Measurement (“IAS 39”), the deferred units are classified as ‘fair value through profit<br />
or loss’ and are measured at each reporting period at fair value with changes in fair value recognized in the consolidated statement<br />
of comprehensive income. Fair value of the deferred units is calculated based on the observable market price of the Trust’s Units.<br />
(j) Government assistance and grants<br />
The Trust receives government assistance in order to complement and partially assist the Trust’s initiatives in providing affordable<br />
housing to low income earning individuals. Government grants are not recognized until there is reasonable assurance that the Trust<br />
will comply with the conditions attached to them and that the grants will be received.<br />
(k)<br />
Revenue recognition<br />
(i) Rental revenue<br />
The Trust has retained substantially all of the risks and benefits of ownership of its investment properties and, therefore, accounts<br />
for leases with its tenants as operating leases. Revenue recognition under a lease commences when the tenant has a right to<br />
use the leased asset. Generally, this occurs on lease inception date when the tenant occupies their leased space. Rental revenue<br />
is recognized systematically over the term of the lease, which is generally not more than twelve months. Any suite specific<br />
incentives offered or initial direct costs incurred in negotiating and arranging an operating lease are also amortized over the<br />
term of the operating lease. Rental revenue is recorded based on the amount received or to be received in accordance with the<br />
operating lease.<br />
(ii) Building sales<br />
The gain or loss from the sale of an investment property is recognized when title passes to the purchaser (control is transferred)<br />
upon closing, at which time all, or substantially all, of the funds are receivable, or have been received, and the conditions of the<br />
sale have been completed.<br />
(iii) Interest income<br />
Interest income from a financial asset is recognized when it is probable that the economic benefits will flow to the Trust and the<br />
amount of income can be measured reliably. Interest income is accrued on a time basis when earned, by reference to the principal<br />
outstanding and at the effective interest rate applicable. Interest income is included in financing costs in the consolidated<br />
statement of comprehensive income.<br />
(iv) Ancillary rental income<br />
Ancillary rental income comprises revenue from coin laundry machines and income received from telephone and cable providers<br />
and is recorded as earned.<br />
<strong>Boardwalk</strong> <strong>REIT</strong> / ar <strong>2012</strong><br />
MANAGEMENT’s DISCUSSION and analySIS / 81
(l) Financial instruments and derivatives<br />
Financial instruments and derivatives are accounted, presented, and disclosed in accordance with IFRS 7 – Financial Instruments:<br />
Disclosures (“IFRS 7”), IAS 32 and IAS 39. Financial assets and financial liabilities are initially measured at fair value. Transaction costs<br />
that are directly attributable to the acquisition or issue of financial assets and financial liabilities (other than financial assets and<br />
financial liabilities at fair value through profit or loss) are added to, or deducted from, the fair value of the financial assets or financial<br />
liabilities, as appropriate, on initial recognition. Transaction costs directly attributable to the acquisition of financial assets or financial<br />
liabilities at fair value through profit or loss are recognized immediately in profit or loss.<br />
Financial assets<br />
Financial assets are classified into the following specified categories: financial assets at ‘fair value through profit or loss’ (“FVTPL”),<br />
‘held-to-maturity’ investments, ‘available-for-sale’ financial assets and ‘loans and receivables’. The classification depends on the<br />
nature and purpose of the financial asset and is determined at the time of initial recognition. Financial assets are classified as at FVTPL<br />
when the financial asset either is held for trading or is designated as at FVTPL. Financial assets categories are defined and measured<br />
as follows:<br />
Classification Definition Measurement<br />
FVTPL<br />
Classified as FVTPL when the financial asset is either held for trading or it is<br />
designated as at FVTPL as discussed below:<br />
Held-to-maturity<br />
investments<br />
Available-for-sale<br />
Loans and<br />
receivables<br />
Classified as held for trading if: it has been acquired principally for the purpose<br />
of selling it in the near term; or on initial recognition it is part of a portfolio<br />
of identified financial instruments that the Trust manages together and has a<br />
recent actual pattern of short-term profit taking; or it is a derivative that is not<br />
designated and effective as a hedging instrument.<br />
Classified as FVTPL upon initial recognition if: such designation eliminates or<br />
significantly reduces a measurement or recognition inconsistency that would<br />
otherwise arise; or the financial asset forms part of a group which is managed<br />
and its performance is evaluated on a fair value basis; or it forms part of a<br />
contract containing one or more embedded derivatives.<br />
Non-derivative financial assets with fixed or determinable payments and<br />
fixed maturity dates that the Trust has the positive intent and ability to hold to<br />
maturity.<br />
Non-derivative financial assets that either are designated as available-for-sale or<br />
are not classified as (a) loans and receivables, (b) held-to-maturity investments<br />
or (c) financial assets at FVTPL.<br />
Non-derivative financial assets with fixed or determinable payments that are<br />
not quoted in an active market.<br />
Stated at fair value, with gains or<br />
losses arising on measurement<br />
recognized in profit or loss.<br />
Stated at fair value, with gains or<br />
losses arising on measurement<br />
recognized in profit or loss.<br />
Measured at amortized cost using<br />
the effective interest method less<br />
(1) (2)<br />
any impairment.<br />
Measured at fair value through<br />
other comprehensive income.<br />
Measured at amortized cost using<br />
the effective interest method less<br />
(1) (2)<br />
any impairment.<br />
(1) The effective interest method is a method of calculating the amortized cost of a debt instrument and of allocating interest income over the relevant<br />
period. The effective interest rate is the rate that exactly discounts estimated future cash receipts through the expected life of the debt instrument or<br />
where appropriate, a shorter period, to the net carrying amount on initial recognition.<br />
(2) Financial assets, other than those at FVTPL, are assessed for indicators of impairment at the end of each reporting period. Generally, the carrying amount<br />
of the financial asset is reduced by the impairment loss.<br />
82 / MANAGEMENT’s DISCUSSION and analySIS <strong>Boardwalk</strong> <strong>REIT</strong> / ar <strong>2012</strong>
<strong>Boardwalk</strong> <strong>REIT</strong>’s financial assets are as follow:<br />
Financial asset Classification Measurement<br />
Trade and other receivables Loans and receivables Amortized cost<br />
Segregated tenants’ security deposits Loans and receivables Amortized cost<br />
Cash Loans and receivables Amortized cost<br />
The Trust derecognizes a financial asset only when the contractual rights to the cash flows from the asset expire, or when it transfers<br />
the financial asset (and substantially all the risks and rewards of ownership of the asset) to another entity.<br />
Financial liabilities and equity<br />
Debt and equity instruments issued are classified either as financial liabilities or as equity in accordance with the substance of the<br />
contractual arrangements and the definitions of a financial liability and an equity instrument. An equity instrument is any contract<br />
that evidences a residual interest in the assets of an entity after deducting all of its liabilities. Equity instruments issued by the Trust<br />
are recognized at the proceeds received, net of direct issue costs. Repurchase of <strong>Boardwalk</strong> <strong>REIT</strong>’s own equity instruments is recognized<br />
and deducted directly in equity. No gain or loss is recognized in profit or loss on the purchase, sale, issue or cancellation of<br />
the Trust’s own equity instruments. Distributions paid on the Trust’s equity instruments subsequent to, declared prior to, and with a<br />
record date at or prior to, the reporting date, are recorded as a liability.<br />
Financial liabilities are classified as either financial liabilities ‘at FVTPL’ or ‘other financial liabilities’. Financial liabilities categories are<br />
defined and measured as follows:<br />
Classification Definition Measurement<br />
FVTPL<br />
Classified as FVTPL when the financial liability is either held for trading or it is<br />
designated as at FVTPL as discussed below:<br />
Other financial<br />
liabilities<br />
Classified as held for trading if: it has been acquired principally for the purpose<br />
of repurchasing it in the near term; or on initial recognition it is part of a portfolio<br />
of identified financial instruments that the Trust manages together and has<br />
a recent actual pattern of short-term profit taking; or it is a derivative that is not<br />
designated and effective as a hedging instrument.<br />
Classified as FVTPL upon initial recognition if: such designation eliminates or<br />
significantly reduces a measurement or recognition inconsistency that would<br />
otherwise arise; or the financial liability forms part of a group which is managed<br />
and its performance is evaluated on a fair value basis; or it forms part of a<br />
contract containing one or more embedded derivatives.<br />
All other liabilities.<br />
Stated at fair value, with gains or<br />
losses arising on measurement<br />
recognized in profit or loss.<br />
Stated at fair value, with gains or<br />
losses arising on measurement<br />
recognized in profit or loss.<br />
Measured at amortized cost using<br />
the effective interest method. (1)<br />
(1) The effective interest method is a method of calculating the amortized cost of a financial liability and of allocating interest expense over the relevant<br />
period. The effective interest rate is the rate that exactly discounts estimated future cash payments through the expected life of the financial liability or<br />
where appropriate, a shorter period, to the net carrying amount on initial recognition.<br />
<strong>Boardwalk</strong> <strong>REIT</strong> / ar <strong>2012</strong><br />
MANAGEMENT’s DISCUSSION and analySIS / 83
<strong>Boardwalk</strong> <strong>REIT</strong>’s financial liabilities are as follows:<br />
Financial liability Classification Measurement<br />
Mortgages payable Other financial liabilities Amortized cost<br />
Debentures Other financial liabilities Amortized cost<br />
LP Class B Units FVTPL Fair value<br />
Deferred unit-based compensation FVTPL Fair value<br />
Refundable tenants’ security deposits Other financial liabilities Amortized cost<br />
Trade and other payables Other financial liabilities Amortized cost<br />
The Trust derecognizes a financial liability when, and only when, the Trust’s obligations are discharged, cancelled, or they expire. The<br />
difference between the carrying amount of the financial liability derecognized and the consideration paid and payable is recognized<br />
in profit or loss.<br />
Derivatives<br />
The Trust may enter into a variety of derivative financial instruments to manage its exposure to interest rate risks, including interest<br />
rate swaps and bond forward contracts. Further details of derivative financial instruments are disclosed in NOTE 13 and NOTE 28.<br />
Derivatives are initially recognized at fair value at the date the derivative contracts are entered into and are subsequently measured<br />
at their fair value at the end of each reporting period. The resulting gain or loss is recognized in profit or loss immediately unless the<br />
derivative is designated, and effective, as a hedging instrument, in which case the timing of the recognition in profit or loss depends<br />
on the nature of the hedge relationship. Derivatives embedded in host contracts are treated as separate derivatives when their risks<br />
and characteristics are not closely related to the host contracts and the host contracts are not measured at FVTPL. For the years ended<br />
December 31, <strong>2012</strong> and December 31, 2011, the Trust had no embedded derivatives requiring separate recognition.<br />
(m) Hedge accounting<br />
The Trust applies hedge accounting to derivative financial instruments in cash flow hedging relationships. At the inception of the<br />
hedging relationship, the Trust documents the relationship between the hedging instrument and the hedged item, along with its risk<br />
management objectives and its strategy for undertaking various hedge transactions. Furthermore, at inception of the hedge and on<br />
an ongoing basis, the Trust documents whether the hedging instrument is highly effective in offsetting changes in cash flows of the<br />
hedged item attributable to the hedged risk.<br />
In cash flow hedging relationships, the effective portion of the change in the fair value of the hedging derivative is recognized in the<br />
consolidated statement of comprehensive income as other comprehensive income (“OCI”) while the ineffective portion is recognized<br />
immediately in profit or loss. Hedging gains and losses previously recognized in OCI and accumulated in equity are reclassified to<br />
profit or loss in the periods when the hedged item is recognized in profit or loss, in the same line of the consolidated statement of<br />
comprehensive income as the recognized hedged item.<br />
Hedge accounting is discontinued when the Trust revokes the hedging relationship, when the hedging instrument expires or is sold,<br />
terminated, or exercised, or when it no longer qualifies for hedge accounting. Any gain or loss recognized in OCI, and accumulated<br />
in equity at that time, remains in equity, and is recognized when the forecast transaction is ultimately recognized in profit or loss.<br />
When a forecast transaction is no longer expected to occur, the gain or loss accumulated in equity is recognized immediately in profit<br />
or loss.<br />
84 / MANAGEMENT’s DISCUSSION and analySIS <strong>Boardwalk</strong> <strong>REIT</strong> / ar <strong>2012</strong>
(n) Cash<br />
Cash is comprised of bank balances and interest-earning bank accounts.<br />
(o) Critical judgment in applying accounting policies<br />
The following are the critical judgments, apart from those involving estimations (see below) that have been made in applying the<br />
Trust’s accounting policies and that have the most significant effect on the reported amounts in the consolidated financial statements:<br />
(i) Income taxes<br />
The Trust applies judgment in determining the tax rate applicable to its corporate, trust, and partnership subsidiaries, and in<br />
identifying the temporary differences in each such legal subsidiaries in respect of which deferred income taxes are recognized.<br />
Deferred taxes related to temporary differences arising from its corporate subsidiaries are measured based on the tax rates that<br />
are expected to apply in the year when the asset is realized or the liability is settled. Temporary differences are differences that<br />
are expected to reverse in the future and arise from differences between accounting and tax asset values. Effective January<br />
1, 2011, the Trust qualified for the “<strong>REIT</strong> Exemption” and will not be subject to Canadian income taxes under the SIFT Rules.<br />
Consequently, the deferred taxes related to temporary differences arising from the SIFT Rules prior to the beginning of the 2011<br />
fiscal year were reversed on January 1, 2011.<br />
(ii) Leases<br />
The Trust’s revenue recognition policy related to leases is described in NOTE 2(n)(i). The Trust makes judgments in determining<br />
whether certain leases, in particular, tenant leases, as well as leased warehouse space and long-term ground leases, which are<br />
considered leases under IFRS, and where the Trust is the lessor, are operating or finance leases. The Trust has determined that all<br />
of its leases are operating leases.<br />
(iii) Investment property and internal capital program<br />
The Trust’s accounting policy relating to investment property is described in NOTE (a) above. In applying this policy, judgment<br />
is applied in determining the extent and frequency of utilizing independent, third-party appraisals to measure the fair value<br />
of the Trust’s investment property. The Trust also undertakes capital improvements and upgrades. Such work is specifically<br />
identified, and the Trust applies judgment in the estimated amount of directly attributable to on-site wages relating to capital<br />
improvements and upgrades of its real estate assets to be capitalized.<br />
(iv) Financial instruments<br />
The Trust’s accounting policies relating to financial instruments are described in NOTE 2(o). Critical judgments inherent in these<br />
policies and related to applying the criteria set out in IAS 39 to designate financial instruments into categories (i.e. FVTPL, etc.)<br />
assess the effectiveness of hedging relationships (for the Trust’s cash flow hedges) and determine the identification of embedded<br />
derivatives, if any, in certain hybrid instruments that are subject to fair value measurement.<br />
(v) Basis of consolidation<br />
The consolidated financial statements of the Trust include the accounts of <strong>Boardwalk</strong> <strong>REIT</strong> and its wholly owned subsidiaries,<br />
as well as entities over which the Trust exercises control on a basis other than ownership of voting interest within the scope of<br />
Interpretation SIC 12 - Consolidation-Special Purpose Entities (“SIC 12”). Judgment is applied in determining what is considered<br />
in substance “control” within the scope of SIC 12 and, thus, entities considered special purpose entities are to be included in the<br />
consolidated financial statements of the Trust.<br />
<strong>Boardwalk</strong> <strong>REIT</strong> / ar <strong>2012</strong><br />
MANAGEMENT’s DISCUSSION and analySIS / 85
(p) Key accounting estimates and assumptions<br />
The following are the key assumptions concerning the future, and other key sources of estimation uncertainty at the end of the<br />
reporting period, that have a significant risk of causing a material adjustment to the carrying amounts of assets and liabilities within<br />
the next financial year. Actual results could differ from estimates.<br />
(i) Investment property<br />
The choice of valuation method for fair valuing and the critical estimates and assumptions underlying the fair value determination<br />
of investment properties are set out in NOTE 4 of the consolidated financial statements. Significant estimates used in<br />
determining the fair value of the Trust’s investment properties includes capitalization rates and net operating income (which is<br />
influenced by inflation rates, vacancy rates, and standard costs) used in the overall capitalization rate valuation method as well<br />
as discount rates and forecasted cash flows used in the discounted cash flow valuation method. A change to any one of these<br />
inputs could significantly alter the fair value of an investment property. Please refer to NOTE 4 for sensitivity analysis.<br />
Property, plant and equipment<br />
Useful economic life of property, plant and equipment for the purposes of calculating depreciation and amortization, as disclosed<br />
in NOTE 5, and forecast of economic factors to determine recoverable amounts for the purpose of determining any<br />
impairment of assets.<br />
(ii) Internal Capital Program<br />
The Trust’s internal capital program is based on internal allocations including parts, supplies and on-site wages identified as part<br />
of the specific upgrade.<br />
(iii) Utility accrual<br />
Amount of utility accrual for charges related to the current or prior year is based on estimates of usage and price for the time<br />
period in which invoices have not been received from the utility providers.<br />
(iv) Deferred unit-based compensation plan<br />
The compensation costs relating to the deferred unit plan are based on estimates of how many deferred units will actually vest<br />
and be exercised.<br />
(v) Deferred taxes<br />
The amount of the temporary differences between the accounting carrying value of the Trust’s assets and liabilities versus the<br />
tax basis of those assets and liabilities, and the tax rates at which the differences will be realized, are outlined in NOTE 16.<br />
86 / MANAGEMENT’s DISCUSSION and analySIS <strong>Boardwalk</strong> <strong>REIT</strong> / ar <strong>2012</strong>
Future Changes in Critical Accounting Policies<br />
<strong>Boardwalk</strong> <strong>REIT</strong> monitors new IFRS accounting pronouncements to assess the applicability and impact, if any, these new pronouncements<br />
may have on the consolidated financial statements and note disclosures.<br />
The following accounting standards under IFRS have been issued or revised, however are not yet effective, and, as such, have not<br />
been applied to these consolidated financial statements:<br />
Financial Instruments<br />
IFRS 7 – Financial Instruments: Disclosures (“IFRS 7”), has been amended to include information regarding all recognized financial<br />
instruments that are set off in accordance with paragraph 42 of IAS 32. The amendment also requires disclosure of information about<br />
recognized financial instruments subject to enforceable master netting arrangements and similar agreements, even if they are not<br />
set off under IAS 32. The amendment is applicable for periods beginning on, or after, January 1, 2013, and must be applied retrospectively<br />
to all comparative periods.<br />
IFRS 9 – Financial Instruments (“IFRS 9”), was issued in November 2009, and addresses classification and measurement of financial<br />
assets. It replaces the multiple category and measurement models in IAS 39 for debt instruments with a new mixed measurement<br />
model having only two categories: amortized cost and fair value through profit or loss. IFRS 9 also replaces the models for measuring<br />
equity instruments. Such instruments are either recognized at fair value through profit or loss or at fair value through other<br />
comprehensive income. Where equity instruments are measured at fair value through other comprehensive income, dividends are<br />
recognized in profit or loss to the extent that they do not clearly represent a return of investment; however, other gains and losses<br />
(including impairments) associated with such instruments remain in accumulated comprehensive income indefinitely.<br />
Requirements for financial liabilities were added to IFRS 9 in October 2010 and they largely carried forward existing requirements in<br />
IAS 39, Financial Instruments – Recognition and Measurement, except that fair value changes due to credit risk for liabilities designated<br />
at fair value through profit and loss are generally recorded in other comprehensive income. The amendment is applicable for<br />
<strong>annual</strong> periods beginning on, or after, January 1, 2015, with earlier application permitted.<br />
The Trust does not expect these amendments to have a significant impact on its consolidated financial statements.<br />
Consolidated Financial Statements<br />
In June 2011, the IASB issued IFRS 10 – Consolidated Financial Statements (“IFRS 10”) to replace Standing Interpretations Committee<br />
12 – Consolidation – Special Purpose Entities and the new consolidation requirements of IAS 27 – Consolidated and Separate Financial<br />
Statements (“IAS 27”) (discussed below). IFRS 10 eliminates the current risk and rewards approach and establishes control as the single<br />
basis for determining the consolidation of an entity. The standard provides guidance on how to apply the control principles in a<br />
number of situations, including agency relationships and holding or potential voting rights. This standard is required to be applied<br />
for accounting periods beginning on, or after, January 1, 2013. The Trust does not expect IFRS 10 to have a significant impact on its<br />
consolidated financial statements.<br />
IAS 27 was revised in May 2011 to eliminate the principles of consolidation from IAS 27 (as they are now included in IFRS 10) and focus<br />
on requirements related to disclosure requirements for investments in subsidiaries, joint ventures and associates when an entity<br />
prepares separate financial statements. The Trust does not expect these amendments to have a significant impact on its consolidated<br />
financial statements.<br />
<strong>Boardwalk</strong> <strong>REIT</strong> / ar <strong>2012</strong><br />
MANAGEMENT’s DISCUSSION and analySIS / 87
Joint Arrangements<br />
IFRS 11 – Joint Arrangements (“IFRS 11”) was issued in June 2011 and is the result of the IASB’s project to replace IAS 31 – Interests in Joint<br />
Ventures (“IAS 31”). The new standard redefines joint operations and joint ventures and requires joint operations to be proportionately<br />
consolidated and joint ventures to be equity accounted. Under IAS 31, joint ventures could be proportionately accounted. This<br />
standard is required to be applied for accounting periods beginning on, or after, January 1, 2013, with early adoption permitted. The<br />
Trust does not expect this standard to have a significant impact on its consolidated financial statements.<br />
IAS 28 – Investments in Associates and Joint Ventures (“IAS 28”) was revised in May 2011 and prescribes the accounting for investments<br />
in associates, and sets out the requirements for the application of the equity method when accounting for investments in associates<br />
and joint ventures. This standard is to be applied for accounting periods beginning on, or after, January 1, 2013, with early adoption<br />
permitted. The Trust does not expect these amendments to have a significant impact on its consolidated financial statements.<br />
Disclosure of Interests in Other Entities<br />
IFRS 12 – Disclosure of Interests in Other Entities (“IFRS 12”) was issued in June 2011 and outlines the required disclosures for interests<br />
in subsidiaries and joint arrangements. The new disclosures require information that will assist financial statement users to evaluate<br />
the nature, risks, and financial effects associated with an entity’s interests in subsidiaries and joint arrangements. This standard is<br />
required to be applied for accounting periods beginning on, or after, January 1, 2013, with early adoption permitted. The Trust does<br />
not expect IFRS 12 to have a significant impact on its consolidated financial statements.<br />
Fair Value Measurements<br />
IFRS 13 – Fair Value Measurements (“IFRS 13”) establishes a single source of guidance for fair value measurements and disclosures about<br />
fair value measurements. The Standard defines fair value, establishes a framework for measuring fair value, and requires disclosures<br />
about fair value measurements. The scope of IFRS 13 is broad; it applies to both financial instrument items and non-financial instrument<br />
items for which other IFRSs require or permit fair value measurements and disclosures about fair value measurements, except<br />
in specified circumstances. In general, the disclosure requirements in IFRS 13 are more extensive than those required in the current<br />
standards. For example, quantitative and qualitative disclosures based on the three-level fair value hierarchy currently required for<br />
financial instruments only under IFRS 7 will be extended by IFRS 13 to cover all assets and liabilities within its scope.<br />
IFRS 13 is effective for <strong>annual</strong> periods beginning on or after 1 January 2013, with earlier application permitted.<br />
The Trust does not expect IFRS 13 to have a significant impact on its consolidated financial statements, but may result in more extensive<br />
disclosures in the financial statements.<br />
Employee Benefits<br />
IAS 19 – Employee Benefits (“IAS 19”) amendments, issued in June 2011, will change the accounting for defined benefit plans and<br />
termination benefits. This standard requires that the changes in defined benefit obligations are recognized as they occur, eliminating<br />
the corridor approach and accelerating the recognition of past service costs. The changes in defined benefit obligation and plan<br />
assets are to be disaggregated into three components: service costs, net interest on the net defined benefit liabilities (assets) and<br />
remeasurements of the net defined benefit liabilities (assets). This standard will apply for accounting periods beginning on, or after,<br />
January 1, 2013, with early adoption permitted. The Trust does not expect the amendments to IAS 19 to have a significant impact on<br />
its consolidated financial statements.<br />
88 / MANAGEMENT’s DISCUSSION and analySIS <strong>Boardwalk</strong> <strong>REIT</strong> / ar <strong>2012</strong>
Presentation of Financial Statements<br />
IAS 1 was amended in 2011 to expand on the disclosures required of items within Other Comprehensive Income. The revised standard<br />
requires that an entity distinguishes between those items that are recycled to profit and loss versus those items that are not recycled.<br />
Retrospective application is required and the standard is effective for <strong>annual</strong> periods beginning on, or after, July 1, <strong>2012</strong>. The Trust<br />
does not expect the amendments to IAS 1 to have a significant impact on its consolidated financial statements.<br />
International Financial Reporting Standards<br />
These Consolidated Financial Statements have been prepared in accordance with International Financial Reporting Standards<br />
as issued by the International Accounting Standards Board (“IASB”) and interpretations of the International Financial Reporting<br />
Interpretations Committee (“IFRIC”).<br />
Disclosure Controls and Procedures & Internal Control Over Financial Reporting<br />
Disclosure controls and procedures are designed to provide reasonable assurance that all relevant information is gathered and<br />
reported to senior management, including the CEO, President, and CFO on a timely basis so appropriate decisions can be made<br />
regarding public disclosure.<br />
The preparation of this information is supported by a set of disclosure controls and procedures implemented by management. In<br />
fiscal <strong>2012</strong>, these controls and procedures were reviewed and the effectiveness of their design and operation was evaluated. This<br />
evaluation confirmed the effectiveness of the design and operation of disclosure controls and procedures as at December 31,<br />
<strong>2012</strong>. The evaluation was performed in accordance with the Committee of Sponsoring Organizations of the Treadway Commission<br />
(“COSO”) control framework adopted by the Trust and the requirements of National Instrument 52-109 of the Canadian Securities<br />
Administrators titled, ‘Certification of Disclosure in Issuers’ Annual and Interim Filings’.<br />
<strong>Boardwalk</strong> <strong>REIT</strong> continues to review the design of disclosure controls and procedures to provide reasonable assurance that material<br />
information relating to <strong>Boardwalk</strong> <strong>REIT</strong> is made known to the CEO, President, and CFO.<br />
As at December 31, <strong>2012</strong>, <strong>Boardwalk</strong> <strong>REIT</strong> confirmed the effectiveness of the design of internal controls over financial reporting (“ICFR”)<br />
to provide reasonable assurance regarding the reliability of financial statements and information. <strong>Boardwalk</strong> <strong>REIT</strong> may, from time to<br />
time, make changes aimed at enhancing their effectiveness and ensuring that our systems evolve with our business. There were no<br />
changes made in our internal controls over financial reporting during the year ended December 31, <strong>2012</strong>, that have materially affected,<br />
or are reasonably likely to materially affect, our internal controls over financial reporting.<br />
<strong>Boardwalk</strong> <strong>REIT</strong> / ar <strong>2012</strong><br />
MANAGEMENT’s DISCUSSION and analySIS / 89
2013 Financial Outlook and Market Guidance<br />
At the end of the third quarter of <strong>2012</strong>, the Trust announced its financial outlook for the upcoming 2013 year. The following table<br />
highlights the key financial objectives for the 2013 fiscal year as well as our performance for the <strong>2012</strong> year.<br />
Description 2013 Objectives <strong>2012</strong> Actual<br />
Acquisitions No new apartment acquisitions No new apartment acquisitions<br />
Stabilized Building NOI growth 1% to 4% 5.0%<br />
FFO Per Unit $2.95 to $3.15 $2.87<br />
AFFO Per Unit $2.63 to $2.83 $2.57<br />
In deriving these forecasts, we have adjusted for the treatment of the LP B Units to be treated as equity (versus debt under IFRS) and<br />
their related treatment of the distributions paid (which are classified as financing charges under IFRS). In addition, we are assuming<br />
no additional acquisition or disposition of properties.<br />
The reader is cautioned that this information is forward-looking and actual results may vary materially from those reported. One of<br />
the key estimates is the performance of the Trust’s stabilized properties. Any significant change in assumptions deriving ‘Stabilized<br />
Building NOI performance’ would have a material effect on the final reported amount. The trust reviews these key assumptions<br />
quarterly and based on this review may change its outlook.<br />
In addition to the above financial guidance for 2013, the Trust has assumed the following capital will be reinvested in its existing<br />
portfolio for the 2013 fiscal year.<br />
Capital Budget 2013 Budget Per Suite <strong>2012</strong> Actual Per Suite<br />
Total Operational Capital Approved $ 91,700 $ 2,599 $ 83,120 $ 2,356<br />
Maintenance Capital $ 16,800 $ 475 $ 15,875 $ 450<br />
Stabilizing & Value Added Capital $ 74,900 $ 2,124 $ 67,245 $ 1,906<br />
$ 91,700 $ 2,599 $ 83,120 $ 2,356<br />
Development Capital Approved $ 21,000<br />
In total, we expect to invest $91.7 million (or $2,599 per apartment unit) on operational capital in 2013 as compared to $83.1 million<br />
(or $2,356 per apartment unit) actually spent in <strong>2012</strong>. Approximately $16.8 million, or $475 per apartment unit, will be in the form of<br />
maintenance capital and the balance of $74.9 million will be in stabilizing and value-added capital. The increase in maintenance<br />
capital, from $450 to $475 per apartment unit, is primarily due to price inflation expectations.<br />
Selected Consolidated Financial InfoRMation<br />
The following selected financial information should be read in conjunction with ‘‘Management’s Discussion and Analysis’’, the audited<br />
consolidated financial statements and accompanying notes for the years ended December 31, <strong>2012</strong> and 2011, and the unaudited<br />
interim consolidated financial statements of <strong>Boardwalk</strong> <strong>REIT</strong> and accompanying notes, both incorporated herein by reference.<br />
The statements of comprehensive income and financial position information set forth in the following tables has been derived from<br />
the audited consolidated financial statements referred to above and the unaudited consolidated financial statements of the Trust for<br />
various quarterly interim periods.<br />
90 / MANAGEMENT’s DISCUSSION and analySIS <strong>Boardwalk</strong> <strong>REIT</strong> / ar <strong>2012</strong>
Annual Comparative<br />
Twelve Months Ended<br />
Cdn$ Thousands, except per unit amount<br />
Dec 31, <strong>2012</strong> Dec 31, 2011<br />
Total rental revenue 439,901 422,727<br />
Profit 688,514 1,225,086<br />
Funds from operations 150,343 131,808<br />
Profit per unit<br />
– Basic 14.40 25.64<br />
– Diluted 14.40 24.40<br />
Funds from operations per unit<br />
– Basic 3.14 2.76<br />
– Diluted 2.87 2.52<br />
Mortgages and debentures 2,248,176 2,331,121<br />
Total assets 5,675,302 5,089,023<br />
Number of apartment units 35,277 35,277<br />
Rentable square feet (000’s) 29,936 29,936<br />
Quarterly Comparative<br />
Cdn$ Thousands, except per unit amounts<br />
Dec 31,<br />
<strong>2012</strong><br />
Sep 30,<br />
<strong>2012</strong><br />
Jun 30,<br />
<strong>2012</strong><br />
Three Months Ended<br />
Mar 31,<br />
<strong>2012</strong><br />
Dec 31,<br />
2011<br />
Sep 30,<br />
2011<br />
Jun 30,<br />
2011<br />
Mar 31,<br />
2011<br />
Total rental revenue 112,049 110,595 109,269 107,988 107,073 105,994 105,364 104,296<br />
Profit 15,565 293,977 161,628 217,344 136,894 169,087 196,591 722,514<br />
Funds from operations 38,395 39,401 38,274 34,273 34,170 34,806 34,700 28,132<br />
Profit per unit<br />
– Basic 0.32 6.15 3.38 4.55 2.88 3.54 4.12 15.10<br />
– Diluted 0.32 6.15 3.38 4.55 2.86 3.27 3.82 14.45<br />
Funds from operations per unit<br />
– Basic 0.80 0.82 0.80 0.72 0.71 0.73 0.73 0.59<br />
– Diluted 0.73 0.75 0.73 0.66 0.65 0.67 0.66 0.54<br />
Additional InfoRMation<br />
Additional information relating to <strong>Boardwalk</strong> Equities Inc. and <strong>Boardwalk</strong> <strong>REIT</strong>, including the Annual Information Form of <strong>Boardwalk</strong><br />
<strong>REIT</strong>, is available on SEDAR at www.sedar.com.<br />
Respectfully,<br />
Roberto A. Geremia<br />
President<br />
February 13, 2013<br />
William Wong<br />
Chief Financial Officer<br />
<strong>Boardwalk</strong> <strong>REIT</strong> / ar <strong>2012</strong><br />
MANAGEMENT’s DISCUSSION and analySIS / 91
Management’s Report<br />
To the Unitholders of <strong>Boardwalk</strong> Real Estate Investment Trust<br />
The accompanying consolidated financial statements and all information in the Annual Report are the responsibility of management.<br />
The consolidated financial statements have been prepared by management in accordance with the accounting policies in the notes<br />
to the consolidated financial statements. In the opinion of management, the consolidated financial statements have been prepared<br />
within acceptable limits of materiality, and are in accordance with International Financial Reporting Standards appropriate in the<br />
circumstances. The financial information elsewhere in the Annual Report has been reviewed to ensure consistency with that in the<br />
consolidated financial statements.<br />
Management maintains appropriate systems of internal control. Policies and procedures are designed to give reasonable assurance<br />
that transactions are properly authorized, assets are safeguarded and financial records properly maintained to provide reliable information<br />
for the preparation of consolidated financial statements.<br />
The consolidated financial statements have been further examined by the Board of Trustees and by its Audit and Risk Management<br />
Committee which meets regularly with the auditors and management to review the activities of each. The Audit and Risk Management<br />
Committee, which comprises of three independent trustees, reports to the Board of Trustees.<br />
Deloitte LLP, an independent firm of chartered accountants, has been engaged to audit the consolidated financial statements in<br />
accordance with Canadian generally accepted auditing standards and provide an independent auditors’ opinion.<br />
Sam Kolias Roberto A. Geremia William Wong<br />
Chief Executive Officer President Chief Financial Officer<br />
February 13, 2013<br />
92 / MANAGEMENT’s REPORT<br />
<strong>Boardwalk</strong> <strong>REIT</strong> / ar <strong>2012</strong>
INDepenDent AUDitoRs’ RepoRT<br />
To the Unitholders of <strong>Boardwalk</strong> Real Estate Investment Trust<br />
We have audited the accompanying consolidated financial statements of <strong>Boardwalk</strong> Real Estate Investment Trust, which comprise<br />
the consolidated statements of financial position as at December 31, <strong>2012</strong> and December 31, 2011, and the consolidated statements of<br />
comprehensive income, consolidated statements of changes in unitholders’ equity and consolidated statements of cash flows for the<br />
years ended December 31, <strong>2012</strong> and December 31, 2011, and the notes to the consolidated financial statements.<br />
Management’s Responsibility for the Consolidated Financial Statements<br />
Management is responsible for the preparation and fair presentation of these consolidated financial statements in accordance with<br />
International Financial Reporting Standards, and for such internal control as management determines is necessary to enable the<br />
preparation of consolidated financial statements that are free from material misstatement, whether due to fraud or error.<br />
Auditor’s Responsibility<br />
Our responsibility is to express an opinion on these consolidated financial statements based on our audits. We conducted our<br />
audits in accordance with Canadian generally accepted auditing standards. Those standards require that we comply with ethical<br />
requirements and plan and perform the audit to obtain reasonable assurance about whether the consolidated financial statements<br />
are free from material misstatement.<br />
An audit involves performing procedures to obtain audit evidence about the amounts and disclosures in the consolidated<br />
financial statements. The procedures selected depend on the auditor’s judgment, including the assessment of the risks of material<br />
misstatement of the consolidated financial statements, whether due to fraud or error. In making those risk assessments, the auditor<br />
considers internal control relevant to the entity’s preparation and fair presentation of the consolidated financial statements in order<br />
to design audit procedures that are appropriate in the circumstances, but not for the purpose of expressing an opinion on the<br />
effectiveness of the entity’s internal control. An audit also includes evaluating the appropriateness of accounting policies used and<br />
the reasonableness of accounting estimates made by management, as well as evaluating the overall presentation of the consolidated<br />
financial statements.<br />
We believe that the audit evidence we have obtained in our audits is sufficient and appropriate to provide a basis for our audit<br />
opinion.<br />
Opinion<br />
In our opinion, the consolidated financial statements present fairly, in all material respects, the financial position of <strong>Boardwalk</strong> Real<br />
Estate Investment Trust as at December 31, <strong>2012</strong> and December 31, 2011, and its financial performance and its cash flows for the years<br />
ended December 31, <strong>2012</strong> and December 31, 2011 in accordance with International Financial Reporting Standards.<br />
Deloitte LLP<br />
Chartered Accountants<br />
Calgary, Alberta<br />
February 12, 2013<br />
<strong>Boardwalk</strong> <strong>REIT</strong> / ar <strong>2012</strong> INDEPENDENT AUDITORS’ REPORT / 93
Consolidated Statements of Financial Position<br />
(CDN $ THOUSANDS)<br />
As at Note Dec 31, <strong>2012</strong> Dec 31, 2011<br />
Assets<br />
Non-current assets<br />
Investment properties 4 $ 5,493,448 $ 4,793,895<br />
Property, plant and equipment 5 20,677 18,260<br />
Deferred tax assets 16 945 725<br />
5,515,070 4,812,880<br />
Current assets<br />
Inventories 6 3,233 2,640<br />
Prepaid assets 7 3,792 3,838<br />
Trade and other receivables 8 2,461 2,210<br />
Segregated tenants’ security deposits 9 12,090 11,561<br />
Cash 138,656 255,894<br />
160,232 276,143<br />
Total Assets $ 5,675,302 $ 5,089,023<br />
Liabilities<br />
Non-current liabilities<br />
Mortgages payable 10 $ 1,922,166 $ 1,720,951<br />
LP Class B Units 12 288,772 225,719<br />
Other non-current liabilities 13 5,452 8,282<br />
Deferred unit-based compensation 14 5,306 4,396<br />
Deferred tax liabilities 16 7 10<br />
Deferred government grant 17 2,283 –<br />
2,223,986 1,959,358<br />
Current liabilities<br />
Mortgages payable 10 326,010 497,780<br />
Debentures 11 – 112,390<br />
Deferred unit-based compensation 14 3,765 2,636<br />
Refundable tenants’ security deposits 15,718 15,126<br />
Trade and other payables 15 55,722 56,943<br />
401,215 684,875<br />
Total Liabilities $ 2,625,201 $ 2,644,233<br />
Equity<br />
Unitholders’ equity 18 $ 3,050,101 $ 2,444,790<br />
Total Equity $ 3,050,101 $ 2,444,790<br />
Total Liabilities and Equity $ 5,675,302 $ 5,089,023<br />
See accompanying notes to these consolidated financial statements<br />
On behalf of the Trust:<br />
Sam Kolias<br />
Trustee<br />
Gary Goodman<br />
Trustee<br />
94 / CONSOLIDATED FINANCIAL STATEMENTS<br />
<strong>Boardwalk</strong> <strong>REIT</strong> / ar <strong>2012</strong>
Consolidated Statements of Comprehensive Income<br />
(CDN $ THOUSANDS)<br />
Note<br />
Year ended<br />
Dec 31, <strong>2012</strong><br />
Year ended<br />
Dec 31, 2011<br />
Rental revenue 19 $ 433,205 $ 416,152<br />
Ancillary rental income 20 6,696 6,575<br />
Total rental revenue 439,901 422,727<br />
Rental expenses<br />
Operating expenses 87,143 84,400<br />
Utilities 39,921 40,340<br />
Property taxes 36,773 35,328<br />
Net operating income 276,064 262,659<br />
Financing costs 21 98,062 105,569<br />
Administration 28,909 26,264<br />
Depreciation and amortization 22 10,922 10,520<br />
Profit from continuing operations before fair value gains<br />
and income tax recovery 138,171 120,306<br />
Gain on sale of assets 23 135 –<br />
Fair value gains 24 549,986 364,389<br />
Profit before income tax recovery 688,292 484,695<br />
Income tax recovery 16 222 740,391<br />
Profit for the year 688,514 1,225,086<br />
Other comprehensive income (loss) 2,850 (1,871)<br />
Total comprehensive income $ 691,364 $ 1,223,215<br />
See accompanying notes to these consolidated financial statements<br />
<strong>Boardwalk</strong> <strong>REIT</strong> / ar <strong>2012</strong> CONSOLIDATED FINANCIAL STATEMENTS / 95
Consolidated Statements of Changes in Unitholders’ Equity<br />
(CDN $ THOUSANDS)<br />
Trust Units<br />
Cumulative<br />
profit<br />
Cumulative<br />
distributions<br />
to<br />
Unitholders<br />
Retained<br />
earnings<br />
Accumulated<br />
other<br />
comprehensive<br />
income (loss)<br />
Total<br />
Unitholders’<br />
equity<br />
Balance, December 31, 2010 $ 192,272 $ 1,683,707 $ (556,856) $ 1,126,851 $ (6,587) $ 1,312,536<br />
Units issued 1,732 – – – – 1,732<br />
Units purchased and cancelled (6,740) – – – – (6,740)<br />
Profit for the year – 1,225,086 – 1,225,086 – 1,225,086<br />
Other comprehensive loss – – – – (1,871) (1,871)<br />
Total comprehensive income for the year – 1,225,086 – 1,225,086 (1,871) 1,223,215<br />
Distributions declared to Unitholders – – (85,953) (85,953) – (85,953)<br />
Balance, December 31, 2011 $ 187,264 $ 2,908,793 $ (642,809) $ 2,265,984 $ (8,458) $ 2,444,790<br />
Balance, December 31, 2011 $ 187,264 $ 2,908,793 $ (642,809) $ 2,265,984 $ (8,458) $ 2,444,790<br />
Units issued 3,846 – – – – 3,846<br />
Profit for the year – 688,514 – 688,514 – 688,514<br />
Other comprehensive income – – – – 2,850 2,850<br />
Total comprehensive income for the year – 688,514 – 688,514 2,850 691,364<br />
Distributions declared to Unitholders – – (89,899) (89,899) – (89,899)<br />
Balance, December 31, <strong>2012</strong> $ 191,110 $ 3,597,307 $ (732,708) $ 2,864,599 $ (5,608) $ 3,050,101<br />
See accompanying notes to these consolidated financial statements<br />
96 / CONSOLIDATED FINANCIAL STATEMENTS<br />
<strong>Boardwalk</strong> <strong>REIT</strong> / ar <strong>2012</strong>
Consolidated Statements of Cash Flows<br />
(CDN $ THOUSANDS)<br />
Note<br />
Year ended<br />
Dec 31, <strong>2012</strong><br />
Year ended<br />
Dec 31, 2011<br />
Operating activities<br />
Profit for the year $ 688,514 $ 1,225,086<br />
Fair value gains (549,986) (364,389)<br />
Income tax recovery (222) (740,391)<br />
Depreciation and amortization 22 10,922 10,520<br />
149,228 130,826<br />
Net change in operating working capital 32 9 4,085<br />
149,237 134,911<br />
Investing activities<br />
Improvements to investment properties 4 (83,120) (69,265)<br />
Cash proceeds from sale of assets 23 – 618<br />
Additions to property, plant and equipment 5 (6,177) (4,461)<br />
(89,297) (73,108)<br />
Financing activities<br />
Distributions paid (89,411) (85,969)<br />
Unit repurchase program – (6,740)<br />
Repayment of debenture 11 (112,405) –<br />
Financing, repayment and maturity of debt on investment properties 26,166 62,910<br />
Deferred financing costs incurred (3,831) (4,221)<br />
Bond forward settlement, net of amortization 20 25<br />
Government grant proceeds 17 2,283 –<br />
(177,178) (33,995)<br />
Net (decrease) increase in cash (117,238) 27,808<br />
Cash, beginning of year 255,894 228,086<br />
Cash, end of year $ 138,656 $ 255,894<br />
See accompanying notes to these consolidated financial statements<br />
<strong>Boardwalk</strong> <strong>REIT</strong> / ar <strong>2012</strong> CONSOLIDATED FINANCIAL STATEMENTS / 97
Notes to the Consolidated Financial Statements<br />
For the Years Ended December 31, <strong>2012</strong> and 2011<br />
(Tabular amounts in Cdn $ thousands, except number of units and per unit amounts UNLESS OTHERWISE STATED)<br />
Note 1:<br />
oRganization of the Trust<br />
<strong>Boardwalk</strong> Real Estate Investment Trust (“<strong>Boardwalk</strong> <strong>REIT</strong>” or the “Trust” or the “Entity”) is an unincorporated, open-ended<br />
real estate investment trust created pursuant to the Declaration of Trust (“DOT”), dated January 9, 2004, and as amended<br />
and restated on May 3, 2004, May 10, 2006, May 10, 2007, May 13, 2008, May 13, 2009, May 18, 2010, May 12, 2011, and May 15,<br />
<strong>2012</strong>, under the laws of the Province of Alberta. <strong>Boardwalk</strong> <strong>REIT</strong> was created to invest in multi-family residential investment<br />
properties or similar interests, initially through the acquisition of the assets and operations of <strong>Boardwalk</strong> Equities Inc. (the<br />
“Corporation”), which was acquired on May 3, 2004. <strong>Boardwalk</strong> <strong>REIT</strong> Trust Units are listed on the Toronto Stock Exchange<br />
under the symbol ‘BEI.UN’. The registered office of the Trust and its head office operations are located at First West Place,<br />
Suite 200, 1501 1st Street SW, Calgary, Alberta, T2R 0W1.<br />
Note 2:<br />
significant Accounting Policies<br />
(a) Statement of compliance<br />
These consolidated financial statements have been prepared in accordance with International Financial Reporting<br />
Standards (“IFRS”), as issued by the International Accounting Standards Board (“IASB”).<br />
(b) Basis of presentation<br />
The Trust’s consolidated financial statements have been prepared on the historical cost basis, except for investment<br />
properties and certain financial instruments that are measured at fair value, as explained in the accounting policies below.<br />
Historical cost is generally based on the fair value of the consideration given in exchange for assets. These consolidated<br />
financial statements were prepared on a going concern basis and have been presented in Canadian dollars rounded to the<br />
nearest thousand. The accounting policies set out below have been applied consistently in all material respects. Standards<br />
and guidelines not effective for the current accounting period are described in NOTE 3.<br />
(c) Basis of consolidation<br />
These consolidated financial statements include the accounts of the Trust and its consolidated subsidiaries, including<br />
special purpose entities (see NOTE 30), which are the entities over which <strong>Boardwalk</strong> <strong>REIT</strong> has control. Control exists when<br />
the Trust has the power, directly or indirectly, to govern the financial and operating policies of an entity to obtain benefits<br />
from its activities. In accordance with Interpretation SIC 12 – Consolidation Special Purpose Entities (“SIC 12”), an entity<br />
can exercise control on a basis other than ownership of voting interests. Currently, the Trust has 100% control over all of<br />
the subsidiaries reported in the consolidated financial statements (either directly or indirectly); therefore, non-controlling<br />
interests do not exist for the Trust at this time. All intra-group transactions, balances, revenues and expenses eliminate on<br />
consolidation.<br />
(d) Investment properties<br />
Investment properties consist of multi-family residential properties held to earn rental income, and include interests held<br />
under long-term operating land leases. Investment properties are measured initially at cost. Cost includes all amounts<br />
relating to the acquisition (excluding transaction costs related to a business combination as outlined in NOTE 2(f)) and<br />
improvement of the properties. All costs associated with upgrading and extending the economic life of the existing<br />
facilities, other than ordinary repairs and maintenance, are capitalized to investment property. Included in these costs<br />
98 / NOTES to CONSOLIDATED FINANCIAL STATEMENTS <strong>Boardwalk</strong> <strong>REIT</strong> / ar <strong>2012</strong>
are internal amounts that are directly attributable, which are capitalized to the extent that they upgrade or extend the<br />
economic life of the asset.<br />
Subsequent to initial recognition, investment properties are recorded at fair value, in accordance with International<br />
Accounting Standard (“IAS”) 40 - Investment Property (“IAS 40”). Fair value is determined based on a combination of<br />
internal and external processes and valuation techniques. Gains or losses arising from differences between current period<br />
fair value and the sum of previously measured fair value and capitalized costs as described above are recorded in profit or<br />
loss in the period in which they arise.<br />
Any directly attributable costs incurred on investment properties under development are capitalized. Such costs include<br />
direct development costs, property taxes and other costs directly attributable to the development.<br />
Properties owned by the Trust where a significant portion of the property is used for administrative purposes by the<br />
Trust are considered “Property, Plant and Equipment” and, therefore, fall within the scope of IAS 16 – Property, Plant and<br />
Equipment (“IAS 16”) and are recorded in accordance with that standard. Where part of a building is used for administrative<br />
purposes by the Trust, but this portion is considered insignificant, this space is included as part of Investment Property<br />
under IAS 40.<br />
Investment properties are reclassified to ‘Assets held for sale’ when the criteria set out in IFRS 5 - Non-Current Assets Held<br />
for Sale and Discontinued Operations (“IFRS 5”) are met (see NOTE 2(g)).<br />
An investment property is derecognized upon disposal or when the investment property is permanently withdrawn from<br />
use and no future economic benefits are expected from the disposal. Prior to its disposal, the carrying value of the investment<br />
property is adjusted to reflect its fair value as outlined in the purchase and sale agreement (as the purchase and sale<br />
agreement is the best evidence of fair value). This adjustment shall be recorded as a fair value gain (loss). Any remaining<br />
gain or loss arising on derecognition of the property (calculated as the difference between the net disposal proceeds and<br />
the carrying amount of the asset) is included in profit or loss in the period in which the property is derecognized.<br />
Excess land represents land owned by the Trust located contiguous to land included as investment property. The Trust has<br />
the ability to develop additional multi-family residential buildings on this land or sell it separately from the investment<br />
property at a later date. Excess land is held for capital appreciation and, therefore, is treated as Investment Property and<br />
recorded in accordance with IAS 40 as outlined above. When determining the fair value of a project with excess land, the<br />
capitalization rate used in determining the value is adjusted accordingly.<br />
(e) Property, plant and equipment<br />
Tangible assets that are held for use in the production or supply of goods and services, or for administrative purposes, and<br />
are expected to be used during more than one period, except when another accounting standard requires or permits a<br />
different accounting treatment, are recorded in accordance with IAS 16 using the cost model. IAS 16, therefore, excludes<br />
tangible assets that are accounted for in accordance with IAS 40 (see NOTE 2(d) above) and IFRS 5 (see NOTE 2(g) below).<br />
In accordance with IAS 16, the cost model, after initial recognition of the property, plant and equipment, requires the<br />
tangible asset to be carried at its cost less accumulated depreciation and any accumulated impairment losses (see NOTE<br />
2(h)). Depreciation is recognized in a manner that reflects the pattern in which the future economic benefits of the tangible<br />
asset are expected to be consumed and realized by the Trust. The amount of depreciation will be charged systematically<br />
to the consolidated statement of comprehensive income and is the cost less residual value of the asset over its useful<br />
economic life. IAS 16 also requires that the cost and useful economic life of each significant component of a tangible asset<br />
be determined based on the circumstances of each tangible asset. The method of depreciation, residual values and estimates<br />
of the useful economic life of a tangible asset, or other property, plant and equipment, are reviewed at each financial<br />
year-end and any changes are accounted for as a change in accounting estimate in accordance with IAS 8 – Accounting<br />
Policies, Changes in Accounting Estimates and Errors (“IAS 8”).<br />
<strong>Boardwalk</strong> <strong>REIT</strong> / ar <strong>2012</strong><br />
NOTES to CONSOLIDATED FINANCIAL STATEMENTS / 99
Property, Plant and Equipment (“PP&E”) is valued using the cost model under IAS 16. PP&E is categorized into the following<br />
classes and their respective useful economic life is used to calculate the amount of depreciation or amortization for each<br />
period. Categories of PP&E with the same or similar useful lives are included in the same class.<br />
PP&E Class Useful Life Depreciation method used<br />
Administrative building 40 years Straight-line<br />
Site equipment 15% Declining balance<br />
Automobile 20% Declining balance<br />
Warehouse assets 10% to 20% Declining balance<br />
Corporate assets 10% to 20% Declining balance<br />
Computer hardware 35% Declining balance<br />
Computer software* 35% Declining balance<br />
*In addition to the purchase of software from external sources, the Trust capitalizes certain programmers’ salaries related to internally<br />
developed software applications used in the normal course of operations of <strong>Boardwalk</strong> <strong>REIT</strong>. These programmers’ work is directly attributable<br />
to software development.<br />
(f) Business combinations<br />
In accordance with IFRS 3 – Business Combinations (“IFRS 3”), the acquisition of an asset or group of assets is recorded as<br />
a business combination if the assets acquired and the liabilities assumed constitute a business. A business is defined as<br />
an integrated set of activities and assets that is capable of being conducted and managed for the purpose of providing a<br />
return in the form of dividends, lower costs or other economic benefit. Building and other asset acquisitions, which meet<br />
the above definition of a business, are recorded as business combinations and the acquisition method of accounting for<br />
these transactions is applied. Building and other asset acquisitions, which do not meet the above definition of a business,<br />
are recorded as an asset addition.<br />
The acquisition method requires that an acquirer be identified, a specific acquisition date be determined (which is typically<br />
the date in which control changes), all identifiable assets and liabilities assumed, as well as any non-controlling interest in<br />
the acquiree, be recognized and measured, and any goodwill or gains from a bargain purchase price are recognized and<br />
measured at fair value, including contingent liabilities when these contingent considerations are part of the consideration<br />
being transferred. All acquisition costs associated with a transaction, identified as a business combination, are expensed<br />
as incurred.<br />
Goodwill is measured as the excess of the sum of the consideration transferred, the amount of any non-controlling interest<br />
in the acquiree, and the fair value of the acquirer’s previously held equity interest in the acquiree (if any) over the net of the<br />
acquisition-date amounts of the identifiable assets acquired and the liabilities assumed. If, after reassessment, the net of<br />
the acquisition-date amounts of the identifiable assets acquired and liabilities assumed exceeds the sum of the consideration<br />
transferred, the amount of any non-controlling interests in the acquiree and the fair value of the acquirer’s previously<br />
held interest in the acquiree (if any), the excess is recognized immediately in profit as a bargain purchase gain.<br />
Non-controlling interests that are present ownership interests and entitle their holders to a proportionate share of the<br />
entity’s net assets in the event of liquidation may be initially measured either at fair value or at the non-controlling interests’<br />
proportionate share of the recognized amounts of the acquiree’s identifiable net assets. The choice of measurement basis<br />
is made on a transaction-by-transaction basis. Other types of non-controlling interests are measured at fair value or, when<br />
applicable, on the basis specified in another IFRS.<br />
When the consideration transferred by the Trust in a business combination includes assets or liabilities resulting from a contingent<br />
consideration arrangement, the contingent consideration is measured at its acquisition date fair value and included<br />
as part of the consideration transferred in a business combination. Changes in the fair value of the contingent consideration<br />
that qualify as measurement period adjustments are adjusted retrospectively, with corresponding adjustments against<br />
goodwill. Measurement period adjustments are adjustments that arise from additional information obtained during the<br />
100 / NOTES to CONSOLIDATED FINANCIAL STATEMENTS <strong>Boardwalk</strong> <strong>REIT</strong> / ar <strong>2012</strong>
‘measurement period’ (which cannot exceed one year from the acquisition date and is shorter than one year if all information<br />
is received) about facts and circumstances that existed at the acquisition date.<br />
The subsequent accounting for changes in the fair value of the contingent consideration that do not qualify as measurement<br />
period adjustments depends on how the contingent consideration is classified. Contingent consideration that is<br />
classified as equity is not remeasured at subsequent reporting dates and its subsequent settlement is accounted for within<br />
equity. Contingent consideration that is classified as an asset or a liability is remeasured at subsequent reporting dates in<br />
accordance with IAS 39 – Financial Instruments: Recognition and Measurement, or IAS 37 - Provisions, Contingent Liabilities<br />
and Contingent Assets, as appropriate, with the corresponding gain or loss being recognized in profit or loss in the consolidated<br />
statement of comprehensive income.<br />
When a business combination is achieved in stages, the Trust’s previously held equity interest in the acquiree is remeasured<br />
to fair value at the acquisition date (i.e. the date when the Trust obtains control) and the resulting gain or loss, if any, is<br />
recognized in profit or loss in the consolidated statement of comprehensive income. Amounts arising from interests in the<br />
acquiree prior to the acquisition date that have previously been recognized in other comprehensive income are reclassified<br />
to profit or loss where such treatment would be appropriate if that interest was disposed of.<br />
If the initial accounting for a business combination is incomplete by the end of the reporting period in which the combination<br />
occurs, the Trust reports provisional amounts for the items for which the accounting is incomplete. These provisional<br />
amounts are adjusted during the measurement period (see above), or additional assets or liabilities are recognized, to<br />
reflect new information obtained about facts and circumstances that existed at the acquisition date that, if known, would<br />
have affected the amounts recognized at that date.<br />
(g)<br />
Assets held for sale and discontinued operations<br />
(i) Assets (or disposal groups) held for sale<br />
Non-current assets and groups of assets and liabilities, which comprise disposal groups, are categorized as assets<br />
(or disposal groups) held for sale where the asset (or disposal group) is available for sale in its present condition, and<br />
the sale is highly probable. For this purpose, a sale is highly probable: (a) if management is committed to a plan to<br />
achieve the sale, (b) there is an active program to find a buyer, (c) the non-current asset (or disposal group) is being<br />
actively marketed at a reasonable price, (d) the sale is anticipated to be completed within one year from the date of<br />
classification, and (e) it is unlikely there will be changes to the plan. Where an asset (or disposal group) is acquired<br />
with a view to resale, it is classified as a non-current asset (or disposal group) held for sale if the disposal is expected<br />
to take place within one year of the acquisition and it is highly likely that the other conditions referred to above will<br />
be met within a short period following the acquisition. Retrospective application is not required; therefore, comparative<br />
figures will not be adjusted to reflect non-current assets held for sale. The gains or losses arising on a sale of<br />
assets (or disposal groups) that does not meet the definition of discontinued operations will be recognized as part of<br />
continuing operations, while the gains or losses arising on a sale of assets (or disposal groups) that meet the definition<br />
of discontinued operations will be reported as part of discontinued operations in the consolidated statement of<br />
comprehensive income.<br />
(ii) Discontinued operations<br />
An asset or group of assets will be classified as a discontinued operation when it is a component of an entity that<br />
has either been disposed of or is classified as held for sale and represents a separate major line of business, it is<br />
part of a single coordinated plan to dispose of a separate major line of business or geographical area of operations,<br />
or it is a subsidiary acquired exclusively with a view to resell. Profits and gains or losses related to the disposal of<br />
discontinued operations are measured based on fair value less cost to sell or on the disposal of the assets (or disposal<br />
groups) and are presented in the consolidated financial statements on an after tax basis in accordance with IFRS 5. In<br />
addition, retrospective application is required; therefore, comparative figures will be changed to reflect discontinued<br />
operations. As an individual building does not constitute a major line of business, individual building sales are not<br />
treated as discontinued operations.<br />
<strong>Boardwalk</strong> <strong>REIT</strong> / ar <strong>2012</strong><br />
NOTES to CONSOLIDATED FINANCIAL STATEMENTS / 101
(h) Impairment of assets<br />
At the end of each reporting period, assets, other than those identified in the standard as not being applicable to IAS<br />
36 – Impairment of Assets (“IAS 36”), such as investment properties recorded at fair value, are assessed for any indication<br />
of impairment. Should the indication of impairment exist, the recoverable amount (see below) of the asset is estimated in<br />
order to determine the extent of the impairment loss (if any). Where it is not possible to estimate the recoverable amount<br />
of an individual asset, the Trust estimates the recoverable amount of the cash-generating unit to which the asset belongs.<br />
Where a reasonable and consistent basis of allocation can be identified, corporate assets are also allocated to individual<br />
cash-generating units, or otherwise they are allocated to the smallest group of cash-generating units for which a reasonable<br />
and consistent allocation basis can be identified.<br />
Recoverable amount is defined as the higher of an asset’s “fair value less cost to sell” and its “value-in-use”. In assessing value-in-use,<br />
the estimated future cash flows are discounted to their present value using a pre-tax discount rate that reflects<br />
current market assessments of the time value of money and the risks specific to the asset for which the estimate of future<br />
cash flows have not been adjusted.<br />
Where the carrying amount of an asset exceeds the recoverable amount determined, an impairment loss is recognized in<br />
the consolidated statement of comprehensive income. After the recognition of an impairment loss, the depreciation charge<br />
related to that asset is also revised for the adjusted carrying amount on a systematic basis over the remaining useful life of<br />
the asset. Should this impairment loss be determined to have reversed in a future period (with the exception of goodwill),<br />
a reversal of the impairment loss is recorded in profit or loss. However, the reversal of an impairment loss will not increase<br />
the carrying amount that would have been determined (net of amortization) had no impairment loss been recognized.<br />
(i) Inventories<br />
Inventories are measured at the lower of cost and net realizable value. The costs of inventories comprise the purchase<br />
price, import duties and other taxes (other than those subsequently recoverable by the entity from the taxing authorities),<br />
and third-party transport, handling and other costs directly attributable to the acquisition of goods and materials, less any<br />
trade discounts, rebates and other similar items, using the first-in, first-out method of cost assignment. Net realizable value<br />
represents the estimated selling price for inventories less all estimated costs necessary to make the sale.<br />
(j) Taxation<br />
For fiscal 2011 and <strong>2012</strong>, <strong>Boardwalk</strong> <strong>REIT</strong> qualified as a “mutual fund trust” as defined under the Income Tax Act (Canada)<br />
(the “Tax Act”) and as a Real Estate Investment Trust (“<strong>REIT</strong>”) eligible for the ‘<strong>REIT</strong> Exemption’ in accordance with the rules<br />
affecting the tax treatment of publicly traded trusts. Accordingly, the Trust is not taxable on its income provided that all of<br />
its taxable income is distributed to its Unitholders.<br />
Current tax<br />
The tax currently payable, if any, is based on taxable profit for the year for certain corporate subsidiaries of the Trust.<br />
Taxable profit differs from profit as reported in the consolidated statement of comprehensive income because of<br />
items of income or expense that are taxable or deductible in other years and items that are never taxable or deductible.<br />
The Trust’s liability for current tax is calculated using tax rates that have been enacted or substantively enacted<br />
by the end of the reporting period.<br />
102 / NOTES to CONSOLIDATED FINANCIAL STATEMENTS <strong>Boardwalk</strong> <strong>REIT</strong> / ar <strong>2012</strong>
Deferred tax<br />
Deferred tax is recognized on temporary differences between the carrying amounts of assets and liabilities in the<br />
consolidated financial statements and the corresponding tax bases used in the computation of taxable profit.<br />
Deferred income tax liabilities are generally recognized for all taxable temporary differences. Deferred income tax<br />
assets are recognized for all deductible temporary differences, carry forward of unused tax credits and unused tax<br />
losses, to the extent that it is probable that deductions, tax credits and tax losses can be utilized. The carrying amount<br />
of deferred income tax assets are reviewed at each reporting date and reduced to the extent it is no longer probable<br />
that the income tax assets will be recovered. Deferred income tax assets and liabilities are measured at the tax rates<br />
that are expected to apply in the year when the asset is realized or the liability settled, based on tax rates and laws that<br />
have been enacted or substantively enacted at the reporting date. In addition, deferred income tax assets and liabilities<br />
are measured using the rate that is consistent with the expected manner of recovery (i.e. using the asset versus<br />
selling the asset). Where applicable, current and deferred income taxes relating to items recognized directly in equity<br />
or comprehensive income are also recognized directly in equity or comprehensive income, respectively.<br />
(k) Provisions<br />
In accordance with IAS 37 – Provisions, Contingent Liabilities and Contingent Assets (“IAS 37”), a provision is a liability of<br />
uncertain timing or amount. Provisions are recognized when the entity has a present legal or constructive obligation as a<br />
result of past events and when it is probable that an outflow of resources will be required to settle the obligation and the<br />
amount can be reliably estimated. Provisions are not recognized for future operating losses. Provisions are measured at<br />
the present value of the expenditures expected to be required to settle the obligation using a discounted rate that reflects<br />
current market assessment of the time value of money and the risks and uncertainties specific to the obligation. Provisions<br />
are re-measured at each reporting date using the current discount rate. The increase in the provision due to the passage<br />
of time is recognized as a financing cost.<br />
(l) Unit-based payments<br />
Equity-settled unit-based payments to employees and Trustees are measured at the fair value of the deferred unit at the<br />
grant date and expensed over the vesting period based on the Trust’s estimate of the deferred units that will actually<br />
vest. At the end of each reporting period, the Trust revises its estimate of the number of equity instruments expected to<br />
vest. The impact of the revision of the original estimates, if any, is recognized in profit or loss prospectively such that the<br />
cumulative expense reflects the revised estimate. In accordance with IAS 32 – Financial Instruments: Presentation (“IAS 32”),<br />
the deferred units are presented as a liability on the consolidated statement of financial position as the Trust is obliged<br />
to provide the holder with <strong>REIT</strong> Units once the deferred units vest. Under IAS 39 – Financial Instruments: Recognition and<br />
Measurement (“IAS 39”), the deferred units are classified as ‘fair value through profit or loss’ and are measured at each<br />
reporting period at fair value with changes in fair value recognized in the consolidated statement of comprehensive<br />
income. Fair value of the deferred units is calculated based on the observable market price of the Trust’s Units.<br />
(m) Government assistance and grants<br />
The Trust receives government assistance in order to complement and partially assist the Trust’s initiatives in providing<br />
affordable housing to low income-earning individuals. Government grants are not recognized until there is reasonable<br />
assurance that the Trust will comply with the conditions attached to them and that the grants will be received.<br />
<strong>Boardwalk</strong> <strong>REIT</strong> / ar <strong>2012</strong><br />
NOTES to CONSOLIDATED FINANCIAL STATEMENTS / 103
(n)<br />
Revenue recognition<br />
(i) Rental revenue<br />
The Trust has retained substantially all of the risks and benefits of ownership of its investment properties, and, therefore,<br />
accounts for leases with its tenants as operating leases. Revenue recognition under a lease commences when<br />
the tenant has a right to use the leased asset. Generally, this occurs on lease inception date when the tenant occupies<br />
their leased space. Rental revenue is recognized systematically over the term of the lease, which is generally not more<br />
than twelve months. Any suite specific incentives offered or initial direct costs incurred in negotiating and arranging<br />
an operating lease are also amortized over the term of the operating lease. Rental revenue is recorded based on the<br />
amount received or to be received in accordance with the operating lease.<br />
(ii) Building sales<br />
The gain or loss from the sale of an investment property is recognized when title passes to the purchaser (control is<br />
transferred) upon closing at which time all or substantially all of the funds are receivable, or have been received, and<br />
the conditions of the sale have been completed.<br />
(iii) Interest income<br />
Interest income from a financial asset is recognized when it is probable that the economic benefits will flow to the<br />
Trust and the amount of income can be measured reliably. Interest income is accrued on a time basis when earned,<br />
by reference to the principal outstanding and at the effective interest rate applicable. Interest income is included in<br />
financing costs in the consolidated statement of comprehensive income.<br />
(iv) Ancillary rental income<br />
Ancillary rental income comprises revenue from coin laundry machines and income received from telephone and<br />
cable providers and is recorded as earned.<br />
(o) Financial instruments and derivatives<br />
Financial instruments and derivatives are accounted for, presented, and disclosed in accordance with IFRS 7 – Financial<br />
Instruments: Disclosures (“IFRS 7”), IAS 32 and IAS 39. Financial assets and financial liabilities are initially measured at fair<br />
value. Transaction costs that are directly attributable to the acquisition or issue of financial assets and financial liabilities<br />
(other than financial assets and financial liabilities at fair value through profit or loss) are added to or deducted from the<br />
fair value of the financial assets or financial liabilities, as appropriate, on initial recognition. Transaction costs directly<br />
attributable to the acquisition of financial assets or financial liabilities at fair value through profit or loss are recognized<br />
immediately in profit or loss.<br />
Financial assets<br />
Financial assets are classified into the following specified categories: financial assets at ‘fair value through profit or loss’<br />
(“FVTPL”), ‘held-to-maturity’ investments, ‘available-for-sale’ financial assets, and ‘loans and receivables’. The classification<br />
depends on the nature and purpose of the financial asset and is determined at the time of initial recognition. Financial<br />
assets are classified as at FVTPL when the financial asset either is held for trading or is designated as at FVTPL. Financial<br />
assets categories are defined and measured as follows:<br />
104 / NOTES to CONSOLIDATED FINANCIAL STATEMENTS <strong>Boardwalk</strong> <strong>REIT</strong> / ar <strong>2012</strong>
Classification Definition Measurement<br />
FVTPL<br />
Classified as FVTPL when the financial asset is either held for<br />
trading or it is designated as at FVTPL as discussed below:<br />
Held-to-maturity<br />
investments<br />
Available-for-sale<br />
Loans and<br />
receivables<br />
Classified as held for trading if: it has been acquired principally for<br />
the purpose of selling it in the near term; or, on initial recognition,<br />
it is part of a portfolio of identified financial instruments that the<br />
Trust manages together, and has a recent actual pattern of shortterm<br />
profit taking; or, it is a derivative that is not designated and<br />
effective as a hedging instrument.<br />
Classified as FVTPL upon initial recognition if: such designation<br />
eliminates or significantly reduces a measurement or recognition<br />
inconsistency that would otherwise arise; or the financial asset<br />
forms part of a group which is managed and its performance<br />
is evaluated on a fair value basis; or it forms part of a contract<br />
containing one or more embedded derivatives.<br />
Non-derivative financial assets with fixed or determinable<br />
payments and fixed maturity dates that the Trust has the positive<br />
intent and ability to hold to maturity.<br />
Non-derivative financial assets that either are designated as<br />
available-for-sale or are not classified as (a) loans and receivables,<br />
(b) held-to-maturity investments or (c) financial assets at FVTPL.<br />
Non-derivative financial assets with fixed or determinable<br />
payments that are not quoted in an active market.<br />
Stated at fair value, with gains or<br />
losses arising on measurement<br />
recognized in profit or loss.<br />
Stated at fair value, with gains or<br />
losses arising on measurement<br />
recognized in profit or loss.<br />
Measured at amortized cost<br />
using the effective interest<br />
(1) (2)<br />
method less any impairment.<br />
Measured at fair value through<br />
other comprehensive income.<br />
Measured at amortized cost<br />
using the effective interest<br />
(1) (2)<br />
method less any impairment.<br />
(1) The effective interest method is a method of calculating the amortized cost of a debt instrument and of allocating interest income over<br />
the relevant period. The effective interest rate is the rate that exactly discounts estimated future cash receipts through the expected<br />
life of the debt instrument or where appropriate, a shorter period, to the net carrying amount on initial recognition.<br />
(2) Financial assets, other than those at FVTPL, are assessed for indicators of impairment at the end of each reporting period. Generally, the<br />
carrying amount of the financial asset is reduced by the impairment loss.<br />
<strong>Boardwalk</strong> <strong>REIT</strong>’s financial assets are as follows:<br />
Financial asset Classification Measurement<br />
Trade and other receivables Loans and receivables Amortized cost<br />
Segregated tenants’ security deposits Loans and receivables Amortized cost<br />
Cash Loans and receivables Amortized cost<br />
The Trust derecognizes a financial asset only when the contractual rights to the cash flows from the asset expire, or when it<br />
transfers the financial asset and substantially all the risks and rewards of ownership of the asset to another entity.<br />
Financial liabilities and equity<br />
Debt and equity instruments issued are classified either as financial liabilities or as equity in accordance with the substance<br />
of the contractual arrangements and the definitions of a financial liability and an equity instrument. An equity instrument<br />
is any contract that evidences a residual interest in the assets of an entity after deducting all of its liabilities. Equity instruments<br />
issued by the Trust are recognized at the proceeds received, net of direct issue costs. Repurchase of <strong>Boardwalk</strong> <strong>REIT</strong>’s<br />
own equity instruments is recognized and deducted directly in equity. No gain or loss is recognized in profit or loss on the<br />
purchase, sale, issue or cancellation of the Trust’s own equity instruments. Distributions paid on the Trust’s equity instruments<br />
subsequent to, declared prior to, and with a record date at or prior to, the reporting date, are recorded as a liability.<br />
<strong>Boardwalk</strong> <strong>REIT</strong> / ar <strong>2012</strong><br />
NOTES to CONSOLIDATED FINANCIAL STATEMENTS / 105
Financial liabilities are classified as either financial liabilities ‘at FVTPL’ or ‘other financial liabilities’. Financial liabilities<br />
categories are defined and measured as follows:<br />
Classification Definition Measurement<br />
FVTPL<br />
Classified as FVTPL when the financial liability is either held for<br />
trading or it is designated as at FVTPL as discussed below:<br />
Other financial<br />
liabilities<br />
Classified as held for trading if: it has been acquired principally for<br />
the purpose of repurchasing it in the near term; or, on initial recognition,<br />
it is part of a portfolio of identified financial instruments<br />
that the Trust manages together and has a recent actual pattern of<br />
short-term profit taking; or, it is a derivative that is not designated<br />
and effective as a hedging instrument.<br />
Classified as FVTPL upon initial recognition if: such designation<br />
eliminates or significantly reduces a measurement or recognition<br />
inconsistency that would otherwise arise; or the financial liability<br />
forms part of a group which is managed and its performance<br />
is evaluated on a fair value basis; or it forms part of a contract<br />
containing one or more embedded derivatives.<br />
All other liabilities.<br />
Stated at fair value, with gains or<br />
losses arising on measurement<br />
recognized in profit or loss.<br />
Stated at fair value, with gains or<br />
losses arising on measurement<br />
recognized in profit or loss.<br />
Measured at amortized cost<br />
using the effective interest<br />
method. (1)<br />
(1) The effective interest method is a method of calculating the amortized cost of a financial liability and of allocating interest expense<br />
over the relevant period. The effective interest rate is the rate that exactly discounts estimated future cash payments through the<br />
expected life of the financial liability or where appropriate, a shorter period, to the net carrying amount on initial recognition.<br />
<strong>Boardwalk</strong> <strong>REIT</strong>’s financial liabilities are as follows:<br />
Financial liability Classification Measurement<br />
Mortgages payable Other financial liabilities Amortized cost<br />
Debentures Other financial liabilities Amortized cost<br />
LP Class B Units FVTPL Fair value<br />
Deferred unit-based compensation FVTPL Fair value<br />
Refundable tenants’ security deposits Other financial liabilities Amortized cost<br />
Trade and other payables Other financial liabilities Amortized cost<br />
The Trust derecognizes a financial liability when, and only when, the Trust’s obligations are discharged, cancelled or they<br />
expire. The difference between the carrying amount of the financial liability derecognized and the consideration paid and<br />
payable is recognized in profit or loss.<br />
Derivatives<br />
The Trust may enter into a variety of derivative financial instruments to manage its exposure to interest rate risks, including<br />
interest rate swaps and bond forward contracts. Further details of derivative financial instruments are disclosed in NOTE<br />
13 and NOTE 28. Derivatives are initially recognized at fair value at the date the derivative contracts are entered into and<br />
are subsequently measured at their fair value at the end of each reporting period. The resulting gain or loss is recognized<br />
in profit or loss immediately unless the derivative is designated and effective as a hedging instrument, in which case the<br />
timing of the recognition in profit or loss depends on the nature of the hedge relationship. Derivatives embedded in host<br />
contracts are treated as separate derivatives when their risks and characteristics are not closely related to the host contracts<br />
106 / NOTES to CONSOLIDATED FINANCIAL STATEMENTS <strong>Boardwalk</strong> <strong>REIT</strong> / ar <strong>2012</strong>
and the host contracts are not measured at FVTPL. For the years ended December 31, <strong>2012</strong> and 2011, the Trust had no<br />
embedded derivatives requiring separate recognition.<br />
(p) Hedge accounting<br />
The Trust applies hedge accounting to derivative financial instruments in cash flow hedging relationships. At the inception<br />
of the hedging relationship, the Trust documents the relationship between the hedging instrument and the hedged item,<br />
along with its risk management objectives and its strategy for undertaking various hedge transactions. Furthermore, at<br />
inception of the hedge and on an ongoing basis, the Trust documents whether the hedging instrument is highly effective<br />
in offsetting changes in cash flows of the hedged item attributable to the hedged risk.<br />
In cash flow hedging relationships, the effective portion of the change in the fair value of the hedging derivative is recognized<br />
in the consolidated statement of comprehensive income as other comprehensive income (“OCI”) while the ineffective<br />
portion is recognized immediately in profit or loss. Hedging gains and losses previously recognized in OCI and accumulated<br />
in equity are reclassified to profit or loss in the periods when the hedged item is recognized in profit or loss, in the same<br />
line of the consolidated statement of comprehensive income as the recognized hedged item.<br />
Hedge accounting is discontinued when the Trust revokes the hedging relationship, when the hedging instrument expires<br />
or is sold, terminated, or exercised, or when it no longer qualifies for hedge accounting. Any gain or loss recognized in OCI<br />
and accumulated in equity at that time remains in equity and is recognized when the forecast transaction is ultimately<br />
recognized in profit or loss. When a forecast transaction is no longer expected to occur, the gain or loss accumulated in<br />
equity is recognized immediately in profit or loss.<br />
(q) Cash<br />
Cash is comprised of bank balances and interest-earning bank accounts.<br />
(r) Critical judgment in applying accounting policies<br />
The following are the critical judgments, apart from those involving estimations (see NOTE 2(s) below) that have been<br />
made in applying the Trust’s accounting policies and that have the most significant effect on the reported amounts in the<br />
consolidated financial statements:<br />
(i) Income taxes<br />
The Trust applies judgment in determining the tax rate applicable to its corporate, trust and partnership subsidiaries<br />
and identifying the temporary differences in each of such legal subsidiaries in respect of which deferred income taxes<br />
are recognized. Deferred taxes related to temporary differences arising from its corporate subsidiaries are measured<br />
based on the tax rates that are expected to apply in the year when the asset is realized or the liability is settled.<br />
Temporary differences are differences that are expected to reverse in the future and arise from differences between<br />
accounting and tax asset values. Effective January 1, 2011, the Trust qualified for the “<strong>REIT</strong> Exemption” and will not<br />
be subject to Canadian income taxes under the SIFT Rules. Consequently, the deferred taxes related to temporary<br />
differences arising from the SIFT Rules prior to the beginning of the 2011 fiscal year were reversed on January 1, 2011.<br />
(ii) Leases<br />
The Trust’s revenue recognition policy related to leases is described in NOTE 2(n)(i). The Trust makes judgments in<br />
determining whether certain leases, in particular tenant leases, as well as leased warehouse space and long-term land<br />
leases, which are considered leases under IFRS, where the Trust is the lessor, are operating or finance leases. The Trust<br />
has determined that all of its leases are operating leases.<br />
(iii) Investment property and internal capital program<br />
The Trust’s accounting policy relating to investment property is described in NOTE 2(d) above. In applying this policy,<br />
judgment is applied in determining the extent and frequency of utilizing independent, third-party appraisals to<br />
measure the fair value of the Trust’s investment property. The Trust also undertakes internal capital improvements<br />
<strong>Boardwalk</strong> <strong>REIT</strong> / ar <strong>2012</strong><br />
NOTES to CONSOLIDATED FINANCIAL STATEMENTS / 107
and upgrades. Such work is specifically identified, and the Trust applies judgment in the estimated amount of directly<br />
attributable on-site wages to be capitalized relating to capital improvements and upgrades of its real estate assets.<br />
(iv) Financial instruments<br />
The Trust’s accounting policies relating to financial instruments are described in NOTE 2(o). Critical judgments inherent<br />
in these policies related to applying the criteria set out in IAS 39 to designate financial instruments into categories<br />
(i.e. FVTPL, etc.), assess the effectiveness of hedging relationships (for the Trust’s cash flow hedges) and determine the<br />
identification of embedded derivatives, if any, in certain hybrid instruments that are subject to fair value measurement.<br />
(v) Basis of consolidation<br />
The consolidated financial statements of the Trust include the accounts of <strong>Boardwalk</strong> <strong>REIT</strong> and its wholly owned<br />
subsidiaries, as well as entities over which the Trust exercises control on a basis other than ownership of voting<br />
interest within the scope of Interpretation SIC 12. Judgment is applied in determining what is considered in substance<br />
“control” within the scope of SIC 12 and, thus, entities considered special purpose entities are to be included in the<br />
consolidated financial statements of the Trust.<br />
(s) Key accounting estimates and assumptions<br />
The following are the key assumptions concerning the future, and other key sources of estimation uncertainty at the end<br />
of the reporting period, that have a significant risk of causing a material adjustment to the carrying amounts of assets and<br />
liabilities within the next financial year. Actual results could differ from estimates.<br />
(i) Investment property<br />
The choice of valuation method for fair valuing and the critical estimates and assumptions underlying the fair value<br />
determination of investment properties are set out in NOTE 4. Significant estimates used in determining the fair value<br />
of the Trust’s investment properties includes capitalization rates and net operating income (which is influenced by<br />
inflation rates, vacancy rates and standard costs) used in the overall capitalization rate valuation method as well as<br />
discount rates and forecasted cash flows used in the discounted cash flow valuation method. A change to any one<br />
of these inputs could significantly alter the fair value of an investment property. Please refer to NOTE 4 for sensitivity<br />
analysis.<br />
(ii) Property, plant and equipment<br />
Useful economic life of property, plant and equipment for the purposes of calculating depreciation and amortization,<br />
as disclosed in NOTE 5 and forecast of economic factors to determine recoverable amounts for the purpose of<br />
determining any impairment of assets.<br />
(iii) Internal Capital Program<br />
The Trust’s internal capital program is based on internal allocations, including parts, supplies and on-site wages identified<br />
as part of the specific upgrade.<br />
(iv) Utility accrual<br />
Amount of utility accrual for charges related to the current or prior year is based on estimates of usage and price for<br />
the time period in which invoices have not been received from the utility providers.<br />
(v) Deferred unit-based compensation plan<br />
The compensation costs relating to the deferred unit plan are based on estimates of how many deferred units will<br />
actually vest and be exercised.<br />
(vi) Deferred taxes<br />
The amount of the temporary differences between the accounting carrying value of the Trust’s assets and liabilities<br />
versus the tax bases of those assets and liabilities and the tax rates at which the differences will be realized are outlined<br />
in NOTE 16.<br />
108 / NOTES to CONSOLIDATED FINANCIAL STATEMENTS <strong>Boardwalk</strong> <strong>REIT</strong> / ar <strong>2012</strong>
Note 3:<br />
Future accounting policies<br />
The following accounting standards under IFRS have been issued or revised; however, they are not yet effective, and, as<br />
such, have not been applied to these consolidated financial statements:<br />
Financial Instruments<br />
IFRS 7, Financial Instruments: Disclosures, has been amended to include information regarding all recognized financial<br />
instruments that are set off in accordance with paragraph 42 of IAS 32. The amendment also requires disclosure of information<br />
about recognized financial instruments subject to enforceable master netting arrangements and similar agreements<br />
even if they are not set off under IAS 32. The amendment is applicable for periods beginning on, or after, January 1, 2013<br />
and must be applied retrospectively to all comparative periods.<br />
IFRS 9, Financial Instruments, was issued in November 2009 and addresses classification and measurement of financial<br />
assets. It replaces the multiple category and measurement models in IAS 39 for debt instruments with a new mixed measurement<br />
model having only two categories: amortized cost and fair value through profit or loss. IFRS 9 also replaces the<br />
models for measuring equity instruments. Such instruments are either recognized at fair value through profit or loss or<br />
at fair value through other comprehensive income. Where equity instruments are measured at fair value through other<br />
comprehensive income, dividends are recognized in profit or loss to the extent that they do not clearly represent a return<br />
of investment; however, other gains and losses (including impairments) associated with such instruments, remain in accumulated<br />
comprehensive income indefinitely.<br />
Requirements for financial liabilities were added to IFRS 9 in October 2010 and they largely carried forward existing<br />
requirements in IAS 39, Financial Instruments – Recognition and Measurement, except that fair value changes due to credit<br />
risk for liabilities designated at fair value through profit and loss are generally recorded in other comprehensive income.<br />
The amendment is applicable for <strong>annual</strong> periods beginning on, or after, January 1, 2015, with earlier application permitted.<br />
The Trust does not expect these amendments to have a significant impact on its consolidated financial statements.<br />
Consolidated Financial Statements<br />
In June 2011, the IASB issued IFRS 10 – Consolidated Financial Statements (“IFRS 10”) to replace Standing Interpretations<br />
Committee 12 – Consolidation – Special Purpose Entities and the new consolidation requirements of IAS 27 – Consolidated<br />
and Separate Financial Statements (“IAS 27”); these are discussed below. IFRS 10 eliminates the current risk and rewards<br />
approach and establishes control as the single basis for determining the consolidation of an entity. The standard provides<br />
guidance on how to apply the control principles in a number of situations, including agency relationships and holding or<br />
potential voting rights. This standard is to be applied for accounting periods beginning on, or after, January 1, 2013. The<br />
Trust does not expect IFRS 10 to have a significant impact on its consolidated financial statements.<br />
IAS 27 was revised in May 2011 to eliminate the principles of consolidation from IAS 27 (as they are now included in IFRS 10)<br />
and focus on requirements related to disclosure requirements for investments in subsidiaries, joint ventures and associates<br />
when an entity prepares separate financial statements. The Trust does not expect these amendments to have a significant<br />
impact on its consolidated financial statements.<br />
Joint Arrangements<br />
IFRS 11 – Joint Arrangements (“IFRS 11”) was issued in June 2011 and is the result of the IASB’s project to replace IAS 31 –<br />
Interests in Joint Ventures (“IAS 31”). The new standard redefines joint operations and joint ventures, requiring joint operations<br />
to be proportionately consolidated and joint ventures to be equity accounted. Under IAS 31, joint ventures could be<br />
proportionately accounted. This standard is to be applied for accounting periods beginning on, or after, January 1, 2013,<br />
with early adoption permitted. The Trust does not expect this standard to have a significant impact on its consolidated<br />
financial statements.<br />
<strong>Boardwalk</strong> <strong>REIT</strong> / ar <strong>2012</strong><br />
NOTES to CONSOLIDATED FINANCIAL STATEMENTS / 109
IAS 28 – Investments in Associates and Joint Ventures (“IAS 28”) was revised in May 2011 and prescribes the accounting<br />
for investments in associates and sets out the requirements for the application of the equity method when accounting for<br />
investments in associates and joint ventures. This standard is to be applied for accounting periods beginning on, or after,<br />
January 1, 2013, with early adoption permitted. The Trust does not expect these amendments to have a significant impact<br />
on its consolidated financial statements.<br />
Disclosure of Interests in Other Entities<br />
IFRS 12 – Disclosure of Interests in Other Entities (“IFRS 12”) was issued in June 2011 and outlines the required disclosures<br />
for interests in subsidiaries and joint arrangements. The new disclosures require information that will assist financial statement<br />
users to evaluate the nature, risks and financial effects associated with an entity’s interests in subsidiaries and joint<br />
arrangements. This standard is to be applied for accounting periods beginning on, or after, January 1, 2013, with early<br />
adoption permitted. The Trust does not expect IFRS 12 to have a significant impact on its consolidated financial statements.<br />
Fair Value Measurements<br />
IFRS 13 – Fair Value Measurements (“IFRS 13”) establishes a single source of guidance for fair value measurements and<br />
disclosures about fair value measurements. The Standard defines fair value, establishes a framework for measuring fair<br />
value, and requires disclosures about fair value measurements. The scope of IFRS 13 is broad; it applies to both financial<br />
instrument items and non-financial instrument items for which other IFRSs require or permit fair value measurements and<br />
disclosures about fair value measurements, except in specified circumstances. In general, the disclosure requirements in<br />
IFRS 13 are more extensive than those required in the current standards. For example, quantitative and qualitative disclosures<br />
based on the three-level fair value hierarchy currently required for financial instruments only under IFRS 7 - Financial<br />
Instruments: Disclosures (“IFRS 7”) will be extended by IFRS 13 to cover all assets and liabilities within its scope.<br />
IFRS 13 is effective for <strong>annual</strong> periods beginning on or after 1 January 2013, with earlier application permitted.<br />
The Trust does not expect IFRS 13 to have a significant impact on its consolidated financial statements, but may result in<br />
more extensive disclosures in the financial statements.<br />
Employee Benefits<br />
IAS 19 – Employee Benefits (“IAS 19”) amendments was issued in June 2011 and will change the accounting for defined<br />
benefit plans and termination benefits. This standard requires that the changes in defined benefit obligations are recognized<br />
as they occur, eliminating the corridor approach and accelerating the recognition of past service costs. The changes<br />
in defined benefit obligation and plan assets are to be disaggregated into three components: service costs, net interest on<br />
the net defined benefit liabilities (assets) and remeasurements of the net defined benefit liabilities (assets). This standard is<br />
to be applied for accounting periods beginning on, or after, January 1, 2013, with early adoption permitted. The Trust does<br />
not expect the amendments to IAS 19 to have a significant impact on its consolidated financial statements.<br />
Presentation of Financial Statements<br />
IAS 1 was amended in 2011 to expand on the disclosures required of items within Other Comprehensive Income. The<br />
revised standard requires an entity to distinguish between those items that are recycled to profit and loss versus those<br />
items that are not recycled. Retrospective application is required and the standard is effective for <strong>annual</strong> periods beginning<br />
on, or after, July 1, <strong>2012</strong>. The Trust does not expect the amendments to IAS 1 to have a significant impact on its consolidated<br />
financial statements.<br />
110 / NOTES to CONSOLIDATED FINANCIAL STATEMENTS <strong>Boardwalk</strong> <strong>REIT</strong> / ar <strong>2012</strong>
Note 4:<br />
Investment properties<br />
As at Dec 31, <strong>2012</strong> Dec 31, 2011<br />
Balance, beginning of year $ 4,793,895 $ 4,318,242<br />
Additions<br />
Building improvements (incl. internal capital program) 83,120 69,265<br />
Fair value gains 616,433 406,388<br />
Balance, end of year $ 5,493,448 $ 4,793,895<br />
External valuations were obtained from third-party external valuation professionals (“the Appraisers”) based on a cross<br />
section of properties from different geographical locations and markets across the Trust’s rental portfolio as determined<br />
by the Trust’s management. The Appraisers are an independent valuation firm not related to the Trust and employ valuation<br />
professionals who are members of the Appraisal Institute of Canada and the Ordre des Evaluateurs Agrees du Quebec<br />
who have appropriate qualifications and recent experience in the valuation of properties in the relevant locations. External<br />
appraisals were obtained as follows:<br />
Date Number of properties Aggregate fair value<br />
Percentage of portfolio<br />
as of that date<br />
December 31, <strong>2012</strong> 7 $ 663,136 12.0%<br />
September 30, <strong>2012</strong> 6 $ 181,850 3.3%<br />
June 30, <strong>2012</strong> 6 $ 205,278 4.0%<br />
March 31, <strong>2012</strong> 7 $ 375,083 7.5%<br />
Date Number of properties Aggregate fair value<br />
Percentage of portfolio<br />
as of that date<br />
December 31, 2011 5 $ 125,823 2.6%<br />
September 30, 2011 5 $ 238,580 5.1%<br />
June 30, 2011 5 $ 187,984 4.2%<br />
March 31, 2011 11 $ 776,987 18.0%<br />
The fair value of the remainder of the Trust’s investment property portfolio was determined internally by the Trust using<br />
the same assumptions and valuation techniques used by the external valuation professionals. In addition to performing a<br />
valuation on a selection of the Trust’s properties (and not performing a valuation on all of the Trust’s properties) to corroborate<br />
the Trust’s internal valuation, the Appraisers provided the Trust with a summary of the major assumptions and market<br />
data by city in order for the Trust to complete its internal valuations.<br />
The third-party valuation technique of the Trust’s investment property portfolio primarily utilizes the “Overall Capitalization<br />
Rate” method. This method requires that rental income from current leases and key assumptions about rental income,<br />
vacancies and inflation rates, among other factors, be used to determine a one-year income forecast for each individual<br />
property within the Trust’s portfolio, and also considers any capital expenditures anticipated within the year. Given the<br />
short term nature of residential leases (typically one year), revenue and costs are not discounted. A Capitalization Rate<br />
was also determined for each property based on market information related to the external sale of similar buildings<br />
within a similar geographic location. These factors were used to determine the fair value of investment properties at each<br />
reporting date.<br />
Five of the Trust’s properties: one in Calgary, one in Banff, one in Edmonton and two in Montreal, are subject to longterm<br />
land leases and similar arrangements in which the underlying land is owned by a third party and leased to the Trust.<br />
Under the terms of a typical land lease, the lessee must pay rent for the use of the land and is generally responsible for<br />
all costs and expenses associated with the building and improvements, including taxes, utilities, insurance, maintenance,<br />
repairs and replacements in respect of all the leased premises. Unless the lease term is extended, the land together with all<br />
improvements made will revert to the owner of the land upon the expiration of the lease term. Due to the relatively short<br />
<strong>Boardwalk</strong> <strong>REIT</strong> / ar <strong>2012</strong><br />
NOTES to CONSOLIDATED FINANCIAL STATEMENTS / 111
term remaining on one of the land leases in Montreal (with an expiry date of 2028) and an anticipated significant land rent<br />
escalation in 2016 for the land lease in Calgary, these two properties utilized the Discounted Cash Flow (“DCF”) approach to<br />
derive the fair value. The DCF Method calculates the present value of the future cash flows over a specified time period to<br />
determine the fair value for each property at each reporting date. The most significant assumption using the DCF method is<br />
the discount rate applied over the term of the lease. The discount rates reflect the uncertainty regarding the renegotiation<br />
of the land lease payments and the ability to extend the land lease at the expiry date. Forecasted cash flows are reduced<br />
for contractual land lease payments during the term of the leases.<br />
The key valuation metrics for the Trust’s investment properties are set out in the following tables:<br />
As at Dec 31, <strong>2012</strong> Dec 31, 2011<br />
Capitalization rate by city: Minimum Maximum Minimum Maximum<br />
Calgary 4.75% 5.50% 5.25% 6.00%<br />
Edmonton 5.00% 5.50% 5.50% 6.00%<br />
Other Alberta 5.75% 7.25% 6.00% 7.75%<br />
Vancouver 4.75% 6.25% 5.00% 6.50%<br />
Kitchener 5.75% 5.75% 6.00% 6.00%<br />
London 5.75% 6.00% 6.00% 6.25%<br />
Windsor 6.50% 7.00% 6.75% 7.25%<br />
Montreal 5.50% 6.25% 5.75% 6.75%<br />
Quebec City 5.75% 6.25% 5.75% 6.25%<br />
Regina 5.75% 6.00% 6.25% 6.50%<br />
Saskatoon 5.75% 6.00% 6.25% 6.50%<br />
Cap Rate Range 4.75% 7.25% 5.00% 7.75%<br />
Land Lease 5.25% 12.69% 5.50% 11.50%<br />
The overall weighted average Capitalization Rates for fair valuing the Trust’s investment properties at December 31, <strong>2012</strong><br />
and 2011, were 5.47% and 5.91%, respectively.<br />
The “Overall Capitalization Rate” method requires that a forecasted net operating income (“NOI”) be divided by a<br />
Capitalization Rate (“Cap Rate”) to determine a fair value. As such, fluctuations in both NOI and Cap Rates could significantly<br />
alter the fair value. Below are tables that summarize the impact of changes in both the Cap Rates and NOI on the Trust’s fair<br />
value of investment properties:<br />
As at December 31, <strong>2012</strong><br />
Net Operating Income -3% -1% As Forecasted +1% +3%<br />
$ 291,477 $ 297,487 $ 300,492 $ 303,497 $ 309,506<br />
Capitalization Rate<br />
-0.25% 5.22% $ 90,400 $ 205,531 $ 263,096 $ 320,662 $ 435,792<br />
Cap Rate As Reported 5.47% (164,803) (54,934) 5,493,448 54,934 164,803<br />
+0.25% 5.72% (397,699) (292,632) (240,098) (187,565) (82,498)<br />
As at December 31, 2011<br />
Net Operating Income -3% -1% As Forecasted +1% +3%<br />
$ 274,820 $ 280,486 $ 283,319 $ 286,152 $ 291,819<br />
Capitalization Rate<br />
-0.25% 5.66% $ 61,575 $ 161,688 $ 211,744 $ 261,801 $ 361,914<br />
Cap Rate As Reported 5.91% (143,817) (47,939) 4,793,895 47,939 143,817<br />
+0.25% 6.16% (332,538) (240,551) (194,557) (148,564) (56,577)<br />
112 / NOTES to CONSOLIDATED FINANCIAL STATEMENTS <strong>Boardwalk</strong> <strong>REIT</strong> / ar <strong>2012</strong>
Investment properties with a fair value of $482.5 million (December 31, 2011 – $452.6 million) are situated on land held<br />
under land leases.<br />
Investment properties with a fair value of $638.8 million (December 31, 2011 – $587.3 million) are pledged as security<br />
against the Trust’s committed revolving credit facility. Assets pledged as security for the committed revolving credit facility<br />
may also be pledged as security for the Trust’s mortgages payable. In addition, investment properties with a fair value of<br />
$5.1 billion (December 31, 2011 – $4.5 billion) are pledged as security against the Trust’s mortgages payable.<br />
During the year ended December 31, <strong>2012</strong>, the Trust capitalized $3.4 million (year ended December 31, 2011 – $0.2 million)<br />
in relation to direct costs related to fees for architecture, legal, engineering consultants and permit application. These costs<br />
are directly related to the construction of a qualifying asset and will be incurred until such time when substantially all of the<br />
activities required to prepare the qualifying asset for its intended use are complete.<br />
For the years ended December 31, <strong>2012</strong> and 2011, investment properties earned rental revenue (excluding ancillary rental<br />
income) of $433.2 million and $416.2 million, respectively. Direct operating expenses in relation to investment properties<br />
were $159.0 million and $155.1 million, for the years ended December 31, <strong>2012</strong> and 2011, respectively.<br />
Note 5:<br />
pRoperty, plant and equipment<br />
The carrying amounts of PP&E were as follows:<br />
As at Dec 31, <strong>2012</strong> Dec 31, 2011<br />
Cost<br />
Accum.<br />
Deprec.<br />
Carrying<br />
amount<br />
Cost<br />
Accum.<br />
Deprec.<br />
Carrying<br />
amount<br />
Administration building $ 4,970 $ (2,041) $ 2,929 $ 4,434 $ (1,848) $ 2,586<br />
Site equipment 16,889 (8,064) 8,825 14,576 (6,710) 7,866<br />
Automobiles 6,223 (3,680) 2,543 5,134 (3,180) 1,954<br />
Warehouse assets 3,643 (1,177) 2,466 2,941 (940) 2,001<br />
Corporate assets 3,364 (2,780) 584 3,321 (2,698) 623<br />
Computer hardware 12,435 (11,168) 1,267 11,830 (10,646) 1,184<br />
Computer software 11,102 (9,039) 2,063 10,212 (8,166) 2,046<br />
Total $ 58,626 $ (37,949) $ 20,677 $ 52,448 $ (34,188) $ 18,260<br />
The following table outlines a reconciliation of the carrying amount of PP&E as at December 31, <strong>2012</strong>:<br />
Dec 31, 2011<br />
opening<br />
carrying amount Additions Depreciation<br />
Dec 31, <strong>2012</strong><br />
closing<br />
carrying amount<br />
Administration building $ 2,586 $ 535 $ (192) $ 2,929<br />
Site equipment 7,866 2,315 (1,356) 8,825<br />
Automobiles 1,954 1,089 (500) 2,543<br />
Warehouse assets 2,001 702 (237) 2,466<br />
Corporate assets 623 43 (82) 584<br />
Computer hardware 1,184 605 (522) 1,267<br />
Computer software (1) 2,046 888 (871) 2,063<br />
Total $ 18,260 $ 6,177 $ (3,760) $ 20,677<br />
(1) Included in computer software is $577 thousand of capitalized programmers’ salaries related to the internally developed software<br />
applications used by the Trust in the normal course of its operations.<br />
<strong>Boardwalk</strong> <strong>REIT</strong> / ar <strong>2012</strong><br />
NOTES to CONSOLIDATED FINANCIAL STATEMENTS / 113
The following table outlines a reconciliation of the carrying amount of PP&E as at December 31, 2011:<br />
Dec 31, 2010<br />
opening<br />
carrying amount Additions Depreciation<br />
Dec 31, 2011<br />
closing<br />
carrying amount<br />
Administration building $ 2,737 $ 26 $ (177) $ 2,586<br />
Site equipment 7,545 1,572 (1,251) 7,866<br />
Automobiles 1,793 578 (417) 1,954<br />
Warehouse assets 1,523 661 (183) 2,001<br />
Corporate assets 553 147 (77) 623<br />
Computer hardware 1,201 491 (508) 1,184<br />
Computer software (1) 1,896 986 (836) 2,046<br />
Total $ 17,248 $ 4,461 $ (3,449) $ 18,260<br />
(1) Included in computer software is $499 thousand of capitalized programmers’ salaries related to the internally developed software<br />
applications used by the Trust in the normal course of its operations.<br />
PP&E is reviewed at each reporting date to ensure their useful economic lives remain appropriate. In addition, PP&E is<br />
reviewed at each reporting date for indicators of impairment. Where impairment exists, the PP&E asset is written down by<br />
the impaired amount. Should this impairment no longer exist, the impairment write-down is reversed up to the net book<br />
value which would have existed had the impairment not have occurred. As at December 31, <strong>2012</strong> and 2011, there were no<br />
indicators of impairment in relation to the Trust’s PP&E.<br />
As at December 31, <strong>2012</strong> and 2011, none of the Trust’s PP&E was pledged as security for debt.<br />
Note 6:<br />
Inventories<br />
Inventory consists of parts and supplies and items such as baseboards, carpet and linoleum, which the Trust routinely uses<br />
in the maintenance and upgrading of its investment properties. These items are kept on hand so they are readily available<br />
for use. When items of inventory are used, they are expensed as part of maintenance expense or they are capitalized to<br />
investment properties depending on the nature of the inventory used and whether or not the useful life of an asset has<br />
been extended as a result of its use. The Trust’s inventories are as follows:<br />
As at Dec 31, <strong>2012</strong> Dec 31, 2011<br />
Parts and supplies $ 3,199 $ 2,604<br />
Baseboard, carpet and linoleum 34 36<br />
$ 3,233 $ 2,640<br />
Note 7:<br />
Prepaid assets<br />
The major components of prepaid assets are as follows:<br />
As at Dec 31, <strong>2012</strong> Dec 31, 2011<br />
Prepaid property taxes $ 1,031 $ 983<br />
Prepaid land leases 2,012 1,975<br />
Prepaid expenses and other 749 880<br />
$ 3,792 $ 3,838<br />
114 / NOTES to CONSOLIDATED FINANCIAL STATEMENTS <strong>Boardwalk</strong> <strong>REIT</strong> / ar <strong>2012</strong>
Note 8:<br />
tRade and other receivables<br />
Trade and other receivables comprise an aggregate amount of $2.5 million at December 31, <strong>2012</strong> (December 31, 2011 – $2.2<br />
million) consisting mainly of mortgage holdbacks, refundable mortgage fees and amounts owed to <strong>Boardwalk</strong> <strong>REIT</strong> by<br />
tenants and revenue-sharing business partners.<br />
As at Dec 31, <strong>2012</strong> Dec 31, 2011<br />
Trade receivables $ 2,345 $ 1,985<br />
Mortgage holdbacks and refundable mortgage fees 116 225<br />
$ 2,461 $ 2,210<br />
Refer to NOTE 29 (b) for the Trust’s exposure to credit risk in relation to its trade and other receivables and how the Trust<br />
accounts for past due balances.<br />
Note 9:<br />
segregated tenants’ security deposits<br />
Segregated tenants’ security deposits are considered restricted cash as they are held in trust bank accounts and subject<br />
to the contingent rights of third parties. Restricted cash and deposits totaled $12.1 million at December 31, <strong>2012</strong> and $11.6<br />
million at December 31, 2011.<br />
Note 10:<br />
Mortgages payable<br />
As at Dec 31, <strong>2012</strong> Dec 31, 2011<br />
Weighted<br />
Average<br />
Interest<br />
Debt<br />
Balance<br />
Weighted<br />
Average<br />
Interest<br />
Debt<br />
Balance<br />
Mortgage payable<br />
Fixed rate 3.69% $ 2,248,176 4.08% $ 2,218,731<br />
Total 2,248,176 2,218,731<br />
Current $ 326,010 $ 497,780<br />
Non-current 1,922,166 1,720,951<br />
$ 2,248,176 $ 2,218,731<br />
Estimated future principal payments required to meet mortgage obligations as at December 31, <strong>2012</strong> are as follows:<br />
Secured By<br />
Investment Properties<br />
2013 $ 326,010<br />
2014 441,949<br />
2015 453,511<br />
2016 278,136<br />
2017 307,789<br />
Subsequent 526,440<br />
2,333,835<br />
Unamortized deferred financing costs (85,788)<br />
Unamortized mark-to-market adjustment 129<br />
$ 2,248,176<br />
<strong>Boardwalk</strong> <strong>REIT</strong> / ar <strong>2012</strong><br />
NOTES to CONSOLIDATED FINANCIAL STATEMENTS / 115
CMHC provides mortgage loan insurance in connection with mortgages made to <strong>Boardwalk</strong> <strong>REIT</strong>. In an agreement dated<br />
September 13, 2002, and as amended and restated on January 19, 2005 and April 25, 2006, the Trust agreed to provide<br />
certain financial information to CMHC and be subject to certain restrictive covenants, including limitation on additional<br />
debt, payment of distributions in respect of Unitholders’ capital in the event of default, and maintenance of certain financial<br />
ratios. In the event of default, the Trust’s total financial liability under this Agreement is limited to a one-time penalty<br />
payment of $250 thousand under a Letter of Credit issued in favor of CMHC.<br />
During the years ended December 31, <strong>2012</strong> and 2011, the Trust had a committed revolving credit facility with a major<br />
financial institution. This credit facility was secured by a first or second mortgage charge on specific real estate assets. The<br />
maximum amount available varies with the value of pledged assets to a maximum not to exceed $200 million and an available<br />
limit of $200 million as at December 31, <strong>2012</strong> (December 31, 2011 – $200 million). The credit facility requires monthly<br />
interest payments and is renewable <strong>annual</strong>ly subject to the mutual consent of the lender and the Trust. On July 26, <strong>2012</strong>, the<br />
lender and the Trust agreed to extend the maturity date of the revolving credit facility for an additional year, from July 28,<br />
2014 to July 27, 2015. In the event the committed revolving credit facility is not extended, the drawn-down principal would<br />
be due on the maturity date of the credit agreement.<br />
There was no amount outstanding at December 31, <strong>2012</strong> (December 31, 2011 - $nil) under this facility, except for Letters<br />
of Credit (“LCs”) issued and outstanding. The LCs totaled $3.7 million as at December 31, <strong>2012</strong> (December 31, 2011 – $3.9<br />
million). As such, approximately $196.3 million was available from this facility on December 31, <strong>2012</strong> (December 31, 2011 –<br />
$196.1 million). The credit facility carries interest rates ranging from prime to prime plus 1.0% per annum and had no fixed<br />
terms of repayment.<br />
The covenants in relation to the credit facility are discussed in NOTE 29 (d).<br />
Note 11:<br />
Debentures<br />
As at Dec 31, <strong>2012</strong> Dec 31, 2011<br />
Weighted<br />
Average<br />
Interest<br />
Debt<br />
Balance<br />
Weighted<br />
Average<br />
Interest<br />
Debt<br />
Balance<br />
Unsecured debenture<br />
Fixed rate – % $ – 5.61% $ 112,390<br />
Total $ – $ 112,390<br />
Current $ – $ 112,390<br />
Non-current – –<br />
$ – $ 112,390<br />
The unsecured debentures principal balance of $112.4 million matured on January 23, <strong>2012</strong>. Upon maturity, the unsecured<br />
debentures were settled using the Trust’s liquidity on hand (comprised largely of cash of $255.9 million).<br />
Note 12:<br />
lp Class B Units<br />
The LP Class B Units, representing an aggregate fair value of $288.8 million at December 31, <strong>2012</strong> (December 31, 2011 –<br />
$225.7 million), are non-transferable, except under certain circumstances, but are exchangeable, on a one-for-one basis,<br />
into <strong>Boardwalk</strong> <strong>REIT</strong> Units at any time at the option of the holder. Prior to such exchange, distributions will be made on<br />
these exchangeable units in an amount equivalent to the distributions which would have been made had the units been<br />
exchanged for <strong>Boardwalk</strong> <strong>REIT</strong> Units. Each LP Class B Unit was accompanied by a Special Voting Unit, which entitles the<br />
holder to receive notice of, attend, and vote at all meetings of Unitholders. There is no value assigned to the Special Voting<br />
Units. The LP Class B Units have been classified as “FVTPL” financial liabilities in accordance with IAS 39. Gains or losses<br />
116 / NOTES to CONSOLIDATED FINANCIAL STATEMENTS <strong>Boardwalk</strong> <strong>REIT</strong> / ar <strong>2012</strong>
esulting from changes in the fair value at each reporting date are recorded in the consolidated statement of comprehensive<br />
income and are discussed in NOTE 24.<br />
As at December 31, <strong>2012</strong> and 2011, there were 4,475,000 LP Class B Units issued and outstanding.<br />
Note 13:<br />
other non-current liabilities<br />
Other non-current liabilities represents the fair value of the Trust’s interest rate swaps (as described below) and totaled $5.5<br />
million as at December 31, <strong>2012</strong> (December 31, 2011 – $8.3 million).<br />
During the first quarter of 2008, <strong>Boardwalk</strong> <strong>REIT</strong> entered into an interest rate swap agreement on the mortgages of specific<br />
properties within its portfolio in an effort to hedge the variability in cash flows attributed to fluctuating interest rates. The<br />
Trust evaluates the effectiveness of these cash flow hedges at each reporting date and measures them at fair value. Any<br />
gains or losses, which arise as a result of the “effectiveness” of the hedge, will be recognized in OCI. The ineffective portion<br />
of the hedging gain or loss on the swap transaction will be recognized immediately in profit or loss. On recognition of the<br />
financial liability of the hedged item on the consolidated statement of financial position, the associated gains or losses<br />
that were recognized in OCI will be reclassified into net earnings in the same period or periods during which the interest<br />
payments of the hedged item affect net earnings. However, if all, or a portion, of the net loss recognized in OCI will not be<br />
recovered in one or more future periods, this amount will be immediately reclassified into profit or loss. At December 31,<br />
<strong>2012</strong> and December 31, 2011, the Trust has determined that these cash flow hedges were effective under IFRS and hedge<br />
accounting has been applied to these agreements in accordance with IAS 39. As such, the change in fair value has been<br />
recorded in OCI as outlined in NOTE 18(c).<br />
Settlements on both the fixed and variable portion of the interest rate swaps will occur on a monthly basis. The fixed<br />
interest rate has been set at 4.15%, plus a stamping fee of 0.25%, while the total amount of mortgage debt subject to the<br />
interest rate swaps was approximately $86.0 million at December 31, <strong>2012</strong> and $87.2 million at December 31, 2011. The<br />
mortgages of these specific properties have been included in the mortgage payable balance above (NOTE 10).<br />
Note 14:<br />
Deferred unit-based compensation<br />
Deferred unit-based compensation is comprised of the following:<br />
As at Dec 31, <strong>2012</strong> Dec 31, 2011<br />
Current $ 3,765 $ 2,636<br />
Non-current 5,306 4,396<br />
$ 9,071 $ 7,032<br />
The total of $9.1 million represents the fair value of the underlying deferred units at December 31, <strong>2012</strong> (December 31,<br />
2011 - $7.0 million). These units have been classified as “FVTPL” financial liabilities in accordance with IAS 39. Gains or losses<br />
resulting from changes in the fair value at each reporting date are recorded in the consolidated statement of comprehensive<br />
income.<br />
Details of the deferred unit-compensation plan:<br />
During 2006, the Trust implemented a deferred unit-based compensation plan. The plan entitles trustees and executives, at<br />
the participant’s option, to receive deferred units in consideration for trustee fees or a portion of executive cash bonuses,<br />
respectively, with the Trust matching the number of units received. The deferred units in consideration for trustee fees or<br />
a portion of executive cash bonuses vest immediately while the matching number of units received vest 50% on the third<br />
anniversary and 25% on each of the fourth and fifth anniversaries, subject to provisions for earlier vesting in certain events.<br />
The deferred units earn additional deferred units for the distributions that would otherwise have been paid on the deferred<br />
<strong>Boardwalk</strong> <strong>REIT</strong> / ar <strong>2012</strong><br />
NOTES to CONSOLIDATED FINANCIAL STATEMENTS / 117
units (i.e. had they instead been issued as Trust Units on the date of grant). Once vested, participants are entitled to receive<br />
an equivalent number of Trust Units representing the vesting deferred units and the corresponding additional deferred<br />
units. Cash is granted for any fractional units. The deferred unit plan was approved by Unitholders on May 10, 2006 and<br />
amended on May 13, 2008 and May 13, 2009.<br />
As at December 31, <strong>2012</strong>, the unexpired deferred units, in whole or in part, were granted as follows:<br />
Deferred units<br />
granted in Number Grant date Expiry Date<br />
Fair value at<br />
grant date<br />
2008 81,620 February, June & December 2008 February, June & December 2013 $ 2,730<br />
2009 62,822 February, June & December 2009 February, June & December 2014 $ 2,009<br />
2010 58,585 February, June & December 2010 February, June & December 2015 $ 2,326<br />
2011 51,620 February, June & December 2011 February, June & December 2016 $ 2,456<br />
<strong>2012</strong> 50,946 February, June & December <strong>2012</strong> February, June & December 2017 $ 2,946<br />
305,593 $ 12,467<br />
The initial cost of the deferred unit-based transactions is determined, in accordance with IFRS 2 – Share-based Payments<br />
(“IFRS 2”), as the fair value of the units on the grant date. The fair value of each unit granted is determined based on the<br />
weighted average observable closing market prices of the <strong>Boardwalk</strong> <strong>REIT</strong>’s Trusts Units ten trading days preceding the<br />
grant date. This initial cost of deferred units in consideration for trustee fees or a portion of executive cash bonuses is<br />
expensed immediately while the cost of the matching deferred units is expensed over the vesting period as follows:<br />
One third of the 50%, which vests in year 3, is recognized in each of years 1, 2 and 3.<br />
One quarter of the 25%, which vests in year 4, is recognized in each of years 1, 2, 3 and 4.<br />
One fifth of the 25%, which vests in year 5, is recognized in each of years 1, 2, 3, 4 and 5.<br />
For the year ended December 31, <strong>2012</strong>, total costs of $2.5 million (December 31, 2011 – $2.5 million for the year) were<br />
recognized in profit related to executive bonuses and trustee fees under the deferred unit plan.<br />
The status of the outstanding deferred units was as follows:<br />
# of Units Outstanding # of Units vested<br />
Balance, January 1, 2011 223,296 –<br />
Deferred units granted 51,620 49,160<br />
Additional deferred units earned on units 8,963 10,118<br />
Deferred units converted to Trust Units or cash (59,278) (59,278)<br />
Balance, December 31, 2011 224,601 –<br />
Deferred units granted 50,946 52,261<br />
Additional deferred units earned on units 7,196 9,914<br />
Deferred units converted to Trust Units or cash (62,175) (62,175)<br />
Balance, December 31, <strong>2012</strong> 220,568 –<br />
Note 15:<br />
tRade and other payables<br />
The components of the Trust’s accounts payable and accrued liabilities are as follows:<br />
As at Dec 31, <strong>2012</strong> Dec 31, 2011<br />
Trade payables and accrued liabilities $ 52,469 $ 53,984<br />
Provisions 3,253 2,959<br />
$ 55,722 $ 56,943<br />
118 / NOTES to CONSOLIDATED FINANCIAL STATEMENTS <strong>Boardwalk</strong> <strong>REIT</strong> / ar <strong>2012</strong>
As at December 31, <strong>2012</strong> and 2011, the Trust’s most significant provision relates to vacation payable to its employees within<br />
each employee’s individual employment agreement. The remaining provisions relate to insignificant legal claims arising<br />
from minor tenant injuries. As at December 31, <strong>2012</strong> and 2011, the Trust does not have any material contingent liabilities.<br />
Note 16:<br />
income taxes<br />
Current income tax<br />
As at December 31, <strong>2012</strong> and 2011, none of the Trust’s corporate entities have current taxes payable. Each corporate entity<br />
either has sufficient tax deductions to offset any taxable income or has operating losses from previous years to apply<br />
against any taxable income. As such, no current income taxes payable was recorded for the Trust’s corporate entities.<br />
Deferred income tax<br />
For fiscal 2011 and <strong>2012</strong>, <strong>Boardwalk</strong> <strong>REIT</strong> is a “mutual fund trust” as defined under the Income Tax Act (Canada) (the “Tax<br />
Act”) and as a Real Estate Investment Trust (“<strong>REIT</strong>”) eligible for the ‘<strong>REIT</strong> Exemption’ in accordance with the rules affecting<br />
the tax treatment of publicly traded trusts. Accordingly, the Trust is not taxable on its income provided all of its taxable<br />
income is distributed to its Unitholders. It should be noted that, based on a detailed review of the <strong>REIT</strong> Exemption criteria,<br />
it could have been interpreted that prior to January 1, 2011, the Trust did not qualify as a <strong>REIT</strong>, which would have exempted<br />
the Trust from the specified investment flow-through rules (the “SIFT Rules”). As a result, the Trust reversed its previously<br />
recorded deferred tax liability related to the SIFT Rules on January 1, 2011. This exemption, however, does not extend to the<br />
corporate subsidiaries of <strong>Boardwalk</strong> <strong>REIT</strong> that are subject to income tax.<br />
On December 16, 2010, the Government of Canada proposed technical amendments clarifying the definition of a <strong>REIT</strong> for<br />
Canadian income tax purposes. The proposed amendments included the following clarifications as applicable to the Trust:<br />
(i) amounts distributed to a <strong>REIT</strong> by an entity in which the <strong>REIT</strong> has a significant interest will retain the source character of<br />
income earned by the subsidiary entity, and (ii) the revenue requirements in the definition of a <strong>REIT</strong> will be amended by<br />
replacing the term “revenues” with the term “gross <strong>REIT</strong> revenue”. The proposed changes outlined above in their current<br />
form will allow the Trust, with greater certainty, to qualify as a <strong>REIT</strong> for Canadian income tax purposes. On October 24, <strong>2012</strong>,<br />
legislation was tabled by the Government of Canada, which, among other changes, implemented the December 16, 2010<br />
technical amendments. In accordance with IAS 12 – Income Taxes, the December 16, 2010 technical amendments were<br />
considered substantively enacted, effective November 21, <strong>2012</strong>, when the legislation was introduced for First Reading by<br />
the Government of Canada.<br />
The source of deferred tax balances and movements were as follow:<br />
As at Dec 31, 2011<br />
Recognized<br />
in profit Dec 31, <strong>2012</strong><br />
Deferred tax assets (liabilities) related to:<br />
Operating losses $ 566 $ 266 $ 832<br />
Differences in tax base and carrying amount, net, investment<br />
properties and PP&E for corporate entities 159 (48) 111<br />
Other (10) 5 (5)<br />
Net deferred tax assets (liabilities) $ 715 $ 223 $ 938<br />
Deferred tax assets 725 220 945<br />
Deferred tax liabilities (10) 3 (7)<br />
Net deferred tax assets (liabilities) $ 715 $ 223 $ 938<br />
<strong>Boardwalk</strong> <strong>REIT</strong> / ar <strong>2012</strong><br />
NOTES to CONSOLIDATED FINANCIAL STATEMENTS / 119
As at Dec 31, 2010<br />
Recognized<br />
in profit Dec 31, 2011<br />
Deferred tax assets (liabilities) related to:<br />
Operating losses $ 565 $ 1 $ 566<br />
Differences in tax base and carrying amount, net, investment<br />
properties and PP&E, SIFT Legislation (740,355) 740,355 –<br />
Differences in tax base and carrying amount, net, investment<br />
properties and PP&E for corporate entities 117 42 159<br />
Other (5) (5) (10)<br />
Net deferred tax (liabilities) assets $ (739,678) $ 740,393 $ 715<br />
Deferred tax assets 681 44 725<br />
Deferred tax liabilities (740,359) 740,349 (10)<br />
Net deferred tax (liabilities) assets $ (739,678) $ 740,393 $ 715<br />
No current income taxes or deferred income taxes were recognized in equity, other than profit or OCI, for the years ended<br />
December 31, <strong>2012</strong> and 2011.<br />
Wholly owned Canadian corporate subsidiaries have deferred tax assets of $0.8 million (December 31, 2011 – $0.6 million)<br />
related to operating losses, which expire over the next three to twenty years. The Trust believes that future income of<br />
these entities, which gave rise to the deferred tax assets, will be sufficient to utilize these deferred tax assets prior to their<br />
expiration.<br />
The major components of income tax expense (recovery) include the following:<br />
Year ended<br />
Dec 31, <strong>2012</strong><br />
Year ended<br />
Dec 31, 2011<br />
Current tax expense $ 1 $ 2<br />
Deferred tax recovery (223) (740,393)<br />
Total income tax recovery $ (222) $ (740,391)<br />
The income tax expense (recovery) for the year can be reconciled to the accounting profit as follows:<br />
Year ended<br />
Dec 31, <strong>2012</strong><br />
Year ended<br />
Dec 31, 2011<br />
Profit before income tax recovery $ 688,292 $ 484,695<br />
Remove profit from non-taxable entities (645,186) (442,184)<br />
Accounting profit subject to tax 43,106 42,511<br />
Deduct management fee charged to corporate entities (43,115) (42,395)<br />
Taxable profit (9) 116<br />
Weighted average substantively enacted tax rate 26.9% 26.5%<br />
Calculated income tax (recovery) expense (2) 31<br />
Reversal of previously recorded SIFT liability – (740,355)<br />
Changes to other deferred tax liabilities (220) (67)<br />
Total income tax recovery $ (222) $ (740,391)<br />
As at December 31, <strong>2012</strong> and 2011, the Trust does not have any unrecognized deductible temporary differences, unrecognized<br />
tax losses and unused tax credits.<br />
120 / NOTES to CONSOLIDATED FINANCIAL STATEMENTS <strong>Boardwalk</strong> <strong>REIT</strong> / ar <strong>2012</strong>
Note 17:<br />
DefeRRed government grant<br />
The Trust has commenced the construction of a 109-unit, four storey, elevatored, wood frame building in the southwest<br />
part of Calgary, Alberta (the “Project” or “Development”). The Development is being constructed on existing land density<br />
the Trust currently has on a property known as ‘Spruce Ridge’. In conjunction with this Development, the Trust has applied<br />
and received approval for a government grant from the Province of Alberta totaling approximately $7.5 million. In return for<br />
this grant, the Trust has agreed to provide 54 of the 109 units at rents to be 10% below the average market rates for Calgary<br />
(“affordable units”) for a term of 20 years.<br />
The grant proceeds will be paid to <strong>Boardwalk</strong> <strong>REIT</strong> in four installments based on certain completion milestones.<br />
a) 30% upon the Province of Alberta’s receipt of appropriate paperwork indicative of commencement of the Project;<br />
b) 30% upon 30% completion of the Project;<br />
c) 30% upon 60% completion of the Project; and<br />
d) The remaining 10% to be paid when the Project has been completed and final documents have been audited.<br />
As at December 31, <strong>2012</strong>, approximately $2.3 million of the $7.5 million was received by the Trust. Any portion of the $7.5<br />
million grant that exceeds 65% of the contracted construction costs of the Development, including the land value attributed<br />
to the project, must be repaid by the Trust. In addition, a portion of the grant is repayable to the Province of Alberta,<br />
in proportion to the years remaining in the 20-year term, if the agreement to provide affordable units terminates earlier.<br />
This grant will be recognized in profit or loss on a systematic basis over the periods in which the Trust recognizes revenue<br />
from the 54 units classified as affordable units.<br />
Note 18:<br />
unitholders’ equity<br />
The Plan of Arrangement (the “Arrangement”) converting the Corporation from a share corporation to a real estate investment<br />
trust was completed on May 3, 2004. On conversion of the Corporation to <strong>Boardwalk</strong> Real Estate Investment Trust,<br />
the Corporation incurred $10.3 million in restructuring costs. Under the Arrangement, the former shareholders of the<br />
Corporation received <strong>Boardwalk</strong> <strong>REIT</strong> Units or Class B Limited Partnership Units (“LP Class B Units”) of a controlled limited<br />
partnership of the Trust, <strong>Boardwalk</strong> <strong>REIT</strong> Limited Partnership. The interests in <strong>Boardwalk</strong> <strong>REIT</strong> are represented by two classes<br />
of units: a class described and designated as “<strong>REIT</strong> Units” and a class described and designated as “Special Voting Units”. The<br />
LP Class B Units are classified as a financial liability in accordance with IAS 32 and are discussed in NOTE 12.<br />
(a) <strong>REIT</strong> Units<br />
<strong>REIT</strong> Units represent an undivided beneficial interest in <strong>Boardwalk</strong> <strong>REIT</strong> and in distributions made by <strong>Boardwalk</strong> <strong>REIT</strong>. The<br />
<strong>REIT</strong> Units are freely transferable, subject to applicable securities regulatory requirements. Each <strong>REIT</strong> Unit entitles the<br />
holder to one vote at all meetings of Unitholders. Except as set out under the redemption rights below, the <strong>REIT</strong> Units have<br />
no conversion, retraction, redemption or pre-emptive rights.<br />
<strong>REIT</strong> Units are redeemable at any time, in whole or in part, on demand by the holders. Upon receipt by <strong>Boardwalk</strong> <strong>REIT</strong> of<br />
a written redemption notice and other documents that may be required, all rights to and under the <strong>REIT</strong> Units tendered<br />
for redemption shall be surrendered and the holder shall be entitled to receive a price per <strong>REIT</strong> Unit equal to the lesser of:<br />
(i) 90% of the “market price” of the <strong>REIT</strong> Units on the principal market on which the <strong>REIT</strong> Units are quoted for trading<br />
during the twenty-day period ending on the trading day prior to the day on which the <strong>REIT</strong> Units were surrendered to<br />
<strong>Boardwalk</strong> <strong>REIT</strong> for redemption; and,<br />
(ii) 100% of the “closing market price” of the <strong>REIT</strong> Units on the principal market on which the <strong>REIT</strong> Units are quoted<br />
for trading on the redemption date.<br />
<strong>Boardwalk</strong> <strong>REIT</strong> / ar <strong>2012</strong><br />
NOTES to CONSOLIDATED FINANCIAL STATEMENTS / 121
The Declaration of Trust authorizes <strong>Boardwalk</strong> <strong>REIT</strong> to issue an unlimited number of Units for the consideration and on<br />
terms and conditions established by the Trustees without the approval of any Unitholders.<br />
Units issued and outstanding are as follows:<br />
As at Dec 31, <strong>2012</strong> Dec 31, 2011<br />
<strong>REIT</strong> Units outstanding, beginning of year 47,789,492 47,891,133<br />
Units issued for vested deferred units 62,175 59,259<br />
Units purchased and cancelled – (160,900)<br />
<strong>REIT</strong> Units outstanding, end of year 47,851,667 47,789,492<br />
On a periodic basis, <strong>Boardwalk</strong> <strong>REIT</strong> will apply to the Toronto Stock Exchange (“TSX”) for approval of Normal Course Issuer<br />
Bids (the “Bids”). Pursuant to regulations of these Bids, <strong>Boardwalk</strong> <strong>REIT</strong> will receive approval to purchase and cancel a specified<br />
number of Trust Units, representing 10% of the public float of its Trust Units at the time of the TSX approval. The Bids<br />
will terminate on the earlier of the termination date or at such time as the purchases under the Bid are completed.<br />
In the last application, <strong>Boardwalk</strong> <strong>REIT</strong> requested and received regulatory approval for a Bid (<strong>Boardwalk</strong>’s fifth Bid since its<br />
first Bid in August of 2007), which commenced on August 24, 2011 and terminated on August 23, <strong>2012</strong>. The Bid allowed<br />
<strong>Boardwalk</strong> <strong>REIT</strong> to purchase and cancel up to 3,884,118 Trust Units.<br />
For the years ended December 31, <strong>2012</strong> and 2011, <strong>Boardwalk</strong> <strong>REIT</strong> purchased and cancelled the following Trust Units:<br />
Dec 31, <strong>2012</strong> Dec 31, 2011<br />
Bid Number<br />
Number of<br />
Trust Units<br />
Purchased<br />
and Cancelled<br />
Purchase<br />
Cost<br />
Cost per<br />
Trust Unit<br />
Number of<br />
Trust Units<br />
Purchased<br />
and Cancelled<br />
Purchase<br />
Cost<br />
Cost<br />
per Trust Unit<br />
1 – – – – – –<br />
2 – – – – – –<br />
3 – – – – – –<br />
4 – – – 160,900 $ 6,740 $ 41.89<br />
5 – – – – – –<br />
– $ – $ – 160,900 $ 6,740 $ 41.89<br />
Since the Trust began utilizing normal course issuer bids, <strong>Boardwalk</strong> <strong>REIT</strong> has purchased and cancelled Trust Units as follows:<br />
Cumulative Number of<br />
Year Ended December 31,<br />
Trust Units Purchased<br />
and Cancelled Cumulative Purchase Cost<br />
Average Cost<br />
per Trust Unit<br />
2007 856,447 $ 38,577 $ 45.04<br />
2008 2,312,000 85,412 $ 36.94<br />
2009 790,000 22,756 $ 28.80<br />
2010 423,400 17,024 $ 40.21<br />
2011 160,900 6,740 $ 41.89<br />
<strong>2012</strong> – – –<br />
4,542,747 $ 170,509 $ 37.53<br />
122 / NOTES to CONSOLIDATED FINANCIAL STATEMENTS <strong>Boardwalk</strong> <strong>REIT</strong> / ar <strong>2012</strong>
(b) Special Voting Units<br />
The Declaration of Trust provides for the issuance of an unlimited number of Special Voting Units that will be used to<br />
provide voting rights to holders of LP Class B Units or other securities that are, directly or indirectly, exchangeable for <strong>REIT</strong><br />
Units. Each Special Voting Unit entitles the holder to the number of votes at any meeting of Unitholders, which is equal<br />
to the number of <strong>REIT</strong> Units that may be obtained upon surrender of the LP Class B Units or other securities to which the<br />
Special Voting Unit relates. The Special Voting Units do not entitle or give any rights to the holders to receive distributions<br />
or any amount upon liquidation, dissolution or winding-up of <strong>Boardwalk</strong> <strong>REIT</strong>.<br />
In summary, the Trust has the following capital securities outstanding:<br />
Units outstanding<br />
Dec 31, <strong>2012</strong><br />
Monthly<br />
Distribution<br />
Units outstanding<br />
Dec 31, 2011<br />
Monthly<br />
Distribution<br />
<strong>Boardwalk</strong> <strong>REIT</strong> Units 47,851,667 $0.16/unit 47,789,492 $0.15/unit<br />
Special Voting Units 4,475,000 N/A 4,475,000 N/A<br />
Monthly distributions are determined at the discretion of the Board of Trustees. The Board of Trustees declares distributions<br />
to be paid on, or about, the 15th of the month following the record date. Distributions to be paid on the <strong>Boardwalk</strong> <strong>REIT</strong><br />
Units with a record date of January 31, 2013 (to be paid on February 15, 2013) totaled $7.7 million ($0.16 per unit) and have<br />
not been included as a liability in the consolidated statement of financial position as at December 31, <strong>2012</strong>.<br />
(c)<br />
Accumulated other comprehensive income (“AOCI”)<br />
For the years ended December 31, <strong>2012</strong> and 2011, AOCI consists of the following amounts:<br />
Year ended<br />
Dec 31, <strong>2012</strong><br />
Year ended<br />
Dec 31, 2011<br />
AOCI, beginning of year $ (8,458) $ (6,587)<br />
Change in fair value of the effective portion of the interest rate swaps 2,830 (1,896)<br />
Losses on settlement of effective bond forward 20 25<br />
AOCI, end of year $ (5,608) $ (8,458)<br />
In 2008, <strong>Boardwalk</strong> <strong>REIT</strong> entered into an interest rate swap agreement on the mortgages of specific properties within its<br />
portfolio in an effort to hedge the variability in cash flows attributed to fluctuating interest rates. These interest rate swap<br />
agreements were designated as cash flow hedges under Canadian GAAP and meet the criteria to be designated as effective<br />
cash flow hedges under IFRS at the Transition Date. At December 31, <strong>2012</strong> and 2011, the Trust has determined that these<br />
cash flow hedges were effective under IFRS and hedge accounting has been applied to these agreements in accordance<br />
with IAS 39. The Trust evaluates the effectiveness of these cash flow hedges at each reporting date and measures them<br />
at fair value. Any gains or losses, which arise as a result of the “effectiveness” of the hedge, will be recognized in OCI. The<br />
ineffective portion of the hedging gain or loss on the swap transaction will be recognized immediately in profit or loss. On<br />
recognition of the financial liability of the hedged item on the consolidated statement of financial position, the associated<br />
gains or losses that were recognized in OCI will be reclassified into net earnings in the same period or periods during which<br />
the interest payments of the hedged item affect net earnings. However, if all, or a portion, of the net loss recognized in<br />
OCI will not be recovered in one or more future periods, this amount will be immediately reclassified into profit or loss.<br />
For the year ended December 31, <strong>2012</strong>, a gain of $2.8 million was recognized in OCI from the effective portion of the swap<br />
(December 31, 2011 – $1.9 million loss).<br />
In 2008, the Trust entered into a forward bond transaction (the “Transaction”) with a major Canadian financial institution. In<br />
total, the Transaction, which comprised of bond forward contracts on specific mortgages that matured and were renewed<br />
in 2008, was for a total nominal amount of $101.6 million with a weighted average term and interest rate of 7.2 years and<br />
3.63%, respectively. Only one of the bond forward contracts, which was settled for a loss of $284 thousand, remained as<br />
an effective hedge and is being amortized over the term of the hedged item. As of December 31, <strong>2012</strong>, the unamortized<br />
<strong>Boardwalk</strong> <strong>REIT</strong> / ar <strong>2012</strong><br />
NOTES to CONSOLIDATED FINANCIAL STATEMENTS / 123
alance was $156 thousand (December 31, 2011 unamortized balance - $176 thousand). The amount of $20 thousand was<br />
recognized in profit or loss under financing charges for the year ended December 31, <strong>2012</strong> ($25 thousand for the year ended<br />
December 31, 2011).<br />
(d) Earnings per unit<br />
Year ended<br />
Dec 31, <strong>2012</strong><br />
Year ended<br />
Dec 31, 2011<br />
Numerator<br />
Profit – basic $ 688,514 $ 1,225,086<br />
Loss on fair value adjustments to unexercised deferred units – 874<br />
Distribution paid on LP Class B units – 8,055<br />
Loss on fair value adjustment to LP Class B units – 41,125<br />
Profit – diluted 688,514 1,275,140<br />
Denominator<br />
Weighted average units outstanding – basic 47,818,817 47,782,400<br />
Conversion of LP Class B units – 4,475,000<br />
Weighted average units outstanding - diluted 47,818,817 52,257,400<br />
Earnings per unit – basic $ 14.40 $ 25.64<br />
Earnings per unit – diluted $ 14.40 $ 24.40<br />
All dilutive elements were included in the calculation of diluted per unit amounts. The effect of settling all outstanding<br />
deferred units and LP Class B Units was dilutive in 2011, but anti-dilutive in <strong>2012</strong>.<br />
Note 19:<br />
Rental revenue<br />
The Trust leases residential rental properties under operating leases generally with a term of not more than 12 months and<br />
in many cases tenants lease rental space on a month-to-month basis. Rental incentives may be offered as part of a rental<br />
agreement and the costs associated with these incentives are amortized over the term of the lease and netted against residential<br />
rental revenue. As such, rental revenue represents all revenue earned from the Trust’s operating leases and totaled<br />
$433.2 million for the year ended December 31, <strong>2012</strong> (December 31, 2011 – $416.2 million).<br />
As at December 31, <strong>2012</strong>, under its non-cancellable operating leases, <strong>Boardwalk</strong> <strong>REIT</strong> was entitled to the following<br />
minimum future payments:<br />
Within 12 months 2 to 5 years Over 5 years<br />
Operating leases $ 139,623 $ 11,412 $ 1,542<br />
Note 20:<br />
Ancillary rental income<br />
Ancillary rental income was comprised of the following:<br />
Year ended<br />
Dec 31, <strong>2012</strong><br />
Year ended<br />
Dec 31, 2011<br />
Revenue from coin laundry machines $ 5,443 $ 5,342<br />
Revenue from telephone and cable providers 1,253 1,233<br />
Total $ 6,696 $ 6,575<br />
124 / NOTES to CONSOLIDATED FINANCIAL STATEMENTS <strong>Boardwalk</strong> <strong>REIT</strong> / ar <strong>2012</strong>
Note 21:<br />
Financing costs<br />
Financing costs are comprised of interest on mortgages payable, interest on the unsecured debentures (which matured<br />
on January 23, <strong>2012</strong>), distributions paid to the LP Class B Unitholders and other interest charges. Financing costs are net<br />
of interest income earned. Financing costs total $98.1 million for the year ended December 31, <strong>2012</strong> (December 31, 2011 –<br />
$105.6 million) and can be summarized as follows:<br />
Year ended<br />
Dec 31, <strong>2012</strong><br />
Year ended<br />
Dec 31, 2011<br />
Interest on secured debt (mortgages payable) $ 89,813 $ 92,320<br />
Interest on unsecured debt (debentures) 404 6,306<br />
LP Class B unit distribution 8,413 8,055<br />
Other interest charges 1,486 1,583<br />
Interest income (2,054) (2,695)<br />
Total $ 98,062 $ 105,569<br />
Note 22:<br />
Depreciation and amortization<br />
The components of depreciation and amortization were as follows:<br />
Year ended<br />
Dec 31, <strong>2012</strong><br />
Year ended<br />
Dec 31, 2011<br />
Amortization of deferred financing costs $ 7,162 $ 7,071<br />
Depreciation of property, plant and equipment 3,760 3,449<br />
Total $ 10,922 $ 10,520<br />
Note 23:<br />
gain on sale of assets<br />
During the fourth quarter of <strong>2012</strong>, certain fully depreciated computer equipment was sold to a third party valued at $135<br />
thousand in exchange for rent payment forgiveness on one of the Trust’s data centers of approximately $11 thousand per<br />
month for the next twelve months beginning December 16, <strong>2012</strong>.<br />
During the third quarter of 2011, coin laundry appliances were sold to a third-party for cash proceeds of $618 thousand. No<br />
gain or loss on sale was recorded as the proceeds approximated their carrying costs.<br />
Note 24:<br />
Fair value gains<br />
The components of fair value gains (losses) were as follows:<br />
Year ended<br />
Dec 31, <strong>2012</strong><br />
Year ended<br />
Dec 31, 2011<br />
Investment properties $ 616,433 $ 406,388<br />
Financial liabilities designated as FVTPL<br />
Deferred unit-based compensation (3,394) (874)<br />
LP Class B Units (63,053) (41,125)<br />
Total fair value gains $ 549,986 $ 364,389<br />
<strong>Boardwalk</strong> <strong>REIT</strong> / ar <strong>2012</strong><br />
NOTES to CONSOLIDATED FINANCIAL STATEMENTS / 125
Note 25:<br />
operating leases<br />
The Trust has entered into various lease agreements as part of the normal course of its operations. The following represents<br />
the major type of leases the Trust maintains as lessee, all of which qualify as operating leases in accordance with IAS 17 -<br />
Leases (“IAS 17”):<br />
(i) Land leases<br />
The Trust has entered into non-cancellable land leases for land related to five of its buildings, which sit on land that<br />
is not owned by the Trust. Approximate remaining terms of the Trust’s land leases range from 16 to 83 years as at<br />
December 31, <strong>2012</strong>. Two of the land leases provide for <strong>annual</strong> rent and one of the land leases provide for <strong>annual</strong> rent<br />
and additional rent based on rental revenue collected.<br />
(ii) Warehouse and office space leases<br />
The Trust has entered into lease agreements for warehouse and some office and data centre space it utilizes but does<br />
not own. A portion of the office space leased is subleased to other businesses. All of the leasing arrangements related<br />
to warehouse space have renewal options of between one and five years with the exception of one of the leasing<br />
arrangements for which no renewal option exists. The lease for some office and data centre space, and all subleases to<br />
other businesses, expired on December 15, <strong>2012</strong>. Subsequently, the Trust entered into a new five-year lease agreement<br />
for the office space and a five-year sublease agreement for its data centre space.<br />
As at December 31, <strong>2012</strong>, future minimum lease payments related to these leases were as follows:<br />
Within 12 months 2 to 5 years Over 5 years<br />
Land leases $ 3,913 $ 17,189 $ 172,969<br />
Warehouse and office space 700 691 10<br />
$ 4,613 $ 17,880 $ 172,979<br />
The Trust recognized lease expenses of $4.7 million and received sublease payments of $134 thousand for the year ended<br />
December 31, <strong>2012</strong> ($4.6 million and $229 thousand, respectively, for the year ended December 31, 2011).<br />
Note 26:<br />
guarantees, contingencies, coMMitments and other<br />
As discussed in NOTE 25 above, the Trust has five properties that are situated on land leases. One of the land leases situated<br />
in Montreal is set to expire in early 2029. The Trust is actively seeking to either renew the term of this lease or purchase the<br />
freehold interest in the land prior to the expiry of the lease term. However, if the Trust cannot or chooses not to renew the<br />
lease, or buy the land, as the case may be, the net operating income and cash flow associated with the property would<br />
no longer contribute to <strong>Boardwalk</strong>’s results of operations and could adversely impact its ability to make distributions to<br />
Unitholders. Another land lease, situated in Calgary, which expires in 2065, is scheduled for a reset to the <strong>annual</strong> rent in 2016<br />
to 7% of the agreed upon land value in 2016. Since the agreed upon land value in 2016 cannot be predicted or estimated<br />
with certainty, the Trust continues to reflect the existing rental amount throughout the term of this lease.<br />
From time to time, the Trust enters into various supply contracts for energy commodities to hedge its usage.<br />
For the period from November 1, 2010 to October 31, 2011, the Trust had a physical supply contract covering all of its natural<br />
gas requirements for the Province of Saskatchewan at a price of $4.81/GJ. The Trust also negotiated a new physical supply<br />
agreement for Saskatchewan, which covered the period from November 1, 2011 to October 31, <strong>2012</strong>, and provided the<br />
commodity at a price of $4.17/GJ. This physical supply agreement was renewed for a further two-year term commencing<br />
November 1, <strong>2012</strong> to October 31, 2014. The new supply contract provides the commodity at a price of $3.74/GJ.<br />
In addition to the Province of Saskatchewan, the Trust also had a natural gas supply contract for the Provinces of Ontario<br />
and Quebec to cover approximately 50% of the natural gas usage in those two provinces for the period from November<br />
126 / NOTES to CONSOLIDATED FINANCIAL STATEMENTS <strong>Boardwalk</strong> <strong>REIT</strong> / ar <strong>2012</strong>
1, 2010 to October 31, 2011 at a price of $4.07/GJ. On October 21, 2010, the Trust negotiated a two-year supply contract to<br />
ensure supply of the remaining 50% of natural gas usage for the Provinces of Ontario and Quebec at a price of $4.11/GJ for<br />
the period from November 1, 2010 to October 31, <strong>2012</strong>.<br />
On June 10, 2010, the Trust entered into a long-term supply contract with one electrical utility company to supply the<br />
Trust with its electrical power needs for Southern Alberta for a three-year period commencing October 1, 2010 and ending<br />
September 30, 2013, at a blended rate of approximately $0.06/kWh.<br />
On September 13, 2010, the Trust entered into a long-term supply contract with one electrical utility company to supply the<br />
Trust with its electrical power needs for Northern Alberta for a five-year period commencing October 1, 2010, and ending<br />
September 30, 2015, at a blended rate of approximately $0.06/kWh.<br />
<strong>Boardwalk</strong> <strong>REIT</strong>, in the normal course of operations, will become subject to a variety of legal and other claims against the<br />
Trust, most of which are minor in nature. Management and the Trust’s legal counsel evaluate all claims on their apparent<br />
merits, and accrue management’s best estimate of the estimated costs to satisfy such claims.<br />
Note 27:<br />
capital management and liquidity<br />
The Trust defines capital resources as the aggregate of Unitholders’ equity at market value, debt (both secured and unsecured),<br />
cash flows from operations, and amounts available under credit facilities net of cash on hand. The Trust’s capital<br />
management framework is designed to maintain a level of capital that allows it to implement its business strategy while<br />
complying with investment and debt restrictions pursuant to <strong>Boardwalk</strong> <strong>REIT</strong>’s DOT as well as existing debt covenants and<br />
continue building long-term Unitholder value while maintaining sufficient capital contingency. The main components of<br />
the Trust’s capital allocation are approved by its Unitholders as stipulated in the Trust’s DOT and on a regular basis by its<br />
Board of Trustees (the “Board”) through their <strong>annual</strong> review of the Trust’s strategic plan and budget, supplemented by<br />
periodic Board and Board Committee meetings. Capital adequacy is monitored by the Trust by assessing performance<br />
against the approved <strong>annual</strong> plan throughout the year, which is updated accordingly, and by monitoring adherence to<br />
investment and debt restrictions contained in the DOT and debt covenants. <strong>Boardwalk</strong> <strong>REIT</strong>’s DOT, as amended, provides<br />
for a minimum interest coverage ratio of 1.5 to 1 calculated on the most recently completed four fiscal quarters. The DOT<br />
also defines interest expense to exclude distributions on the LP Class B Units, which under IFRS are considered financing<br />
charges.<br />
The interest service coverage ratio replaced the previous maximum total debt level of up to 70% of Gross Book Value<br />
(“GBV”). GBV was previously defined in the DOT as total assets plus the amortization of property, plant and equipment,<br />
as recorded by the Trust, whereas debt was defined to exclude trade accounts payable, distribution payable, securities<br />
issued by the Trust or its subsidiaries, including, but not limited to, the LP Class B Units, and accrued liabilities arising in the<br />
ordinary course of business.<br />
The following table highlights <strong>Boardwalk</strong> <strong>REIT</strong>’s interest service coverage ratio in accordance with the DOT:<br />
As at Dec 31, <strong>2012</strong><br />
Consolidated EBITDA (12 months ended December 31) $ 247,155<br />
Consolidated Interest Expense (12 months ended December 31) 89,649<br />
Interest Coverage Ratio 2.76<br />
Minimum Threshold 1.50<br />
The Trust employs a broad range of financing strategies to facilitate growth and manage financial risk. The Trust’s objective<br />
is to reduce its weighted average cost of capital and improve Unitholder distributions through value enhancement initiatives<br />
and consistent monitoring of the balance between debt and equity financing. As at December 31, <strong>2012</strong>, the Trust’s<br />
weighted average cost of capital was 3.86%.<br />
<strong>Boardwalk</strong> <strong>REIT</strong> / ar <strong>2012</strong><br />
NOTES to CONSOLIDATED FINANCIAL STATEMENTS / 127
The following schedule details the components of the Trust’s capital and the related costs thereof:<br />
As at Dec 31, <strong>2012</strong> Dec 31, 2011<br />
Cost of Capital (1) Underlying Value (2) Cost of Capital (1) Underlying Value 2)<br />
Liabilities<br />
Mortgages payable 3.69% $ 2,329,060 4.08% $ 2,343,615<br />
Unsecured debenture –% – 5.61% 112,504<br />
LP Class B Units 3.98% 288,772 4.40% 225,719<br />
Deferred unit-based<br />
compensation 3.98% 9,071 4.40% 7,032<br />
Unitholders’ equity<br />
<strong>Boardwalk</strong> <strong>REIT</strong> Units 3.98% 3,087,868 4.40% 2,410,502<br />
Total 3.86% $ 5,714,771 4.28% $ 5,099,372<br />
(1) As a percentage of average carrying value unless otherwise noted.<br />
(2) Underlying value of liabilities represents carrying value or the cost to retire on maturity. Underlying value of equity is based on the<br />
closing stock price of the Trust’s Units.<br />
Mortgages payable – These are the mortgages outstanding on the Trust’s investment properties. The debt is primarily fixed<br />
rate debt and approximately 99.2% of this debt at December 31, <strong>2012</strong> is insured under the National Housing Act (“NHA”).<br />
These financings are typically structured on a loan to appraised value basis between 75-80%. The Trust currently has a level<br />
of indebtedness of approximately 41% of the fair value of the Trust’s investment properties. This level of indebtedness is<br />
considered by the Trust to be within its target.<br />
Unsecured debenture – The unsecured debenture represents the debt outstanding on a debenture issuance in a public<br />
offering on January 21, 2005. <strong>Boardwalk</strong> <strong>REIT</strong> completed the issuance of unsecured debentures in a public offering in the<br />
aggregate amount of $120 million. The debentures were rated “BBB” with a stable trend by Dominion Bond Rating Services,<br />
carry a coupon rate of 5.61% (5.31% prior to July 30, 2008), and matures on January 23, <strong>2012</strong>. During the first quarter of<br />
2009, the Trust acquired in the open market a total face value of $7.6 million of these unsecured debentures for cancellation.<br />
These were purchased at a discount to the face value of the reported debentures. The debentures were repaid in full in<br />
January of <strong>2012</strong>. See Note 11 above for additional information on the unsecured debenture.<br />
LP Class B Units – These units are non-transferable, except under certain circumstances, but are exchangeable, on a onefor-one<br />
basis, into <strong>Boardwalk</strong> <strong>REIT</strong> Units at any time at the option of the holder. Prior to such exchange, distributions will be<br />
made on the exchangeable units in an amount equivalent to the distributions which would have been made had the units<br />
of <strong>Boardwalk</strong> <strong>REIT</strong> been issued. Each LP Class B Unit was accompanied by a Special Voting Unit, which entitles the holder<br />
to receive notice of, attend and vote at all meetings of Unitholders. There is no value assigned to the Special Voting Units.<br />
The LP Class B Units have been classified as “FVTPL” financial liabilities in accordance with IAS 32. Gains or losses resulting<br />
from changes in the fair value at each reporting date are recorded in the consolidated statement of comprehensive income.<br />
As outlined in NOTE 29 (d), <strong>Boardwalk</strong> <strong>REIT</strong>’s committed revolving credit facility agreements contain financial covenants.<br />
Available liquidity as at December 31, <strong>2012</strong> included cash on hand of $138.7 million (December 31, 2011 – $255.9 million)<br />
as well as an unused committed revolving credit facility of $196.3 million (December 31, 2011 – $196.1 million). The Trust<br />
monitors its ratios and as at December 31, <strong>2012</strong> and 2011, the Trust was in compliance with all covenants in both its DOT<br />
and all existing debt facilities.<br />
128 / NOTES to CONSOLIDATED FINANCIAL STATEMENTS <strong>Boardwalk</strong> <strong>REIT</strong> / ar <strong>2012</strong>
Note 28:<br />
Financial instruments<br />
(a) Hedging transactions<br />
In 2008, the Trust entered into a bond forward transaction (the “Transaction”) with a major Canadian financial institution.<br />
In total, the Transaction, which comprised of bond forward contracts on specific mortgages set to mature and be renewed<br />
in 2008, was for a total notional amount of $101.6 million with a weighted average term and interest rate of 7.2 years and<br />
3.63%, respectively; except for one of the contracts, all remaining contracts were assessed to be ineffective hedges. The<br />
bond forward contract assessed to be an effective hedge was settled for a loss of $284 thousand, which will be amortized<br />
over the term of the hedged item. As at December 31, <strong>2012</strong>, the unamortized balance was $156 thousand (December 31,<br />
2011 – $176 thousand) and $20 thousand was recognized in profit under financing charges for the year ended December<br />
31, <strong>2012</strong> ($25 thousand for the year ended December 31, 2011).<br />
During the first quarter of 2008, the Trust entered into an interest rate swap agreement on the mortgages of specific properties<br />
within its portfolio in an effort to hedge the variability in cash flows attributed to fluctuating interest rates. These<br />
interest rate swap agreements were designated as cash flow hedges on March 11, 2008. The effective date of the hedge was<br />
May 1, 2008 and the agreements will continue to be designated as such until May 1, 2015. Settlements on both the fixed<br />
and variable portion of the interest rate swap will occur on a monthly basis. The fixed interest rate is 4.15%, plus a stamping<br />
fee of 0.25%, while the total amount of the mortgage debt subject to the interest rate swap is $86.0 million (December 31,<br />
2011 – $87.2 million).<br />
The Trust has determined the interest rate swap agreement described above to be an effective cash flow hedge in accordance<br />
with IAS 39 - Financial Instruments: Recognition and Measurement (“IAS 39”). The effectiveness of the hedging<br />
relationship has been assessed at the transition date to IFRS and will be reviewed on a quarterly basis and measured at<br />
fair value. The portion of the gain or loss on the swap transaction that is determined to be an effective hedge will be recognized<br />
in other comprehensive income (“OCI”). To date, these interest rates swaps have been effective, and therefore all<br />
gains or losses have been recorded to OCI. The ineffective portion of the hedging gain or loss on the swap transaction will<br />
be recognized immediately in net earnings. However, to date there have been no ineffective portions on these swaps. On<br />
recognition of the financial liability of the hedged item on the consolidated statement of financial position, the associated<br />
gains or losses that were recognized in OCI will be reclassified into profit or loss in the same period or periods during which<br />
the interest payments of the hedged item affected profit or loss. However, if all or a portion of the net loss recognized in<br />
OCI will not be recovered in one or more future periods, the amount not expected to be recovered will be immediately<br />
reclassified into profit or loss.<br />
As at December 31, <strong>2012</strong>, the interest rate swap agreement was reassessed to be an effective hedge and, consistent with the<br />
previous periods, any gains or losses on the interest rate swap agreement were recognized in profit or loss in the periods<br />
during which the interest payments on the hedged items were recognized. For the year ended December 31, <strong>2012</strong>, a gain<br />
of $2.8 million was recognized in OCI for the fair value change of the interest rate swaps (December 31, 2011 – loss of $1.9<br />
million).<br />
(b) Fair value of financial instruments<br />
Fair value is the amount that willing parties would accept to exchange a financial instrument based on the current market<br />
for instruments with the same risk, principal and remaining maturity. The fair value of interest bearing financial assets<br />
and liabilities is determined by discounting the contractual principal and interest payments at estimated current market<br />
interest rates for the instrument. Current market rates are determined by reference to current benchmark rates for similar<br />
term and current credit spreads for debt with similar terms and risk. The fair values of the Trust’s financial instruments were<br />
determined as follows:<br />
(i) the carrying amounts of trade and other receivables, segregated tenants’ security deposits, cash, refundable<br />
tenants’ security deposits and trade and other payables approximate their fair values due to their short-term nature.<br />
<strong>Boardwalk</strong> <strong>REIT</strong> / ar <strong>2012</strong><br />
NOTES to CONSOLIDATED FINANCIAL STATEMENTS / 129
(ii)<br />
the fair values of the Trust’s mortgages payable and debentures are estimates made at a specific point in time,<br />
based on relevant market information. These estimates are based on quoted market prices for the same or similar<br />
issues or on the current rates offered to the Trust for similar financial instruments subject to similar risks and maturities.<br />
(iii)<br />
the fair values of the deferred unit compensation plan and the LP Class B Units are estimates at a specific point in<br />
time, based on the closing market price of the <strong>REIT</strong> Units listed on the Toronto Stock Exchange.<br />
(iv)<br />
the fair value of the effective portion of the interest rate swaps, reported as other non-current liabilities, are estimates<br />
at a specific point in time, based on quoted prices in markets that are not active for substantially the same term<br />
as the remaining effective portion of the derivatives.<br />
These estimates are subjective in nature and involve uncertainties and matters of significant judgment and, therefore,<br />
cannot be determined with precision. Changes in estimates could significantly affect fair values. The significant financial<br />
instruments of <strong>Boardwalk</strong> <strong>REIT</strong> and their carrying values as at December 31, <strong>2012</strong> and December 31, 2011 are as follows:<br />
As at Dec 31, <strong>2012</strong> Dec 31, 2011<br />
Other<br />
Liabilities<br />
Amortized<br />
Cost<br />
Total<br />
Carrying<br />
Value<br />
Total<br />
Fair Value<br />
Total<br />
Carrying<br />
Value<br />
Total<br />
Fair Value<br />
Fair Value<br />
Financial liabilities<br />
Mortgages payable $ – $ 2,248,176 $ 2,248,176 $ 2,329,060 $ 2,218,731 $ 2,343,615<br />
Debentures – – – – 112,390 112,504<br />
LP Class B Units 288,772 – 288,772 282,772 225,719 225,719<br />
Other non-current liabilities 5,452 – 5,452 5,452 8,282 8,282<br />
Deferred unit-based<br />
compensation 9,071 – 9,071 9,071 7,032 7,032<br />
The fair value of the Trust’s mortgages payable and debentures exceeded the recorded value by approximately $80.9<br />
million at December 31, <strong>2012</strong> (December 31, 2011 - $125.0 million), due to changes in interest rates since the dates on which<br />
the individual mortgages and debentures were last contracted. The fair value of the mortgages payable and debentures<br />
have been estimated based on the current market rates for mortgages and debentures with similar terms and conditions.<br />
The fair value of the Trust’s mortgages payable and debentures is an amount computed based on the interest rate environment<br />
prevailing at December 31, <strong>2012</strong> and December 31, 2011, respectively; the amount is subject to change and the future<br />
amounts will converge. There are no additional costs or penalties to <strong>Boardwalk</strong> <strong>REIT</strong> if the mortgages and debentures are<br />
held to maturity.<br />
The fair value hierarchy of financial instruments measured at fair value on the consolidated statement of financial position<br />
is as follows:<br />
As at Dec 31, <strong>2012</strong> Dec 31, 2011<br />
Level 1 Level 2 Level 3 Level 1 Level 2 Level 3<br />
Financial liabilities<br />
LP Class B Units 288,772 – – 225,719 – –<br />
Other non-current liabilities – 5,452 – – 8,282 –<br />
Deferred unit-based compensation 9,071 – – 7,032 – –<br />
130 / NOTES to CONSOLIDATED FINANCIAL STATEMENTS <strong>Boardwalk</strong> <strong>REIT</strong> / ar <strong>2012</strong>
The three levels of the fair value hierarchy are described as follows:<br />
Level 1:<br />
Level 2:<br />
Level 3:<br />
Values based on unadjusted quoted prices in active markets that are accessible at the measurement date for<br />
identical assets or liabilities.<br />
Values based on quoted prices in markets that are not active or model inputs that are observable either<br />
directly or indirectly for substantially the full term of the asset or liability.<br />
Values based on prices or valuation techniques requiring inputs that are both unobservable and significant<br />
to the overall fair value measurement.<br />
As at December 31, <strong>2012</strong> and 2011, the Trust had no embedded derivatives requiring separate recognition.<br />
The nature of these financial instruments and the Trust’s operations expose the Trust to certain principal financial risks.<br />
The main objective of the Trust’s risk management process is to properly identify financial risks and minimize the exposure<br />
to potential losses arising from those risks. The principal financial risks to which the Trust is exposed are described below.<br />
Note 29:<br />
Risk management<br />
a) Interest rate risk<br />
The Trust is exposed to interest rate risk as a result of its mortgages payable and credit facilities; however, this risk is minimized<br />
through the Trust’s current strategy of having the majority of its mortgages payable in fixed-term arrangements.<br />
As such, the Trust’s cash flows are not significantly impacted by a change in market interest rates. In addition, the Trust<br />
structures its financings so as to stagger the maturities of its debt, thereby minimizing the Trust’s exposure to interest rates<br />
in any one year. The majority of the Trust’s mortgages are also insured by the Canadian Mortgage and Housing Corporation<br />
(“CMHC”) under the National Housing Act (“NHA”) mortgage program. This added level of insurance offered to lenders<br />
allows the Trust to receive advantageous interest rates while minimizing the risk of mortgage renewals or extensions, and<br />
significantly reduces the potential for a lender to call a loan prematurely. In addition, management is constantly reviewing<br />
its committed revolving credit facility (floating-rate debt) and, if market conditions warrant, the Trust has the ability to<br />
convert its existing floating-rate debt to fixed rate debt.<br />
As at December 31, <strong>2012</strong>, the Trust had no amount outstanding on its committed revolving credit facility and, as such, of<br />
the Trust’s total debt at December 31, <strong>2012</strong>, 100% was fixed-rate debt and 0% was floating-rate debt. For the year ended<br />
December 31, <strong>2012</strong>, all else being equal, the increase or decrease in net earnings for each 1% change in market interest rates<br />
would be $nil (December 31, 2011 – $nil).<br />
b) Credit risk<br />
The Trust is exposed to credit risk as a result of its trade and other receivables. This balance is comprised of mortgage<br />
holdbacks and refundable mortgage fees, accounts receivable from significant customers and tenant receivables. As at<br />
December 31, <strong>2012</strong> and 2011, no balance relating to mortgage holdbacks, refundable mortgage fees or accounts receivable<br />
from significant customers was past due.<br />
In relation to mortgage holdbacks and refundable mortgage fees, the Trust’s exposure to credit risk is low given the nature<br />
of these balances. These funds will be advanced when the Trust has met the conditions pursuant to the mortgage agreement<br />
(in the case of the mortgage holdback) or when financing is completed (in the case of refundable mortgage fees),<br />
both of which are expected to occur.<br />
Similar to mortgage holdbacks and refundable mortgage fees, the Trust assesses the credit risk on accounts receivable to<br />
be low due to the assured collection of these balances. The majority of the balance relates to money owing from the Trust’s<br />
revenue sharing initiatives. Given the Trust’s collection history and the nature of these customers, credit risk is assessed as<br />
<strong>Boardwalk</strong> <strong>REIT</strong> / ar <strong>2012</strong><br />
NOTES to CONSOLIDATED FINANCIAL STATEMENTS / 131
low. Additionally, an amount is owed by insurance companies in relation to current outstanding claims. In all circumstances,<br />
the insurance deductible has been paid and amounts incurred and owing for reimbursement are due to an insurable event.<br />
Recoverability may differ from the amount owing solely due to discrepancies between the Trust and the insurance provider<br />
regarding the value of replacement costs.<br />
With tenant receivables, credit risk arises from the possibility tenants may experience financial difficulty and be unable to<br />
fulfill their lease term commitments. The maximum exposure to credit risk is equal to the carrying value of the financial<br />
assets. Rent payments from tenants are due on the first of the month and tenants generally pay a security deposit – both<br />
of these actions mitigate against bad debts.<br />
As stated above, the carrying amount of tenant receivables reflects management’s assessment of the credit risk associated<br />
with its tenants; however, the Trust mitigates this risk of credit loss by geographically diversifying its existing portfolio, by<br />
limiting its exposure to any one tenant and by conducting thorough credit checks with respect to all new rental-leasing<br />
arrangements. In addition, where legislation allows, the Trust obtains a security deposit from a tenant to assist in the<br />
recovery of monies owed to the Trust.<br />
Past due receivables (receivables which are greater than 30 days) are reviewed by management on a monthly basis and<br />
tenant receivables are considered for impairment on a case-by-case basis. The Trust takes into consideration the tenant’s<br />
payment history, their credit worthiness and the current economic environment, however, tenant receivable balances<br />
exceeding 60 days are typically written off to bad debt expense as the Trust does not utilize an allowance for doubtful<br />
accounts. The amount of the loss is recognized in the consolidated statement of comprehensive income as part of operating<br />
expenses. Subsequent recoveries of amounts previously written off are credited against operating expenses during the<br />
period of settlement. As tenant receivables are typically written off after 60 days, none of the balance is considered to be<br />
past due by the Trust. For the year ended December 31, <strong>2012</strong> bad debt expense totaled $4.2 million (year ended December<br />
31, 2011 – $5.6 million).<br />
The credit risk of both <strong>Boardwalk</strong> <strong>REIT</strong> and the counter party have been taken into account in determining the fair value of<br />
<strong>Boardwalk</strong> <strong>REIT</strong>’s trade and other receivables.<br />
c) Liquidity risk<br />
Liquidity risk is the risk that the Trust will not be able to meet its financial obligations as they become due. The Trust maintains<br />
what it believes to be conservatively leveraged assets and can finance any future growth through one or a combination<br />
of internally generated cash flows, borrowing under an existing committed revolving credit facility, the issuance of<br />
debt, or the issuance of equity, according to its capital management objectives. In addition, the Trust structures its financings<br />
so as to stagger the maturities of its debt, thereby minimizing the Trust’s exposure to liquidity risk in any one year. In<br />
addition, cash flow projections are completed and reviewed on a regular basis to ensure the Trust has sufficient cash flows<br />
to make its monthly distributions to its Unitholders. Finally, financial assets, such as cash and trade and other receivables,<br />
will be realized within the next twelve months and can be utilized to satisfy the Trust’s financial liabilities. Given the Trust’s<br />
currently available liquid resources (from both financial assets and on-going operations) as compared to its contractual<br />
obligations, management assesses the Trust’s liquidity risk to be low.<br />
132 / NOTES to CONSOLIDATED FINANCIAL STATEMENTS <strong>Boardwalk</strong> <strong>REIT</strong> / ar <strong>2012</strong>
The following table details the Trust’s remaining contractual maturity for its non-derivative financial liabilities listed by year<br />
of maturity date:<br />
Mortgages payable<br />
Year of Maturity<br />
Weighted average<br />
interest rate<br />
Principal<br />
outstanding<br />
2013 4.45% $ 287,656<br />
2014 3.51% 418,167<br />
2015 3.72% 445,780<br />
2016 3.89% 274,932<br />
2017 2.95% 321,968<br />
Subsequent 3.97% 585,332<br />
3.69% 2,333,835<br />
Unamortized deferred financing costs (85,788)<br />
Unamortized mark-to-market adjustment 129<br />
$ 2,248,176<br />
d) Debt covenants<br />
As outlined in its mortgages payable agreements, the Trust is required to make equal monthly payments of principal and<br />
interest based on the respective amortization period. Additionally, the Trust must ensure that all property taxes have been<br />
paid in full when they become due and that no arrears exist.<br />
CMHC provides mortgage loan insurance in connection with mortgages made to <strong>Boardwalk</strong> <strong>REIT</strong>. In an agreement dated<br />
September 13, 2002, and as amended and restated on January 19, 2005 and April 25, 2006, the Trust agreed to provide<br />
certain financial information to the CMHC and be subject to certain restrictive covenants, including limitation on additional<br />
debt, payment of distributions in respect to Unitholders’ capital in the event of default, and maintenance of certain financial<br />
ratios. In the event of default, the Trust’s total financial liability under this agreement is limited to a one-time penalty<br />
payment of $250 thousand under a Letter of Credit issued in favor of CMHC.<br />
As the debentures were repaid in full in the first quarter of <strong>2012</strong>, the covenants contained in the debenture agreement are<br />
no longer applicable to the Trust.<br />
The Trust has a committed revolving credit facility with a major financial institution. This credit facility is secured by a<br />
pledge of a group of specific real estate assets (fair value at December 31, <strong>2012</strong> of approximately $638.8 million). The<br />
amount available through the committed revolving credit facility varies with the value of the pledged assets, with a<br />
maximum limit not to exceed $200.0 million and an available limit of $196.3 million as at December 31, <strong>2012</strong> (December 31,<br />
2011 - $196.1 million). The revolving facility requires monthly interest payments, is for a three-year term maturing on July<br />
28, 2014, and can be extended <strong>annual</strong>ly thereafter, subject to the mutual consent of the lender and the Trust. On July 26,<br />
<strong>2012</strong>, the lender and the Trust agreed to extend the maturity date of the revolving credit facility for an additional year, from<br />
July 28, 2014 to July 27, 2015. In the event the committed revolving credit facility is not extended, the drawn-down principal<br />
would be due on the maturity date of the credit agreement.<br />
The credit facility contains three financial covenants as follows:<br />
(i) The Trust will maintain an overall Debt Service Coverage Ratio of at least 1.20, calculated on the most recent<br />
completed trailing four fiscal quarter basis. As at December 31, <strong>2012</strong>, this ratio was 1.89 (December 31, 2011 – 1.74).<br />
(ii) The Trust will maintain a Debt Service Coverage Ratio, specific to the Security Portfolio of at least 1.15 (tested<br />
semi-<strong>annual</strong>ly). As at December 31, <strong>2012</strong>, this ratio was 1.85 (December 31, 2011 – 1.79).<br />
<strong>Boardwalk</strong> <strong>REIT</strong> / ar <strong>2012</strong><br />
NOTES to CONSOLIDATED FINANCIAL STATEMENTS / 133
(iii) Total indebtedness of the Trust will not exceed 75% of the GBV of all assets for the two most recent quarters as<br />
defined in the credit agreement. The calculation of the components of Debt to Gross Book Value in accordance with<br />
the credit agreement is similar to that previously defined in the DOT as outlined in NOTE 27; however, the credit facility<br />
uses the two most recent quarters to calculate GBV. As at December 31, <strong>2012</strong>, this ratio was 39.3% (December 31, 2011<br />
– 46.3%).<br />
As at December 31, <strong>2012</strong> and 2011, the Trust was in compliance with all covenants.<br />
e) Utility risk<br />
The Trust is exposed to utility risk as a result of fluctuations in the prices of natural gas and electricity service charges.<br />
As outlined in NOTE 26, the Trust has commitments to certain utility contracts to reduce the risk of exposure to adverse<br />
changes in commodity prices.<br />
Note 30:<br />
subsidiaries<br />
The entities included in the Trust’s consolidated financial statements are as follows:<br />
Entity Type Relationship<br />
<strong>Boardwalk</strong> Real Estate Investment Trust (“B<strong>REIT</strong>”) Trust Parent<br />
<strong>Boardwalk</strong> Real Estate Management Ltd. Corporation 100% owned by B<strong>REIT</strong><br />
Top Hat Operating Trust (“TOT”) Trust 100% owned by B<strong>REIT</strong><br />
BPCL Holdings Inc. (“BPCL”) Corporation Special Purpose Entity<br />
<strong>Boardwalk</strong> <strong>REIT</strong> Limited Partnership (“BLP”) Partnership A Units are 100% owned by TOT<br />
B Units and C Units are 100% owned by BPCL<br />
<strong>Boardwalk</strong> <strong>REIT</strong> Properties Holdings (Alberta) Ltd. Corporation 100% owned by BLP<br />
<strong>Boardwalk</strong> <strong>REIT</strong> Quebec Inc. Corporation 100% owned by BLP<br />
<strong>Boardwalk</strong> Quebec Trust Trust 100% owned by BLP<br />
<strong>Boardwalk</strong> St. Laurent Limited Partnership Partnership 100% owned by <strong>Boardwalk</strong> Quebec Trust<br />
9108-4749 Quebec Inc. Corporation 100% owned by BLP<br />
Nun’s Island Trust 1 Trust 100% owned by BLP<br />
Nun’s Island Trust 2 Trust 100% owned by BLP<br />
Metropolitan Structures (MSI) Inc. Corporation 100% owned by BLP<br />
<strong>Boardwalk</strong> GP Holding Trust Trust 100% owned by BLP<br />
6222285 Canada Inc. Corporation 100% owned by BLP<br />
<strong>Boardwalk</strong> GP Operating Trust Trust 100% owned by 6222285 Canada Inc.<br />
<strong>Boardwalk</strong> General Partnership (“BGP”) Partnership 99.99% owned by <strong>Boardwalk</strong> GP Holding Trust<br />
0.01% owned by <strong>Boardwalk</strong> GP Operating Trust<br />
<strong>Boardwalk</strong> <strong>REIT</strong> Properties Holdings Ltd. Corporation 100% owned by BGP<br />
2044760 Ontario Inc. Corporation 100% owned by BGP<br />
<strong>Boardwalk</strong> Equities (B.C.) Inc. Corporation 100% owned by BGP<br />
Horizon Towers Holdings Ltd. Corporation 100% owned by <strong>Boardwalk</strong> Equities (B.C.) Inc.<br />
Surrey Village Holdings Ltd. Corporation 100% owned by <strong>Boardwalk</strong> Equities (B.C.) Inc.<br />
134 / NOTES to CONSOLIDATED FINANCIAL STATEMENTS <strong>Boardwalk</strong> <strong>REIT</strong> / ar <strong>2012</strong>
BPCL represents the only entity which is not 100% owned by the Trust or one of its subsidiaries. Under IFRS, BPCL is considered<br />
a Special Purpose Entity (“SPE”) as it was created to accomplish a narrow and well-defined objective. BPCL (formerly<br />
called <strong>Boardwalk</strong> Equities Inc.) was created specifically to transfer the beneficial interest in the Corporation’s assets. The<br />
Trust does not have any voting interest in BPCL; however, the Trust controls BPCL because the Trust has the decision-making<br />
powers to obtain the majority of the benefits of the activities of BPCL and the Trust retains the majority of the residual or<br />
ownership risks related to BPCL. Due to the above, BPCL is part of the Trust’s consolidated group.<br />
Note 31:<br />
Related party disclosures<br />
IAS 24 – Related Party Disclosures requires entities to disclose in their financial statements information about transactions<br />
with related parties. Generally, two parties are related to each other if one party controls, or significantly influences, the<br />
other party. Balances and transactions between the Trust and its subsidiaries (as outlined in NOTE 30), which are related<br />
parties of the Trust, have been eliminated on consolidation and are not disclosed in this note disclosure.<br />
The following outlines the individuals considered key personnel of the Trust:<br />
(a)<br />
Trustees<br />
The Trustees of <strong>Boardwalk</strong> <strong>REIT</strong> during the year ended December 31, <strong>2012</strong> and up to the date of this report were:<br />
James R. Dewald<br />
Gary Goodman<br />
Arthur L. Havener, Jr.<br />
Sam Kolias<br />
Al W. Mawani<br />
Andrea Stephen<br />
(b) Key management personnel<br />
Key management personnel of the Trust during the year ended December 31, <strong>2012</strong> and up to the date of this report were:<br />
Sam Kolias, Chief Executive Officer<br />
Van Kolias, Senior VP, Quality Control<br />
P. Dean Burns, General Counsel & Corporate Secretary<br />
William Chidley, Senior VP, Corporate Development<br />
Roberto Geremia, President<br />
William Wong, Chief Financial Officer<br />
The remuneration of the Trust’s key management personnel were as follows:<br />
Year ended<br />
Dec 31, <strong>2012</strong><br />
Year ended<br />
Dec 31, 2011<br />
Short-term benefits $ 972 $ 941<br />
Post-employment benefits 46 45<br />
Other long-term benefits 11 6<br />
Deferred unit-based compensation 1,247 1,216<br />
$ 2,276 $ 2,208<br />
In addition, the LP Class B Units are held by Sam Kolias (Chairman of the Board, Chief Executive Officer and Trustee) and Van<br />
Kolias (Senior Vice President, Quality Control). Under IAS 32 Financial Instruments: Presentation the LP B Units issued by a<br />
wholly owned subsidiary of the Trust are considered financial liabilities, and were reclassified from equity to liabilities on<br />
the consolidated financial statements. Additionally, as the LP Class B Units are liabilities, all distributions paid are recorded<br />
<strong>Boardwalk</strong> <strong>REIT</strong> / ar <strong>2012</strong><br />
NOTES to CONSOLIDATED FINANCIAL STATEMENTS / 135
as a financing charge under IFRS. For the year ended December 31, <strong>2012</strong>, distributions on the LP Class B Units totaled $8.4<br />
million (December 31, 2011 – $8.1 million). Distributions on the LP Class B Units are made on terms equal to distributions<br />
made on <strong>Boardwalk</strong> <strong>REIT</strong> Units.<br />
As at December 31, <strong>2012</strong>, there was $716 thousand owed to related parties (December 31, 2011 – $671 thousand) based on<br />
the LP Class B Units distribution outlined above.<br />
Note 32:<br />
other infoRMation<br />
(a)<br />
Supplemental cash flow information<br />
Year ended<br />
Dec 31, <strong>2012</strong><br />
Year ended<br />
Dec 31, 2011<br />
Taxes paid $ 1 $ 2<br />
Interest paid $ 103,006 $ 107,641<br />
Net change in operating working capital<br />
Net change in inventories $ (593) $ 377<br />
Net change in prepaid assets 46 (218)<br />
Net change in trade and other receivables (251) 834<br />
Net change in segregated and refundable tenants’ security deposits 63 (4)<br />
Net change in deferred unit-based compensation 1,965 1,801<br />
Net change in trade and other payables (1,221) 1,295<br />
$ 9 $ 4,085<br />
(b) Included in administration costs is $1.94 million relating to RRSP matching for the year ended December 31, <strong>2012</strong> ($1.84<br />
million for the year ended December 31, 2011).<br />
Note 33:<br />
Segmented infoRMation<br />
<strong>Boardwalk</strong> <strong>REIT</strong> specializes in multi-family residential housing and operates primarily within one business segment in five<br />
provinces located wholly in Canada. Each provincial segment operates with a high degree of autonomy. Management<br />
monitors the operating results on a regional basis. Segment performance is evaluated on a number of measures, including<br />
net profit. Financial information reported is on the same basis as used for internal evaluation and allocation of resources.<br />
<strong>Boardwalk</strong> <strong>REIT</strong> does not have any one major tenant or a significant group of tenants. Either expiring leases are renewed<br />
or new tenants are found.<br />
Net debt, interest income and expenses, and income taxes are managed on a group basis. Transfer prices between<br />
locations are set on an arm’s-length basis in a manner similar to transactions with third parties and are eliminated upon<br />
inter-company consolidation.<br />
All other segments items represent corporate functions, technology assets, activities incidental to operations, and certain<br />
comparative data for divested assets, and are recognized in the relevant segments.<br />
136 / NOTES to CONSOLIDATED FINANCIAL STATEMENTS <strong>Boardwalk</strong> <strong>REIT</strong> / ar <strong>2012</strong>
Details of segmented information are as follows:<br />
As at Dec 31, <strong>2012</strong><br />
Alberta<br />
British<br />
Columbia Saskatchewan Ontario Quebec<br />
All other<br />
segments<br />
Assets $ 3,687,908 $ 115,663 $ 691,312 $ 313,809 $ 736,753 $ 129,857 $ 5,675,302<br />
Liabilities 1,509,024 62,505 264,495 123,504 329,690 335,983 2,625,201<br />
Total<br />
As at Dec 31, 2011<br />
Alberta<br />
British<br />
Columbia Saskatchewan Ontario Quebec<br />
All other<br />
segments<br />
Assets $ 3,145,356 $ 110,432 $ 608,303 $ 277,408 $ 706,639 $ 240,885 $ 5,089,023<br />
Liabilities 1,473,167 63,455 266,183 125,793 334,389 381,246 2,644,233<br />
Total<br />
Alberta<br />
Year ended Dec 31, <strong>2012</strong><br />
British<br />
Columbia Saskatchewan Ontario Quebec<br />
All other<br />
segments<br />
Rental revenue $ 258,964 $ 8,131 $ 58,030 $ 39,221 $ 68,660 $ 199 $ 433,205<br />
Ancillary rental income (loss) 4,174 141 649 869 907 (44) 6,696<br />
Total rental revenue 263,138 8,272 58,679 40,090 69,567 155 439,901<br />
Rental expenses<br />
Operating expenses 50,018 1,491 9,571 6,926 14,744 4,393 87,143<br />
Utilities 21,086 778 4,914 6,849 5,906 388 39,921<br />
Property taxes 19,735 476 3,978 5,383 7,104 97 36,773<br />
Net operating income (loss) 172,299 5,527 40,216 20,932 41,813 (4,723) 276,064<br />
Financing costs (a) 59,428 2,689 10,409 5,377 12,141 8,018 98,062<br />
Administration 172 5 (10) 29 84 28,629 28,909<br />
Depreciation and amortization (b) 3,494 115 570 305 3,217 3,221 10,922<br />
Profit (loss) from continuing operations<br />
before fair value gains (losses) and<br />
income tax recovery 109,205 2,718 29,247 15,221 26,371 (44,591) 138,171<br />
Gain on sale of assets – – – – – 135 135<br />
Fair value gains (losses) 504,445 2,332 75,609 26,607 7,439 (66,446) 549,986<br />
Profit (loss) before income tax recovery 613,650 5,050 104,856 41,828 33,810 (110,902) 688,292<br />
Income tax recovery (c) – – – – – 222 222<br />
Profit (loss) for the year $ 613,650 $ 5,050 $ 104,856 $ 41,828 $ 33,810 $ (110,680) $ 688,514<br />
Other comprehensive income 1,473 – 1,054 – – 323 2,850<br />
Total comprehensive income (loss) $ 615,123 $ 5,050 $ 105,910 $ 41,828 $ 33,810 $ (110,357) $ 691,364<br />
Additions to non-current assets (d) $ 40,344 $ 2,933 $ 7,928 $ 10,014 $ 19,376 $ 8,702 $ 89,297<br />
Total<br />
<strong>Boardwalk</strong> <strong>REIT</strong> / ar <strong>2012</strong><br />
NOTES to CONSOLIDATED FINANCIAL STATEMENTS / 137
Alberta<br />
Year ended Dec 31, 2011<br />
British<br />
Columbia Saskatchewan Ontario Quebec<br />
All other<br />
segments<br />
Rental revenue $ 245,644 $ 7,966 $ 56,043 $ 38,321 $ 67,986 $ 192 $ 416,152<br />
Ancillary rental income (loss) 3,890 139 609 832 1,109 (4) 6,575<br />
Total rental revenue 249,534 8,105 56,652 39,153 69,095 188 422,727<br />
Rental expenses<br />
Operating expenses 47,683 1,341 9,418 7,241 14,211 4,506 84,400<br />
Utilities 21,541 805 4,725 6,696 6,247 326 40,340<br />
Property taxes 18,503 423 3,929 5,385 6,999 89 35,328<br />
Net operating income (loss) 161,807 5,536 38,580 19,831 41,638 (4,733) 262,659<br />
Financing costs (a) 59,838 2,935 11,161 5,499 13,130 13,006 105,569<br />
Administration 159 25 (6) 70 136 25,880 26,264<br />
Depreciation and amortization(b) 3,531 124 605 327 2,849 3,084 10,520<br />
Profit (loss) from continuing operations<br />
before fair value gains (losses) and<br />
income tax recovery 98,279 2,452 26,820 13,935 25,523 (46,703) 120,306<br />
Fair value gains (losses) 297,024 10,219 55,272 18,349 25,523 (41,998) 364,389<br />
Profit (loss) before income tax recovery 395,303 12,671 82,092 32,284 51,046 (88,701) 484,695<br />
Income tax recovery (c) – – – – – 740,391 740,391<br />
Profit for the year $ 395,303 $ 12,671 $ 82,092 $ 32,284 $ 51,046 $ 651,690 $ 1,225,086<br />
Other comprehensive loss (1,097) – (774) – – – (1,871)<br />
Total comprehensive income $ 394,206 $ 12,671 $ 81,318 $ 32,284 $ 51,046 $ 651,690 $ 1,223,215<br />
Additions to non-current assets (d) $ 37,406 $ 1,600 $ 6,669 $ 7,466 $ 16,680 $ 3,905 $ 73,726<br />
(a)<br />
Financing costs<br />
Financing costs were as follows:<br />
Alberta<br />
Year ended Dec 31, <strong>2012</strong><br />
British<br />
Columbia Saskatchewan Ontario Quebec<br />
All other<br />
segments<br />
Interest on secured debt<br />
(mortgages payable) $ 59,360 $ 2,686 $ 10,389 $ 5,259 $ 12,119 $ – $ 89,813<br />
Interest on unsecured debt<br />
(debentures) – – – – – 404 404<br />
LP Class B unit distribution – – – – – 8,413 8,413<br />
Other interest charges 68 3 20 118 31 1,246 1,486<br />
Interest income – – – – (9) (2,045) (2,054)<br />
Total $ 59,428 $ 2,689 $ 10,409 $ 5,377 $ 12,141 $ 8,018 $ 98,062<br />
Total<br />
Total<br />
Alberta<br />
Year ended Dec 31, 2011<br />
British<br />
Columbia Saskatchewan Ontario Quebec<br />
All other<br />
segments<br />
Interest on secured debt<br />
(mortgages payable) $ 59,668 $ 2,934 $ 11,151 $ 5,445 $ 13,120 $ 2 $ 92,320<br />
Interest on unsecured debt<br />
(debentures) – – – – – 6,306 6,306<br />
LP Class B unit distribution – – – – – 8,055 8,055<br />
Other interest charges 170 1 16 54 29 1,313 1,583<br />
Interest income – – (6) – (19) (2,670) (2,695)<br />
Total $ 59,838 $ 2,935 $ 11,161 $ 5,499 $ 13,130 $ 13,006 $ 105,569<br />
Total<br />
138 / NOTES to CONSOLIDATED FINANCIAL STATEMENTS <strong>Boardwalk</strong> <strong>REIT</strong> / ar <strong>2012</strong>
(b) Depreciation and amortization<br />
This represents depreciation and amortization on items carried at cost and primarily includes deferred financing charged,<br />
corporate assets, technology assets, site equipment and other assets. These figures exclude any impairment charges.<br />
(c) Income tax recovery<br />
This relates to any current and deferred taxes. Excluded are deferred tax assets, which are presented separately on the consolidated<br />
statement of financial position. The tax charge is the <strong>REIT</strong>’s estimate of the deferred income tax liability at June<br />
30, 2007, and adjusted quarterly, recognizing the probability that it would be subject to the tax prescribed by the SIFT Rules<br />
on January 1, 2011. On December 16, 2010, the Department of Finance announced proposed amendments to the real estate<br />
investment trust rules and released for consultation draft legislation to implement such amendments. Notwithstanding if<br />
and when these proposed changes become substantively enacted, the Trust’s qualifies as a <strong>REIT</strong> for Canadian income tax<br />
purposes commencing January 1, 2011 and reversed the deferred income tax liability related to the SIFT Rules at this time.<br />
Subsequently, the remaining tax charges relate to corporate entities taxed separately under the Income Tax Act.<br />
(d) Additions to non-current assets (other than financial instruments and deferred tax assets)<br />
This represents the total cost incurred during the year to acquire non-current assets (other than financial instruments and<br />
deferred tax assets), measured on an accrual basis.<br />
Note 34:<br />
subsequent Events<br />
On February 12, 2013, the Board of Trustees approved an increase to the monthly Trust Unit distribution to $0.165 per Trust<br />
Unit (or $1.98 on an <strong>annual</strong>ized basis) commencing with the February 28, 2013 record date.<br />
Note 35:<br />
approval of Consolidated Financial Statements<br />
The consolidated financial statements were approved by the Board of Trustees and authorized for issue on February 13, 2013.<br />
<strong>Boardwalk</strong> <strong>REIT</strong> / ar <strong>2012</strong><br />
NOTES to CONSOLIDATED FINANCIAL STATEMENTS / 139
Five Year SuMMary<br />
($000’s except per unit and<br />
per square foot)<br />
Assets<br />
(CDN GAAP)<br />
2008 2009 2010 2011 <strong>2012</strong><br />
($000’s except per unit and<br />
per square foot) (IFRS) (IFRS) (IFRS) (IFRS)<br />
Assets<br />
Revenue producing properties $ 2,173,583 Investment properties $ 4,129,636 $ 4,318,242 $ 4,793,895 $ 5,493,448<br />
Discontinued operations 27,278<br />
Other assets 158,063 Other assets 229,590 267,683 295,128 181,854<br />
Total assets $ 2,358,924 Total assets $ 4,359,226 $ 4,585,925 $ 5,089,023 $ 5,675,302<br />
Mortgages payable $ 2,035,192 Mortgages payable $ 2,145,638 $ 2,153,206 $ 2,218,731 $ 2,248,176<br />
Debenture 119,073 Debenture 111,834 112,211 112,390 –<br />
Discontinued operations 22,122<br />
Other liabilities 73,442 Other liabilities 246,553 267,613 313,102 377,018<br />
$ 2,249,829 $ 2,504,025 $ 2,533,030 $ 2,644,223 $ 2,625,194<br />
Future income taxes 100,602 Deferred income taxes 692,916 740,359 10 7<br />
Unitholders’ equity (deficiency) 8,493 Unitholders’ equity (deficiency) 1,162,285 1,312,536 2,444,790 3,050,101<br />
Total liabilities and<br />
unitholders’ equity $ 2,358,924<br />
Trust unit outstanding (000)<br />
(including LP B Units) 53,477<br />
Total liabilities and<br />
unitholders’ equity $ 4,359,226 $ 4,585,925 $ 5,089,023 $ 5,675,302<br />
Trust unit outstanding (000)<br />
(including LP B Units) 52,744 52,366 52,264 52,327<br />
Trust unit price at year-end ($) $ 25.56 Trust unit price at year-end ($) $ 37.05 $ 41.25 $ 50.44 $ 64.53<br />
Market capitalization ($MM) 1,366.9 Market capitalization ($MM) 1,954.2 2,160.1 2,636.2 3,376.7<br />
Number of rental units 36,785 Number of rental units 36,419 35,277 35,277 35,277<br />
Book value per rental unit ($000) 59 Fair value per rental unit ($000) 113 122 136 156<br />
Long-term debt per rental unit<br />
($000) 59<br />
Long-term debt per rental unit<br />
($000) 62 64 66 64<br />
Net rentable square feet (000) 31,094 Net rentable square feet (000) 30,757 29,936 29,936 29,936<br />
Book value per square foot ($) 70 Fair value per square foot ($) 134 144 160 184<br />
Long-term debt per square foot ($) 69 Long-term debt per square foot ($) 73 76 78 75<br />
Average net rentable SF per unit 845 Average net rentable SF per unit 845 849 849 849<br />
L/T debt weighted average<br />
interest rate 4.83%<br />
L/T debt weighted average<br />
interest rate 4.52% 4.27% 4.14% 3.69%<br />
Balance sheet as at December 31, 2008 was not retroactively restated in accordance with CICA handbook section 3475, disposal of long-lived assets<br />
and discontinued operations, for discontinued operations reclassified in fiscal year ended December 31, 2009.<br />
Fiscal years as at December 31, 2008 are in accordance with Canadian GAAP, while fiscal years as at December 31, 2009, 2010, 2011, and <strong>2012</strong> are in<br />
accordance with IFRS.<br />
140 / FIVE Year SUMMARy<br />
<strong>Boardwalk</strong> <strong>REIT</strong> / ar <strong>2012</strong>
Five Year SuMMary<br />
2008 2009 2010 2011 <strong>2012</strong><br />
($000’s except per unit) (CDN GAAP) (CDN GAAP) ($000’s except per unit) (IFRS) (IFRS) (IFRS)<br />
Revenue producing properties $ 419,799 $ 416,815 Rental revenue $ 414,033 $ 416,152 $ 433,205<br />
Rental income Ancillary rental income 6,399 6,575 6,696<br />
Operating expenses Total rental revenue 420,432 422,727 439,901<br />
Revenue producing properties 73,539 73,229 Rental expenses<br />
Utilities 48,906 42,222 Operating expenses 76,624 84,400 87,143<br />
Property taxes 33,616 35,438 Utilities 42,222 40,340 39,921<br />
156,061 150,889 Property taxes 36,529 35,328 36,773<br />
Net operating income 263,738 265,926 Net operating income 265,057 262,659 276,064<br />
Operating margin 63% 64% Operating margin 63% 62% 63%<br />
Financing costs 105,849 105,793 Financing costs 112,638 105,569 98,062<br />
Amortization of deferred<br />
financing costs 4,971 6,022 Administration 25,995 26,264 28,909<br />
Amortization 87,869 85,313 Depreciation and amortization 10,294 10,520 10,922<br />
Earnings before corporate<br />
charges 65,049 68,798<br />
Corporate charges<br />
Administration 24,180 26,711<br />
Profit from continuing<br />
operations before loss on sale<br />
of assets, fair value gains and<br />
income tax expense (recovery) 116,130 120,306 138,171<br />
Current income taxes 4 3 Gain (Loss) on sale of assets (3,047) – 135<br />
Future income taxes (recovery) 315 (5,646) Fair value gains 211,157 364,389 549,986<br />
Other income and expenses – (408)<br />
Profit before income tax<br />
expense (recovery) 324,240 484,695 688,292<br />
24,499 20,660 Income tax expense (recovery) 47,448 (740,391) (222)<br />
Earnings (loss) from continuing<br />
operations 40,550 48,138 Profit for the year 276,792 1,225,086 688,514<br />
Earnings from discontinued<br />
operations, net of tax 5,135 13,929 Other comprehensive (loss) (695) (1,871) 2,850<br />
Net earnings for the year $ 45,685 $ 62,067 Total comprehensive income $ 276,097 $ 1,223,215 $ 691,364<br />
Earnings per unit – diluted $ 0.84 $ 1.17 Earnings per unit – diluted $ 5.82 $ 24.40 $ 14.40<br />
Funds from operations $ 129,918 $ 133,094 Funds from operations $ 129,728 $ 131,808 $ 150,343<br />
Funds from operations<br />
per unit – fully diluted $ 2.39 $ 2.51<br />
Interest Coverage Ratio,<br />
Continuing operations 2.29 2.27<br />
Funds from operations<br />
per unit – fully diluted $ 2.47 $ 2.52 $ 2.87<br />
Interest Coverage Ratio,<br />
Continuing operations 2.34 2.42 2.76<br />
Fiscal years ended December 31, 2008 and 2009 are in accordance with Canadian GAAP, while fiscal years ended December 31, 2010, 2011 and <strong>2012</strong><br />
are in accordance with IFRS.<br />
<strong>Boardwalk</strong> <strong>REIT</strong> / ar <strong>2012</strong> FIVE Year summary / 141
<strong>2012</strong> Quarterly Results<br />
(in $000’s except per unit amounts) Q1 Q2 Q3 Q4 31-Dec-12<br />
Rental revenue $ 106,380 $ 107,548 $ 108,817 $ 110,460 $ 433,205<br />
Ancillary rental income 1,608 1,721 1,778 1,589 6,696<br />
Total rental revenue 107,988 109,269 110,595 112,049 439,901<br />
Rental expenses<br />
Operating expenses 20,836 21,813 22,243 22,251 87,143<br />
Utilities 11,883 8,223 8,521 11,294 39,921<br />
Property taxes 8,814 8,912 9,592 9,455 36,773<br />
Net operating income 66,455 70,321 70,239 69,049 276,064<br />
Financing costs 25,306 24,698 24,368 23,690 98,062<br />
Administration 7,121 7,638 6,961 7,189 28,909<br />
Depreciation and amortization 2,631 2,670 2,614 3,007 10,922<br />
Profit from continuing operations before loss on<br />
sale of assets, fair value gains and income tax<br />
expense (recovery) 31,397 35,315 36,296 35,163 138,171<br />
Gain (Loss) on sale of assets – – – 135 135<br />
Fair value gains (losses) 185,913 126,175 257,669 (19,771) 549,986<br />
Profit before income tax expense (recovery) 217,310 161,490 293,965 15,527 688,292<br />
Income tax expense (recovery) (34) (138) (12) (38) (222)<br />
Profit for the period 217,344 161,628 293,977 15,565 688,514<br />
Other comprehensive income (loss) 1,484 (281) 954 693 2,850<br />
Total comprehensive income $ 218,828 $ 161,347 $ 294,931 $ 16,258 $ 691,364<br />
Earnings per unit – diluted $ 4.55 $ 3.38 $ 6.15 $ 0.32 $ 14.40<br />
Funds from operations $ 34,273 $ 38,274 $ 39,401 $ 38,395 $ 150,343<br />
Funds from operations per unit – fully diluted $ 0.66 $ 0.73 $ 0.75 $ 0.73 $ 2.87<br />
142 / QUARTERLy results<br />
<strong>Boardwalk</strong> <strong>REIT</strong> / ar <strong>2012</strong>
2011 Quarterly Results<br />
(in $000’s except per unit amounts) Q1 Q2 Q3 Q4 31-Dec-11<br />
Rental revenue $ 102,642 $ 103,818 $ 104,353 $ 105,339 $ 416,152<br />
Ancillary rental income 1,654 1,546 1,641 1,734 6,575<br />
Total rental revenue 104,296 105,364 105,994 107,073 422,727<br />
Rental expenses<br />
Operating expenses 20,474 20,668 21,961 21,297 84,400<br />
Utilities 13,508 8,299 8,157 10,376 40,340<br />
Property taxes 9,446 9,305 8,361 8,216 35,328<br />
Net operating income 60,868 67,092 67,515 67,184 262,659<br />
Financing costs 26,473 26,466 26,118 26,512 105,569<br />
Administration 6,508 6,169 6,877 6,710 26,264<br />
Depreciation and amortization 2,534 2,596 2,629 2,761 10,520<br />
Profit from continuing operations before loss on<br />
sale of assets, fair value gains and income tax<br />
expense (recovery) 25,353 31,861 31,891 31,201 120,306<br />
Loss on sale of assets – – – – –<br />
Fair value gains (losses) (43,033) 164,181 137,505 105,736 364,389<br />
Profit before income tax expense (recovery) (17,680) 196,042 169,396 136,937 484,695<br />
Income tax expense (recovery) (740,194) (549) 309 43 (740,391)<br />
Profit for the period 722,514 196,591 169,087 136,894 1,225,086<br />
Other comprehensive income (loss) 12 3 2 (1,888) (1,871)<br />
Total comprehensive income $ 722,526 $ 196,594 $ 169,089 $ 135,006 $ 1,223,215<br />
Earnings per unit – diluted $ 14.45 $ 3.82 $ 3.27 $ 2.86 $ 24.40<br />
Funds from operations $ 28,132 $ 34,700 $ 34,806 $ 34,170 $ 131,808<br />
Funds from operations per unit – fully diluted $ 0.54 $ 0.66 $ 0.67 $ 0.65 $ 2.52<br />
<strong>Boardwalk</strong> <strong>REIT</strong> / ar <strong>2012</strong> QUARTERLy RESULTS / 143
Market and Unitholder InfoRMation<br />
SOLICITORS<br />
Gowling Lafleur Henderson llp<br />
1400, 700 - 2nd Street SW<br />
Calgary AB T2P 4V5<br />
Butlin Oke Roberts & Nobles<br />
100, 1501 - 1 Street SW<br />
Calgary, Alberta T2R 0W1<br />
ANNUAL GENERAL MEETING<br />
The Annual General Meeting of the Unitholders of <strong>Boardwalk</strong> <strong>REIT</strong><br />
will be held at the Petroleum Club, 319-5 Ave SW, Calgary, Alberta,<br />
at 3:00 pm (Mountain Standard Time) on May 15, 2013.<br />
Unitholders are encouraged to attend and those unable to do so<br />
are requested to complete the Form of Proxy and forward it at<br />
their earliest convenience.<br />
BANKERS<br />
Toronto Dominion Bank<br />
355 – 4 Avenue SW<br />
Calgary, Alberta T2P 0J1<br />
AUDITORS<br />
Deloitte LLP<br />
700, 850 – 2 Street SW<br />
Calgary, Alberta T2P 0R8<br />
REGISTRAR & TRANSFER AGENT<br />
Computershare Trust Company of Canada<br />
Our Transfer Agent can help you with a variety of<br />
unitholder related services, including change of address,<br />
tax forms, accounts consolidation and transfer of stock.<br />
600, 530 – 8 Avenue SW<br />
Calgary, Alberta T2P 3S8<br />
Telephone: 403 267-6800<br />
INVESTOR RELATIONS<br />
Unitholders seeking financial and operating<br />
information may contact:<br />
James Ha, Director; Mortgage and Finance<br />
Telephone: 403 531-9255<br />
Investor Relations Toll Free: 1-855-626-6739<br />
Fax: 403 531-9565<br />
Web: www.<strong>Boardwalk</strong><strong>REIT</strong>.com<br />
Email: investor@bwalk.com<br />
ONLINE INFORMATION<br />
For an online version of the current and past <strong>annual</strong> reports,<br />
quarterly reports, press releases and other Trust information,<br />
please visit our investor website at www.<strong>Boardwalk</strong><strong>REIT</strong>.com.<br />
EXCHANGE LISTINGS<br />
The Toronto Stock Exchange<br />
Symbol: BEI.UN<br />
TRADING PROFILE<br />
TSX: Jan 1, <strong>2012</strong> to Dec. 31, <strong>2012</strong><br />
High: $66.53<br />
Low: $50.51<br />
Year-end Closing Price: $64.53<br />
*effective May 3, 2004, <strong>Boardwalk</strong> was converted into a Real Estate Investment<br />
Trust from its predecessor, <strong>Boardwalk</strong> Equities Inc.<br />
Monthly Distributions<br />
Month Per Unit Record Date Payable Date<br />
January <strong>2012</strong> $0.150 31-Jan-12 15-Feb-12<br />
February <strong>2012</strong> $0.155 29-Feb-12 15-Mar-12<br />
March <strong>2012</strong> $0.155 30-Mar-12 15-Apr-12<br />
April <strong>2012</strong> $0.155 30-Apr-12 15-May-12<br />
May <strong>2012</strong> $0.155 31-May-12 15-Jun-12<br />
June <strong>2012</strong> $0.155 29-Jun-12 16-Jul-12<br />
July <strong>2012</strong> $0.155 31-Jul-12 15-Aug-12<br />
August <strong>2012</strong> $0.160 31-Aug-12 17-Sep-12<br />
September <strong>2012</strong> $0.160 28-Sep-12 15-Oct-12<br />
October <strong>2012</strong> $0.160 31-Oct-12 15-Nov-12<br />
November <strong>2012</strong> $0.160 30-Nov-12 17-Dec-12<br />
December <strong>2012</strong> $0.160 31-Dec-12 15-Jan-13<br />
January 2013 $0.160 31-Jan-13 15-Feb-13<br />
144 / MARKET and UNITHOLDER INFORMATION<br />
<strong>Boardwalk</strong> <strong>REIT</strong> / ar <strong>2012</strong>
Corporate Information<br />
EXECUTIVE OFFICE<br />
First West Professional Building<br />
Suite 200, 1501 – 1 Street SW<br />
Calgary, Alberta T2R 0W1<br />
Phone: 403 531-9255<br />
Investor Relations Toll Free:<br />
1-855-626-6739<br />
Fax: 403 531-9565<br />
Web: www.<strong>Boardwalk</strong><strong>REIT</strong>.com<br />
BOARD OF TRUSTEES<br />
Sam Kolias<br />
Chairman of the Board<br />
Calgary, Alberta<br />
James Dewald (3)<br />
Calgary, Alberta<br />
Gary Goodman (2)<br />
Toronto, Ontario<br />
(1) (2) (3)<br />
Art Havener<br />
St. Louis, MO<br />
Al Mawani (2)<br />
Thornhill, Ontario<br />
(2) (3)<br />
Andrea Stephen<br />
Toronto, Ontario<br />
(1)<br />
Lead Trustee<br />
SENIOR MANAGEMENT<br />
Jonathan Brimmell<br />
Vice President, Operations,<br />
Ontario and Quebec<br />
Dean Burns<br />
General Counsel and Secretary<br />
William Chidley<br />
Senior Vice President, Corporate<br />
Development<br />
Jean Denis<br />
Vice President, Acquisitions,<br />
Eastern Canada<br />
Ian Dingle<br />
Vice President, Purchasing and Contracts<br />
Roberto Geremia<br />
President<br />
Designed and produced by Rhino Corporate Communications Inc. Photo credits: Brian Harder Photography, <strong>Boardwalk</strong> archives, Rhino and stock.<br />
(2)<br />
Member of the Audit and Risk Management<br />
Committee<br />
(3)<br />
Member of the Compensation, Governance<br />
and Nominations Committee<br />
Michael Guyette<br />
CIO, VP Operations for<br />
Southern Alberta and BC<br />
Sam Kolias<br />
Chief Executive Officer<br />
Van Kolias<br />
Senior Vice President, Quality Control<br />
Kelly Mahajan<br />
Vice President, Customer Service and<br />
Process Design<br />
Helen Mix<br />
Vice President, Human Resources<br />
Lisa Russell<br />
Vice President, Acquisitions,<br />
Western Canada<br />
William Wong<br />
Chief Financial Officer<br />
Bill Zigomanis<br />
Vice President, Investments<br />
<strong>Boardwalk</strong> <strong>REIT</strong> / ar <strong>2012</strong> CORPORATE INFORMATION / 145
<strong>Boardwalk</strong> Real ESTATE InvESTment Trust / <strong>2012</strong> <strong>annual</strong> REPort<br />
BOARDWALK <strong>REIT</strong><br />
First West Professional Building<br />
Suite 200, 1501 – 1 Street SW<br />
Calgary, Alberta T2R 0W1<br />
Phone: 403 531-9255 Fax: 403 531-9565<br />
Investor Relations Toll Free: 1-855-626-6739<br />
Website: www.<strong>Boardwalk</strong><strong>REIT</strong>.com<br />
printed in Canada