1JF6e15
1JF6e15
1JF6e15
Create successful ePaper yourself
Turn your PDF publications into a flip-book with our unique Google optimized e-Paper software.
THE GLOBAL PICTURE<br />
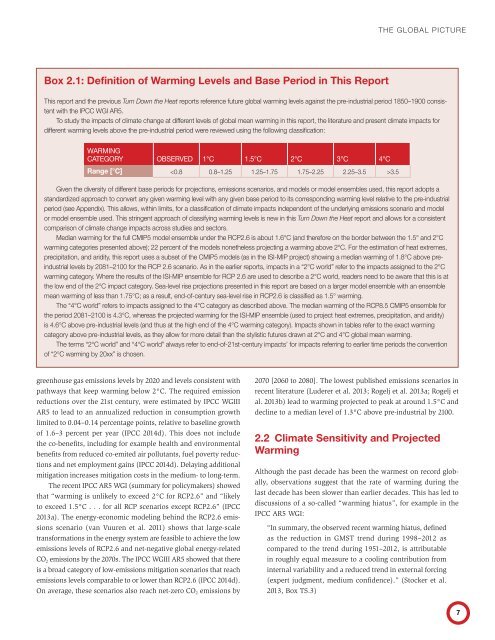
Box 2.1: Definition of Warming Levels and Base Period in This Report<br />
This report and the previous Turn Down the Heat reports reference future global warming levels against the pre-industrial period 1850–1900 consistent<br />
with the IPCC WGI AR5.<br />
To study the impacts of climate change at different levels of global mean warming in this report, the literature and present climate impacts for<br />
different warming levels above the pre-industrial period were reviewed using the following classification:<br />
WARMING<br />
CATEGORY OBSERVED 1°C 1.5°C 2°C 3°C 4°C<br />
Range [°C] 3.5<br />
Given the diversity of different base periods for projections, emissions scenarios, and models or model ensembles used, this report adopts a<br />
standardized approach to convert any given warming level with any given base period to its corresponding warming level relative to the pre-industrial<br />
period (see Appendix). This allows, within limits, for a classification of climate impacts independent of the underlying emissions scenario and model<br />
or model ensemble used. This stringent approach of classifying warming levels is new in this Turn Down the Heat report and allows for a consistent<br />
comparison of climate change impacts across studies and sectors.<br />
Median warming for the full CMIP5 model ensemble under the RCP2.6 is about 1.6°C (and therefore on the border between the 1.5° and 2°C<br />
warming categories presented above); 22 percent of the models nonetheless projecting a warming above 2°C. For the estimation of heat extremes,<br />
precipitation, and aridity, this report uses a subset of the CMIP5 models (as in the ISI-MIP project) showing a median warming of 1.8°C above preindustrial<br />
levels by 2081–2100 for the RCP 2.6 scenario. As in the earlier reports, impacts in a “2°C world” refer to the impacts assigned to the 2°C<br />
warming category. Where the results of the ISI-MIP ensemble for RCP 2.6 are used to describe a 2°C world, readers need to be aware that this is at<br />
the low end of the 2°C impact category. Sea-level rise projections presented in this report are based on a larger model ensemble with an ensemble<br />
mean warming of less than 1.75°C; as a result, end-of-century sea-level rise in RCP2.6 is classified as 1.5° warming.<br />
The “4°C world” refers to impacts assigned to the 4°C category as described above. The median warming of the RCP8.5 CMIP5 ensemble for<br />
the period 2081–2100 is 4.3°C, whereas the projected warming for the ISI-MIP ensemble (used to project heat extremes, precipitation, and aridity)<br />
is 4.6°C above pre-industrial levels (and thus at the high end of the 4°C warming category). Impacts shown in tables refer to the exact warming<br />
category above pre-industrial levels, as they allow for more detail than the stylistic futures drawn at 2°C and 4°C global mean warming.<br />
The terms “2°C world” and “4°C world” always refer to end-of-21st-century impacts’ for impacts referring to earlier time periods the convention<br />
of “2°C warming by 20xx” is chosen.<br />
greenhouse gas emissions levels by 2020 and levels consistent with<br />
pathways that keep warming below 2°C. The required emission<br />
reductions over the 21st century, were estimated by IPCC WGIII<br />
AR5 to lead to an annualized reduction in consumption growth<br />
limited to 0.04–0.14 percentage points, relative to baseline growth<br />
of 1.6–3 percent per year (IPCC 2014d). This does not include<br />
the co-benefits, including for example hea lth and environmental<br />
benefits from reduced co-emited air pollutants, fuel poverty reductions<br />
and net employment gains (IPCC 2014d). Delaying additional<br />
mitigation increases mitigation costs in the medium- to long-term.<br />
The recent IPCC AR5 WGI (summary for policymakers) showed<br />
that “warming is unlikely to exceed 2°C for RCP2.6” and “likely<br />
to exceed 1.5°C . . . for all RCP scenarios except RCP2.6” (IPCC<br />
2013a). The energy-economic modeling behind the RCP2.6 emissions<br />
scenario (van Vuuren et al. 2011) shows that large-scale<br />
transformations in the energy system are feasible to achieve the low<br />
emissions levels of RCP2.6 and net-negative global energy-related<br />
CO 2 emissions by the 2070s. The IPCC WGIII AR5 showed that there<br />
is a broad category of low-emissions mitigation scenarios that reach<br />
emissions levels comparable to or lower than RCP2.6 (IPCC 2014d).<br />
On average, these scenarios also reach net-zero CO 2 emissions by<br />
2070 [2060 to 2080]. The lowest published emissions scenarios in<br />
recent literature (Luderer et al. 2013; Rogelj et al. 2013a; Rogelj et<br />
al. 2013b) lead to warming projected to peak at around 1.5°C and<br />
decline to a median level of 1.3°C above pre-industrial by 2100.<br />
2.2 Climate Sensitivity and Projected<br />
Warming<br />
Although the past decade has been the warmest on record globally,<br />
observations suggest that the rate of warming during the<br />
last decade has been slower than earlier decades. This has led to<br />
discussions of a so-called “warming hiatus”, for example in the<br />
IPCC AR5 WGI:<br />
“In summary, the observed recent warming hiatus, defined<br />
as the reduction in GMST trend during 1998–2012 as<br />
compared to the trend during 1951–2012, is attributable<br />
in roughly equal measure to a cooling contribution from<br />
internal variability and a reduced trend in external forcing<br />
(expert judgment, medium confidence).” (Stocker et al.<br />
2013, Box TS.3)<br />
7


