En route Air Traffic Control Commands - FAA Human Factors Branch
En route Air Traffic Control Commands - FAA Human Factors Branch
En route Air Traffic Control Commands - FAA Human Factors Branch

Create successful ePaper yourself
Turn your PDF publications into a flip-book with our unique Google optimized e-Paper software.
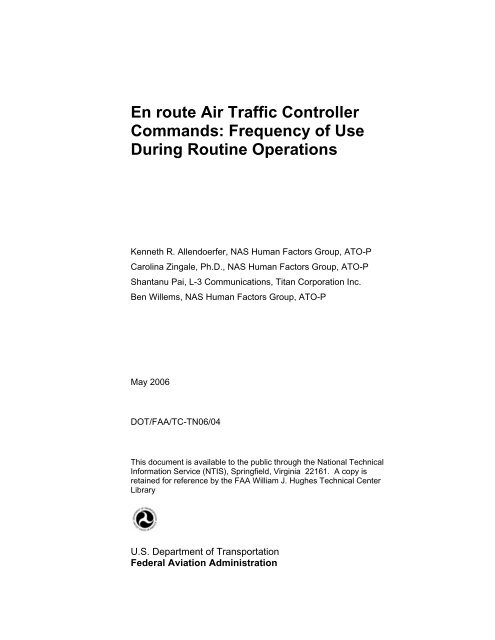
<strong>En</strong> <strong>route</strong> <strong>Air</strong> <strong>Traffic</strong> <strong>Control</strong>ler<br />
<strong>Commands</strong>: Frequency of Use<br />
During Routine Operations<br />
Kenneth R. Allendoerfer, NAS <strong>Human</strong> <strong>Factors</strong> Group, ATO-P<br />
Carolina Zingale, Ph.D., NAS <strong>Human</strong> <strong>Factors</strong> Group, ATO-P<br />
Shantanu Pai, L-3 Communications, Titan Corporation Inc.<br />
Ben Willems, NAS <strong>Human</strong> <strong>Factors</strong> Group, ATO-P<br />
May 2006<br />
DOT/<strong>FAA</strong>/TC-TN06/04<br />
This document is available to the public through the National Technical<br />
Information Service (NTIS), Springfield, Virginia 22161. A copy is<br />
retained for reference by the <strong>FAA</strong> William J. Hughes Technical Center<br />
Library<br />
U.S. Department of Transportation<br />
Federal Aviation Administration
NOTICE<br />
This document is disseminated under the sponsorship of the U.S. Department of<br />
Transportation in the interest of information exchange. The United States<br />
Government assumes no liability for the contents or use thereof. The United<br />
States Government does not endorse products or manufacturers. Trade or<br />
manufacturer's names appear herein solely because they are considered essential<br />
to the objective of this report. This document does not constitute <strong>FAA</strong><br />
certification policy. Consult your local <strong>FAA</strong> aircraft certification office as to its<br />
use.<br />
This report is available at the Federal Aviation Administration William J. Hughes<br />
Technical Center’s full-text technical reports web site: http://actlibrary.tc.faa.gov<br />
in Adobe Acrobat portable document format (PDF).
1. Report No.<br />
DOT/<strong>FAA</strong>/TC-TN06/04<br />
4. Title and Subtitle<br />
Technical Report Documentation Page<br />
2. Government Accession No. 3. Recipient’s Catalog No.<br />
<strong>En</strong> <strong>route</strong> <strong>Air</strong> <strong>Traffic</strong> <strong>Control</strong>ler <strong>Commands</strong>: Frequency of Use During Routine Operations<br />
7. Author(s)<br />
Kenneth Allendoerfer, NAS <strong>Human</strong> <strong>Factors</strong> Group, ATO-P<br />
Carolina Zingale, Ph.D., NAS <strong>Human</strong> <strong>Factors</strong> Group, ATO-P<br />
Shantanu Pai, L-3 Communications Titan Corporation and<br />
Ben Willems, NAS <strong>Human</strong> <strong>Factors</strong> Group, ATO-P<br />
9. Performing Organization Name and Address<br />
NAS <strong>Human</strong> <strong>Factors</strong> Group<br />
Federal Aviation Administration<br />
William J. Hughes Technical Center, Bldg. 28<br />
Atlantic City International <strong>Air</strong>port, NJ 08405<br />
12. Sponsoring Agency Name and Address<br />
Federal Aviation Administration<br />
<strong>Human</strong> <strong>Factors</strong> Research and <strong>En</strong>gineering Division<br />
800 Independence Ave., S.W.<br />
Washington, DC 20591<br />
15. Supplementary Notes<br />
16. Abstract<br />
5. Report Date<br />
May 2006<br />
6. Performing Organization Code<br />
NAS <strong>Human</strong> <strong>Factors</strong> Group<br />
8. Performing Organization Report No.<br />
DOT/<strong>FAA</strong>/TC-TN06/04<br />
10. Work Unit No. (TRAIS)<br />
11. Contract or Grant No.<br />
13. Type of Report and Period Covered<br />
Technical Note<br />
14. Sponsoring Agency Code<br />
<strong>Human</strong> <strong>Factors</strong> Research and<br />
<strong>En</strong>gineering Division, ATO-P<br />
The Federal Aviation Administration has started development of the <strong>En</strong> <strong>route</strong> Automation Modernization (ERAM) system to replace<br />
the current en <strong>route</strong> system consisting of the Host Computer System, Display System Replacement (DSR), and the User Request<br />
Evaluation Tool . ERAM will provide a variety of new user interface (UI) capabilities for accessing and executing controller<br />
commands. An appropriate evaluation of the new UI capabilities will determine how effectively controllers are able to work with the<br />
new system. This technical note documents the frequency of use of controller commands using the legacy system. We calculated the<br />
number of each entry type made per hour in an 11-hour period at a field site and found that the most frequently used commands were:<br />
1) Offset Datablock, 2) Implied <strong>Air</strong>craft Selection (i.e., Accept Handoff/Force Datablock), 3) Initiate Handoff, and 4) Assign Interim<br />
Altitude. The 30 most frequently used commands made up approximately 95% of the total number of controller entries. We<br />
recommend that future test activities target these most frequent commands. We discuss future phases of the project and ways that these<br />
data can be used to compare ERAM to the legacy system.<br />
17. Key Word<br />
<strong>Air</strong> <strong>Traffic</strong> <strong>Control</strong><br />
<strong>En</strong> <strong>route</strong><br />
<strong>Human</strong> <strong>Factors</strong><br />
19. Security Classif. (of this report)<br />
20. Security Classif. (of this page)<br />
Unclassified<br />
Unclassified<br />
Form DOT F 1700.7 (8-72) Reproduction of completed page authorized<br />
18. Distribution Statement<br />
This document is available to the public through the<br />
National Technical Information Service, Springfield,<br />
Virginia, 22161.<br />
21. No. of Pages<br />
34<br />
22. Price
Acknowledgements<br />
We would like to thank Drs. Pamela Della Rocco and D. Michael McAnulty of the Federal<br />
Aviation Administration (<strong>FAA</strong>) National <strong>Air</strong>space System <strong>Human</strong> <strong>Factors</strong> Group who helped<br />
develop the technical approach followed in this report. We would also like to thank Fatiha (Fa)<br />
Jackson of L-3 Communications Titan Corporation for her assistance in conducting the data<br />
reductions reported here.<br />
We would like to acknowledge the assistance of Sheila Mathis and J. D. Hunt of the <strong>FAA</strong> <strong>En</strong><br />
<strong>route</strong> Operational Systems Division and Randy Rupp from Lockheed Martin Corporation who<br />
provided us with crucial information on the reduction and analysis of Display System<br />
Replacement (DSR) System Analysis Recording (SAR) data. Steve Souder and other technical<br />
experts from the <strong>FAA</strong> Integration and Interoperability Facility (I 2 F) also provided guidance and<br />
information.<br />
Finally, we would like to thank the <strong>FAA</strong> <strong>Human</strong> <strong>Factors</strong> Research and <strong>En</strong>gineering Division and<br />
<strong>En</strong> <strong>route</strong> Automation Modernization (ERAM) Program Office for funding this project through<br />
the ERAM Test Group at the William J. Hughes Technical Center.<br />
iii
Table of Contents<br />
Acknowledgements........................................................................................................................iii<br />
Executive Summary...................................................................................................................... vii<br />
1. Introduction................................................................................................................................. 1<br />
1.1 Purpose...................................................................................................................................1<br />
1.2 Background............................................................................................................................1<br />
1.3 User Interface Changes in <strong>En</strong> <strong>route</strong> Automation Modernization ..........................................2<br />
1.4 Previous Research..................................................................................................................2<br />
1.5 Functions and Interactions.....................................................................................................3<br />
2. Data Collection ........................................................................................................................... 5<br />
3. Data Reduction............................................................................................................................ 5<br />
3.1 Database Fields......................................................................................................................5<br />
3.2 HCS Data Reduction..............................................................................................................7<br />
3.2.1 Assumptions ...................................................................................................................7<br />
3.2.2 Issues...............................................................................................................................7<br />
3.3 DSR and URET Data Reduction ...........................................................................................9<br />
3.3.1 Assumptions ...................................................................................................................9<br />
3.3.2 Issues.............................................................................................................................11<br />
4. Results....................................................................................................................................... 12<br />
4.1 Sample Table .......................................................................................................................12<br />
4.2 Details on Host Computer System <strong>En</strong>tries ..........................................................................13<br />
4.3 Details on DSR and URET <strong>En</strong>tries......................................................................................14<br />
5. Discussion and Next Steps........................................................................................................ 16<br />
5.1 Frequency Analysis..............................................................................................................16<br />
5.2 Critical Situation Analysis...................................................................................................16<br />
5.3 Mapping of ERAM Changes ...............................................................................................16<br />
5.4 Usage Characteristics...........................................................................................................17<br />
5.5 Additional Facilities.............................................................................................................17<br />
5.6 Baseline Simulation Test Plan .............................................................................................17<br />
References..................................................................................................................................... 19<br />
Acronyms...................................................................................................................................... 21<br />
Appendix A - Frequency of Use of HCS/DSR/URET Functions<br />
v
List of Illustrations<br />
Figures Page<br />
Figure 1. Levels of analysis of controller usage of a system...........................................................4<br />
Figure 2. Example of rapid repetition of actions. ..........................................................................10<br />
Figure 3. Example of a preference set cluster................................................................................11<br />
Figure 4. Example of identifying flyout menu usage from clicks. ................................................12<br />
Tables Page<br />
Table 1. Data Fields for Functions...................................................................................................5<br />
Table 2. DSR SAR Gates Analyzed ................................................................................................9<br />
Table 3. Frequency of Use for 10 Most Frequent HCS/DSR/URET Functions............................13<br />
Table 4. HCS <strong>En</strong>try Type by FLID Method ..................................................................................13<br />
Table 5. Sample Errors for Initiate Handoff ..................................................................................14<br />
Table 6. Interaction Methods for Adjusting Range .......................................................................15<br />
Table 7. Interaction Methods for Adjusting Vector Line Length ..................................................15<br />
Table 8. Methods for Making Selected <strong>En</strong>tries .............................................................................15<br />
vi
Executive Summary<br />
The Federal Aviation Administration (<strong>FAA</strong>) has started developing the <strong>En</strong> <strong>route</strong> Automation<br />
Modernization (ERAM) system to replace the current en <strong>route</strong> system consisting of the Host<br />
Computer System (HCS), Display System Replacement (DSR), and the User Request Evaluation<br />
Tool (URET). ERAM will provide a variety of new user interface (UI) capabilities for accessing<br />
and executing controller commands. An appropriate evaluation of the new UI capabilities will<br />
determine how effectively controllers are able to work with the new system. The Test and<br />
Evaluation Master Plan for ERAM requires that the ERAM Test Program validate critical<br />
operational issues, such as verifying that ERAM supports en <strong>route</strong> operations with at least the<br />
same effectiveness as the current system (<strong>FAA</strong>, 2003). The <strong>FAA</strong> ERAM Automation Metrics<br />
Test Working Group is developing metrics that quantify the effectiveness of key system<br />
functions to provide methods for comparing the legacy system and ERAM. The system<br />
functions include Surveillance Data Processing, Flight Data Processing, Conflict Probe Tool, and<br />
the Display System. This technical note documents the frequency of use of controller commands<br />
using the legacy system.<br />
The HCS, DSR and URET data summarized in this report were recorded at the <strong>Air</strong> Route <strong>Traffic</strong><br />
<strong>Control</strong> Center in Washington, DC over an 11-hour period in March 2005. The focus of the<br />
current analysis was on controller use of system commands and the means by which the<br />
interaction with the system occurred (e.g., keyboard). We used a number of processing steps and<br />
a combination of existing and custom-developed tools to extract these data from the available<br />
recordings. The controller entry data were sorted into more than 20 fields including the entry<br />
type, a description of the entry type (e.g., Assign Interim Altitude), the sector and position<br />
associated with the entry, the modality used to initiate and complete the entry, whether or not the<br />
entry was implied (i.e., did or did not begin with a specific command key), and whether or not<br />
the entry was accepted by the system. We calculated the number of each entry type made per<br />
hour and found that the most frequently used commands were: Offset Datablock, Implied<br />
<strong>Air</strong>craft Selection (i.e., Accept Handoff/Force Datablock), Initiate Handoff, and Assign Interim<br />
Altitude. The 30 most common commands made up approximately 95% of the total number of<br />
controller entries, and we recommend that future test activities target these most frequent<br />
commands.<br />
We found that the Computer Identifier (CID) was the most frequent way in which controllers<br />
specified tracks. This has implications for ERAM, because changes to the length of the CID may<br />
lead to changes in the time and effort required to make routine entries. We also found<br />
preferences for the way in which controllers adjusted range and vector line length. <strong>Control</strong>lers<br />
performed both of these commands most frequently using the Keypad Selection Device rather<br />
than the views and toolbars provided for these purposes. This information is useful because<br />
ERAM will provide similar new toolbars and capabilities.<br />
In the next phase of this process, we propose evaluating the criticality of controller commands to<br />
determine which may be operationally critical, for example during emergencies, but are<br />
otherwise used infrequently. We discuss possible future phases of the project, including an<br />
analysis of aspects of ERAM that do not target the UI but that may affect how controllers use the<br />
system, an analysis of the usage characteristics of frequent and critical commands, and the<br />
creation of a test plan for a baseline simulation comparing the legacy system and ERAM.<br />
vii
1. Introduction<br />
The Federal Aviation Administration (<strong>FAA</strong>) is developing the <strong>En</strong> <strong>route</strong> Automation<br />
Modernization (ERAM) system to replace the legacy en <strong>route</strong> <strong>Air</strong> <strong>Traffic</strong> <strong>Control</strong> (ATC)<br />
automation system that consists of the Host Computer System (HCS), the Display System<br />
Replacement (DSR), and the User Request Evaluation Tool (URET). <strong>En</strong> <strong>route</strong> controllers use<br />
the legacy system to control thousands of flights each day at 20 <strong>Air</strong> Route <strong>Traffic</strong> <strong>Control</strong><br />
Centers (ARTCCs) in the conterminous United States. Lockheed Martin Corporation is the<br />
primary ERAM contractor.<br />
The Test and Evaluation Master Plan for ERAM requires that the ERAM Test Program verify<br />
critical operational issues (COIs) (<strong>FAA</strong>, 2003). The first COI requires that ERAM support en<br />
<strong>route</strong> ATC operations with at least the same effectiveness as the legacy system. Therefore,<br />
ERAM must allow controllers to accomplish their tasks as well or better than HCS, DSR, and<br />
URET. To determine this, the baseline performance of the legacy system must be measured to<br />
provide standards for later comparisons to ERAM.<br />
1.1 Purpose<br />
This technical note provides the frequency of use of controller commands using the legacy en<br />
<strong>route</strong> ATC system from one typical en <strong>route</strong> facility. This study is one of several conducted by<br />
the Automation Metrics Test Working Group (AMTWG) described in the ERAM Automation<br />
Metrics and Preliminary Test Implementation Plan (<strong>FAA</strong>, 2005).<br />
1.2 Background<br />
The <strong>FAA</strong> ERAM Test Group formed the AMTWG in 2004. The team supports ERAM<br />
developmental and operational testing by developing metrics that quantify the effectiveness of<br />
key system capabilities in ERAM. The targeted capabilities are the Surveillance Data Processing<br />
(SDP), Flight Data Processing (FDP), Conflict Probe Tool (CPT), and the Display System (DS)<br />
modules. The metrics are designed to measure the performance of the legacy system and to<br />
allow valid comparisons to ERAM.<br />
The metrics development project will occur in several phases. First, during 2004, the AMTWG<br />
generated a list of approximately 100 metrics and mapped them to the services and capabilities<br />
found in the Blueprint for the National <strong>Air</strong>space System Modernization 2002 Update (<strong>FAA</strong>,<br />
2002). The initial metrics were published in a progress report (<strong>FAA</strong>, 2004b). Second, during<br />
2005, the team prioritized the metrics for more refinement and created an implementation plan<br />
(<strong>FAA</strong>, 2005). The implementation plan lists the selected metrics, gives rationales for their<br />
selection, and describes how they identified high priority metrics. The implementation plan<br />
allows each metric to be traced to basic controller decisions and tasks, COIs, and the ERAM<br />
contractor’s technical performance measurements. The categories of high priority metrics are<br />
• SDP radar tracking,<br />
• SDP tactical alert processing,<br />
• FDP flight plan <strong>route</strong> expansion,<br />
• FDP aircraft trajectory generation,<br />
• CPT strategic aircraft-to-aircraft conflict prediction,<br />
• CPT aircraft-to-airspace conflict prediction,<br />
1
• additional system level metrics, and<br />
• DS human factors and performance metrics.<br />
In the final project phase, the AMTWG will further refine and apply the metrics to the legacy en<br />
<strong>route</strong> automation system. The team is planning to deliver four reports for fiscal year 2005 with<br />
one covering each of the ERAM components discussed previously: SDP, FDP, CPT, and DS.<br />
These reports will be published in several deliveries to the ERAM Test Group. This technical<br />
note documents the second of these reports examining the ERAM DS. It documents the<br />
frequency of use for current en <strong>route</strong> control automation commands and allows testers to target<br />
those aspects of ERAM that controllers use most. Later reports will provide equivalent measures<br />
for the operational criticality of commands and examine commands for detailed usage<br />
characteristics.<br />
1.3 User Interface Changes in <strong>En</strong> <strong>route</strong> Automation Modernization<br />
ERAM provides a variety of new user interface (UI) capabilities over the legacy automation<br />
system. These include<br />
• toolbars and buttons that can be “torn off” of the main toolbars and placed in different<br />
locations,<br />
• expansion of the capability to issue multiple commands to a track using a single entry,<br />
• a capability to issue the same command to multiple tracks using a single entry,<br />
• a capability to preprogram macros containing multiple commands and associate these<br />
macros with toolbar buttons,<br />
• tabular lists that become interactive views where controllers can click on items, and<br />
• flight plan readouts that automatically update instead of requiring the controller to<br />
manually update them.<br />
Many of these new UI capabilities are intended to reduce routine data entry tasks by allowing<br />
controllers to accomplish several tasks at once. For example, for each aircraft arriving at a<br />
particular fix, a controller may need to enter a new interim altitude, hand the aircraft off to the<br />
next sector, and offset the datablock. A properly constructed macro would allow the controller<br />
to complete these three commands with a single entry.<br />
An appropriate evaluation of these new capabilities would examine their effects on controller<br />
interactions. If the new capabilities are indeed beneficial to controllers, or at least do no harm,<br />
an equal number of or fewer interactions should be evident in ERAM. For example, if the tearoff<br />
toolbars are indeed beneficial, a reduction in time spent manipulating the overall toolbars<br />
might be evident. If data entry workload is reduced, controllers may be able to allocate the<br />
corresponding time and effort to other tasks such as planning, communicating, and separating<br />
aircraft. Accompanying increases in operational efficiency and possibly safety could result.<br />
This report provides the frequency with which controllers make different entry types using the<br />
legacy automation system. These data can be used to guide future ERAM testing and to ensure<br />
that testing targets the most frequent and important controller commands.<br />
1.4 Previous Research<br />
During the development process for DSR, the National <strong>Air</strong>space System (NAS) <strong>Human</strong> <strong>Factors</strong><br />
Group conducted baseline simulations of the original HCS with the Plan View Display (PVD)<br />
2
(Galushka, Frederick, Mogford, & Krois, 1995) and the HCS with the DSR (Allendoerfer,<br />
Galushka, & Mogford, 2000). In these studies, we measured controller interactions and<br />
compared them at the level of HCS data entry types, such as None (QN) and Amendment (AM).<br />
At the time, we did not examine the subtypes of HCS data entries. For example, the QN entry<br />
type contains Offset Datablock, Accept Handoff, and Assign Altitude commands. We did not<br />
evaluate these commands separately though they are conceptually very different.<br />
We also did not consider the various ways that a data entry can be made. For example, an<br />
Assigned Altitude command can be entered by typing the desired altitude on the keyboard<br />
followed by the three-character Computer Identification (CID) for the aircraft. Assigned<br />
Altitude can also be entered by typing the altitude followed by the beacon code or callsign.<br />
Finally, Assigned Altitude can be entered by typing the altitude on the keyboard and clicking on<br />
the aircraft with the trackball cursor. The multiple methods for entering an Assigned Altitude<br />
command differ in their information requirements, the amount of time and effort they require,<br />
and their appropriateness for a given situation.<br />
In the earlier baseline studies, we did not measure the display control commands that are not<br />
processed by the HCS. These commands include adjusting the range, vector line length, and<br />
brightness. The primary reason for not including these commands was a lack of automated data<br />
collection capabilities on the PVD (these commands were provided with mechanical knobs at the<br />
time) and a lack of familiarity with the DSR data recording methods.<br />
Finally, since we conducted our original studies, many changes have occurred in the legacy<br />
system. Most important, URET has been introduced and deployed to the field. It provides many<br />
new commands and changes the way that controllers accomplish original HCS commands like<br />
amending flight plans. In addition, new DSR capabilities have been introduced such as flyout<br />
menus that allow changes to altitude, speed, and heading and new toolbars that allow controllers<br />
to adjust range and add annotations.<br />
The current project seeks to improve on all these limitations. We examine controller interactions<br />
at a much more detailed level than the earlier baselines, and we include all types of interactions,<br />
including display controls and URET commands. Finally, we use a much larger and richer data<br />
set that contains tens of thousands of interactions.<br />
1.5 Functions and Interactions<br />
<strong>Control</strong>ler usage of a system can be analyzed at different levels of abstraction (see Figure 1). At<br />
the highest level of abstraction, controllers’ overall goals can be examined, such as how<br />
successfully they maintain an efficient flow of traffic. It can be very difficult to formally<br />
evaluate complex systems at the goal level because so many other systems and factors, such as<br />
training and procedures, affect how well the system supports the achievement of the goals. In<br />
any case, the overall goals of the legacy system and ERAM do not change. <strong>Control</strong>lers are still<br />
expected to maintain a safe and efficient flow of traffic following the established procedures of<br />
the <strong>FAA</strong> and their local facility.<br />
To achieve goals, a controller must engage in one or more tasks, such as maintaining an accurate<br />
flight database. Evaluating a complex system at the task level is feasible, and the tasks that<br />
ERAM is intended to support are discussed in the implementation plan (<strong>FAA</strong>, 2005). In most<br />
cases, the tasks associated with the legacy system do not change in ERAM.<br />
3
Goal<br />
Maintain Efficient Flow of <strong>Traffic</strong><br />
Task<br />
Update Flight Database<br />
Command<br />
<strong>En</strong>ter Assigned Altitude<br />
4<br />
Interaction Method<br />
<strong>En</strong>ter Assigned Altitude<br />
Using Keyboard & CID<br />
Action: Press “2”<br />
Action: Press “9”<br />
Action: Press “0”<br />
Action: Press<br />
<br />
Action: Press “1”<br />
Action: Press “8”<br />
Action: Press “E”<br />
Action: Press <br />
Figure 1. Levels of analysis of controller usage of a system.<br />
Accomplishing a task using the legacy system or ERAM requires that a controller use one or<br />
more system commands. A command is a system-oriented term relating to one thing the system<br />
can do, such as display a piece of information or accept a type of input data. Examples of<br />
commands include Assigned Altitude, Offset Datablock, and Amend Flight Plan. Analysis of the<br />
most commonly used commands is one focus of the current report.<br />
In the legacy system and ERAM, many commands can be accomplished through one or more<br />
interaction methods. An interaction method is a group of individual actions that accomplish a<br />
command. For example, if a controller wishes to complete the Adjust Range command to<br />
change the zoom of his or her radar display, the controller can choose among the following<br />
interaction methods.<br />
• On the Situation Display (SD) Range Toolbar, click on the current range value and type<br />
the desired value with the keyboard.<br />
• On the SD Range Toolbar, move the cursor over the “-/+” pick area. Click with the<br />
trackball pick or enter key to decrease or increase the value.<br />
• On the SD Range Toolbar, click and drag the range slider bar to the desired value.<br />
Alternately, click the trough areas of the slider to decrease or increase the value.<br />
• On the SD Range Toolbar, click on one of two preset range settings to change the current<br />
setting to the preset value.
• On the Keypad Selection Device (KSD), press one of the RNG range arrow keys (marked<br />
“RNG”) to increase or decrease the setting.<br />
• Activate a preference set with a different range setting.<br />
The second focus of the current report is to examine the specific interaction methods that<br />
controllers use to accomplish commands. An interaction method is made up of individual user<br />
actions. An action is a keystroke or a trackball button click. Some interaction methods require<br />
many actions, others require very few. In the current report, we do not analyze the data at the<br />
action level. That is, we are not concerned here with individual keystrokes or clicks. The data<br />
reduction methods described here, however, do allow for analysis at the action level if needed in<br />
the future.<br />
2. Data Collection<br />
To provide the most comprehensive data set possible, we based the analysis on System Analysis<br />
Recording (SAR) data recorded by the <strong>FAA</strong> Integration and Interoperability Facility (I 2 F) at<br />
Washington ARTCC (ZDC) on March 17-18, 2005. These recordings were made to assist the<br />
AMTWG in a number of its activities. The data set includes 11 hours 25 minutes of controller<br />
interactions recorded across the entire facility, including more than 110 operational positions and<br />
more than 50 sectors. This represents 663 controller shifts and 168 individual controllers. The<br />
dataset includes over 200,000 controller interactions and responses. To our knowledge, this is<br />
the largest in-depth analysis of en <strong>route</strong> controller interactions ever conducted by the <strong>FAA</strong>.<br />
3. Data Reduction<br />
Several steps were necessary to prepare the data for the analysis. Existing software tools did not<br />
provide the level of analysis required for this project. As a result, we used a combination of<br />
existing and custom-developed tools.<br />
3.1 Database Fields<br />
The primary levels of analysis in this report are commands and interaction methods. We created<br />
a database containing fields that describe interaction methods according to the fields provided in<br />
Table 1.<br />
Table 1. Data Fields for Functions<br />
Field Description<br />
Index Line number of the data from the HCS or DSR SAR file<br />
(e.g., 10004942)<br />
Source HCS or DSR recording<br />
(e.g., Host)<br />
Date Date when entry was recorded<br />
(e.g., 2005-03-17)<br />
InitTime Time an entry was recognized as initiated by the system<br />
(e.g., 22:30:02.013)<br />
CompTime Time an entry was recognized as completed by the system<br />
(e.g., 23:32:01.453)<br />
Sector Sector associated with the entry<br />
(e.g., 25)<br />
5
Table 1. Data Fields for Functions (continued)<br />
Field Description<br />
Position <strong>Control</strong>ler position associated with the entry<br />
(e.g., R)<br />
View System view or window where the entry occurred<br />
(e.g., Display <strong>Control</strong>s)<br />
TwoLetter Two letter identifier of HCS entries<br />
(e.g., QQ)<br />
Type Description Explanation of entry type (formal command names can be<br />
abstracted from this field)<br />
(e.g., Assign Interim Altitude)<br />
SeqNo Sequence number of entry used by HCS SAR file<br />
(e.g., 6c2c)<br />
CID <strong>Air</strong>craft CID obtained from HCS SAR file<br />
(e.g., 730)<br />
Flight Identifier Describes how the controller indicated which aircraft to act upon<br />
(FLID) Method in the entry, if needed<br />
(e.g., )<br />
Other Parameter Additional parameters used in the entry beside CID, FLID method,<br />
SeqNo<br />
(e.g., 290 for Assigned Altitude)<br />
InitModality Method used to initiate the entry<br />
(e.g., KYBD)<br />
CompModality Method used to complete the entry<br />
(e.g., FLYOUT)<br />
Implied Identifies whether or not the entry began with a specific command<br />
key<br />
(e.g., TRUE)<br />
Accepted Identifies whether or not the HCS accepted or rejected the entry<br />
(e.g., FALSE)<br />
Text Contains the complete text of the entry or the text description from<br />
the SAR file<br />
(e.g., QQ 310 30F)<br />
Response Contains the text of any messages returned by the HCS to indicate<br />
to controllers whether the entry was successful or not<br />
(e.g., ROUTE NOT DISPLAYABLE)<br />
Response Type Categorizes the type of response into an acceptance or one of<br />
several rejection types<br />
(e.g., Invalid Data Error)<br />
Response Time Time at which the system generated the response message<br />
(e.g., 23:34:02.166)<br />
6
3.2 HCS Data Reduction<br />
We had experience working with HCS SAR tapes during earlier baseline studies, such as the<br />
DSR Baseline (Allendoerfer et al., 2000). However, no suitable tools existed for reducing or<br />
analyzing the tapes at the level of detail required for this project. Using Microsoft Excel and<br />
Visual Basic for Applications (VBA), we created a data reduction tool called <strong>En</strong>try Counter.<br />
<strong>En</strong>try Counter analyzes HCS SAR data files and outputs a table consisting of each controller<br />
entry with data parsed into the fields described in Table 1.<br />
3.2.1 Assumptions<br />
The following section describes assumptions we made while conducting the data analysis of the<br />
HCS data.<br />
3.2.1.1 Matching <strong>En</strong>try and Response Messages<br />
When a controller makes an incorrect HCS entry, the HCS provides a response message. In<br />
some cases, the HCS also provides response messages for accepted entries, as in flight plan<br />
readout entries. Unfortunately, there is no simple way to use the HCS data to match a response<br />
message to the entry that generated it, especially when the response is a general error message<br />
such as MESSAGE TOO SHORT.<br />
Because we are interested in error rates for different commands, we have implemented a<br />
matching algorithm in <strong>En</strong>try Counter. The algorithm appears to provide accurate matching of<br />
responses to the entries that generated them. To qualify as a match,<br />
• the response must be listed later in the data file than the entry,<br />
• the response and entry must have occurred in the same sector and position,<br />
• the response and entry must occur within 2.5 1 seconds of each other, and<br />
• the entry cannot already have a response assigned to it.<br />
3.2.2 Issues<br />
The following subsections describe issues we encountered while reducing and analyzing the<br />
HCS SAR data. In future projects, fixes or workarounds for these problems may be necessary.<br />
3.2.2.1 Implied <strong>Air</strong>craft Selections<br />
Implied entries are HCS entries where the controller does not press a command key at the<br />
beginning of the entry. In these cases, the HCS determines the meaning of the entry from other<br />
data in the entry and, in some cases, the context in which the entry occurs. For example, clicking<br />
on a track with no accompanying data in the Message Composition area or entering a CID with<br />
no accompanying data (e.g., 56E ) yields different outcomes depending on the status of<br />
the track. If the aircraft is in handoff status, the HCS interprets the entry as Accept Handoff. If<br />
the aircraft is not in handoff status and being shown as a limited datablock, the HCS interprets<br />
the entry as Force Datablock (i.e., the datablock is displayed as a full even though the controller<br />
does not own the target).<br />
1 This and other similar criteria are based on careful inspection of the data by the psychologists. In this case, using 2.5 seconds resolves the<br />
overwhelming majority of response messages with a minimum of false resolutions.<br />
7
The HCS SAR recordings do not contain a simple manner to determine the context of implied<br />
aircraft selections. They list that the controller clicked on a target and that no error was<br />
generated. However, the recordings do not indicate directly whether the click resulted in an<br />
Accept Handoff or Force Datablock command. To determine this, a much more detailed analysis<br />
of the track data would be necessary. The level of ambiguity in this algorithm is not desirable.<br />
These are reported as “Implied <strong>Air</strong>craft Selection” as a separate entry type even though it is truly<br />
composed of Accept Handoff and Force Datablock. Future analyses should explore mechanisms<br />
for determining the status of aircraft to establish the context and nature of implied aircraft<br />
selections.<br />
3.2.2.2 Unreliable Timestamps<br />
A response message occurs after the entry that generated it. However, in the HCS data, the<br />
timestamps for response messages sometimes showed that the response occurred at the same<br />
time or occasionally several milliseconds before the entry that generated it. We suspect this<br />
issue is caused by the recording priorities and techniques of the HCS. To account for these<br />
discrepancies, calculations in <strong>En</strong>try Counter involving time are programmed to consider a<br />
window of time rather than a value in a specific direction. For example, <strong>En</strong>try Counter requires<br />
a response message to occur within 2.5 seconds of an originating entry to qualify as a match<br />
rather than requiring the response to occur after the entry.<br />
The sequence of lines in the HCS data appears to reliably reflect the order of events. That is, a<br />
response message is always listed after its originating entry regardless of their timestamps. This<br />
allows <strong>En</strong>try Counter to consider the line number in addition to timestamps in some of its<br />
calculations. For example, in addition to requiring a window of time, <strong>En</strong>try Counter requires that<br />
a response message occur later in the data file than the entry to qualify as a match.<br />
3.2.2.3 Undetermined Frequent Blank <strong>En</strong>tries<br />
The HCS data included a number of blank entries that had no obvious equivalents in the DSR or<br />
URET data. These entries appear as if the controller pressed the <strong>En</strong>ter key with no data in the<br />
Message Composition area. Typically, blank entries receive a MESSAGE TOO SHORT<br />
response. We have seen controllers habitually press the Clear key, but we currently have no<br />
explanation for why they would press the <strong>En</strong>ter key so frequently with no data in the<br />
composition area. The frequency of these entries leads us to suspect that they result from<br />
interactions with DSR or URET that we do not currently understand. We suspect that if<br />
controllers were actually seeing so many MESSAGE TOO SHORT response messages, they<br />
would have complained. These are reported as “Undetermined” in subsequent analyses.<br />
3.2.2.4 Unmatched Responses<br />
The HCS SAR includes responses to all types of entries, even if those commands were entered<br />
through a mechanism other than the HCS. This leads to response messages that seemingly do<br />
not have an originating entry. For example, if a controller enters a flight plan amendment<br />
through URET, the HCS still processes the amendment and provides a response. There is no<br />
record in the HCS SAR of the entry itself because it was made through URET. However, the<br />
response message does appear in the controller’s readout area and is recorded in the HCS SAR<br />
data. This leads to “orphaned” response messages that can only be resolved by manually<br />
considering the DSR and URET data in parallel, which is beyond the scope of this analysis.<br />
8
3.2.2.5 No Quicklook <strong>En</strong>tries<br />
For reasons we have not been able to identify, no Quicklook (QL) commands appear in the HCS<br />
SAR data. We see no reason why these commands should not appear when all other HCS<br />
commands do, including many obscure ones. QL commands do appear in the corresponding<br />
DSR files, and we have used these in the counts reported in this document.<br />
3.3 DSR and URET Data Reduction<br />
Unlike the HCS data, we had no previous experience working with DSR SAR files, which<br />
contain data about controller interactions made through DSR and URET. An additional level of<br />
reduction was necessary for these data. First, we used the System Wide Analysis Capability<br />
(SWAC) tool to pull gates (i.e., units of recording) that apply to controller interactions. The<br />
gates we selected are listed in Table 2. Second, we brought the reduced files into <strong>En</strong>try Counter.<br />
Gate<br />
Table 2. DSR SAR Gates Analyzed<br />
Description<br />
AG_12006 Interactions with the Display <strong>Control</strong>s (DC) View<br />
AG_12015<br />
AG 12016<br />
Interactions with the Computer Readout Display (CRD)<br />
AG_12017 Interactions with the Keypad Selection Device (KSD)<br />
AG_12019 Interactions with the Flight Plan Readout View<br />
AG_12020 Interactions with the Continuous Range Readout View<br />
AG_12021,<br />
AG_12022,<br />
AG_12023<br />
Interactions with the Annotation Toolbars<br />
AG_12026 Interactions with the Flyout Menus<br />
AG_12027,<br />
Interactions with Situation Display (SD) Toolbars<br />
AG_12028<br />
R_CMD, D_CMD, Interactions with the DSR keyboard and trackball<br />
A_CMD,<br />
HOST_CMD HCS commands composed by DSR or URET<br />
R_CMDKEY, Interactions with DSR keyboard by pressing a command key<br />
D_CMDKEY,<br />
A_CMDKEY<br />
R_CMDRS,<br />
Response and feedback messages<br />
D_CMDRS,<br />
A_CMDRS,<br />
R_CMDFB,<br />
D_CMDFB,<br />
A_CMDFB<br />
AG_11806 Every pick with the trackball and corresponding affected views<br />
AG_13110 Interactions with URET<br />
3.3.1 Assumptions<br />
The following section describes assumptions we made while conducting the data analysis of the<br />
DSR and URET data.<br />
9
3.3.1.1 Edges of Interactions<br />
Many entries in DSR involve rapid repetition of the same action. For example, to increase the<br />
vector line length, a controller may click on the VECTOR pick area in the with the center<br />
trackball button. One click increases the vector line length by one available value (i.e., 0, 1, 2, 4,<br />
or 8 minutes of flying time). If the controller wishes to increase the length by multiple units,<br />
multiple clicks are necessary.<br />
In our analysis, we treat rapid repetition of the same DSR action by the same controller as<br />
multiple clicks serving to create a single entry. This is to ensure comparability with the HCS<br />
entries in which many keystrokes are necessary to compose a single entry. To determine what<br />
qualifies as rapid repetition, we examined DSR entries of various types and determined that a<br />
window of 1 second provided reasonable, interpretable sequences. For example, in Figure 2, the<br />
controller makes eight keystrokes in a row on the KSD. The first four keystrokes, each occurring<br />
within 1 second of its predecessor, all were on the VECT � key. The second four keystrokes,<br />
each occurring with 1 second of its predecessor, all were on the VECT � key. The gap of about<br />
10 seconds between the fourth and fifth keystroke and that the controller pressed different keys<br />
forms the break between one Adjust Vector Line entry and another.<br />
Time<br />
22:16:22.149<br />
22:16:22.291<br />
22:16:22.421<br />
22:16:22.565<br />
22:16:32.169<br />
22:16:32.390<br />
22:16:32.551<br />
22:16:32.711<br />
VEC_UP<br />
VEC_UP<br />
VEC_UP<br />
VEC_UP<br />
VEC_DN<br />
VEC_DN<br />
VEC_DN<br />
VEC_DN<br />
DSR Command<br />
Figure 2. Example of rapid repetition of actions.<br />
3.3.1.2 Preference Set Clusters<br />
10<br />
1 st Adjust Vector Line<br />
2 nd Adjust Vector Line<br />
Similar to rapid repetition, the application of a preference set in DSR results in a rapid sequence<br />
of display setting adjustments. Because these were generated by the preference set and not<br />
individual controller actions, they should be counted as part of the preference set, not separately.<br />
However, the DSR gates do not indicate whether a display setting adjustment was accomplished<br />
through a preference set. In our analysis, to count as a display setting adjustment resulting from<br />
a preference set, an adjustment must occur within 250 ms following a Sign In, Invoke Preference<br />
Set entry or within 250 ms following a display setting adjustment from a preference set. For<br />
example, in Figure 3, a controller signs in and immediately 15 changes are made to the display<br />
by the controller’s preference set. Two seconds later, the controller adjusts the range manually<br />
and makes another entry, which are separate from the preference set actions.
Time<br />
22:14:52.674<br />
22:14:52.828<br />
22:14:52.838<br />
22:14:52.847<br />
22:14:52.848<br />
22:14:52.849<br />
22:14:52.849<br />
22:14:52.850<br />
22:14:52.850<br />
22:14:52.851<br />
22:14:52.851<br />
22:14:52.851<br />
22:14:52.851<br />
22:14:52.876<br />
22:14:52.917<br />
22:14:52.930<br />
22:14:54.004<br />
22:14:55.249<br />
QP SI RU 1<br />
MAKE_VIEW_SEMI_TRANSPARENT<br />
SET_BCG_FROM_DISPLAY_CONSTANTS<br />
TOGGLE_SEMI_TRANSPARENT<br />
DECREMENT_FONT_SIZE<br />
INCREMENT_FR_NUM<br />
INCREMENT_FR_NUM<br />
INCREMENT_FR_NUM<br />
INCREMENT_FR_NUM<br />
TOGGLE_LBL<br />
TOGGLE_SPD<br />
TOGGLE_FIX<br />
TOGGLE_TIM<br />
SET_BCG_FROM_DISPLAY_CONSTANTS<br />
SHOW_ALTITUDE_LIMITS_TOOLBAR<br />
HIDE_CRR_VIEW<br />
RNG_UP<br />
OVM<br />
DSR Command<br />
11<br />
Sign In entry<br />
Display Adjustments<br />
Made by Preference Set<br />
Subsequent Display<br />
Adjustments Made by<br />
<strong>Control</strong>ler<br />
Figure 3. Example of a preference set cluster.<br />
3.3.2 Issues<br />
In the reduction and analysis of the DSR SAR files, we encountered several problems. The<br />
following sections discuss these problems and the methods we used to address or work around<br />
them.<br />
3.3.2.1 Flyout Menus Not Recorded<br />
AG_12026, the gate associated with the DSR flyout menus, was mistakenly not recorded in the<br />
data set from ZDC. This prevented us from examining controllers’ use of these menus in detail.<br />
However, because these are an important capability of DSR and have many analogs in new<br />
ERAM capabilities, we concluded that it was worthwhile to identify these commands as best we<br />
could from the AG_11806 gate, which records each trackball click and the views it affects. In<br />
this way, even though we could not identify which pieces of the flyout menus were being<br />
clicked, we could at least determine the number of times controllers used the flyout menus. In<br />
addition, we adopted a criterion by which if the HCS received a Interim Altitude (QQ), Assigned<br />
Altitude (QZ), or Speed/Heading/Free Form Text (QS) entry that immediately followed clicks in<br />
a flyout menu (i.e., no other commands issued in between), the entry was counted as having been<br />
entered through the flyout menu. For example, in Figure 4, a controller makes two picks in a<br />
flyout menu immediately followed by a change speed command. By our criteria, this entry was<br />
counted as having been made through the flyout menu and not by the keyboard.
Time<br />
00:16:03.612<br />
00:16:05.191<br />
00:16:05.464<br />
MENU<br />
MENU<br />
DSR Command<br />
QS /290- 573<br />
12<br />
Picks in Flyout Menu<br />
<strong>En</strong>ter Speed from Flyout<br />
Menu<br />
Figure 4. Example of identifying flyout menu usage from clicks.<br />
3.3.2.2 Unmatched Responses<br />
Like the HCS data, there are some response messages recorded in the DSR data that seem to<br />
have no originating event. The orphaned response messages typically are recorded as<br />
MESSAGE TOO SHORT. As noted in Section 3.2.2.3, they are typically associated with blank<br />
HCS entries and do not appear in the DSR SAR. As a result, there are many MESSAGE TOO<br />
SHORT orphaned responses in the DSR data that cannot be tracked to an entry that generated<br />
them. By examining the HCS and DSR data in parallel, the orphaned messages can be resolved,<br />
though why so many blank HCS entries appear in the data set is not currently known.<br />
3.3.2.3 Unidentified <strong>Commands</strong><br />
In the URET data, a message called DISPLAY_LOCATION occurred very frequently, often<br />
associated with other commands occurring within a few milliseconds. We believe that this<br />
message relates to updating the URET windows and lists, but we have not been able to identify<br />
its full purpose. Based on the frequency of the message, we believe that it is not a controller<br />
entry but rather a system message.<br />
3.3.2.4 Filesize Issues<br />
DSR SAR files contain enormous amounts of information, approximately 650 MB per hour in<br />
binary form. Reducing the data using SWAC for the selected gates produced files of<br />
approximately 50 MB per 40 minutes. The number of lines and entries tests the limits of <strong>En</strong>try<br />
Counter in the Microsoft Excel VBA environment, which was selected for its simplicity and<br />
rapid development time. Future analyses of these data may require a more robust data reduction<br />
and database management system.<br />
4. Results<br />
The following sections contain tables showing the frequency of use of various controller<br />
commands. Later sections provide examples of detailed analysis of specific commands.<br />
4.1 Sample Table<br />
Table 3 shows a sample of the frequency data for the 10 most frequent entry types across the<br />
ARTCC during the 11.4-hour recording period. Table A-1 in Appendix A shows the table for all<br />
entry types. The table shows the overall and cumulative percentages for each entry type.
Table 3. Frequency of Use for 10 Most Frequent HCS/DSR/URET Functions<br />
Type <strong>En</strong>tries Overall % Cumulative %<br />
1. Offset Datablock<br />
Implied <strong>Air</strong>craft Selection<br />
39355 19.8% 19.8%<br />
2. (Accept Handoff/Force<br />
Datablock)<br />
32642 16.4% 36.3%<br />
3. Initiate Handoff 15017 7.6% 43.8%<br />
4. Assign Interim Altitude 10871 5.5% 49.3%<br />
5. Adjust Vector Line 9491 4.8% 54.1%<br />
6. Route Display 7279 3.7% 57.8%<br />
7. Delete <strong>Air</strong>craft 6965 3.5% 61.3%<br />
Toggle Bookkeeping<br />
8.<br />
Checkmark<br />
6700 3.4% 64.7%<br />
9. Quicklook 5673 2.9% 67.5%<br />
10. Flight Plan Readout Request 5637 2.8% 70.3%<br />
4.2 Details on Host Computer System <strong>En</strong>tries<br />
The frequency of use data can be examined at many levels of detail using the other data fields.<br />
Table 4 contains sample details for three common HCS entry types. The syntax for these entries<br />
requires the controller to specify a flight identifier (FLID) in addition to other parameters. The<br />
controller can do this using the beacon code (e.g., 32 6271 , which initiates a handoff of<br />
the aircraft with beacon code 6271 to Sector 32), the callsign (e.g., 50 USA176 ), the<br />
CID (e.g., 38 88G ), or by clicking on the target with the trackball (e.g., 12 ).<br />
Table 4. HCS <strong>En</strong>try Type by FLID Method<br />
FLID Method<br />
<strong>En</strong>try Type Beacon Code Callsign CID Trackball<br />
Offset Datablock 0.2% 0.1% 60.8% 38.9%<br />
Implied <strong>Air</strong>craft<br />
Selection<br />
0.9% 0.1% 54.8% 44.2%<br />
Initiate Handoff 0.1% 0.3% 70.0% 29.6%<br />
This type of analysis may be useful in ERAM testing because changes to the UI may affect<br />
which FLID method controllers select. For example, using the CID, a three-digit code (e.g., 128)<br />
is the most common FLID method for these entry types. Beacon code is four octal digits (e.g.,<br />
2477) and callsign can range from one to seven alphanumeric characters (e.g., AAL1234).<br />
However, if the length of the CID is increased in ERAM from three to four characters,<br />
controllers may shift their preference toward the other methods. Because entry methods differ<br />
with respect to the amount of time or effort required, such a shift may result in changes in data<br />
entry workload.<br />
Another type of analysis that may be useful in ERAM testing is to examine the mistakes<br />
controllers make for certain important commands. For example, Initiate Handoff is an extremely<br />
common command on which controllers frequently make mistakes. In the ZDC data, controllers<br />
received an error nearly 9% of the time they attempted to initiate a handoff. This error rate<br />
creates workload and frustration for the controllers and increases the chances that erroneous data<br />
13
will be entered into the NAS or that handoffs will not be made in a timely manner. Using <strong>En</strong>try<br />
Counter, controller data entry errors can be analyzed in detail, as shown in Table 5.<br />
Table 5. Sample Errors for Initiate Handoff<br />
<strong>Control</strong>ler<br />
<strong>En</strong>try<br />
Error Message Error Description<br />
54 SECTOR 19 HAS CONTROL<br />
The controller tried to initiate a handoff<br />
INITIATE HANDOFF AAL2031<br />
on AAL2031 to Sector 54. However, the<br />
54 <br />
aircraft is being controlled by Sector 19<br />
and the handoff is disallowed.<br />
34 NO TB FLIGHT ID CAPTURE<br />
The controller tried to handoff an<br />
UNIDENTIFD ACTN<br />
unknown aircraft to Sector 34 but did not<br />
34 <br />
click on a track with the cursor.<br />
V 160 NO ARTS FP<br />
The controller attempted to handoff an<br />
INITIATE HANDOFF GLB39<br />
aircraft to an ARTS facility but it did not<br />
V 160<br />
have the aircraft flight plan.<br />
N 325 AC IN HANDOFF<br />
The controller tried to handoff COA1055<br />
INITIATE HANDOFF COA1055<br />
to the N sector but the aircraft was<br />
N 325<br />
already in handoff status.<br />
QZ 40 61C SECTOR NOT ACTIVE<br />
The controller tried to handoff N41PC to<br />
INITIATE HANDOFF N41PC<br />
Sector 40 but that sector was not<br />
40 61C<br />
currently active according to the sector<br />
configuration.<br />
33 6811 FLID FORMAT<br />
The controller entered an invalid flight<br />
UNIDENTIFD ACTN<br />
identifier. In this case, it is difficult to<br />
33 6811<br />
tell if the controller meant to enter a<br />
beacon code but pressed the 8 key by<br />
mistake (beacon codes cannot have 8s)<br />
or if the controller was trying to enter a<br />
CID and hit the 1 key twice (CIDs have<br />
only 3 digits).<br />
83 NON-ADAPTED SECTOR<br />
The controller tried to handoff JIA2330<br />
INITIATE HANDOFF JIA2330<br />
to Sector 83 but no such sector exists in<br />
83 <br />
the ZDC adaptation.<br />
4.3 Details on DSR and URET <strong>En</strong>tries<br />
Many entry types in the legacy system can be accomplished in several ways. Table 6 contains<br />
sample data for each of the ways that controllers can adjust the range discussed in Section 1.5.<br />
By a large margin, the most common method was using the KSD. The individual methods<br />
provided by the SD Range Toolbar, a fairly recent addition to the DSR UI, were used<br />
considerably less often, although cumulatively they represent 20.2% of controller entries.<br />
14
Table 6. Interaction Methods for Adjusting Range<br />
Interaction Method Toolbar (if applicable) Percentage<br />
Keypad Selection Device (KSD) 72.3%<br />
Inc/Dec Button SD Range Toolbar 9.8%<br />
Display Constants 7.5%<br />
Slider SD Range Toolbar 6.5%<br />
Toggle Button SD Range Toolbar 1.6%<br />
Type Slider Value SD Range Toolbar 1.4%<br />
Slider Trough SD Range Toolbar 0.5%<br />
Restore Previous Setting SD Range Toolbar 0.4%<br />
Table 7 contains sample data for each of the ways that controllers can adjust the vector line<br />
length. Similar to adjusting range, controllers choose to adjust the vector line using the KSD by<br />
a wide margin over the DC View. This type of analysis may be useful for ERAM testing<br />
because ERAM may provide new toolbar capabilities and methods for entering commands,<br />
similar to the SD Range Toolbar.<br />
Table 7. Interaction Methods for Adjusting Vector Line Length<br />
Interaction Method Percentage<br />
Keypad Selection Device (KSD) 80.1%<br />
Display <strong>Control</strong> and Status View 19.9%<br />
Table 8 contains sample data for each of the ways that controllers can make flight plan<br />
amendments and related commands. For these commands, in addition to the traditional methods<br />
for making entries using the keyboard and trackball, controllers can use flyout menus on the<br />
main radar display and the <strong>Air</strong>craft List in URET. The data show that controllers vary their entry<br />
method on an entry-by-entry basis. This analysis may be important for ERAM testing because<br />
the ERAM UI is increasingly oriented toward entering information in windows and fields rather<br />
than using the command syntax of the HCS. This may change the speed and accuracy with<br />
which controllers can make these entries.<br />
Table 8. Methods for Making Selected <strong>En</strong>tries<br />
Flyout<br />
Menu<br />
Keyboard<br />
Only<br />
Keyboard &<br />
Trackball<br />
URET<br />
Amendment (AM) n/a 7.4% 0.0% 92.6%<br />
Speed, heading, free form<br />
text (QS)<br />
68.2% 31.4% 0.3% 1.8%<br />
Flight Plan (FP) n/a 44.4% 2.8% 52.8%<br />
15
5. Discussion and Next Steps<br />
5.1 Frequency Analysis<br />
Table 3 shows a sample of the frequency data for the 10 most frequently used entry types during<br />
regular operations at ZDC. The main data table show which commands are used most frequently<br />
and the detailed analyses show how some common commands are used. For future ERAM<br />
testing, we recommend focusing on the top 30 commands because these will encompass about<br />
95% of controller entries. Detailed analyses, such as those reported here, should be conducted<br />
for each selected entry type.<br />
5.2 Critical Situation Analysis<br />
Frequency of use is not the only factor affecting the operational significance of a command.<br />
Some commands are operationally important but used infrequently, especially those related to<br />
emergencies and other critical events. Because the analysis reported here is based on routine<br />
operations at ZDC, the frequency of use for rare but important commands may be<br />
underrepresented in Table 3. Additional analysis is required to identify commands that are<br />
operationally important in certain uncommon situations but infrequent during regular operations.<br />
We will conduct this analysis in 2005 by interviewing and surveying subject matter experts from<br />
ARTCCs. We will identify uncommon situations, such as emergencies and equipment outages,<br />
and identify the HCS/DSR/URET commands controllers use to respond. These commands may<br />
appear only rarely (or not at all) during the day-in-the-life analysis. These rare but important<br />
commands will be added to the list of commands for detailed analysis in later phases of the<br />
project.<br />
5.3 Mapping of ERAM Changes<br />
ERAM makes a number of changes to the legacy system. As discussed in Section 1.3, some of<br />
these changes are directly related to the controller UI and have a clear potential to affect how<br />
controllers use the system. These effects can be beneficial or detrimental and will be examined<br />
in later phases of the ERAM testing.<br />
However, other ERAM changes are not specifically targeted at the UI but may have latent effects<br />
on how controllers use the system. In later phases of the project, we will conduct an analysis to<br />
identify areas where other changes in ERAM may affect how controllers use and interact with<br />
the system. We will include these areas in our subsequent test plans and activities.<br />
There are other ERAM changes that we anticipate may have some effect on controllers:<br />
• ERAM will use a single flight database across multiple ARTCCs. This may require<br />
modification to the number of characters in the CID to accommodate a larger number of<br />
simultaneous tracks. Given the number of times controllers enter the CID (over 7000<br />
times per hour across the ZDC dataset), this change could have a substantial effect on<br />
how controllers make entries and use ERAM.<br />
• ERAM will incorporate new tracker algorithms. Other members of the AMTWG are<br />
examining the ERAM tracker from the accuracy and performance standpoints. However,<br />
as occurred on the Standard Terminal Automation Replacement System (STARS)<br />
deployment, changes in tracker algorithms, if obvious to controllers, can affect<br />
controllers’ acceptance of and trust in the new system. Identification of situations where<br />
16
controllers might notice differences in ERAM due to its tracker algorithm should be<br />
identified early and included in ERAM testing and training.<br />
• ERAM will contain a new approach toward system redundancy and backup. This change<br />
is not targeted at the UI but may affect how controllers respond to equipment outages.<br />
5.4 Usage Characteristics<br />
Once a suitable list of frequent and critical commands has been compiled, we may conduct<br />
detailed analyses to determine usage characteristics for each. Usage characteristics include some<br />
of the sample analyses reported here but also examine each command at a very detailed level.<br />
The usage characteristics assessment for each command will include the following details:<br />
a. Proportion of Data <strong>En</strong>try Method (keyboard, trackball, flyout menu, URET, etc.);<br />
b. Time to complete the command;<br />
c. Number of keystrokes or mouse clicks required;<br />
d. Error rate and common categories of data entry errors for the command and<br />
e. Time spent looking at the keyboard, trackball, keypad, or screen while entering the<br />
command.<br />
We will base the usage characteristic assessment on data already collected from ZDC and other<br />
ARTCCs. The analysis will also include observations and measurements made in the I 2 F for<br />
critical commands that are not found in the day-in-the-life recordings.<br />
5.5 Additional Facilities<br />
All the analyses reported here are based on data recorded at ZDC. Though these data represent<br />
the largest analysis of this type ever attempted, ZDC is not representative of all ARTCCs in<br />
terms of its traffic, procedures, equipment, or work practices. In particular, other ARTCCs have<br />
received significant new equipment such as <strong>Traffic</strong> Management Advisor (TMA). A more<br />
definitive analysis of usage of the legacy system should account for some observed interfacility<br />
differences.<br />
Data for seven adjacent ARTCCs were collected at the same time as the ZDC data and could be<br />
used for validation or to further generalize the results reported here. Examination of ARTCCs<br />
where TMA or other tools have been deployed may be informative regarding the effects on<br />
controller interactions. Possible explanations of observed interfacility differences could be<br />
differences in traffic pattern, traffic volume, unusual events such as emergencies or equipment<br />
outages, airspace size and design, and local procedures and practices.<br />
5.6 Baseline Simulation Test Plan<br />
The best method for directly comparing controller usage of the legacy system and ERAM is to<br />
conduct a baseline simulation on both platforms. In the baseline simulations, controllers will be<br />
presented with selected traffic situations and asked to respond. <strong>Control</strong>lers will respond to the<br />
same situations using both systems. The same metrics will be calculated for both systems and<br />
direct comparisons can be made with a minimum of confounding variables. Discussion of the<br />
baseline methodology can be found in the <strong>Air</strong> <strong>Traffic</strong> <strong>Control</strong> Baseline Methodology Guide<br />
(Allendoerfer & Galushka, 1999) and the reports of baseline simulations conducted for the PVD<br />
(Galushka et al., 1995) and the DSR (Allendoerfer, Galushka, & Mogford, 2000).<br />
17
If the changes in ERAM result in changes in how controllers interact with the system, these<br />
differences should appear in the baseline metrics. For example, if the ERAM macro capability is<br />
beneficial to controllers’ data entry workload, the benefits should appear as reductions in the<br />
number of entries, error rate, or time to complete. Alternately, the ERAM capabilities could shift<br />
controllers’ preferred method for completing certain entries from the keyboard to the trackball,<br />
which would appear as differences in interaction method.<br />
If changes in ERAM result in changes in other aspects of controllers’ tasks, such as operational<br />
efficiency, these differences should appear in other baseline metrics. These metrics include<br />
measures of air traffic safety, efficiency, and workload (Allendoerfer & Galushka, 1999). For<br />
example, if an ERAM change reduces controller data entry workload which, in turn, results in<br />
controllers being able to handle more traffic, baseline metrics such as the number of aircraft<br />
handled per hour or the average time in the airspace may show improvements.<br />
In preparation for the baseline simulations, we could write a test plan that outlines the situations<br />
to be simulated, metrics that will be captured, and other methodological details. The descriptions<br />
of the simulated situations will outline requirements for traffic volume and characteristics (e.g.,<br />
number of aircraft, number of intersecting trajectories) and events (e.g., emergencies, outages)<br />
that will occur in several scenarios. The simulated situations will allow controllers to exercise all<br />
selected commands and will be designed to elicit latent effects of other ERAM changes, if any.<br />
We will develop and shakedown the scenarios as part of preparations for the simulations.<br />
18
References<br />
Allendoerfer, K. R., & Galushka, J. (1999). <strong>Air</strong> traffic control baseline methodology guide,<br />
(DOT/<strong>FAA</strong>/CT-TN99/15). Atlantic City International <strong>Air</strong>port, NJ: Federal Aviation<br />
Administration, William J. Hughes Technical Center.<br />
Allendoerfer, K. R., Galushka, J., & Mogford, R. H. (2000). Display System Replacement<br />
Baseline Research Report (DOT/<strong>FAA</strong>/CT-TN00/31). Atlantic City International <strong>Air</strong>port, NJ:<br />
Federal Aviation Administration, William J. Hughes Technical Center.<br />
Federal Aviation Administration. (2002). Blueprint for NAS Modernization 2002 Update.<br />
Retrieved November 2005, from<br />
http://www.faa.gov/nasarchitecture/blueprnt/2002Update/PDF/2002Update_complete.pdf<br />
Federal Aviation Administration. (2003, October). Test and evaluation master plan (TEMP) for<br />
<strong>En</strong> Route Automation Modernization. Atlantic City International <strong>Air</strong>port, NJ: Author.<br />
Federal Aviation Administration. (2004a). National <strong>Air</strong>space System <strong>En</strong> Route Configuration<br />
Management Document: Computer Program Functional Specifications - Message <strong>En</strong>try and<br />
Checking (NAS−MD−311). Atlantic City International <strong>Air</strong>port, NJ: Author.<br />
Federal Aviation Administration. (2004b). Progress report of the Automation Metrics Test<br />
Working Group (AMTWG). Atlantic City International <strong>Air</strong>port, NJ: Author.<br />
Federal Aviation Administration. (2005, June). <strong>En</strong> Route Automation Modernization Automation<br />
metrics and preliminary test implementation plan, version 2.7. Atlantic City International<br />
<strong>Air</strong>port, NJ: Author.<br />
Galushka, J., Frederick, J., Mogford, R., & Krois, P. (1995). Plan View Display baseline report<br />
(DOT/<strong>FAA</strong>/CT-TN95/45). Atlantic City International <strong>Air</strong>port, NJ: Federal Aviation<br />
Administration, William J. Hughes Technical Center.<br />
19
Acronyms<br />
Note: The two-letter identifiers for Host Computer System commands (e.g., QQ) are not<br />
included in this list and can be found in the NAS-MD-311 (<strong>FAA</strong>, 2004a).<br />
AMTWG Automation Metrics Test Working Group<br />
ARTCC <strong>Air</strong> Route <strong>Traffic</strong> <strong>Control</strong> Center<br />
ATC <strong>Air</strong> <strong>Traffic</strong> <strong>Control</strong><br />
CID Computer Identifier<br />
COI Critical Operational Issues<br />
CPT Conflict Probe Tool<br />
DC Display <strong>Control</strong>s<br />
DS Display System<br />
DSR Display System Replacement<br />
ERAM <strong>En</strong> <strong>route</strong> Automation Modernization<br />
<strong>FAA</strong> Federal Aviation Administration<br />
FDP Flight Data Processing<br />
FLID Flight Identifier<br />
FP Flight Plan<br />
HCS Host Computer System<br />
I 2 F Integration and Interoperability Facility<br />
KSD Keypad Selection Device<br />
NAS National <strong>Air</strong>space System<br />
PVD Plan View Display<br />
SAR System Analysis Recording<br />
SD Situation Display<br />
SDP Surveillance Data Processing<br />
SWAC System Wide Analysis Capability<br />
TMA <strong>Traffic</strong> Manager Advisor<br />
UI User Interface<br />
URET User Request Evaluation Tool<br />
VBA Visual Basic for Applications<br />
ZDC Washington ARTCC<br />
21
Appendix A<br />
Frequency of Use of HCS/DSR/URET Functions
Table A-1. Frequency of Use of HCS/DSR/URET Functions<br />
Type <strong>En</strong>tries Overall % Cumulative %<br />
1. Offset Datablock<br />
Implied <strong>Air</strong>craft Selection<br />
39355 19.8% 19.8%<br />
2. (Accept Handoff/Force<br />
Datablock)<br />
32642 16.4% 36.3%<br />
3. Initiate Handoff 15017 7.6% 43.8%<br />
4. Assign Interim Altitude 10871 5.5% 49.3%<br />
5. Adjust Vector Line 9491 4.8% 54.1%<br />
6. Route Display 7279 3.7% 57.8%<br />
7. Delete <strong>Air</strong>craft 6965 3.5% 61.3%<br />
Toggle Bookkeeping<br />
8.<br />
Checkmark<br />
6700 3.4% 64.7%<br />
9. Quicklook 5673 2.9% 67.5%<br />
10. Flight Plan Readout Request 5637 2.8% 70.3%<br />
11. Cleanup Display or List 4530 2.3% 72.6%<br />
12. Show or Hide<br />
View/Window/Toolbar/Area 4479<br />
2.3% 74.9%<br />
13. Display/Inhibit Halo 3857 1.9% 76.8%<br />
14. Adjust Range 3490 1.8% 78.6%<br />
15. Request/Suppress Datablock 3283 1.7% 80.2%<br />
16. Remove Interim Altitude 2927 1.5% 81.7%<br />
17. Assigned Altitude 2843 1.4% 83.2%<br />
Full Datablock speed, heading,<br />
18.<br />
or free form text amendment<br />
2793 1.4% 84.6%<br />
19. Point Out 2781 1.4% 86.0%<br />
20. Undetermined (typically errors) 2 2624 1.3% 87.3%<br />
21. Cursor Home 2430 1.2% 88.5%<br />
22. AM Amendment 2195 1.1% 89.6%<br />
23. Combined Toggle Filter 1880 0.9% 90.6%<br />
24. Adjust Console Attribute 1644 0.8% 91.4%<br />
Toggle <strong>Air</strong>craft from Special<br />
25.<br />
Attention Area<br />
1369 0.7% 92.1%<br />
26. Toggle Special Coding 1310 0.7% 92.7%<br />
27. Continuous Range Readout 1226 0.6% 93.4%<br />
28. Adjust Background Color 1153 0.6% 93.9%<br />
29. Set Background Color 1061 0.5% 94.5%<br />
30. Track Re<strong>route</strong> 985 0.5% 95.0%<br />
2 Undetermined entries are those that did not correspond cleanly to an entry type. In almost all cases, undetermined<br />
entries are syntax errors rejected by the HCS as “UNIDENTIFD ACTN.”<br />
A-1
Table A-1. Frequency of Use of HCS/DSR/URET Functions (continued)<br />
Type <strong>En</strong>tries Overall % Cumulative %<br />
Suppress/Request Conflict Alert<br />
31.<br />
Pair<br />
780 0.4% 95.4%<br />
32. Sign In 706 0.4% 95.7%<br />
Range Bearing Readout (Two<br />
33.<br />
points)<br />
568 0.3% 96.0%<br />
34. Toggle Opaque/Transparent 489 0.2% 96.2%<br />
35. Show Flight Data Readout 391 0.2% 96.4%<br />
36. Adjust Number of Flight Plans 334 0.2% 96.6%<br />
37. Acknowledge Point Out 324 0.2% 96.8%<br />
38. Adjust Font Size 317 0.2% 96.9%<br />
39. Sort List 308 0.2% 97.1%<br />
40. Toggle Posting Mode 299 0.2% 97.2%<br />
41. Adjust Altitude Setting 281 0.1% 97.4%<br />
42. Toggle Color 266 0.1% 97.5%<br />
43. Initiate Track 260 0.1% 97.6%<br />
Range/Bearing/Fix Readout (fix<br />
44.<br />
& point)<br />
226 0.1% 97.8%<br />
45. Show All Alerts 226 0.1% 97.9%<br />
46. Delete Annotation 167 0.1% 98.0%<br />
47. Save Preference Set 167 0.1% 98.0%<br />
48. Delete All Flight Plans 165 0.1% 98.1%<br />
49. Reposition List 155 0.1% 98.2%<br />
50. Adjust View Frame 153 0.1% 98.3%<br />
51. Adjust Annotation 142 0.1% 98.4%<br />
52. Edit Flight Data 127 0.1% 98.4%<br />
53. Suppress View 119 0.1% 98.5%<br />
54. Show Alert Type 118 0.1% 98.5%<br />
55. Altimeter Request 112 0.1% 98.6%<br />
56. Drop Track Only 111 0.1% 98.6%<br />
57. Create Trial Plan 109 0.1% 98.7%<br />
58. Weather Request 104 0.1% 98.8%<br />
59. Delete Flight Plan 102 0.1% 98.8%<br />
60. Toggle Multi/single Line 102 0.1% 98.9%<br />
61. Remove Point Out 91 < 0.1% 98.9%<br />
62. Request Flight Plan Transfer 91 < 0.1% 99.0%<br />
63. Display <strong>Air</strong>craft <strong>En</strong>try 90 < 0.1% 99.0%<br />
64. Create Annotation 85 < 0.1% 99.0%<br />
65. Map Request 79 < 0.1% 99.1%<br />
66. Add Annotation 76 < 0.1% 99.1%<br />
67. Display Sign In Data 76 < 0.1% 99.2%<br />
68. Adjust Group Color 73 < 0.1% 99.2%<br />
69. Remove Strip 69 < 0.1% 99.2%<br />
A-2
Table A-1. Frequency of Use of HCS/DSR/URET Functions (continued)<br />
Type <strong>En</strong>tries Overall % Cumulative %<br />
70. Show Sector Alerts 69 < 0.1% 99.3%<br />
71. Reported Altitude 63 < 0.1% 99.3%<br />
72. Show FreeForm Text Area 63 < 0.1% 99.3%<br />
73. Delete Flight or Group 62 < 0.1% 99.4%<br />
74. Adjust Time Delta 61 < 0.1% 99.4%<br />
75. Confirmation of QX/RS 57 < 0.1% 99.4%<br />
76. Modify Altitude Limits 57 < 0.1% 99.4%<br />
77. Emergency <strong>Air</strong>port Display 54 < 0.1% 99.5%<br />
78. Adjust Map Center 52 < 0.1% 99.5%<br />
79. Suppress FreeForm Text 48 < 0.1% 99.5%<br />
80. Add FreeForm Text 46 < 0.1% 99.5%<br />
81. Toggle Datablock Field 46 < 0.1% 99.6%<br />
Departure Message (activate<br />
82. 45 < 0.1% 99.6%<br />
departure flight plan)<br />
83. Show Trial Plan 45 < 0.1% 99.6%<br />
84. Invoke Preference Set 44 < 0.1% 99.6%<br />
85. Resector 42 < 0.1% 99.7%<br />
86. Click on Delete Annotation 40 < 0.1% 99.7%<br />
87. Send Trial Plan Amendment 40 < 0.1% 99.7%<br />
88. Show Previous Route 40 < 0.1% 99.7%<br />
89.<br />
Initiate Heading or Speed<br />
39 < 0.1% 99.7%<br />
Amendment<br />
90. Code Insert/Delete 37 < 0.1% 99.8%<br />
91. Sign Out 3 37 < 0.1% 99.8%<br />
92. Combined FP Flight Plan 36 < 0.1% 99.8%<br />
93. Move View or Window 29 < 0.1% 99.8%<br />
94. Code Modification 24 < 0.1% 99.8%<br />
95. Move Annotation 24 < 0.1% 99.8%<br />
96. Delete Trial Plan 21 < 0.1% 99.8%<br />
97. Delete FreeForm Text 18 < 0.1% 99.9%<br />
98. Edit Range Toggle Value 18 < 0.1% 99.9%<br />
99. VFR Abbreviated Flight Plan 16 < 0.1% 99.9%<br />
100. Adjust <strong>Air</strong>space Status 15 < 0.1% 99.9%<br />
101. Strip Request 15 < 0.1% 99.9%<br />
102. Discrete Code Request 14 < 0.1% 99.9%<br />
3 When a controller relieves another controller, the second controller signs on to the position. This automatically<br />
signs the first controller out. The manual sign out command normally is only used when the position is being shut<br />
down for the day and its airspace has been consolidated with another sector.<br />
A-3
Table A-1. Frequency of Use of HCS/DSR/URET Functions (continued)<br />
Type <strong>En</strong>tries Overall % Cumulative %<br />
103. Qualifier Modification 14 < 0.1% 99.9%<br />
Show Unsuccessful<br />
104.<br />
Transmission Message<br />
14 < 0.1% 99.9%<br />
105. Toggle Remarks 14 < 0.1% 99.9%<br />
106. Adjust History 13 < 0.1% 99.9%<br />
Combo DB Offset & Initiate<br />
107.<br />
Handoff<br />
12 < 0.1% 99.9%<br />
108. Display/Delete TMU FDBs 12 < 0.1% 99.9%<br />
109. Hold 12 < 0.1% 99.9%<br />
110. Toggle Route 12 < 0.1% 99.9%<br />
111. Automatic Handoff 11 < 0.1% 99.9%<br />
112. Cancel Slider Mode 10 < 0.1% > 99.9%<br />
113. Suppress Data Blocks 10 < 0.1% > 99.9%<br />
114. Update Range Toggle Value 10 < 0.1% > 99.9%<br />
115. Find Flight 9 < 0.1% > 99.9%<br />
116. <strong>Traffic</strong> Count Adjustment 9 < 0.1% > 99.9%<br />
117. Compose Adjust Target Limits 6 < 0.1% > 99.9%<br />
118. Keep <strong>Air</strong>craft in List 6 < 0.1% > 99.9%<br />
119. Request Route Conversion 6 < 0.1% > 99.9%<br />
120. Show FreeForm Text 6 < 0.1% > 99.9%<br />
121. Group Suppression 5 < 0.1% > 99.9%<br />
122. Adjust Leader Line 4 < 0.1% > 99.9%<br />
123. Coast Track 4 < 0.1% > 99.9%<br />
124. Compose Adjust LDB Limits 3 < 0.1% > 99.9%<br />
125. Radar Sort Box Readout 3 < 0.1% > 99.9%<br />
126. Adjust WX Setting 2 < 0.1% > 99.9%<br />
127. Delete Preference Set 2 < 0.1% > 99.9%<br />
128. Departure Message 2 < 0.1% > 99.9%<br />
129. Test Device 2 < 0.1% > 99.9%<br />
130. Instrument Approach Count 1 < 0.1% > 99.9%<br />
131. Resequence Request 1 < 0.1% > 99.9%<br />
132. Stereo Flight Plan 1 < 0.1% > 99.9%<br />
133. Toggle Filtering 1 < 0.1% > 99.9%<br />
134. Weather Input 1 < 0.1% > 99.9%<br />
Total 198483 100%<br />
A-4