World maps of climatological net primary production of biomass ...
World maps of climatological net primary production of biomass ...
World maps of climatological net primary production of biomass ...

Create successful ePaper yourself
Turn your PDF publications into a flip-book with our unique Google optimized e-Paper software.
<strong>World</strong> <strong>maps</strong> <strong>of</strong> <strong>climatological</strong> <strong>net</strong> <strong>primary</strong> <strong>production</strong> <strong>of</strong> <strong>biomass</strong>,<br />
NPP<br />
Jürgen Grieser, René Gommes, Stephen C<strong>of</strong>ield and Michele Bernardi<br />
Introduction<br />
The Agromet Group, SDRN<br />
FAO <strong>of</strong> the UN, Viale delle Terme di Caracalla, 00100 Rome, Italy<br />
Contact: Agromet@fao.org or juergen.grieser@rms.com<br />
August 2006<br />
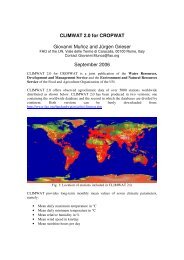
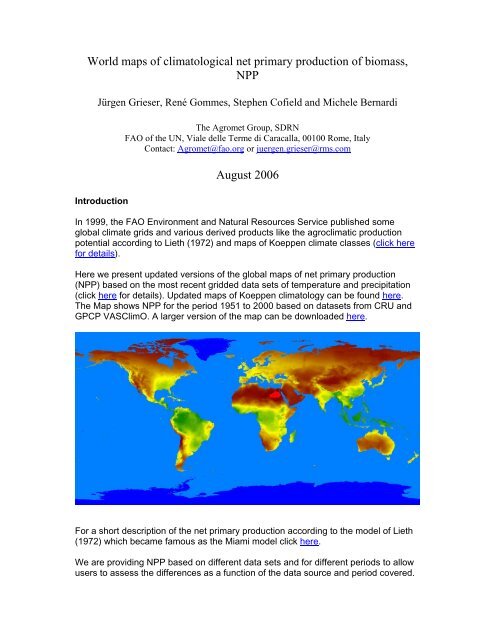
In 1999, the FAO Environment and Natural Resources Service published some<br />
global climate grids and various derived products like the agroclimatic <strong>production</strong><br />
potential according to Lieth (1972) and <strong>maps</strong> <strong>of</strong> Koeppen climate classes (click here<br />
for details).<br />
Here we present updated versions <strong>of</strong> the global <strong>maps</strong> <strong>of</strong> <strong>net</strong> <strong>primary</strong> <strong>production</strong><br />
(NPP) based on the most recent gridded data sets <strong>of</strong> temperature and precipitation<br />
(click here for details). Updated <strong>maps</strong> <strong>of</strong> Koeppen climatology can be found here.<br />
The Map shows NPP for the period 1951 to 2000 based on datasets from CRU and<br />
GPCP VASClimO. A larger version <strong>of</strong> the map can be downloaded here.<br />
For a short description <strong>of</strong> the <strong>net</strong> <strong>primary</strong> <strong>production</strong> according to the model <strong>of</strong> Lieth<br />
(1972) which became famous as the Miami model click here.<br />
We are providing NPP based on different data sets and for different periods to allow<br />
users to assess the differences as a function <strong>of</strong> the data source and period covered.
As an example, a map <strong>of</strong> differences in mean NPP between 1951-1975 and 1976-<br />
2000 is shown.<br />
Downloads<br />
We are providing all data as tables <strong>of</strong> comma separated values for a .5°x.5° grid with<br />
seven columns containing gridpoint number, longitude in .01 degrees, latitude in .01<br />
degrees, land fraction <strong>of</strong> the grid cell in %, NPP, NPP if precipitation were limiting<br />
(NPP P ), NPP if temperature were limiting (NPP T ).<br />
Comma separated value (csv)<br />
All<br />
1951 - 2000<br />
Norm<br />
1961 - 1990<br />
Early<br />
1951 - 1975<br />
Late<br />
1976 - 2000<br />
CRU csv (1Mb) csv (1Mb) csv (1Mb) csv (1Mb)<br />
GPCP Full csv (1Mb) csv (1Mb) csv (1Mb) csv (1Mb)<br />
GPCP VASClimO csv (1Mb) csv (1Mb) csv (1Mb) csv (1Mb)
The following high resolution <strong>maps</strong> <strong>of</strong> NPP (5’x5’) are available as georeferenced<br />
IDA/Windisp grids only. Colour tables for the IDA images are here.<br />
Georeferenced Data<br />
All<br />
1951 - 2000<br />
Norm<br />
1961 - 1990<br />
Early<br />
1951 - 1975<br />
Late<br />
1976 - 2000<br />
CRU IDA IDA IDA IDA<br />
GPCP Full IDA IDA IDA IDA<br />
GPCP VASClimO IDA IDA IDA IDA<br />
A map <strong>of</strong> the limiting factor (precipitation or temperature) is provided here as IDA<br />
image and bitmap. It is based on the CRU and VASClimO datasets.<br />
Differences between the 1951-1975 and 1976-2000 period<br />
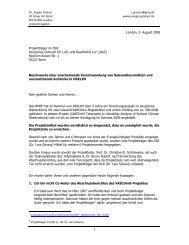
Between the two periods pronounced differences in climatic npp appear in some<br />
regions <strong>of</strong> the world. The following graph shows the latitudinal dependence <strong>of</strong> these<br />
differences. It demonstrates that npp would have increased for most latitudes if<br />
temperature were the limiting factor. However, especially between 0 and 20° North<br />
the npp decreased because <strong>of</strong> its precipitation dependency.<br />
Difference in Climatic <strong>net</strong> <strong>primary</strong> <strong>production</strong> according to Miami model<br />
between the period 1951-1975 and 1976-2000<br />
Difference in npp (1976-2000)-(1951-1975)<br />
80<br />
60<br />
40<br />
20<br />
0<br />
-20<br />
-40<br />
-60<br />
-80<br />
-100<br />
-120<br />
Miami Model<br />
Temperature limited<br />
Precipitation limited<br />
-80 -60 -40 -20 0 20 40 60 80<br />
Latitude in Degrees
The latitudinal pr<strong>of</strong>iles are available for all datasets as comma separated values. The<br />
files consist <strong>of</strong> 6 columns each, containing latitude belt number, latitude in degrees,<br />
land area <strong>of</strong> the .5°-latitude belt in 1000 km2, average npp <strong>of</strong> the latitude belt, npp if it<br />
were temperature limited, npp if it were precipitation limited.<br />
npp latitude pr<strong>of</strong>ile as csv, all<br />
All<br />
1951 - 2000<br />
Norm<br />
1961 - 1990<br />
Early<br />
1951 - 1975<br />
Late<br />
1976 - 2000<br />
CRU csv csv csv csv<br />
GPCP Full csv csv csv csv<br />
GPCP<br />
VASClimO<br />
csv csv csv csv<br />
High resolution images <strong>of</strong> the differences in npp between 1951-1975 and 1976-2000<br />
are provided for the CRU/VASClimO dataset as IDA image and bitmap.<br />
Climatic Sensitivity <strong>of</strong> NPP<br />
According to the Miami model the sensitivity <strong>of</strong> NPP with respect to changes in<br />
annual mean temperature dNPP/dT and annual mean precipitation dNPP/dP can be<br />
calculated for each location on earth. Since for each location NPP is either<br />
temperature limited or precipitation limited only one <strong>of</strong> the sensitivities differ from<br />
zero.<br />
Sensitivity <strong>of</strong> <strong>net</strong> <strong>primary</strong> <strong>production</strong> NPP in g(dry matter)/m 2 /year with respect to<br />
changes in annual mean precipitation in mm/year. Red areas are not sensitive to<br />
precipitation changes given the current temperatures. Download this bmp (enlarged)<br />
or IDA image.
Sensitivity <strong>of</strong> <strong>net</strong> <strong>primary</strong> <strong>production</strong> NPP in g(dry matter)/m 2 /year with respect to<br />
changes in annual mean temperature in °C. Light blue areas are not sensitive to<br />
temperature changes given the current precipitation. Download this bmp (enlarged)<br />
or IDA image.<br />
Download this file as pdf.<br />
Literature<br />
Lieth, H., 1972. "Modelling the <strong>primary</strong> productivity <strong>of</strong> the earth. Nature and resources", UNESCO, VIII,<br />
2:5-10.