CLIMWAT 2.0 for CROPWAT Giovanni Muñoz and Jürgen Grieser ...
CLIMWAT 2.0 for CROPWAT Giovanni Muñoz and Jürgen Grieser ...
CLIMWAT 2.0 for CROPWAT Giovanni Muñoz and Jürgen Grieser ...
- No tags were found...

You also want an ePaper? Increase the reach of your titles
YUMPU automatically turns print PDFs into web optimized ePapers that Google loves.
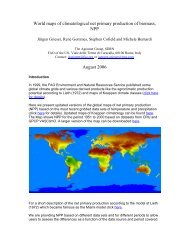
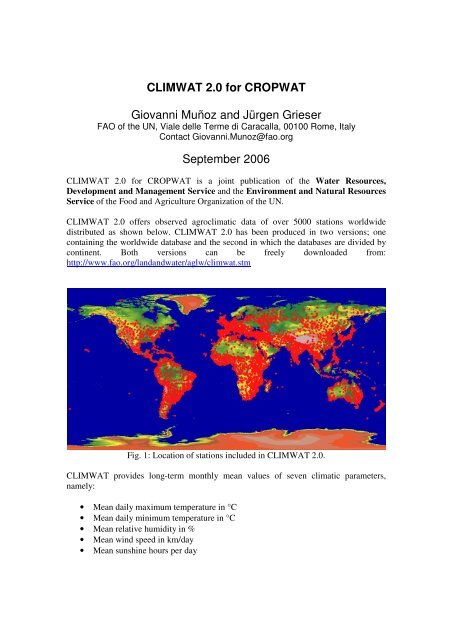
<strong>CLIMWAT</strong> <strong>2.0</strong> <strong>for</strong> <strong>CROPWAT</strong><strong>Giovanni</strong> Muñoz <strong>and</strong> Jürgen <strong>Grieser</strong>FAO of the UN, Viale delle Terme di Caracalla, 00100 Rome, ItalyContact <strong>Giovanni</strong>.Munoz@fao.orgSeptember 2006<strong>CLIMWAT</strong> <strong>2.0</strong> <strong>for</strong> <strong>CROPWAT</strong> is a joint publication of the Water Resources,Development <strong>and</strong> Management Service <strong>and</strong> the Environment <strong>and</strong> Natural ResourcesService of the Food <strong>and</strong> Agriculture Organization of the UN.<strong>CLIMWAT</strong> <strong>2.0</strong> offers observed agroclimatic data of over 5000 stations worldwidedistributed as shown below. <strong>CLIMWAT</strong> <strong>2.0</strong> has been produced in two versions; onecontaining the worldwide database <strong>and</strong> the second in which the databases are divided bycontinent. Both versions can be freely downloaded from:http://www.fao.org/l<strong>and</strong><strong>and</strong>water/aglw/climwat.stmFig. 1: Location of stations included in <strong>CLIMWAT</strong> <strong>2.0</strong>.<strong>CLIMWAT</strong> provides long-term monthly mean values of seven climatic parameters,namely:• Mean daily maximum temperature in °C• Mean daily minimum temperature in °C• Mean relative humidity in %• Mean wind speed in km/day• Mean sunshine hours per day
• Mean solar radiation in MJ/m 2 /day• Monthly rainfall in mm/month• Monthly effective rainfall in mm/month• Reference evapotranspiration calculated with the Penman-Monteith method inmm/day.The data can be extracted <strong>for</strong> a single or multiple stations in the <strong>for</strong>mat suitable <strong>for</strong> theiruse in <strong>CROPWAT</strong> (<strong>for</strong> further in<strong>for</strong>mation on <strong>CROPWAT</strong>, visit(http://www.fao.org/l<strong>and</strong><strong>and</strong>water/aglw/cropwat.stm). Two files are created <strong>for</strong> eachselected station. As an example, these files are presented below in the case of Rome inItaly as displayed by <strong>CROPWAT</strong>. The first file (Rome.cli) contains long-term monthlyrainfall data [mm/month]. Additionally, effective rainfall is also included calculatedthrough the USDA Soil Conservation Service <strong>for</strong>mula. Please refer to the Helpin<strong>for</strong>mation provided by <strong>CROPWAT</strong> <strong>for</strong> in<strong>for</strong>mation on alternative methods <strong>for</strong>calculating effective rainfall.Table 1: <strong>CLIMWAT</strong> rainfall data as displayed by <strong>CROPWAT</strong> 8.0.MONTHLY RAIN DATA(File: C:\Program Files\<strong>CROPWAT</strong>\data\climate\Italy\ROME.cli)Station: ROMEEff. rain method: USDA Soil Conservation Service <strong>for</strong>mula:Peff = (Pdec * (125 - 0.6 * Pdec)) / 125 <strong>for</strong> Pmon 250 mmRain Eff. rainmm mmJanuary 81.0 70.5February 68.0 60.6March 71.0 62.9April 64.0 57.4May 56.0 51.0June 38.0 35.7July 16.0 15.6August 25.0 24.0September 65.0 58.2October 124.0 99.4November 11<strong>2.0</strong> 91.9December 98.0 82.6Total 818.0 709.9As seen in Table 2 below, the second file consists of long-term monthly averages <strong>for</strong>seven climatic parameters, namely maximum temperature, minimum temperature,relative humidity, wind speed, sunshine hours, radiation balance <strong>and</strong> referenceevapotranspiration calculated according to the Penman-Monteith method. This file alsocontains the coordinates <strong>and</strong> altitude of the location.
Table 2. <strong>CLIMWAT</strong> climatic data as displayed by <strong>CROPWAT</strong> 8.0.MONTHLY ETO PENMAN-MONTEITH DATA(File: C:\Program Files\<strong>CROPWAT</strong>\data\climate\Italy\ROME.pen)Country: Location 9864 Station: ROMEAltitude: 17 m. Latitude: 41.90 °N Longitude: 12.48 °EMonthMin Temp Max Temp Humidity Wind Sunshine Radiation ETo°C °C % km/day hours MJ/m²/day mm/dayJanuary 4.5 11.1 77 181 3.4 6.0 0.88February 5.4 12.6 75 164 3.4 7.9 1.17March 7.2 15.2 70 181 4.7 11.9 1.90April 9.8 18.8 69 156 5.9 16.2 2.66May 13.3 23.4 66 147 7.2 19.8 3.63June 17.2 27.6 61 130 7.8 21.4 4.41July 19.6 30.4 56 130 9.7 23.6 5.16August 19.4 29.8 58 130 8.9 20.9 4.63September 16.9 26.3 67 121 7.2 15.9 3.25October 12.8 21.5 73 147 5.3 10.6 <strong>2.0</strong>3November 9.3 16.1 77 156 3.2 6.3 1.18December 6.4 12.6 78 164 2.6 4.9 0.86Average 11.8 20.4 69 150 5.8 13.8 2.65All station in<strong>for</strong>mation is drawn from the database of The Agromet Group of FAO(agromet@fao.org).Humidity <strong>and</strong> radiation can be expressed through different variables. With respect tohumidity, data can be provided as relative humidity, dew point temperature or watervapour pressure. These three variables can be uniquely converted into each other if themean temperature is known. However, if humidity is measured <strong>and</strong> provided in morethan one of these variables, the actual numbers would not necessarily be in line. In thiscase one has the freedom to decide which variable to use. We decided to use watervapour pressure as a core variable <strong>and</strong> only where it is not available, use dew pointtemperature <strong>and</strong> relative humidity. However, there is a risk that the provided value ofvapour pressure is higher than the one that is possible to obtain, given the meantemperature. The original databases were crosschecked <strong>for</strong> this possible inconsistency<strong>and</strong> one of the other variables was used in the few cases where it occurred.The same problem arises with radiation. Instead of the solar energy flux at the surfaceoften only sunshine hours or sunshine fraction are provided, which can be converted toradiation. In order to calculate evapotranspiration using the Penman-Monteith method,one needs both radiation <strong>and</strong> sunshine fraction. To keep both these values in agreementwe used the observed radiation as base variable <strong>and</strong> estimated sunshine fraction from it.When only the sunshine fraction (or hours) has been observed we used this to estimateradiation. If both (fraction <strong>and</strong> radiation) are observed radiation is preferred.As a result, the provided relative humidity <strong>and</strong> sunshine hours are often deduced fromobservations of vapour pressure <strong>and</strong> radiation, even if the <strong>for</strong>mer are observed. Theprocedure, however, ensures that the different expressions are in line.
All variables, except potential evapotranspiration, are direct observations or conversionsof observations. Penman-Monteith evapotranspiration is calculated mainly in accordancewith the FAO Irrigation <strong>and</strong> Drainage Paper 56, entitled Crop Evapotranspiration –Guidelines <strong>for</strong> Computing Crop Water Requirements (hereinafter FAO56). However,there are some minor deviations from the FAO56 where more recent knowledge isavailable. This is the case with respect to the estimates of mean monthly water vapourpressure from mean relative humidity <strong>and</strong> temperatures. Whilst the original FAO56suggests using minimum <strong>and</strong> maximum temperatures to estimate the saturation vapourpressure, when only average relative humidity is available, conceptual investigations <strong>and</strong>newer analysis of observations suggest using the mean daily temperature instead yieldsmore accurate results (<strong>for</strong>thcoming new editions will be changed accordingly). There<strong>for</strong>e,instead of using equation (19) of FAO56 we used:RHmeanea= e0( Tmean)100Where e o (T mean ) is calculated using equation (11). Furthermore, instead of equation (23)of FAO56 we used the better approximations of the inverse relative Earth-Sun distance1d r=1−.01673⋅cos 0.017214 ⋅ j −1[ ( ( ))] 2where j is the number of the Julian day of the year.For the solar declination we usedwith= i ⋅ p p = .017214 ⋅ jp i0,0−4∑( Ai⋅ cos( pi) + Bi⋅ ( pi))δ = δ0+cosi=13.1588<strong>and</strong> the coefficients δ 0 =0.39508 <strong>and</strong> the coefficientsA(1) = 22.85684, B(1) = -4.29692,A(2) = -0.38637, B(2) = 0.05702,A(3) = 0.15097, B(3) = -0.09029,A(4) = -0.00961, B(4) = 0.00593.Though these approximations are more precise than the corresponding equations inFAO56 the differences are below 1%.We prepared the dataset <strong>and</strong> the extraction software with great care <strong>and</strong> made every ef<strong>for</strong>tto provide reliable data. However, we cannot ensure that all the observations that wentinto the procedure are free of errors.
Disclaimer:FAO declines all responsibility <strong>for</strong> errors or deficiencies in the database or software or inthe documentation accompanying it, <strong>for</strong> program maintenance <strong>and</strong> upgrading as well as<strong>for</strong> any damage that may arise from them. FAO also declines any responsibility <strong>for</strong>updating the data <strong>and</strong> assumes no responsibility <strong>for</strong> errors <strong>and</strong> omissions in the dataprovided. Users are, however, kindly asked to report any errors or deficiencies in thisproduct to FAO.All rights reserved. Reproduction <strong>and</strong> dissemination of material in this in<strong>for</strong>mationproduct <strong>for</strong> educational or other non-commercial purposes are authorized without anyprior written permission from the copyright holders provided the source is fullyacknowledged. Reproduction of material in this in<strong>for</strong>mation product <strong>for</strong> resale or othercommercial purposes is prohibited without written permission of the copyright holders.Applications <strong>for</strong> such permission should be addressed to the Chief, PublishingManagement Service, In<strong>for</strong>mation Division,FAO Viale delle Terme di Caracalla,00100 Rome, Italyor by e-mail to copyright@fao.org.© FAO 2006