UNHCR REPORT - 2006 - IHDP
UNHCR REPORT - 2006 - IHDP
UNHCR REPORT - 2006 - IHDP

Create successful ePaper yourself
Turn your PDF publications into a flip-book with our unique Google optimized e-Paper software.
Ministry of Resettlement<br />
<strong>REPORT</strong> ON<br />
<strong>2006</strong> WELFARE CENTRE<br />
REVALIDATION<br />
IN<br />
PUTTALAM DISTRICT<br />
DRAFT – NOT FOR CIRCULATION<br />
WORLD BANK
FINAL <strong>REPORT</strong> ON THE <strong>2006</strong> REVALIDATION<br />
OF THE 2004 PUTTALAM WELFARE CENTRE SURVEY<br />
Executive Summary<br />
Background<br />
The <strong>2006</strong> Revalidation of the 2004 Puttalam Welfare Centre (WC) Survey is part of a broader<br />
initiative by <strong>UNHCR</strong> in collaboration with the Ministry of Resettlement and the Ministry of<br />
Nation Building and Development 1 aimed at finding durable solutions for persons who have been<br />
displaced due to the internal armed conflict. This broader initiative will take place in 2 phases as<br />
follows: (i) a revalidation of the information obtained in the 2004 survey of conflict IDPs living<br />
in Puttalam WCs, followed by (ii) a survey of conflict IDPs living in all other WCs nationally.<br />
Previous surveys of conflict IDPs living in WCs have not been updated and do not provide<br />
comprehensive information regarding preferred and achievable durable solutions. Accordingly,<br />
in order to facilitate finding solutions for the remaining displaced people still residing in WCs, the<br />
Ministry of Resettlement and the Ministry of Nation Building and Development, supported by<br />
<strong>UNHCR</strong>, saw the need for up-to-date information on the remaining IDPs.<br />
Puttalam District was selected as the pilot, as it continues to house comparatively the highest<br />
number of IDPs in WCs. Moreover, the World Bank requested a revalidation of the 2004<br />
Puttalam WC Survey in order to assist them in identifying potential beneficiaries for their<br />
proposal to provide permanent housing to IDP families choosing to locally integrate in the<br />
Puttalam District. <strong>UNHCR</strong> saw this as an excellent opportunity to provide durable solutions to<br />
IDPs and hopes that it will set a positive example to other donors and push the agenda forward in<br />
the search for durable solutions for IDPs.<br />
The <strong>2006</strong> survey form was developed after extensive consultation with a number of key agencies<br />
and institutions involved in IDP issues, including the Ministries of Resettlement and Nation<br />
Building and Development, the World Bank, <strong>UNHCR</strong>, and members of the Inter-Agency IDP<br />
Working Group.<br />
Objectives of the Survey<br />
The <strong>2006</strong> Revalidation of the 2004 Puttalam WC Survey had the following objectives:<br />
� To obtain an up-to-date and accurate picture of the IDP population still residing in WCs<br />
to support improved planning for durable solutions;<br />
� To obtain information about the obstacles facing IDPs in achieving their preferred<br />
durable solution; and<br />
� To obtain information regarding the housing, land and property rights of IDPs.<br />
Survey Findings<br />
The revalidation exercise surveyed 15,480 families (63,145 individuals) living in 141 locations in<br />
Puttalam District. This number is slightly higher than that surveyed in 2004 where 14,493<br />
families (61,763 individuals) living in 123 locations were surveyed. The survey population has<br />
been displaced for an average of 16 years, reflecting the fact that the majority of Puttalam IDPs<br />
were displaced due to the expulsion of Muslims from the North-East by the LTTE in October<br />
1990. Depending upon their places of origin, these IDPs were given 2 hours, 48 hours or a week<br />
to leave their homes, communities and livelihoods.<br />
1 Formerly the Ministry of Relief, Rehabilitation and Reconciliation.
While there was initially some concern about the validity of the data given the potential effects of<br />
the proposed World Bank Puttalam housing project, the respondents cooperated with the survey<br />
and an analysis of the results (comparing them to the 2004 results) indicate that the survey results<br />
generally appear to be unaffected. One area where significant change between the 2004 and <strong>2006</strong><br />
results was evident is in respondents’ preferred durable solution – in 2004, 2% wished to return<br />
home immediately, 59% wished to return home in the future and 38% wished to locally integrate,<br />
whereas in <strong>2006</strong>, an overwhelming 96% expressed a preference to locally integrate and 4%<br />
wished to return home. This result may be explained by a number of factors, including: (i) due to<br />
their protracted situation of displacement and the continuing negative security situation in their<br />
places of return, IDPs living in Puttalam WCs are increasingly interested in local integration and<br />
(ii) the World Bank’s proposed Puttalam housing project has encouraged IDPs to state a<br />
preference for local integration.<br />
One of the most striking conclusions that can be drawn from the survey results is the fact that the<br />
majority of Puttalam IDPs have already de facto locally integrated in Puttalam due to the<br />
fact that 74% of the IDPs surveyed claim to have acquired land in Puttalam; 58% reported<br />
that they also possess a house in Puttalam. Of those families who possess land, the majority<br />
reported that they purchased their land, an indication of their intention to integrate in Puttalam by<br />
establishing themselves and purchasing property. Of those who possess land, 75% had documents<br />
to prove their ownership. The survey results therefore indicate that the number of displaced<br />
persons who own land and/or a house in Puttalam is relatively high. Of those wishing to integrate<br />
locally, 75% possess land in Puttalam. Amongst those IDPs wishing to integrate locally in<br />
Puttalam, the main obstacles reported were no access to water, no productive assets (tools), no<br />
government support to assist local integration, no access roads and lack of health and education<br />
facilities. Local integration of the Puttalam WC population will therefore need to be officially<br />
supported through Government assistance to facilitate acquisition of land documentation as well<br />
as development assistance designed to improve physical infrastructure and access to public<br />
services. Without this assistance, sustainable integration will be difficult to achieve.<br />
In contrast to the overwhelming percentage of IDPs who possess land in Puttalam (their place of<br />
displacement), only 42% of the IDPs surveyed currently possess land in their district of origin.<br />
The fact of landlessness in their district of origin is a significant problem for the potential<br />
return of the majority of these IDPs (i.e. 58%) who do not possess land in their place of origin.<br />
Of those wishing to return to their place of origin, only 68% possess land. Even fewer possess<br />
land documentation to prove their land ownership, further complicating their potential return. The<br />
surveyed IDPs indicated that the main obstacles to their return are security concerns, lack of<br />
access roads, lack of government support for their return, lack of productive assets (tools), lack of<br />
health and education facilities and no access to water.<br />
In addition to the fact that many of the IDPs living in Puttalam WCs have de facto locally<br />
integrated, the <strong>2006</strong> survey clearly illustrates one problem common to many IDPs, namely the<br />
lack of land documentation. A commitment by the Government to issue replacement<br />
documentation or to regularize land title would go a long way in assisting IDPs to achieve their<br />
durable solutions, be it return home or local integration. The survey results highlight the need for<br />
mechanisms to deal with land and property registration, regularization of title, property restitution<br />
and dispute settlement.
1. Narrative Report<br />
2. Statistical Report<br />
- Table of Contents -<br />
a. Statistical Summary<br />
b. List of Welfare Centres<br />
c. Demographic Profile<br />
d. Durable Solution<br />
e. Information on Place of Displacement<br />
f. Information on Place of Origin<br />
g. Maps<br />
3. Annex I – Comparison of 2004 and <strong>2006</strong> Survey Results
1. Background<br />
FINAL <strong>REPORT</strong> ON THE <strong>2006</strong> REVALIDATION<br />
OF THE PUTTALAM WELFARE CENTRE SURVEY<br />
DRAFT – Not for Circulation<br />
The <strong>2006</strong> Revalidation of the 2004 Puttalam Welfare Centre (WC) Survey is part of a broader<br />
initiative by <strong>UNHCR</strong> in collaboration with the Ministry of Resettlement and the Ministry of<br />
Nation Building and Development (formerly the Ministry of Relief, Rehabilitation and<br />
Reconciliation) aimed at finding durable solutions for persons who have been displaced due to the<br />
internal armed conflict. This broader initiative will take place in 2 phases as follows: (i) a<br />
revalidation of the information obtained in the 2004 survey of conflict IDPs living in Puttalam<br />
WCs, followed by (ii) a survey of conflict IDPs living in all other WCs nationally.<br />
The Ceasefire Agreement of 2002 brought an end to the hostilities and revitalized the hopes for a<br />
safe and dignified return for the displaced. As a result of these events, the Government of Sri<br />
Lanka, in collaboration with <strong>UNHCR</strong>, conducted an IDP census in 2002 to assist the Government<br />
and other actors in planning for the provision of legal, physical and material protection for<br />
internally displaced persons (IDPs). The census, which was conducted at the household level,<br />
gathered data on the number of IDPs, their places of origin, their present location, whether they<br />
wanted to return to their places of origin, remain and integrate in the area of displacement, or<br />
whether they preferred to relocate to another area. The census also explored the principal<br />
obstacles to return and identified the most vulnerable amongst the IDPs.<br />
While the 2002 survey included an analysis of the preferred solutions to displacement at that<br />
time, in 2004, the Ministry of Relief, Rehabilitation and Reconciliation (MRRR), supported by<br />
<strong>UNHCR</strong> and the World Bank, saw the need for up-to-date information on the remaining IDPs<br />
living in WCs. The Puttalam District was chosen to be the pilot district for the 2004 national<br />
survey due to the fact that the largest number of IDPs living in WCs are located in Puttalam. The<br />
survey was a joint exercise by the MRRR and the Government Agent in Puttalam, with the<br />
support of the Department of Census and Statistics, Branch Office in Puttalam. The World Bank<br />
provided financial assistance through its North East Housing Reconstruction Programme<br />
(NEHRP), while <strong>UNHCR</strong> and FORUT provided technical and administrative support to the<br />
survey. As a result of lack of political support and the tsunami of December 2004, information<br />
was obtained on Puttalam District WCs, but the proposed national survey was never completed.<br />
Since 2002, more than 407,000 IDPs have returned to their places of origin, and many have<br />
relocated to other areas. At present, it is estimated that approximately 68,000 persons (18,000<br />
families) are living in WCs around Sri Lanka. The 2002 national census and the 2004 survey in<br />
Puttalam have not been updated and do not provide comprehensive information regarding<br />
preferred and achievable durable solutions. Accordingly, in order to facilitate finding solutions<br />
for the remaining displaced people still residing in WCs, the Ministry of Resettlement and the<br />
Ministry of Nation Building and Development, supported by <strong>UNHCR</strong> and the World Bank, saw<br />
the need for up-to-date information on the remaining IDPs.<br />
<strong>UNHCR</strong> again elected to use Puttalam District as the pilot, as it continues to house comparatively<br />
the highest number of IDPs in WCs (32,501 individuals living in 81 WCs) 1 . Moreover, the World<br />
1 Please note that these figures are based on the February <strong>2006</strong> Statistical Summary prepared by the<br />
Ministry of Nation Building and Development and <strong>UNHCR</strong>. The statistics of the Ministry of Resettlement<br />
indicate that there are 135 WCs, resettlement villages and relocation villages located in Puttalam District.<br />
Final Report on the <strong>2006</strong> Revalidation of the 2004 Puttalam WC Survey<br />
April <strong>2006</strong><br />
1
DRAFT – Not for Circulation<br />
Bank requested a revalidation of the 2004 Puttalam WC Survey (with additional information) in<br />
order to identify potential beneficiaries for its proposal to provide permanent housing to IDP<br />
families choosing to locally integrate in the Puttalam District. As an extension of its North East<br />
Housing Reconstruction Project (NEHRP), the World Bank plans to provide housing initially to<br />
5,000 IDP families, with the possibility of extending funding to provide housing to additional<br />
families. 2 <strong>UNHCR</strong> saw this as an excellent opportunity to provide durable solutions to IDPs and<br />
hopes that it will set a positive example to other donors and push the agenda forward in the search<br />
for durable solutions for IDPs.<br />
2. Objectives of the Survey<br />
The <strong>2006</strong> Revalidation of the 2004 Puttalam WC Survey had the following objectives:<br />
� To quickly obtain a more up-to-date and accurate picture of the IDP population still<br />
residing in WCs in terms of numbers, demographic profile and IDP-preferred durable<br />
solutions to displacement;<br />
� To obtain information about the obstacles for IDPs to obtain their preferred durable<br />
solution and their alternative preferred durable solutions if their preferred durable<br />
solution is not achievable in the short-to-medium term; and<br />
� To obtain information regarding the housing, land and property rights of IDPs, including<br />
the condition of their housing in their place of displacement and their access to water and<br />
sanitation facilities.<br />
3. Administration of the Survey<br />
a) Methodology<br />
The <strong>2006</strong> survey form was developed after extensive consultation with a number of key agencies<br />
and institutions involved in IDP issues, including the Ministries of Resettlement and Nation<br />
Building and Development, the World Bank, <strong>UNHCR</strong>, and members of the Inter-Agency IDP<br />
Working Group (comprised of UN agencies and international and national NGOs). The<br />
Department of Census & Statistics provided technical and substantive assistance in the design of<br />
the questions and the survey format.<br />
As a result of other pressing priorities, including work on the local government elections, the<br />
Department of Census & Statistics was unable to undertake the enumeration and supervision of<br />
survey as it had done in 2004. As such, the Ministry of Resettlement entered into an agreement<br />
with the Social Indicator Unit of the Centre of Policy Alternatives (CPA) to undertake the<br />
enumeration and the data entry for the revalidation exercise. The Ministry of Resettlement also<br />
entered into an agreement with a public relations company, Phoenix Ogilvy, in order to design<br />
and implement a public relations campaign for the revalidation exercise. The GA Puttalam<br />
provided support and monitored the revalidation exercise. <strong>UNHCR</strong> provided technical support,<br />
monitoring and quality control for the revalidation exercise and conducted the analysis of the data<br />
and prepared the interim report. <strong>UNHCR</strong> will prepare the final Survey Report upon completion of<br />
the revalidation exercise.<br />
2 Depending on the amount allocated, the World Bank has stated that it may be able to provide cash grants<br />
for permanent housing construction for up to 8,800 families.<br />
Final Report on the <strong>2006</strong> Revalidation of the 2004 Puttalam WC Survey<br />
April <strong>2006</strong><br />
2
DRAFT – Not for Circulation<br />
An information campaign was undertaken in order to advise local and IDP populations of the<br />
revalidation exercise. Leaflets in Tamil and Sinhala and posters in Tamil were distributed prior to<br />
the campaign. Two public meetings organized by the Minister of Resettlement, the Honourable<br />
Mr. Bathiyutheen, were held to explain the purpose, timing and methodology of the revalidation<br />
exercise to WC leaders, camp officers and IDPs themselves. <strong>UNHCR</strong> and the GA Puttalam also<br />
participated in these information sessions.<br />
Social Indicator was responsible for the overall enumeration and for the selection of 100<br />
enumerators and 10 supervisors. Supervisors were identified among experienced members of<br />
Social Indicator’s survey team staff. Enumerators were identified among Tamil-speaking<br />
residents of Puttalam, and consisted of both local residents of Puttalam as well as persons who<br />
were IDPs themselves (75% of the enumerators). Approximately 45% of the enumerators were<br />
women.<br />
Joint training was arranged by Social Indicator and <strong>UNHCR</strong>. The supervisors participated in a<br />
full day training session prior to commencing the survey. A two-day training workshop was<br />
arranged for the enumerators, including simulation interviews and an in-depth review of the<br />
survey form and instructions. Enumerators were divided into ten teams under the supervision of<br />
the ten supervisors.<br />
After a one-day test run conducted in two WCs, Saltern 2 and Zahira, on 26 February, the<br />
enumerators were again provided with a one-day training review which included “lessons<br />
learned”. Prior to the commencement of the revalidation exercise, the enumerators were again<br />
divided into two groups of five teams for a supplemental half-day of training. As a result of<br />
concerns expressed by certain WC leaders and the GA Puttalam, the survey was delayed slightly,<br />
but commenced on 9 March.<br />
The enumerators met with each family privately to discuss their situation and learn about their<br />
preferred durable solution. Although there was no legal requirement to participate in the survey,<br />
IDPs in almost all WCs selected for participation in the initial phase of the revalidation exercise<br />
participated voluntarily. Only two WCs in Kalpitiya Division, 90 Acre and 25 Acre, refused to<br />
participate in the survey. The residents of 90 Acre eventually agreed to participate however. Ten<br />
supervisors oversaw the work of the enumerators and checked the accuracy of each form. The<br />
Ministry of Resettlement, <strong>UNHCR</strong> and the GA Puttalam also monitored survey activities in the<br />
field.<br />
After completing the initial round of interviews, the supervisors returned to certain WCs to<br />
conduct a “clean-up” operation and survey those families who had not been present and/or<br />
surveyed during the initial round of interviews. Enumeration was completed on 31 March <strong>2006</strong>.<br />
A total of 15,480 forms were completed, representing 15,480 families of 63,145 individuals from<br />
141 locations.<br />
Final Report on the <strong>2006</strong> Revalidation of the 2004 Puttalam WC Survey<br />
April <strong>2006</strong><br />
3
) Quality of Data<br />
DRAFT – Not for Circulation<br />
During <strong>UNHCR</strong> and CPA’s first technical review of forms after the pilot exercise, every form<br />
was reviewed by the supervisors. A number of errors were common across enumerators’ forms,<br />
including:<br />
� Failure to provide a distinct answer for “alternative durable solution” Q31 (or failure to<br />
explain why respondent declined to provide distinct answer from “preferred durable<br />
solution” Q26).<br />
� Misunderstanding of how to record priority for Q30 and Q35.<br />
During the second review by <strong>UNHCR</strong>, additional errors were noted. These included:<br />
� Failure to provide a distinct answer for “alternative durable solution” Q31 (or failure to<br />
explain why respondent declined to provide distinct answer from “preferred durable<br />
solution” Q26).<br />
� For those who answered that they possessed land (i.e. Q7 on pg 6 or Q6 on pg 7), failure<br />
to answer a number of compulsory questions such as:<br />
� Joint ownership of land Q7.5 or Q 6.5<br />
� How land acquired Q7.6<br />
� Status of land in place of origin Q6.7<br />
� For those who answered that they did not have valid documents for their land, failure to<br />
provide the reason for which they did not have documents.<br />
c) Quality of Data Entry<br />
Following data entry of each form, data validation was performed by the EDP Executive. As<br />
such, each form was validated after data entry.<br />
4. Timeline of the Survey Exercise<br />
The revalidation exercise followed the following timeline:<br />
� Tripartite Agreement between Ministry of<br />
Resettlement, World Bank and <strong>UNHCR</strong><br />
� Ministry of Resettlement Approval of Forms<br />
(English, Sinhala, Tamil)<br />
� Ministry of Resettlement Approval of Leaflets and<br />
Posters (Tamil and Sinhala)<br />
Draft circulated<br />
8 February <strong>2006</strong><br />
15 February <strong>2006</strong><br />
� Agreement signed with Social Indicator 13 February <strong>2006</strong><br />
(effective as of 1 February)<br />
� Agreement signed with Phoenix Ogilvy 24 February <strong>2006</strong><br />
(effective as of 1 February)<br />
� Public Meetings in Puttalam with mosque committee<br />
members, WC leaders and camp officers organized<br />
13 February <strong>2006</strong> &<br />
28 February <strong>2006</strong><br />
Final Report on the <strong>2006</strong> Revalidation of the 2004 Puttalam WC Survey<br />
April <strong>2006</strong><br />
4
y the Minister of Resettlement with the<br />
participation of the GA Puttalam and <strong>UNHCR</strong><br />
� Beginning of Public Information Campaign<br />
� Training of Supervisors<br />
� Training of Enumerators<br />
� Test Survey in 2 WCs (Saltern 2 and Zahira)<br />
� Survey<br />
� Data Entry<br />
� Data Analysis<br />
� Interim Report by <strong>UNHCR</strong><br />
� Final Report by <strong>UNHCR</strong> May 2<br />
5. Survey Findings<br />
DRAFT – Not for Circulation<br />
28 February <strong>2006</strong><br />
22 February <strong>2006</strong><br />
24-25 February <strong>2006</strong><br />
27 February <strong>2006</strong><br />
7 & 8 March <strong>2006</strong><br />
26 February <strong>2006</strong><br />
March 9 – March 31<br />
March 12 – April 7<br />
March 13-April 23<br />
March 15 (oral)<br />
March 20 (written)<br />
The administration of the <strong>2006</strong> Revalidation of the 2004 Puttalam WC Survey in Puttalam was<br />
satisfactory. The findings of this survey should, however, be seen as indicative rather than as<br />
providing exact figures, since several of the questions contain individual IDPs’ own<br />
understanding of the questions and self-reflective impressions.<br />
While there was initially some concern about the validity of the data given (i) concerns expressed<br />
by the IDPs themselves about the use of the survey information, particularly the preferred durable<br />
solution questions and the use of the term “IDP” as opposed to “evictee” 3 and (ii) reports from<br />
enumerators that mosque committee members had instructed WC residents to answer certain<br />
questions in a particular manner, the survey respondents were cooperative with all parts of the<br />
survey and an initial analysis of the results (comparing them to the 2004 results) indicate that the<br />
survey results generally appear to be unaffected by such influence. 4<br />
The one area where significant changes are evident is in respondents’ preferred durable solution –<br />
in 2004, 2% wished to return home immediately, 59% wished to return home in the future and<br />
38% wished to locally integrate. In <strong>2006</strong>, an overwhelming 96% expressed a preference to<br />
3 At a meeting between welfare centre leaders, camp officers, the Minister of Resettlement, Ministry staff,<br />
the GA Puttalam and <strong>UNHCR</strong>, a number of welfare centre leaders requested that the revalidation<br />
questionnaire reflect the fact that they had been forcibly evicted from their homes by the LTTE in October<br />
1990. It was explained to those attending the meeting that the reasons for their displacement would be<br />
mentioned in the survey report.<br />
4 For a chart-based comparison of the 2004 and <strong>2006</strong> survey results, please see Annex 1.<br />
Final Report on the <strong>2006</strong> Revalidation of the 2004 Puttalam WC Survey<br />
April <strong>2006</strong><br />
5
DRAFT – Not for Circulation<br />
locally integrate whereas 4% wished to return home. This result may be explained by a<br />
number of factors, including: (i) due to their protracted situation of displacement (i.e. 16 years)<br />
and the ongoing negative security situation in their places of origin, IDPs living in Puttalam WCs<br />
are increasingly interested in the local integration option given the fact that return to their places<br />
of origin may appear unfeasible in the short to medium term and (ii) the World Bank’s proposed<br />
Puttalam housing project offers IDPs living in Puttalam WCs the option of receiving funds to<br />
construct permanent homes and has encouraged IDPs to state a preference for local integration (in<br />
this context, it is important to note that there have been comparatively few development or<br />
relocation projects targeting Puttalam IDPs).<br />
Another significant finding from the survey results is the fact that the majority of Puttalam<br />
IDPs have already de facto locally integrated in Puttalam due to the fact that 74% of the<br />
IDPs surveyed claim to have acquired land in Puttalam. As discussed in further detail below,<br />
of those families who possess land, the majority reported that they purchased their land, an<br />
indication of their intention to integrate in Puttalam by establishing themselves and purchasing<br />
property. In contrast to the overwhelming percentage of IDPs who possess land in Puttalam (their<br />
place of displacement), only 42% of the IDPs surveyed currently possess land in their district of<br />
origin. The fact of landlessness in their district of origin will therefore likely be a significant<br />
obstacle to the return of the majority of these IDPs.<br />
a) General Data on Sample Population<br />
This report provides information on 15,480 families (63,145 individuals) living in 141 locations<br />
in Puttalam District. This number is slightly higher than that surveyed in 2004 where 14,493<br />
families (61,763 individuals) living in 123 locations were surveyed.<br />
As in 2004, the gender distribution of the surveyed population is roughly equal (49.7% women<br />
and 50.3% men). The majority of the population (approximately 54% of the population) are<br />
adults between the ages of 18 and 59. However, as in 2004, it is important to note the high<br />
percentage of children under the age of 18 (41%). The average family consists of 4.1 persons.<br />
The survey population has been displaced for an average of 16 years, reflecting the fact that the<br />
residents of the WCs in Puttalam District were displaced largely due to the expulsion of Muslims<br />
from the North-East by the LTTE in October 1990. Depending upon their places of origin, these<br />
IDPs were given between 2 and 48 hours to leave their homes, communities and livelihoods.<br />
Many of the approximately 75,000 Muslims forcibly displaced from 5 districts in the North-East<br />
lost not only dowry property and other possessions, but personal identity documentation and land<br />
deeds as well.<br />
The majority of the IDP population originate from Mannar (72%). Some 14% come from Jaffna,<br />
10% from Mullaitivu and 3% from Kilinochchi. There were also families from Vavuniya, Batti,<br />
Ampara, Trinco, Polonnaruwa and Puttalam.<br />
As in 2004, almost all (99%) of those IDPs surveyed indicated that they were Muslims by<br />
ethnicity. A number of Sinhalese and Tamil families are also displaced in Puttalam District, but<br />
this percentage is just above 1% in total.<br />
Approximately 61% or 21,218 of the adults (i.e. those over 18 years of age) surveyed reported<br />
that they are currently not employed. This is similar to the results of the 2004 survey, where some<br />
64% of the surveyed population indicated that they were not employed. Approximately 13,500<br />
Final Report on the <strong>2006</strong> Revalidation of the 2004 Puttalam WC Survey<br />
April <strong>2006</strong><br />
6
DRAFT – Not for Circulation<br />
(39%) indicated that they were engaged in paid employment, were self-employed or were owneremployers.<br />
Of those who were engaged in some form of employment, the majority were engaged<br />
either in manufacturing, fishing or agriculture. A very small proportion (less than 1%) reported<br />
that they had obtained a university degree or higher. Approximately 18% of those surveyed<br />
indicated that they had no schooling, 23% reported having completed grades 1-5, 37% grades 6-<br />
10, 14% O/L and 8% had completed their A/L.<br />
Of the surveyed population older than 18 years who were registered to vote (31,379 of the 63,145<br />
respondents), only 1,814 persons stated that they were registered to vote in their place of<br />
displacement (i.e. Puttalam) whereas the overwhelming majority, 29,565 persons, reported that<br />
they were registered to vote in their place of origin. As noted by the GA Puttalam, the fact that<br />
the overwhelming majority are still registered in their places of origin has significant detrimental<br />
effects on the budgetary allocation for public services and infrastructure. As a result, many of the<br />
communities where the IDPs live are underserviced in terms of health and educational facilities<br />
and suffer from poor physical infrastructure.<br />
Moreover, of those eligible to vote, the largest number of unregistered votes was in the 18-33<br />
category, those who would not have been eligible to vote in their places of origin prior to<br />
displacement. This is a worrisome indication of future disenfranchisement as well, since the<br />
complicated procedures for the registration of voters in Sri Lanka may result in those Puttalam<br />
IDPs below the age of 18 also not being registered as voters.<br />
b) Vulnerable Groups<br />
Some 10,431 persons reported that they fell into one of the pre-defined vulnerability groups. It<br />
should be noted however, that this figure may not be exact as there might be some individuals<br />
who fall into more than one vulnerability group (e.g. a single-headed householder who is also a<br />
physically-challenged parent). The recorded vulnerability factors included households headed by<br />
one parent who were at risk (1,830); physically challenged (1,272) or mentally challenged (580)<br />
persons; unaccompanied minors (0); elderly without support (252) or chronically ill (601).<br />
c) Information on Place of Displacement<br />
The survey population is currently residing in the following four divisions in Puttalam District:<br />
Kalpitiya, Puttalam, Mundel and Vanathavilluwa. In <strong>2006</strong>, the survey indicated the following<br />
distribution of IDPs in WCs:<br />
� Kalpitiya DS Division 34, 809 persons (55% of survey population)<br />
� Puttalam DS Division 20,992 persons (33%)<br />
� Mundel DS Division 5,336 persons (8%)<br />
� Vanathavilluwa DS Division 2,008 persons (3%)<br />
The average number of years in their current place of displacement in Puttalam District is 10<br />
years, whereas the average number of years since their first displacement is 16 years.<br />
As noted above, one of the most striking conclusions that can be drawn from the survey is the fact<br />
that a majority of Puttalam IDPs have already de facto locally integrated in Puttalam due to the<br />
fact that approximately 74% of the IDPs claimed that they possessed land and 58% said they<br />
possessed a house in their place of displacement. These findings are similar to those in the 2004<br />
survey when 70% of the IDPs living in WCs in Puttalam District claimed that they possessed land<br />
Final Report on the <strong>2006</strong> Revalidation of the 2004 Puttalam WC Survey<br />
April <strong>2006</strong><br />
7
DRAFT – Not for Circulation<br />
and 68% claimed that they possessed a house in Puttalam District. 5 Of those families who<br />
claimed to possess land in Puttalam, 8,304 families (72%) reported that they had purchased their<br />
land, 388 families (3%) reported that they had received their land through donation and 28 (0.3%)<br />
reported that they had inherited their land. These findings suggest that the number of displaced<br />
persons who own land and/or a house in Puttalam is relatively high. Moreover, the fact that so<br />
may of the Puttalam IDPs have purchased their land indicates a desire to settle themselves more<br />
permanently in Puttalam District.<br />
Lack of documentation continues to be a problem for land and house possession in the place of<br />
displacement. Of those who possess land in Puttalam, 75% (8,587) claimed that they had<br />
documents while 33% of those who possessed a house claimed to have documents (25% of the<br />
landowners did not have documentation and 66% of homeowners lacked documentation). In<br />
2004, 15% of landowners and 30% of homeowners in Puttalam stated they lacked documentation.<br />
As indicated below, the lack of documentation on property is also a problem regarding property<br />
owned or claimed ownership at the place of origin.<br />
In contrast to the 2004 survey, in the <strong>2006</strong> revalidation, IDPs were required to show their land<br />
documents in order to prove that they possessed documentation. Enumerators were instructed to<br />
check the land and housing documents of each family in order to verify the accuracy of their<br />
statements regarding documentation and only to record those who could provide documentary<br />
evidence as possessing documentation. Interestingly, of those landowners with documentation, an<br />
overwhelming 97% had outright deeds, whereas only a small proportion had permits (1.5%),<br />
grants (1%) or leases (0.5%).<br />
Of those persons surveyed who stated that they possessed a house in their place of displacement,<br />
approximately 63% were determined to be temporary structures, 25% to be semi-permanent while<br />
only 12% were determined to be permanent houses.<br />
Amongst those families who possess land in their place of displacement and have valid<br />
documents, 3,906 families reported having a private latrine, 1,314 shared a latrine with one or<br />
more families, 290 used common or public latrine facilities and 856 families reported that latrine<br />
facilities were not available. Among those families who possessed land in Puttalam but who did<br />
not have valid documents, 940 families reported having a private latrine, 567 shared a latrine with<br />
one or more families, 180 used common or public latrine facilities and 290 families reported that<br />
latrine facilities were not available.<br />
d) Information on Place of Origin<br />
Of the IDPs surveyed in <strong>2006</strong>, only 42% (6,190 families) indicated that they currently possess<br />
land in their district of origin while 18% (2,839 families) indicated that they possess a house in<br />
their place of origin. In the 2004 survey, 61% of the total survey population indicated that they<br />
possessed land in their district of origin, and 53% indicated that they had a house in their district<br />
5 The decrease in the number of those who claimed to possess a house (i.e. 10% decrease) may be the result<br />
of the alleged instructions from some mosque committee leaders who advised WC residents to answer that<br />
they possessed land but did not possess a house in the place of displacement in order to increase their<br />
chances of obtaining housing assistance from the World Bank housing project.<br />
Final Report on the <strong>2006</strong> Revalidation of the 2004 Puttalam WC Survey<br />
April <strong>2006</strong><br />
8
DRAFT – Not for Circulation<br />
of origin. These statistics may indicate that between 2004 and <strong>2006</strong>, people have sold land in their<br />
districts of origin 6 or they may have donated it to their daughters for dowry purposes.<br />
Interestingly, 2,248 families (15%) reported owning land both in Puttalam and in their place of<br />
origin.<br />
As with the information on the place of displacement, lack of documentation is a problem with<br />
approximately 60% of the landowners indicating that they lack land documents and 16% of<br />
homeowners indicating that they lack house documentation (40% (2,484 families) have land<br />
documents and 30% (843 families) have house documents). Of those with documents, 2,300<br />
families (94%) claimed to have outright deeds, 94 families (4%) claimed to have permits, 46<br />
families (2%) had grants and 8 families (less than 0.5%) had leases. In 2004, close to 20% of the<br />
land owners and 30% of the house owners with property in their place of origin indicated that<br />
they lacked proper documentation. The <strong>2006</strong> survey results indicate that the majority of people<br />
are without land documentation for property in their place of origin because it was either lost or<br />
destroyed (65%); a smaller proportion never obtained land documentation (24%). Both the 2004<br />
and <strong>2006</strong> survey results highlight the need for mechanisms to deal with land and property<br />
registration, regularization of title, property restitution and dispute settlement.<br />
In terms of availability of land, 2,162 families (14%) reported that their land was available;<br />
whereas 294 families (2%) said that the land was in a high security zone, 452 families (3%) said<br />
the land was occupied by others, 71 families (0.5%) said that their land was covered with<br />
landmines and 11 families (0.07%) said that it was now located within the coastal buffer zone.<br />
e) Durable solutions: Preferences and Obstacles<br />
Preferred Durable Solutions<br />
The preferred durable solution for the IDPs surveyed was overwhelmingly local integration (96%,<br />
14,928 families). Only a small proportion expressed a preference to return home in the short to<br />
medium term (4%, 552 families). None of those surveyed indicated that they were interested in<br />
relocation. Of those whose preferred durable solution was to return home, 62% (344 families)<br />
reported that their alternative durable solution was to locally integrate in Puttalam.<br />
In 2004, the preferred durable solution questions were formulated differently. Unlike the <strong>2006</strong><br />
survey, which asked respondents to give their preferred durable solution, and an alternative<br />
durable solution if their preferred durable solution was not achievable in the next 3-5 years,<br />
the 2004 survey asked respondents whether their preferred durable solution was to: (i) return<br />
home immediately, (ii) return home in the future, (iii) relocate to their district of origin, or<br />
(iv) to locally integrate within their district of displacement. In 2004, 2% (325 families) said<br />
that they were prepared to return home immediately, 60% (8,574 families) of the survey<br />
population could foresee a return home at a later stage, while 38% (5,564 families) reported<br />
that they wished to locally integrate in Puttalam District.<br />
6 In some instances, Muslim families may have sold their land under duress or because of restrictions on<br />
their ability to engage in business and other activities in their districts of origin. Still others may have been<br />
induced to sell their land due to the high sale prices for land in certain areas such as Jaffna District and<br />
because Muslims continue to feel insecure in these areas either as a result of pressure from armed groups or<br />
because of ethnic tensions and the absence of a strong Muslim community in the area.<br />
Final Report on the <strong>2006</strong> Revalidation of the 2004 Puttalam WC Survey<br />
April <strong>2006</strong><br />
9
DRAFT – Not for Circulation<br />
The dramatic change in preferred durable solutions may be the result of the publicity<br />
surrounding the proposed World Bank housing project and misunderstandings regarding the<br />
purpose of the <strong>2006</strong> revalidation exercise in relation to the receipt of assistance under the<br />
proposed housing project.<br />
Of those wishing to integrate locally, 75% (11,118 families) possess land in Puttalam. Of<br />
these, 74% (8,281 families) have documentation to prove their land ownership. As noted<br />
above, the overwhelming number of IDPs who own land in Puttalam indicates that a majority<br />
of the Puttalam IDPs have de facto locally integrated. Given the relatively high number of<br />
families who possess land and have valid land documents, the 2004 report suggested that it<br />
might be warranted for the Government to review “who is still an IDP as many have<br />
registered but were already living in a relocation village and may have had a durable<br />
solution.” Similar conclusions may be drawn from an analysis of the <strong>2006</strong> survey data.<br />
It is important to note however, that local integration of the Puttalam WC population will<br />
need to be officially supported through Government assistance to facilitate land ownership,<br />
the acquisition of deed documentation and development assistance designed to improve<br />
physical infrastructure and access to public services such as medical and educational<br />
facilities. Without this assistance, sustainable integration will not be achieved. Moreover,<br />
voter registration in Puttalam District and the voting rights of the Puttalam IDPs will also<br />
need to be examined in order to ensure sustainable integration. IDPs should be provided with<br />
full information on their right to return, restitution and compensation, and while IDPs should<br />
be able to choose their place of residence in accordance with the fundamental rights<br />
guaranteed in the Sri Lankan Constitution, they should also be made aware of the<br />
implications of not being registered voters of Puttalam District. There should be some<br />
discussion of how to allocate sufficient resources to the DS of Puttalam to ensure equal<br />
access to public infrastructure and services.<br />
Interestingly, of those wishing to return to their place of origin, only 68% (371 families)<br />
possessed land, and only 23% (128 families) had documentation to prove their land rights. Of<br />
those wishing to return home, and who possessed land that was available (i.e. not in a HSZ or<br />
occupied by another), 78% (109 families) claimed to have documentation to prove their land<br />
rights. The fact of landlessness, compounded by lack of documentation, will pose significant<br />
obstacles to the return of these families.<br />
A relatively small number of families (116 or less than 1%) reported that some of their family<br />
members had returned to their district of origin. Of those families whose preferred solution<br />
was return home, 16 (3%) reported that they had family members who had already returned<br />
to their district of origin.<br />
Final Report on the <strong>2006</strong> Revalidation of the 2004 Puttalam WC Survey<br />
April <strong>2006</strong><br />
10
DRAFT – Not for Circulation<br />
Obstacles for Preferred Solutions & Type of Assistance Required<br />
The main obstacles to return expressed by the IDPs are security concerns, followed by lack of<br />
access road, lack of government support for their return, lack of productive assets (tools), lack of<br />
health facilities, lack of education facilities and lack of access to water. In 2004, the main<br />
obstacles to return were security and protection concerns, followed by a lack of or poor<br />
infrastructure facilities and a paucity of employment/income-generating opportunities. As<br />
noted above however, one of the major obstacles to return will be the fact of landlessness in<br />
the place of origin. As noted above, of the IDPs surveyed in <strong>2006</strong>, only 42% (6,190 families)<br />
indicated that they currently possess land in their district of origin. Only 35% of those families<br />
surveyed who possessed land in their place of origin reported that it was “available” (5%<br />
reported that it was located in HSZs; 7% reported it was occupied by others; 1% reported it<br />
was covered by landmines). While the obstacles to return expressed by the IDPs, particularly<br />
security concerns, are significant, the fact of landlessness in their district of origin may pose the<br />
most significant obstacle to their potential/eventual return.<br />
As in 2004, Mannar is the area of return where more returns may be expected as (i) more<br />
families from Mannar (462) indicated that their preferred durable solution was return home,<br />
(ii) a large proportion of IDP families them possessed land (4,733 of 11,165 families – i.e.<br />
42% of the families from Mannar District) although a smaller proportion possessed<br />
documentation to prove their land rights (1,923 of 4,733 families – i.e. 41% of those owning<br />
land), and (iii) a significant proportion indicated that their land was available (1,687 of 4,733<br />
families – i.e. 36% of families with land in Mannar).<br />
Amongst those IDPs wishing to integrate locally in Puttalam, the main obstacles reported in <strong>2006</strong><br />
were no access to water, by lack of productive assets (tools), lack of government support to assist<br />
local integration, lack of access roads and lack of health and educational facilities. In 2004,<br />
similar obstacles to local integration were reported, with those wishing to integrate locally<br />
indicating their concern for the future sustainability of such an undertaking. Given the<br />
overwhelming expression by Puttalam IDPs of their willingness to locally integrate, it is<br />
incumbent upon the Government and other actors to examine how to ensure that this<br />
integration is sustainable, all the while recognizing the IDPs’ right to return, compensation<br />
and restitution, in accordance with principles of international law. The integration of Puttalam<br />
IDPs would be facilitated if they were to receive assistance in the form of improved access to<br />
public services such as water, health and education as well as construction of basic infrastructure<br />
such as access roads. Assistance in helping the IDPs to develop sustainable livelihoods would<br />
further contribute to a sustainable local integration.<br />
As with the results in 2004, the <strong>2006</strong> revalidation survey clearly illustrates one particular problem<br />
common to many IDPs, namely the lack of documents on land or housing they claim to own.<br />
Accordingly, a commitment by the Government to issue replacement documentation or to<br />
regularize land title would go a long way in assisting IDPs to achieve their durable solutions, be it<br />
return home or local integration. In this vein, the World Bank’s proposal to establish Land Task<br />
Forces, similar to those established under the NEHRP would be of great assistance.<br />
Report prepared by <strong>UNHCR</strong> Protection Unit<br />
Colombo, 28 April <strong>2006</strong><br />
Final Report on the <strong>2006</strong> Revalidation of the 2004 Puttalam WC Survey<br />
April <strong>2006</strong><br />
11
WELFARE CENTRES REVALIDATION<br />
PUTTLAM <strong>2006</strong><br />
– STATISTICAL SUMMARY –<br />
Puttalam Welfare Centres Revalidation - <strong>2006</strong> Page 1 of 47
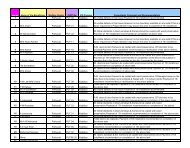
1. DEMOGRAPHY<br />
1.1 AGE & GENDER (Number of Individuals)<br />
Gender 0-4 5-12 12-17<br />
Age<br />
18-33 33-59 Over 60 n/a Total %<br />
Female 3,421 6,007 3,209 9,636 7,516 1,420 171 31,380 49.7%<br />
Male 3,569 6,390 3,196 9,607 7,584 1,252 167 31,765 50.3%<br />
Total 6,990 12,397 6,405 19,243 15,100 2,672 338 63,145<br />
11.1% 19.6% 10.1% 30.5% 23.9% 4.2% 0.5% 100%<br />
1.2 ETHNICITY (Number of Individuals)<br />
1.3 RELIGION (Number of Individuals)<br />
Sinhala Tamil Muslim Burgher Total<br />
312 351 62,378 104 63,145<br />
0.49% 0.56% 98.79% 0.16% 100%<br />
Buddhist Hindu Islam Christian Total<br />
47 166 62,378 554 63,145<br />
0.07% 0.26% 98.79% 0.88% 100%<br />
1.4 EDUCATION (Number of Individuals)<br />
Education<br />
No Schooling<br />
Grade 1 - 5<br />
Grade 6 - 10<br />
Passed O/L NCGE<br />
Passed A/L HNCE<br />
Degree and Above<br />
Total<br />
1.5 VULNERABILITY (Number of Individuals)<br />
Single<br />
headed HH<br />
at risk<br />
Male<br />
Female<br />
Total<br />
Number % Number % Number %<br />
5,529 17.41% 5,518 17.58% 11,047 17.49%<br />
6,637 20.89% 7,702 24.54% 14,339 22.71%<br />
11,704 36.85% 11,542 36.78% 23,246 36.81%<br />
4,864 15.31% 4,231 13.48% 9,095 14.40%<br />
2,697 8.49% 2,242 7.14% 4,939 7.82%<br />
334 1.05% 145 0.46% 479 0.76%<br />
31,765 50.30% 31,380 49.70% 63,145<br />
Unemployed<br />
Physically<br />
challenged<br />
Mentally<br />
challenged<br />
Orphans<br />
Elderly w/o<br />
support<br />
Chronically ill Total<br />
1,830 5,896 1,272 580 252 601 10,431<br />
1.6 EMPLOYMENT (Population older than 18 yrs)<br />
Current<br />
Employment<br />
Not employed<br />
Paid employment<br />
Own account worker<br />
Unpaid family worker<br />
Employer<br />
Total<br />
Male<br />
Female<br />
Total<br />
Number % Number % Number %<br />
4,911 28.10% 16,307 94.38% 21,218 61.05%<br />
9,865 56.45% 757 4.38% 10,622 30.56%<br />
2,575 14.73% 160 0.93% 2,735 7.87%<br />
48 0.27% 41 0.24% 89 0.26%<br />
78 0.45% 13 0.08% 91 0.26%<br />
17,477 50.29% 17,278 49.71% 34,755<br />
2. VOTE LOCATION<br />
(Population older than 18 yrs)<br />
2.1 NOT IN VOTERS LIST - AGE BREAKDOWN<br />
Vote location Individ<br />
Age<br />
Place of displacement 1,814 Gender 18-33 33-59 Over 60 n/a Total<br />
Place of origin<br />
29,565 Female 2,338 445 62 67 2,912<br />
Total<br />
31,379 Male 2,160 350 37 73 2,620<br />
Total 4,498 795 99 140 5,532<br />
81.3% 14.4% 1.8% 2.5% 100%<br />
Puttalam Welfare Centres Revalidation - <strong>2006</strong> Page 2 of 47
3. DURABLE SOLUTION (Number of Families)<br />
Durable Solution<br />
Locally integrate / Remain<br />
Return home<br />
Total<br />
3.1 KEY OBSTACLES FOR RETURN<br />
Obstacles<br />
Security reasons<br />
Lack of access road<br />
Lack of government support<br />
Lack of productive assets (tools)<br />
Lack of health facilities<br />
Lack of education facilities<br />
No access to water<br />
Landless<br />
Lack of rule of law<br />
Landmines<br />
Lack of assistance for rebuilding<br />
Lack of land for cultivation<br />
Ethnic imbalance<br />
Land not accessible<br />
Lack of market facilities<br />
Lack of information on area<br />
No access to skills training<br />
Lack of fishing facilities<br />
Families %<br />
14,928 96.43%<br />
552 3.57%<br />
15,480<br />
3.2 KEY OBSTACLES FOR LOCAL INTEGRATION<br />
Obstacles<br />
Lack of productive assets (tools)<br />
Lack of government support<br />
Lack of health facilities<br />
No access to water<br />
Lack of access road<br />
Landless<br />
Lack of education facilities<br />
Lack of market facilities<br />
No access to skills training<br />
Lack of assistance for rebuilding<br />
Lack of land for cultivation<br />
Security reasons<br />
Lack of fishing facilities<br />
Ethnic imbalance<br />
Land not accessible<br />
Lack of rule of law<br />
Landmines<br />
Lack of information on area<br />
1 2<br />
Order of Priority<br />
3 4 5 Total<br />
376 56 11 7 5 455<br />
16 167 53 30 15 281<br />
11 28 47 60 46 192<br />
23 30 30 35 49 167<br />
2 23 39 45 54 163<br />
6 20 44 76 14 160<br />
11 24 89 22 9 155<br />
66 49 13 6 1 135<br />
3 29 33 30 26 121<br />
16 25 34 19 14 108<br />
13 17 27 21 78<br />
3 23 23 14 13 76<br />
5 12 31 15 7 70<br />
7 24 19 4 4 58<br />
4 5 12 5 4 30<br />
1 2 4 11 10 28<br />
2 4 8 6 7 27<br />
2 3 5 5 4 19<br />
1 2<br />
Order of Priority<br />
3 4 5 Total<br />
2,612 1,767 1,419 1,193 1,355 8,346<br />
1,218 2,543 1,787 1,529 1,152 8,229<br />
863 2,157 2,343 1,592 759 7,714<br />
3,001 1,584 1,051 638 447 6,721<br />
1,590 1,222 1,023 923 440 5,198<br />
2,594 816 327 241 170 4,148<br />
343 1,198 1,032 737 457 3,767<br />
362 678 798 625 580 3,043<br />
311 554 894 725 500 2,984<br />
153 354 903 587 431 2,428<br />
206 334 435 448 294 1,717<br />
799 142 86 38 45 1,110<br />
57 69 81 141 88 436<br />
13 17 19 51 39 139<br />
2 2<br />
1 1<br />
Puttalam Welfare Centres Revalidation - <strong>2006</strong> Page 3 of 47
3.3 ALTERNATIVE DURABLE SOLUTION IF DURABLE SOLUTION IS RETURN HOME<br />
Durable Solution<br />
Locally integrate / Remain<br />
Return home<br />
Total<br />
4. LAND AND HOUSE IN PUTTALAM DISTRICT<br />
Families %<br />
208 37.68%<br />
344 62.32%<br />
552<br />
4.1 POSSESSION OF LAND AND HOUSE IN PUTTALAM<br />
Land<br />
Land Docs House<br />
House Docs<br />
Number % Number % Number % Number %<br />
Yes 11,485 74.19% 8,587 55.47% 8,979 58.00% 3,043 19.66%<br />
No 3,995 25.81% 2,898 18.72% 6,501 42.00% 5,936 38.35%<br />
Total 15,480 11,485 15,480 8,979<br />
4.2 WHY DO NOT POSSESS LAND DOCUMENTS<br />
Reason<br />
Failed to register<br />
Fraudulent transfer<br />
Lost/Destroyed<br />
Never obtained<br />
Total<br />
Families %<br />
518 18.07%<br />
1 0.03%<br />
76 2.65%<br />
2,272 79.25%<br />
2,867<br />
4.3 KIND OF DOCUMENTS TO PROVE LAND RIGHTS<br />
Kind<br />
Outright deeds<br />
Permit<br />
Grant<br />
Lease<br />
Total<br />
4.4 ACQUIREMENT OF LAND<br />
Land Acquired Families %<br />
Bought 8,304 72.30%<br />
Donated 388 3.38%<br />
Inherited 28 0.24%<br />
No answer 2,765 24.07%<br />
Total 11,485<br />
4.5 TYPE OF HOUSES<br />
Type of house<br />
Permanent<br />
Semi permanent<br />
Temporary<br />
Total<br />
Families %<br />
8,343 97.16%<br />
125 1.46%<br />
101 1.18%<br />
18<br />
8,587<br />
0.21%<br />
Families %<br />
1,093 12.17%<br />
2,232 24.86%<br />
5,653 62.97%<br />
8,978<br />
Puttalam Welfare Centres Revalidation - <strong>2006</strong> Page 4 of 47
4.6 TYPE OF HOUSES AND LATRINES FOR FAMILIES WHO POSSESS LAND<br />
AND VALID LAND DOCUMENTS<br />
Type of House<br />
Permanent<br />
Semi permanent<br />
Temporary<br />
Total<br />
Type of House<br />
Permanent<br />
Semi permanent<br />
Temporary<br />
Total<br />
Common<br />
/Public<br />
Common<br />
/Public<br />
Not<br />
available<br />
Private Sharing Total %<br />
23 86 803 45 957 15.03%<br />
74 269 1,224 287 1,854 29.12%<br />
193 501 1,879 982 3,555 55.84%<br />
290 856 3,906 1,314 6,366<br />
Not<br />
available<br />
Private Sharing Total<br />
8 12 88 11 119<br />
18 39 194 67 318<br />
154 239 658 489 1540<br />
180 290 940 567 1977<br />
4.8 POSSESSION OF LAND AND HOUSE IN PUTTALAM - WANT TO LOCALLY INTEGRATE<br />
Land Land Docs House<br />
House Docs<br />
Number % Number % Number % Number %<br />
Yes 11,118 74.48% 8,281 55.47% 8,622 57.76% 2,870 19.23%<br />
No 3,810 25.52% 2,837 19.00% 6,306 42.24% 5,752 38.53%<br />
Total 14,928 11,118 14,928 8,622<br />
5. NUMBER OF FAMILIES WHO POSSESS LAND IN PUTTALAM AND IN PLACE OF ORIGIN: 2,248<br />
6. LAND AND HOUSE AT PLACE OF ORIGIN<br />
6.1 POSSESSION OF LAND AND HOUSE<br />
Land Land Docs House<br />
House Docs<br />
Number % Number % Number % Number %<br />
Yes 6,190 39.99% 2,484 16.05% 2,839 18.34% 843 5.45%<br />
No 9,290 60.01% 3,706 23.94% 12,641 81.66% 1,996 12.89%<br />
Total 15,480 6,190 15,480 2,839<br />
6.2 AGE BREAKDOWN FOR THOSE WHO POSSESS LAND<br />
18-33 33-59<br />
Age<br />
Over 60 n/a Total<br />
595 4,166 1,392 37 6,190<br />
6.3 WHY DO NOT POSSESS LAND DOCUMENTS<br />
Reason<br />
Failed to register<br />
Fraudulent transfer<br />
Lost/Destroyed<br />
Never obtained<br />
Total<br />
Families %<br />
360 10.42%<br />
11 0.32%<br />
2,240 64.85%<br />
843 24.41%<br />
3,454<br />
Type of Latrines<br />
4.7 TYPE OF HOUSES AND LATRINES FOR FAMILIES WHO POSSESS LAND<br />
BUT NOT VALID LAND DOCUMENTS<br />
Type of Latrines<br />
Puttalam Welfare Centres Revalidation - <strong>2006</strong> Page 5 of 47
6.4 KIND OF DOCUMENTS TO PROVE LAND RIGHTS<br />
Permit<br />
Grant<br />
Lease<br />
Total<br />
Kind<br />
Outright deeds<br />
6.5 STATUS OF LAND<br />
Status of Land<br />
Available<br />
In HSZ<br />
Occupied by other<br />
Landmines<br />
In buffer zone<br />
n/a<br />
Total<br />
6.6 TYPE OF HOUSES<br />
Type of house<br />
Permanent<br />
Semi permanent<br />
Temporary<br />
Total<br />
Families %<br />
2,300 93.95%<br />
94 3.84%<br />
46 1.88%<br />
8 0.33%<br />
2,448<br />
Families %<br />
2,161 34.91%<br />
294 4.75%<br />
452 7.30%<br />
71 1.15%<br />
11 0.34%<br />
3,201 51.71%<br />
6,190<br />
Families %<br />
1,429 54.52%<br />
439 16.75%<br />
753 28.73%<br />
2,621<br />
6.7 POSSESSION OF LAND AND HOUSE - WANT TO RETURN<br />
Land Land Docs House House Docs<br />
Number % Number % Number % Number %<br />
Yes 371 68.45% 128 23.62% 121 22.32% 41 7.56%<br />
No 171 31.55% 243 44.83% 431 79.52% 80 14.76%<br />
Total 542 371 552 121<br />
6.8 POSSESSION OF LAND AND HOUSE - WANT TO RETURN AND LAND AVAILABLE<br />
Land Land Docs House House Docs<br />
Number % Number % Number % Number %<br />
Yes 139 100.00% 109 78.42% 50 35.97% 28 20.14%<br />
No 30 21.58% 89 64.03% 22 15.83%<br />
Total 139 139 139 50<br />
7. FAMILY INFORMATION<br />
7.1 NUMBER OF FAMILIES WHOSE MEMBERS HAVE RETURNED TO PLACE OF ORIGIN: 116<br />
7.2 NUMBER OF FAMILIES WHO WANT TO RETURN AND THEIR MEMBERS HAVE ALREADY<br />
RETURNED TO PLACE OF ORIGIN: 16<br />
7.3 PLACE OF LIVING OF MARRIED CHILDREN 7.4 DISPLACEMENT<br />
Place<br />
With parents<br />
In separate dwelling<br />
With host family<br />
Total<br />
Number %<br />
1,902 47.73%<br />
1,751 43.94%<br />
332 8.33%<br />
3,985<br />
AVG Years<br />
in Displacement<br />
15.98<br />
AVG Years in<br />
Current Place<br />
10.12<br />
Puttalam Welfare Centres Revalidation - <strong>2006</strong> Page 6 of 47
WELFARE CENTRES REVALIDATION<br />
PUTTLAM <strong>2006</strong><br />
- LIST OF WELFARE CENTRES -<br />
Puttalam Welfare Centres Revalidation - <strong>2006</strong> Page 7 of 47
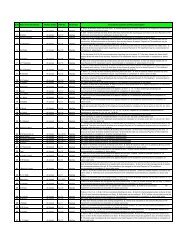
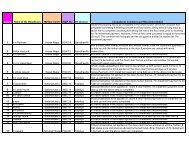
LIST OF WELFARE CENTRES IN PUTTALM DISTRICT<br />
REVALIDATION MARCH <strong>2006</strong><br />
No. DS Division GN Division Welfare Centre Families Persons Possess<br />
Land<br />
Possess<br />
Land<br />
Doc<br />
Possess<br />
House<br />
Possess<br />
1 Kalpitiya Alakuda Alankuda Mulli - B 214 857 23.83% 1.87% 69.16% 11.21%<br />
2 Kalpitiya Alankuda Al Arafa II Alankuda 37 156 78.38% 72.97% 48.65% 18.92%<br />
3 Kalpitiya Alankuda Al Azam Alankuda 71 300 83.10% 67.61% 54.93% 22.54%<br />
4 Kalpitiya Alankuda Al Hijra Alankuda 220 916 79.55% 73.18% 54.55% 20.00%<br />
5 Kalpitiya Alankuda Al Hira Alankuda 74 280 72.97% 68.92% 50.00% 12.16%<br />
6 Kalpitiya Alankuda Al Manar Alankuda 48 207 83.33% 77.08% 70.83% 10.42%<br />
7 Kalpitiya Alankuda Ali Jinnah Alankuda 84 350 86.90% 85.71% 59.52% 38.10%<br />
8 Kalpitiya Alankuda Arafa Nagar Koiyawadi Alankuda 435 1755 65.98% 58.39% 51.95% 20.46%<br />
9 Kalpitiya Alankuda Dharussalam Nagar Alankuda 48 188 68.75% 50.00% 64.58% 6.25%<br />
10 Kalpitiya Alankuda Jinah A I Alankuda 64 252 76.56% 68.75% 60.94% 0.00%<br />
11 Kalpitiya Alankuda Jinnapuram Alankuda 67 299 92.54% 74.63% 76.12% 34.33%<br />
12 Kalpitiya Alankuda Kalmunaikudi I Alankuda 212 848 65.57% 60.38% 41.51% 21.23%<br />
13 Kalpitiya Alankuda Kalmunaikudi II Alankuda 181 778 76.80% 72.93% 46.41% 28.18%<br />
14 Kalpitiya Alankuda Madeena Nagar Alankuda 69 294 85.51% 81.16% 69.57% 40.58%<br />
15 Kalpitiya Alankuda Mazoor Nagar 205 811 85.37% 82.44% 68.29% 38.05%<br />
16 Kalpitiya Alankuda Sarafiyapuram Alankuda 54 235 83.33% 74.07% 66.67% 0.00%<br />
17 Kalpitiya Alankuda Thaib Nagar Andakerni 120 456 82.50% 74.17% 56.67% 30.00%<br />
18 Kalpitiya Anawasala Anavasal B 39 185 58.97% 48.72% 51.28% 0.00%<br />
19 Kalpitiya Kandakuliya Al Ameen Dalaiyadi 39 159 69.23% 53.85% 53.85% 10.26%<br />
20 Kalpitiya Kandakuliya Ashar Nagar 90 385 70.00% 10.00% 65.56% 2.22%<br />
21 Kalpitiya Kandakuliya Ashroff Nagar 81 312 66.67% 13.58% 61.73% 14.81%<br />
22 Kalpitiya Kandakuliya Kandakkuli A1 Camp 154 615 50.65% 11.04% 56.49% 11.04%<br />
23 Kalpitiya Kandakuliya Kandakkuli A2 Madaniya Camp 37 145 67.57% 18.92% 67.57% 18.92%<br />
24 Kalpitiya Kandakuliya Kandakkuli BCD Camp 42 190 42.86% 16.67% 59.52% 16.67%<br />
25 Kalpitiya Kandakuliya Mullai Camp B 19 74 36.84% 31.58% 57.89% 10.53%<br />
26 Kalpitiya Kandakuliya Musali Camp Kandakkuli 59 265 74.58% 64.41% 59.32% 27.12%<br />
27 Kalpitiya Karamba Hairath Camp Karambe 70 258 55.71% 14.29% 70.00% 15.71%<br />
28 Kalpitiya Karamba Husainiyapuram Ulkkapallam 725 2985 85.79% 76.14% 60.83% 31.31%<br />
29 Kalpitiya Karamba Husainiyapuram west Ulkkapallam 182 722 87.91% 84.07% 55.49% 24.18%<br />
30 Kalpitiya Karamba Safa Marwa A Karambe 439 1815 82.23% 12.07% 62.19% 11.85%<br />
31 Kalpitiya Karamba Safa Marwa B1 Karambe 81 347 95.06% 2.47% 86.42% 1.23%<br />
32 Kalpitiya Karamba Safa Marwa B2 Karambe 156 675 94.23% 0.64% 83.33% 0.64%<br />
33 Kalpitiya Karamba Safa Marwa C Karambe 99 358 77.78% 5.05% 60.61% 11.11%<br />
34 Kalpitiya Karamba Zam Zam Nagar Ulkkapallam 49 196 69.39% 4.08% 69.39% 6.12%<br />
35 Kalpitiya Kurinjipitiya South Koolankulam 147 608 68.71% 57.14% 52.38% 32.65%<br />
36 Kalpitiya Kurinjipitiya South Puthuveli Kurinchipiddy 74 325 77.03% 68.92% 58.11% 39.19%<br />
37 Kalpitiya Kurinjipitiya South Sammadiwadi 75 300 73.33% 60.00% 61.33% 4.00%<br />
38 Kalpitiya Kurinjipitiya South Sammadiwadi E Camp 24 89 70.83% 58.33% 70.83% 8.33%<br />
39 Kalpitiya Mandalakudawa Al Atholi D Camp 57 219 70.18% 22.81% 45.61% 0.00%<br />
40 Kalpitiya Mandalakudawa Al Mannar A,B Mandalakkuda 402 1536 82.34% 38.31% 45.52% 12.94%<br />
41 Kalpitiya Mandalakudawa Hajiyar B Camp 62 265 70.97% 61.29% 56.45% 41.94%<br />
42 Kalpitiya Mandalakudawa Hajiyar C Camp 45 175 64.44% 53.33% 53.33% 42.22%<br />
43 Kalpitiya Mandalakudawa Hajiyar Camp A 97 387 56.70% 54.64% 45.36% 28.87%<br />
44 Kalpitiya Mandalakudawa Madeena A Camp 18 67 77.78% 50.00% 50.00% 5.56%<br />
45 Kalpitiya Mandalakudawa Madeena C Al fadah 66 250 33.33% 24.24% 30.30% 7.58%<br />
46 Kalpitiya Mandalakudawa Malpura 13 44 92.31% 61.54% 69.23% 46.15%<br />
47 Kalpitiya Mandalakudawa Mihraj Puram 98 449 76.53% 68.37% 56.12% 31.63%<br />
48 Kalpitiya Mandalakudawa Muhammadiyapuram 275 1121 64.73% 53.45% 49.45% 27.27%<br />
49 Kalpitiya Mandalakudawa Mullai Camp 109 426 55.05% 47.71% 29.36% 20.18%<br />
50 Kalpitiya Mandalakudawa Rahmaniya 89 320 47.19% 38.20% 37.08% 14.61%<br />
51 Kalpitiya Mandalakudawa Sinhapura 61 229 83.61% 36.07% 67.21% 21.31%<br />
52 Kalpitiya Mudalappaliya 90 Acre Kandakkuda 244 988 84.43% 7.38% 56.15% 9.43%<br />
53 Kalpitiya Mudalappaliya Hasaniyapuram 46 195 80.43% 69.57% 65.22% 0.00%<br />
Puttalam Welfare Centres Revalidation - <strong>2006</strong> Page 8 of 47<br />
House<br />
Doc
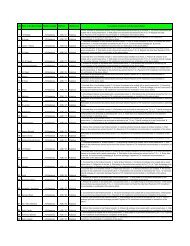
No. DS Division GN Division Welfare Centre Families Persons Possess<br />
Land<br />
Possess<br />
Land<br />
Doc<br />
Possess<br />
House<br />
Possess<br />
54 Kalpitiya Mudalappaliya Kannady Camp 15 63 100.00% 40.00% 80.00% 0.00%<br />
55 Kalpitiya Mudalappaliya Nookkirankerni 30 125 80.00% 60.00% 60.00% 0.00%<br />
56 Kalpitiya Mudalappaliya Palli Camp 23 101 82.61% 56.52% 65.22% 0.00%<br />
57 Kalpitiya Mudalappaliya Salamabath 81 370 88.89% 79.01% 60.49% 0.00%<br />
58 Kalpitiya Musalpitiya Musalpiry C 44 200 56.82% 36.36% 56.82% 4.55%<br />
59 Kalpitiya Norochchola Hajarawatta Nurachcholai 104 458 81.73% 70.19% 57.69% 12.50%<br />
60 Kalpitiya Norochchola Kuravankudy 28 111 64.29% 64.29% 67.86% 46.43%<br />
61 Kalpitiya Norochchola Mannar Mawatha Nurachcholai 83 339 68.67% 66.27% 53.01% 12.05%<br />
62 Kalpitiya Norochchola Mullaiyoor B camp Nurachcholai 18 81 72.22% 66.67% 66.67% 33.33%<br />
63 Kalpitiya Norochchola Mullaiyoor Kalpali Nurachcholai 173 684 53.18% 47.40% 37.57% 16.18%<br />
64 Kalpitiya Norochchola Mullaiyoor Muslim camp 73 303 76.71% 57.53% 64.38% 19.18%<br />
65 Kalpitiya Norochchola New Settlement 25 108 72.00% 56.00% 56.00% 48.00%<br />
66 Kalpitiya Norochchola Poolachchenai A,B Nurachcholai 34 162 85.29% 73.53% 55.88% 11.76%<br />
67 Kalpitiya Norochchola Poolachchenai C Nurachcholai 19 77 78.95% 78.95% 57.89% 52.63%<br />
68 Kalpitiya Norochchola Sanjeedawatta Nurachcholai 104 413 67.31% 64.42% 50.00% 11.54%<br />
69 Kalpitiya Palliwasalthure Ahamedpuram B Camp 49 206 85.71% 77.55% 73.47% 0.00%<br />
70 Kalpitiya Palliwasalthure Ahmadpuram 45 186 77.78% 73.33% 62.22% 2.22%<br />
71 Kalpitiya Palliwasalthure Al Hamara 163 711 75.46% 69.94% 52.76% 34.97%<br />
72 Kalpitiya Palliwasalthure Al Rahma E Camp 60 229 73.33% 70.00% 56.67% 6.67%<br />
73 Kalpitiya Palliwasalthure Decent Camp 39 160 89.74% 74.36% 64.10% 0.00%<br />
74 Kalpitiya Palliwasalthure ElandamoddaiRV 8 31 62.50% 62.50% 50.00% 0.00%<br />
75 Kalpitiya Palliwasalthure Jinna Camp 71 311 73.24% 66.20% 64.79% 26.76%<br />
76 Kalpitiya Palliwasalthure Kondachchi Camp 142 579 67.61% 57.04% 57.75% 38.73%<br />
77 Kalpitiya Palliwasalthure Kooba Nagar Pallivasalthurai 33 150 87.88% 84.85% 84.85% 39.39%<br />
78 Kalpitiya Palliwasalthure New Safra 69 286 75.36% 71.01% 53.62% 27.54%<br />
79 Kalpitiya Palliwasalthure New Sqafra B 32 154 71.88% 62.50% 62.50% 34.38%<br />
80 Kalpitiya Palliwasalthure Pallivasalthurai A Camp 22 91 40.91% 36.36% 36.36% 4.55%<br />
81 Kalpitiya Palliwasalthure Pallivasalthurai B Camp 11 55 100.00% 81.82% 81.82% 0.00%<br />
82 Kalpitiya Sinnakudieruppu Anna Mariya 37 140 75.68% 51.35% 51.35% 16.22%<br />
83 Kalpitiya Sinnakudieruppu Karusal Camp 36 137 66.67% 36.11% 47.22% 0.00%<br />
84 Kalpitiya Sinnakudieruppu Sinnakudieruppu 21 84 57.14% 19.05% 28.57% 14.29%<br />
85 Kalpitiya Thihali Islamabath 101 418 60.40% 59.41% 56.44% 32.67%<br />
86 Kalpitiya Thihali New Camp Thihali Etalai 68 362 66.18% 58.82% 70.59% 39.71%<br />
87 Kalpitiya Thihali Thihali Mawadi Mawatta 64 263 62.50% 56.25% 51.56% 32.81%<br />
Total Kalpitiya<br />
House<br />
Doc<br />
8,491 34,809 73.30% 51.53% 56.88% 19.99%<br />
1 Mundal Kadayamotai Al- Madeena Nagar 42 174 28.57% 16.67% 45.24% 4.76%<br />
2 Mundel Kadayamotai Kadayamoddai 41 203 70.73% 41.46% 36.59% 7.32%<br />
3 Mundel Kottanthievu Rahmathpuram 71 285 83.10% 57.75% 54.93% 0.00%<br />
4 Mundel Kottanthievu Siyapuram 53 194 79.25% 58.49% 39.62% 0.00%<br />
5 Mundel Madurankuliya Madurankuli 42 155 71.43% 66.67% 57.14% 30.95%<br />
6 Mundel Madurankuliya Srimapuram 69 266 42.03% 15.94% 56.52% 8.70%<br />
7 Mundel Nallandaluwa Nallandaluwa 18 81 27.78% 27.78% 55.56% 5.56%<br />
8 Mundel Nallandaluwa Nallandaluwa A&B 13 55 23.08% 23.08% 69.23% 7.69%<br />
9 Mundel Nallandaluwa Nallandaluwa C 20 87 30.00% 25.00% 40.00% 0.00%<br />
10 Mundel Perukkuvattan Perukkuwedduvan 82 308 74.39% 60.98% 57.32% 24.39%<br />
11 Mundel Pulichchakulama Hijrath Nagar Pulichchakulam 230 936 88.70% 83.04% 73.04% 39.57%<br />
12 Mundel Pulichchakulama Puthukkudieruppu 56 198 80.36% 67.86% 55.36% 16.07%<br />
13 Mundel Sameeragama Sameeraga Muhaam 63 268 46.03% 34.92% 66.67% 20.63%<br />
14 Mundel Tharakudivilluwa Darussalam Akkaraveli 63 294 69.84% 61.90% 66.67% 20.63%<br />
15 Mundel Viruthodai Viruthodai 13 50 30.77% 23.08% 30.77% 7.69%<br />
16 Mundel Weerapura Hidhayath Nagar 455 1782 94.95% 46.37% 78.02% 0.66%<br />
Total Mundel<br />
1,331 5,336 77.69% 52.74% 65.59% 13.22%<br />
Puttalam Welfare Centres Revalidation - <strong>2006</strong> Page 9 of 47
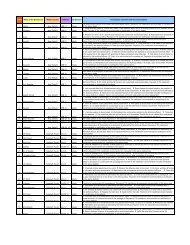
No. DS Division GN Division Welfare Centre Families Persons Possess<br />
Land<br />
Possess<br />
Land<br />
Doc<br />
Possess<br />
House<br />
Possess<br />
1 Puttalam Manalthivu Madeena Nagar 126 511 75.40% 67.46% 44.44% 23.81%<br />
2 Puttalam Manalthivu Mohideen Nagar 115 455 95.65% 84.35% 73.04% 0.87%<br />
3 Puttalam Manalthivu Rahmath Nagar A 278 1227 78.06% 62.23% 64.03% 11.51%<br />
4 Puttalam Manalthivu Rahmath Nagar B 168 717 84.52% 75.60% 68.45% 22.02%<br />
5 Puttalam Manalthivu Salton I 92 377 10.87% 1.09% 44.57% 4.35%<br />
6 Puttalam Manalthivu Salton II 37 162 29.73% 24.32% 67.57% 5.41%<br />
7 Puttalam Marikkar Street Al Mina Thambapanni 290 1255 51.38% 2.76% 60.00% 2.41%<br />
8 Puttalam Palaviya Fareedabath 76 278 76.32% 68.42% 52.63% 22.37%<br />
9 Puttalam Palaviya Hijrapuram 152 601 80.92% 73.68% 77.63% 42.76%<br />
10 Puttalam Palaviya Madeena Nagar 41 182 78.05% 65.85% 51.22% 17.07%<br />
11 Puttalam Palaviya Maleehapuram 129 512 82.17% 69.77% 31.01% 7.75%<br />
12 Puttalam Palaviya Sembamadu 48 206 85.42% 72.92% 52.08% 14.58%<br />
13 Puttalam Palaviya Shafi Nagar 53 223 84.91% 81.13% 67.92% 20.75%<br />
14 Puttalam Pottuvilluwa Erukkalampiddy 1203 4909 74.90% 58.44% 56.28% 31.75%<br />
15 Puttalam Pottuvilluwa Razool Nagar 162 629 82.72% 77.16% 70.37% 16.05%<br />
16 Puttalam Puttalam East Rahmabath (Al Hassanath Rd) 22 92 81.82% 68.18% 40.91% 0.00%<br />
17 Puttalam Rathmalyaya Ratmalyaya 515 2063 72.04% 65.24% 53.98% 30.29%<br />
18 Puttalam Rathmalyaya Thaib Nagar Anapllaiyooththu 97 402 77.32% 75.26% 67.01% 16.49%<br />
19 Puttalam Rathmalyaya YMMA 106 399 64.15% 53.77% 46.23% 21.70%<br />
20 Puttalam Senakudirippuwa Mullai Nagar 78 314 74.36% 60.26% 47.44% 32.05%<br />
21 Puttalam Senakudirippuwa Ninthani 122 438 76.23% 66.39% 47.54% 15.57%<br />
22 Puttalam Senakudirippuwa Ninthani II Moor Street 139 539 89.21% 82.73% 14.39% 6.47%<br />
23 Puttalam Thiladiya Al Aqsh Thilaiyadi 287 1214 83.62% 76.31% 70.03% 20.21%<br />
24 Puttalam Thiladiya Al Arafa 132 579 78.03% 76.52% 68.94% 12.88%<br />
25 Puttalam Thiladiya Al Jiddah 186 729 78.49% 75.27% 63.98% 19.35%<br />
26 Puttalam Thiladiya Al Minapuram Thillaiyadi 244 900 76.64% 70.49% 42.62% 17.62%<br />
27 Puttalam Thiladiya Thillaiyadi E 40 144 85.00% 62.50% 57.50% 0.00%<br />
28 Puttalam Thiladiya Thillaiyadi F 46 154 76.09% 13.04% 67.39% 0.00%<br />
29 Puttalam Thiladiya Umarabath A 139 552 76.98% 65.47% 62.59% 0.00%<br />
30 Puttalam Thiladiya Umarabath A 45 201 82.22% 71.11% 64.44% 0.00%<br />
31 Puttalam Thiladiya Zadamiyapuram 7 28 71.43% 71.43% 57.14% 57.14%<br />
Total Puttalam<br />
House<br />
Doc<br />
5,175 20,992 74.88% 61.87% 56.99% 20.17%<br />
1 Vanathavilluwa Karathivu South Karativu RNA Nagar 49 189 63.27% 51.02% 44.90% 26.53%<br />
2 Vanathavilluwa Vattakandal Elma City IIRO 13 53 100.00% 100.00% 76.92% 76.92%<br />
3 Vanathavilluwa Vattakandal Ismailpuram Hassan Nagar 45 190 86.67% 68.89% 73.33% 42.22%<br />
4 Vanathavilluwa Vattakandal<br />
Mujahideenpuram 6th mile post<br />
Ismailpuram<br />
118 500 72.03% 66.10% 67.80% 34.75%<br />
5 Vanathavilluwa Vattakandal New Sitny 137 584 71.53% 62.77% 67.88% 13.14%<br />
6 Vanathavilluwa Vattakandal Noohu Nagar 35 145 77.14% 74.29% 62.86% 11.43%<br />
7 Vanathavilluwa Vattakandal Salamabath 86 347 68.60% 56.98% 77.91% 24.42%<br />
Total Vanathavilluwa<br />
Grand Total<br />
Total number of Welfare Centres: 141<br />
483 2,008 72.88% 63.77% 67.70% 26.09%<br />
15,480 63,145 74.19% 55.47% 58.00% 19.66%<br />
Puttalam Welfare Centres Revalidation - <strong>2006</strong> Page 10 of 47
WELFARE CENTRES SURVEY<br />
PUTTLAM <strong>2006</strong><br />
- DEMOGRAPHIC PROFILE -<br />
Puttalam Welfare Centres Revalidation - <strong>2006</strong> Page 11 of 47
Age and Gender Breakdown<br />
A G E<br />
Gender 0 - 4 5 - 12 13 - 17 18 - 33 34 - 59 over 60 n/a Total %<br />
Female 3,421 6,007 3,209 9,636 7,516 1,420 171 31,380 49.7%<br />
Male 3,569 6,390 3,196 9,607 7,584 1,252 167 31,765 50.3%<br />
Total<br />
6,990 12,397 6,405 19,243 15,100 2,672 338 63,145<br />
% 11.1% 19.6% 10.1% 30.5% 23.9% 4.2%<br />
12,000<br />
10,000<br />
8,000<br />
6,000<br />
4,000<br />
2,000<br />
0<br />
0.5%<br />
0-4 5-12 12-17 18-33 33-59 Over 60 n/a<br />
Female Male<br />
Welfare Centres Survey - Puttlam <strong>2006</strong><br />
Puttalam Welfare Centres Revalidation - <strong>2006</strong> Page 12 of 47
Ethnicity by Division of Displacement<br />
Division Sinhala Tamil Muslim Other Total<br />
Kalpitiya 305 234 34,184 98 34,821 55.14%<br />
Vanathavilluwa 1 2,007 2,008 3.18%<br />
Puttalam 5 111 20,874 4 20,994 33.25%<br />
Mundel 1 6 5,313 2 5,322 8.43%<br />
Total 312 351 62,378 104 63,145<br />
Burgher<br />
0.49% 0.56% 98.79%<br />
Muslim<br />
Tamil<br />
0.16%<br />
Sinhalese<br />
Welfare Centres Survey - Puttlam <strong>2006</strong><br />
Puttalam Welfare Centres Revalidation - <strong>2006</strong> Page 13 of 47
Ethnicity by District of Origin<br />
District Sinhalese Tamil Muslim Burgher Total<br />
Mannar 237 163 45,159 55 45,614 72.24%<br />
Jaffna 125 8,491 6 8,622 13.65%<br />
Mullaitivu 17 5 6,560 5 6,587 10.43%<br />
Kilinochchi 22 1,554 1,576 2.50%<br />
Vavuniya 267 267 0.42%<br />
Trincomalee 21 202 223 0.35%<br />
Batticaloa 14 4 84 102 0.16%<br />
Puttalam 44 11 38 93 0.15%<br />
Ampara 50 50 0.08%<br />
Polonnaruwa 11 11 0.02%<br />
Total 312 351 62,378 104 63,145<br />
Burgher<br />
0.49% 0.56% 98.79%<br />
Muslim<br />
Tamil<br />
0.16%<br />
Sinhalese<br />
Welfare Centres Survey - Puttlam <strong>2006</strong><br />
Puttalam Welfare Centres Revalidation - <strong>2006</strong> Page 14 of 47
Religion by Division of Displacement<br />
Division Buddhist Hindu Islam Christian Anemist Total<br />
Kalpitiya 40 85 34,184 512 34,821 55.14%<br />
Vanathavilluwa 1 2,007 2,008 3.18%<br />
Puttalam 5 75 20,874 40 20,994 33.25%<br />
Mundel 1 6 5,313 2 5,322 8.43%<br />
Total 47 166 62,378 554 63,145<br />
0.07% 0.26% 98.79% 0.88%<br />
0.26%<br />
98.79%<br />
0.88%<br />
0.07%<br />
Buddhist Christian Hindu Islam<br />
Welfare Centres Survey - Puttlam <strong>2006</strong><br />
Puttalam Welfare Centres Revalidation - <strong>2006</strong> Page 15 of 47
Religion by District of Origin<br />
District Buddhist Hindu Islam Christian Anemist Total<br />
Jaffna 71 8,491 60 8,622 13.65%<br />
Mannar 47 54 45,159 354 45,614 72.24%<br />
Vavuniya 267 267 0.42%<br />
Mullaitivu 6,560 27 6,587 10.43%<br />
Kilinochchi 18 1,554 4 1,576 2.50%<br />
Batticaloa 4 84 14 102 0.16%<br />
Ampara 50 50 0.08%<br />
Trincomalee 19 202 2 223 0.35%<br />
Puttalam 93 93 0.15%<br />
Polonnaruwa 11 11 0.02%<br />
Total 47 166 62,378 554 63,145<br />
0.07% 0.26% 98.79% 0.88%<br />
0.26%<br />
98.79%<br />
0.88%<br />
0.07%<br />
Buddhist Christian Hindu Islam<br />
Welfare Centres Survey - Puttlam <strong>2006</strong><br />
Puttalam Welfare Centres Revalidation - <strong>2006</strong> Page 16 of 47
Education by Division of Displacement<br />
DS Division No<br />
Schooling<br />
Grade<br />
1 - 5<br />
Grade<br />
6 - 10<br />
Passed<br />
O/L NCGE<br />
Passed<br />
A/L HNCE<br />
Degree<br />
and Above<br />
Kalpitiya 6,150 8,287 12,573 4,967 2,611 233 34,821 55.14%<br />
Puttalam 3,566 4,339 7,961 3,155 1,772 201 20,994 33.25%<br />
Mundel 877 1,149 1,927 823 505 41 5,322 8.43%<br />
Vanathavilluwa 454 564 785 150 51 4 2,008 3.18%<br />
Total 11,047 14,339 23,246 9,095 4,939 479 63,145<br />
Grade 1 - 5<br />
Degree and Above<br />
17.49% 22.71% 36.81% 14.40% 7.82% 0.76%<br />
Passed O/L NCGE<br />
Grade 6 - 10<br />
Passed A/L HNCE<br />
Total<br />
No Schooling<br />
Welfare Centres Survey - Puttlam <strong>2006</strong><br />
Puttalam Welfare Centres Revalidation - <strong>2006</strong> Page 17 of 47
Education by District of Origin<br />
District No<br />
Schooling<br />
Grade<br />
1 - 5<br />
Grade<br />
6 - 10<br />
Passed<br />
O/L NCGE<br />
Passed<br />
A/L HNCE<br />
Degree<br />
and Above<br />
Mannar 7,983 9,997 16,418 6,787 4,001 428 45,614 72.24%<br />
Jaffna 1,511 2,112 3,561 1,025 387 26 8,622 13.65%<br />
Mullaitivu 1,133 1,631 2,338 1,016 445 24 6,587 10.43%<br />
Kilinochchi 271 387 634 208 76 1,576 2.50%<br />
Vavuniya 48 53 127 24 14 1 267 0.42%<br />
Trincomalee 47 74 76 18 8 223 0.35%<br />
Batticaloa 25 19 40 13 5 102 0.16%<br />
Puttalam 14 47 28 3 1 93 0.15%<br />
Ampara 13 18 17 1 1 50 0.08%<br />
Polonnaruwa 2 1 7 1 11 0.02%<br />
Total 11,047 14,339 23,246 9,095 4,939 479 63,145<br />
Grade 1 - 5<br />
Degree and Above<br />
17.49% 22.71% 36.81% 14.40% 7.82% 0.76%<br />
Passed O/L NCGE<br />
Grade 6 - 10<br />
Passed A/L HNCE<br />
Total<br />
No Schooling<br />
Welfare Centres Survey - Puttlam <strong>2006</strong><br />
Puttalam Welfare Centres Revalidation - <strong>2006</strong> Page 18 of 47
Vulnerability by Division of Displacement<br />
District Single<br />
headed HH<br />
at risk<br />
Unemployed<br />
Physically Mentally Unaccomp.<br />
challenged challenged minor<br />
(Disabled) (Disabled) Orphan<br />
Elderly<br />
without<br />
support<br />
Chronically<br />
ill<br />
Kalpitiya 936 3,171 755 337 0 124 369 5,692<br />
Puttalam 673 2,101 397 201 0 91 170 3,633<br />
Mundel 141 433 87 33 0 33 47 774<br />
Vanathavilluwa 80 191 33 9 0 4 15 332<br />
Total 1,830 5,896 1,272 580 0 252 601 10,431<br />
% of Total Vulnerable<br />
Single headed HH<br />
at risk<br />
Chronically ill<br />
17.5% 56.5% 12.2% 5.6% 0.0% 2.4% 5.8%<br />
% of Total Population 2.90% 9.34% 2.01% 0.92% 0.00% 0.40% 0.95% 16.52%<br />
Elderly without<br />
support<br />
Mentally challenged<br />
(Disabled)<br />
Unemployed<br />
Physically<br />
challenged<br />
(Disabled)<br />
Total<br />
Welfare Centres Survey - Puttlam <strong>2006</strong><br />
Puttalam Welfare Centres Revalidation - <strong>2006</strong> Page 19 of 47
Vulnerability by District of Origin<br />
District Single<br />
headed HH<br />
at risk<br />
Unemployed<br />
Physically Mentally Unaccomp.<br />
challenged challenged minor<br />
(Disabled) (Disabled) Orphan<br />
Elderly<br />
without<br />
support<br />
Chronically<br />
ill<br />
Mannar 1,269 4,487 917 498 0 177 431 7,779<br />
Jaffna 309 648 198 49 0 41 80 1,325<br />
Mullaitivu 181 576 110 23 0 20 74 984<br />
Kilinochchi 46 103 32 5 0 9 13 208<br />
Trincomalee 5 29 4 2 0 1 1 42<br />
Vavuniya 11 21 6 1 0 1 0 40<br />
Puttalam 5 14 3 2 0 2 1 27<br />
Batticaloa 3 14 1 0 0 1 1 20<br />
Ampara 0 4 1 0 0 0 0 5<br />
Polonnaruwa 1 0 0 0 0 0 0 1<br />
Total 1,830 5,896 1,272 580 0 252 601 10,431<br />
% of Total Vulnerable<br />
Single headed HH<br />
at risk<br />
Chronically ill<br />
17.5% 56.5% 12.2% 5.6% 0.0% 2.4% 5.8%<br />
% of Total Population 2.90% 9.34% 2.01% 0.92% 0.00% 0.40% 0.95% 16.52%<br />
Elderly without<br />
support<br />
Mentally challenged<br />
(Disabled)<br />
Unemployed<br />
Physically<br />
challenged<br />
(Disabled)<br />
Total<br />
Welfare Centres Survey - Puttlam <strong>2006</strong><br />
Puttalam Welfare Centres Revalidation - <strong>2006</strong> Page 20 of 47
Current Employment<br />
Population 18 yrs old and above<br />
1<br />
2<br />
3<br />
4<br />
5<br />
1<br />
2<br />
3<br />
1<br />
2<br />
3<br />
Category of<br />
Sex<br />
employment Female % Male % Total %<br />
Not employed 16,307 46.92 4,911 14.13 21,218 61.05<br />
Paid employment 757 2.18 9,865 28.38 10,622 30.56<br />
Own account worker 160 0.46 2,575 7.41 2,735 7.87<br />
Employer 13 0.04 78 0.22 91 0.26<br />
Unpaid family worker 41 0.12 48 0.14 89 0.26<br />
Total<br />
17,278 49.71 17,477 50.29 34,755<br />
Sector<br />
Sex<br />
of employment Female % Male % Total %<br />
Manufacturing 398 2.96 6,701 49.78 7,099 52.73<br />
Fishing 277 2.06 4,566 33.92 4,843 35.98<br />
Agriculture 288 2.14 1,232 9.15 1,520 11.29<br />
Total<br />
963 7.15 12,499 92.85 13,462<br />
Type<br />
Sex<br />
of employment Female % Male % Total %<br />
Seasonal 248 3.38 3,243 44.16 3,491 47.54<br />
Daily 178 2.42 2,340 31.87 2,518 34.29<br />
Permanent 146 1.99 1,188 16.18 1,334 18.17<br />
Total<br />
572 7.79 6,771 92.21 7,343<br />
2<br />
2<br />
2<br />
3<br />
3<br />
3 45<br />
Welfare Centres Survey - Puttlam <strong>2006</strong><br />
Puttalam Welfare Centres Revalidation - <strong>2006</strong> Page 21 of 47<br />
1<br />
1<br />
1
Employment Prior to Displacement<br />
1<br />
2<br />
3<br />
4<br />
5<br />
1<br />
2<br />
3<br />
4<br />
5<br />
6<br />
1<br />
2<br />
3<br />
Category of<br />
Sex<br />
employment Female % Male % Total %<br />
Not employed 6,999 44.86 1,578 10.11 8,577 54.98<br />
Paid employment 294 1.88 3,322 21.29 3,616 23.18<br />
Own account worker 264 1.69 3,008 19.28 3,272 20.97<br />
Employer 7 0.04 113 0.72 120 0.77<br />
Unpaid family worker 7 0.04 9 0.06 16 0.10<br />
Total<br />
7,571 48.53 8,030 51.47 15,601<br />
Sector<br />
Sex<br />
of employment Female % Male % Total %<br />
Manufacturing 239 3.48 3,299 47.98 3,538 51.45<br />
Agriculture 185 2.69 2,001 29.10 2,186 31.79<br />
Fishing 20 0.29 718 10.44 738 10.73<br />
Government sector 100 1.45 261 3.80 361 5.25<br />
Construction 45 0.65 45 0.65<br />
Mining 8 0.12 8 0.12<br />
Total<br />
544 7.91 6,332 92.09 6,876<br />
Type<br />
Sex<br />
of employment Female % Male % Total %<br />
Seasonal 235 3.38 3,074 44.20 3,309 47.58<br />
Daily 172 2.47 2,185 31.42 2,357 33.89<br />
Permanent 142 2.04 1,146 16.48 1,288 18.52<br />
Total<br />
549 7.89 6,405 92.11 6,954<br />
2<br />
2<br />
2<br />
3<br />
3<br />
3<br />
4 5<br />
5 6<br />
Welfare Centres Survey - Puttlam <strong>2006</strong><br />
Puttalam Welfare Centres Revalidation - <strong>2006</strong> Page 22 of 47<br />
1<br />
1<br />
1
Occupation by Division of Displacement<br />
Occupation Kalpitiya Mundel Puttalam<br />
Vanathavilluwa<br />
Total<br />
No occupation 10,132 1,438 7,123 616 19,309 30.58%<br />
Student 10,495 1,586 5,085 629 17,795 28.18%<br />
Housewife 6,710 1,033 4,011 378 12,132 19.21%<br />
Labour unskilled 4,282 804 2,340 238 7,664 12.14%<br />
Fisherman 974 14 167 31 1,186 1.88%<br />
Businessman 409 58 473 13 953 1.51%<br />
Farmer 414 94 146 58 712 1.13%<br />
Teacher 255 65 222 4 546 0.86%<br />
Driver 207 51 226 7 491 0.78%<br />
Tailor (Sewing/Knitting) 86 22 301 1 410 0.65%<br />
Mason 112 29 112 2 255 0.40%<br />
Factory worker 79 8 150 11 248 0.39%<br />
Salesperson 117 19 100 236 0.37%<br />
Religious person 78 22 51 1 152 0.24%<br />
Clerk 46 10 53 3 112 0.18%<br />
Craftsman 42 3 61 4 110 0.17%<br />
Trader 56 7 25 1 89 0.14%<br />
Baker 54 2 21 1 78 0.12%<br />
Pensioneer 27 2 45 1 75 0.12%<br />
Carpenter 31 16 25 2 74 0.12%<br />
Mechanic 31 7 28 66 0.10%<br />
Construction worker 36 5 22 63 0.10%<br />
Metal worker 4 3 45 52 0.08%<br />
Cook 13 3 28 44 0.07%<br />
plumber 22 2 15 1 40 0.06%<br />
Welfare Centres Survey - Puttlam <strong>2006</strong><br />
Puttalam Welfare Centres Revalidation - <strong>2006</strong> Page 23 of 47
Occupation Kalpitiya Mundel Puttalam<br />
Vanathavilluwa<br />
Total<br />
Painter 9 20 29 0.05%<br />
Manager 18 5 6 29 0.05%<br />
Cabinet maker 10 1 12 23 0.04%<br />
Electrician 10 3 9 22 0.03%<br />
Guard 4 1 9 1 15 0.02%<br />
Butcher 4 1 7 12 0.02%<br />
Pharmacist 6 1 5 12 0.02%<br />
Doctor-Medical 4 1 7 12 0.02%<br />
Architect 2 1 6 3 12 0.02%<br />
Health worker 8 4 12 0.02%<br />
Shoe maker 1 10 11 0.02%<br />
Hairdresser 7 4 11 0.02%<br />
Police Officer 4 3 2 1 10 0.02%<br />
Seaman 2 1 6 1 10 0.02%<br />
Computer operator 5 1 3 9 0.01%<br />
Technician 6 3 9 0.01%<br />
Jeweller 4 1 5 0.01%<br />
Engineer 1 3 4 0.01%<br />
Lawyer 1 1 2 0.00%<br />
Journolist 2 2 0.00%<br />
Interpreter 1 1 0.00%<br />
Brick maker 1 1 0.00%<br />
Total 34,821 5,322 20,994 2,008 63,145<br />
55.14% 8.43% 33.25%<br />
3.18%<br />
Welfare Centres Survey - Puttlam <strong>2006</strong><br />
Puttalam Welfare Centres Revalidation - <strong>2006</strong> Page 24 of 47
WELFARE CENTRES SURVEY<br />
PUTTLAM <strong>2006</strong><br />
- DURABLE SOLUTION -<br />
Puttalam Welfare Centres Revalidation - <strong>2006</strong> Page 25 of 47
Durable Solution by Division of Displacement<br />
Number of families<br />
Ds Division Retutn home Relocate Locally<br />
integrate<br />
Kalpitiya 281 8,211 8,492 54.86%<br />
Puttalam 249 4,927 5,176 33.44%<br />
Mundel 8 1,321 1,329 8.59%<br />
Vanathavilluwa 14 469 483 3.12%<br />
Total<br />
96.43%<br />
Total<br />
552 14,928 15,480<br />
3.57% 96.43%<br />
3.57%<br />
Locally integrate Return home<br />
Welfare Centres Survey - Puttlam <strong>2006</strong><br />
Puttalam Welfare Centres Revalidation - <strong>2006</strong> Page 26 of 47
Durable Solution by District of Origin<br />
Number of families<br />
District Retutn home Relocate Locally<br />
integrate<br />
Mannar 462 10,703 11,165 72.13%<br />
Jaffna 47 2,101 2,148 13.88%<br />
Mullaitivu 31 1,563 1,594 10.30%<br />
Kilinochchi 11 369 380 2.45%<br />
Vavuniya 1 65 66 0.43%<br />
Trincomalee 63 63 0.41%<br />
Puttalam 25 25 0.16%<br />
Batticaloa 24 24 0.16%<br />
Ampara 12 12 0.08%<br />
Polonnaruwa 3 3 0.02%<br />
Total<br />
Total<br />
552 14,928 15,480<br />
3.57% 96.43%<br />
96.43%<br />
3.57%<br />
Locally integrate Return home<br />
Welfare Centres Survey - Puttlam <strong>2006</strong><br />
Puttalam Welfare Centres Revalidation - <strong>2006</strong> Page 27 of 47
Main Obstacles for Return<br />
1<br />
2<br />
3<br />
4<br />
5<br />
6<br />
7<br />
8<br />
9<br />
10<br />
11<br />
12<br />
13<br />
14<br />
15<br />
16<br />
17<br />
18<br />
Security reasons<br />
Rate<br />
Obstacles 1 2 3 4 5 Total<br />
Lack of access road<br />
Lack of government support<br />
Lack of productive assets (tools)<br />
Lack of health facilities<br />
Lack of education facilities<br />
No access to water<br />
Landless<br />
Lack of rule of law<br />
Landmines<br />
Lack of assistance for rebuilding<br />
Lack of land for cultivation<br />
Ethnic imbalance<br />
Land not accessible<br />
Lack of market facilities<br />
Lack of information on area<br />
No access to skills training<br />
Lack of fishing facilities<br />
7<br />
6<br />
8<br />
5<br />
9<br />
376 56 11 7 5 455<br />
16 167 53 30 15 281<br />
11 28 47 60 46 192<br />
23 30 30 35 49 167<br />
2 23 39 45 54 163<br />
6 20 44 76 14 160<br />
11 24 89 22 9 155<br />
66 49 13 6 1 135<br />
3 29 33 30 26 121<br />
16 25 34 19 14 108<br />
0 13 17 27 21 78<br />
3 23 23 14 13 76<br />
5 12 31 15 7 70<br />
7 24 19 4 4 58<br />
4 5 12 5 4 30<br />
1 2 4 11 10 28<br />
2 4 8 6 7 27<br />
2 3 5 5 4 19<br />
Top 10 Obstacles<br />
10<br />
4<br />
3<br />
1<br />
Welfare Centres Survey - Puttlam <strong>2006</strong><br />
Puttalam Welfare Centres Revalidation - <strong>2006</strong> Page 28 of 47<br />
2
Main Obstacles for Local Integration<br />
1<br />
2<br />
3<br />
4<br />
5<br />
6<br />
7<br />
8<br />
9<br />
10<br />
11<br />
12<br />
13<br />
14<br />
15<br />
16<br />
17<br />
18<br />
Rate<br />
Obstacles 1 2 3 4 5 Total<br />
Lack of productive assets (tools) 2,612 1,767 1,419 1,193 1,355 8,346<br />
Lack of government support 1,218 2,543 1,787 1,529 1,152 8,229<br />
Lack of health facilities 863 2,157 2,343 1,592 759 7,714<br />
No access to water 3,001 1,584 1,051 638 447 6,721<br />
Lack of access road 1,590 1,222 1,023 923 440 5,198<br />
Landless 2,594 816 327 241 170 4,148<br />
Lack of education facilities 343 1,198 1,032 737 457 3,767<br />
Lack of market facilities 362 678 798 625 580 3,043<br />
No access to skills training 311 554 894 725 500 2,984<br />
Lack of assistance for rebuilding 153 354 903 587 431 2,428<br />
Lack of land for cultivation 206 334 435 448 294 1,717<br />
Security reasons 799 142 86 38 45 1,110<br />
Lack of fishing facilities 57 69 81 141 88 436<br />
Ethnic imbalance 13 17 19 51 39 139<br />
Land not accessible 0 2 0 0 0 2<br />
Lack of rule of law 0 1 0 0 0 1<br />
Landmines 0 0 0 0 0 0<br />
Lack of information on area 0 0 0 0 0 0<br />
6<br />
7<br />
5<br />
8<br />
9<br />
Top 10 Obstacles<br />
10<br />
4<br />
1<br />
3<br />
Welfare Centres Survey - Puttlam <strong>2006</strong><br />
Puttalam Welfare Centres Revalidation - <strong>2006</strong> Page 29 of 47<br />
2
WELFARE CENTRES SURVEY<br />
PUTTLAM <strong>2006</strong><br />
- INFORMATION ON<br />
PLACE OF DISPLACEMENT -<br />
Puttalam Welfare Centres Revalidation - <strong>2006</strong> Page 30 of 47
Possession of Land and House by Division of Displacement<br />
Land<br />
House<br />
Possess Possess<br />
Possess Possess<br />
Division of<br />
displacement<br />
Total families<br />
land<br />
Yes No<br />
valid documents<br />
Yes No<br />
house<br />
Yes No<br />
valid documents<br />
Yes No<br />
Kalpitiya 8,492 6,226 2,266 4,375 1,851 4,832 3,660 1,697 3,135<br />
Puttalam 5,176 3,875 1,301 3,202 673 2,949 2,227 1,044 1,905<br />
Mundel 1,329 1,032 297 702 330 871 458 176 695<br />
Vanathavilluwa 483 352 131 308 44 327 156 126 201<br />
Total<br />
16000<br />
14000<br />
12000<br />
10000<br />
8000<br />
6000<br />
4000<br />
2000<br />
0<br />
Total<br />
families<br />
15,480 11,485 3,995 8,587 2,898 8,979 6,501 3,043 5,936<br />
74.2% 25.8% 74.8% 25.2% 58.0% 42.0% 33.9% 66.1%<br />
No<br />
Yes<br />
Possess<br />
land<br />
No<br />
Yes<br />
Possess<br />
land<br />
documents<br />
No<br />
Yes<br />
Possess<br />
house<br />
No<br />
Yes<br />
Possess<br />
house<br />
documents<br />
Welfare Centres Survey - Puttlam <strong>2006</strong><br />
Puttalam Welfare Centres Revalidation - <strong>2006</strong> Page 31 of 47
Possession of Land and House by Division of Displacement<br />
durable solution - Local Integration<br />
Land<br />
House<br />
Possess Possess<br />
Possess Possess<br />
Division of<br />
displacement<br />
Total families<br />
land<br />
Yes No<br />
valid documents<br />
Yes No<br />
house<br />
Yes No<br />
valid documents<br />
Yes No<br />
Kalpitiya 8,211 6,032 2,179 4,205 1,827 4,686 3,525 1,626 3,060<br />
Puttalam 4,927 3,720 1,207 3,081 639 2,759 2,168 950 1,809<br />
Mundel 1,321 1,026 295 699 327 864 457 175 689<br />
Vanathavilluwa 469 340 129 296 44 313 156 119 194<br />
Total<br />
16000<br />
14000<br />
12000<br />
10000<br />
8000<br />
6000<br />
4000<br />
2000<br />
0<br />
Total<br />
families<br />
14,928 11,118 3,810 8,281 2,837 8,622 6,306 2,870 5,752<br />
74.5% 25.5% 74.5% 25.5% 57.8% 42.2% 33.3% 66.7%<br />
No<br />
Yes<br />
Possess<br />
land<br />
No<br />
Yes<br />
Possess<br />
land<br />
documents<br />
No<br />
Yes<br />
Possess<br />
house<br />
No<br />
Yes<br />
Possess<br />
house<br />
documents<br />
Welfare Centres Survey - Puttlam <strong>2006</strong><br />
Puttalam Welfare Centres Revalidation - <strong>2006</strong> Page 32 of 47
Kind of Documents to Prove Land Rights<br />
Division<br />
Outright<br />
deeds Lease Permit Grant Total<br />
Kalpitiya 4,268 12 70 25 4,375 50.95%<br />
Puttalam 3,116 6 49 31 3,202 37.29%<br />
Mundel 673 29 702 8.18%<br />
Vanathavilluwa 286 6 16 308 3.59%<br />
Total 8,343 18 125 101 8,587<br />
0.21%<br />
97.16% 0.21% 1.46%<br />
1.18%<br />
1.46%<br />
1.18%<br />
97.16%<br />
Grant Lease Outright deeds Permit<br />
Welfare Centres Survey - Puttlam <strong>2006</strong><br />
Puttalam Welfare Centres Revalidation - <strong>2006</strong> Page 33 of 47
Acquirement of Land<br />
Division Bought Donated Inherited No Answer Total<br />
Kalpitiya 4,314 145 11 1,756 6,226 54.21%<br />
Puttalam 3,025 193 14 643 3,875 33.74%<br />
Mundel 672 33 2 325 1,032 8.99%<br />
Vanathavilluwa 293 17 1 41 352 3.06%<br />
Total 8,304 388 28 2,765 11,485<br />
72.30% 3.38% 0.24%<br />
24.07%<br />
72.30%<br />
24.07%<br />
0.24%<br />
Bought Donated Inherited No Answer<br />
3.38%<br />
Welfare Centres Survey - Puttlam <strong>2006</strong><br />
Puttalam Welfare Centres Revalidation - <strong>2006</strong> Page 34 of 47
Type of House<br />
DS Division Permanent Semi<br />
Permanent<br />
Temporary Total<br />
Kalpitiya 382 1,081 3,368 4,831 53.81%<br />
Puttalam 610 931 1,408 2,949 32.85%<br />
Mundel 92 159 620 871 9.70%<br />
Vanathavilluwa 9 61 257 327 3.64%<br />
Total<br />
12.17%<br />
24.86%<br />
1,093 2,232 5,653 8,978<br />
12.17% 24.86% 62.97%<br />
62.97%<br />
Permanent Semi permanent Temporary<br />
Welfare Centres Survey - Puttlam <strong>2006</strong><br />
Puttalam Welfare Centres Revalidation - <strong>2006</strong> Page 35 of 47
Water Source<br />
DS Division<br />
Private<br />
well<br />
Common<br />
well<br />
Private<br />
pipe<br />
Common<br />
pipe<br />
Not<br />
available Total<br />
Kalpitiya 1,404 3,093 1,465 1,001 1421 8,384 55.03%<br />
Puttalam 477 1,602 472 1,502 1014 5,067 33.26%<br />
Mundel 256 370 81 401 205 1,313 8.62%<br />
Vanathavilluwa 14 159 19 20 259 471 3.09%<br />
Total 2,151 5,224 2,037 2,924 2899 15,235<br />
19.19%<br />
14.12%<br />
14.12% 34.29% 13.37% 19.19%<br />
34.29%<br />
13.37%<br />
19.03%<br />
19.03%<br />
Common pipe Common well Not available Private pipe Private well<br />
Welfare Centres Survey - Puttlam <strong>2006</strong><br />
Puttalam Welfare Centres Revalidation - <strong>2006</strong> Page 36 of 47
Latrines<br />
DS Division<br />
Common/<br />
Public Sharing Private<br />
Not<br />
available Total<br />
Kalpitiya 942 1,797 3,056 8,402 54.99%<br />
2607<br />
Puttalam 326 1,146 2,307 1312 5,091 33.32%<br />
Mundel 148 173 627 367 1,315 8.61%<br />
Vanathavilluwa 56 66 127 221 470 3.08%<br />
Total 1,472 3,182 6,117 4507 15,278<br />
9.63%<br />
29.50%<br />
9.63% 20.83% 40.04%<br />
20.83%<br />
29.50%<br />
40.04%<br />
Common/Public Not available Private Sharing<br />
Welfare Centres Survey - Puttlam <strong>2006</strong><br />
Puttalam Welfare Centres Revalidation - <strong>2006</strong> Page 37 of 47
WELFARE CENTRES SURVEY<br />
PUTTLAM <strong>2006</strong><br />
- INFORMATION ON<br />
PLACE OF ORIGIN -<br />
Puttalam Welfare Centres Revalidation - <strong>2006</strong> Page 38 of 47
Possession of Land and House by District of Origin<br />
Land<br />
House<br />
Possess Possess<br />
Possess Possess<br />
District of<br />
origin<br />
Total families<br />
land<br />
Yes No<br />
valid documents<br />
Yes No<br />
house<br />
Yes No<br />
valid documents<br />
Yes No<br />
Mannar 11,165 4,733 6,432 1,923 2,810 2,277 8,888 695 1,582<br />
Jaffna 2,148 592 1,556 151 441 205 1,943 42 163<br />
Mullaitivu 1,594 658 936 343 315 270 1,324 90 180<br />
Kilinochchi 380 147 233 49 98 60 320 10 50<br />
Vavuniya 66 27 39 8 19 12 54 3 9<br />
Trincomalee 63 16 47 7 9 6 57 2 4<br />
Puttalam 25 8 17 2 6 1 24 0 1<br />
Batticaloa 24 6 18 1 5 6 18 1 5<br />
Ampara 12 2 10 0 2 1 11 0 1<br />
Polonnaruwa 3 1 2 0 1 1 2 0 1<br />
Total<br />
16000<br />
14000<br />
12000<br />
10000<br />
8000<br />
6000<br />
4000<br />
2000<br />
0<br />
Total<br />
families<br />
15,480 6,190 9,290 2,484 3,706 2,839 12,641 843 1,996<br />
No<br />
Yes<br />
Possess<br />
land<br />
40.0% 60.0% 40.1% 59.9% 18.3% 81.7% 29.7% 70.3%<br />
No<br />
Yes<br />
Possess<br />
land<br />
documents<br />
No<br />
Yes<br />
Possess<br />
house<br />
No<br />
Yes<br />
Possess<br />
house<br />
documents<br />
Welfare Centres Survey - Puttlam <strong>2006</strong><br />
Puttalam Welfare Centres Revalidation - <strong>2006</strong> Page 39 of 47
Possession of Land and House by District of Origin<br />
durable solution - Return home<br />
Land<br />
House<br />
Possess Possess<br />
Possess Possess<br />
District of<br />
origin<br />
Total families<br />
land<br />
Yes No<br />
valid documents<br />
Yes No<br />
house<br />
Yes No<br />
valid documents<br />
Yes No<br />
Mannar 462 305 157 108 197 110 352 36 74<br />
Jaffna 47 40 7 3 37 2 45 0 2<br />
Mullaitivu 31 16 15 12 4 7 24 5 2<br />
Kilinochchi 11 9 2 5 4 1 10 0 1<br />
Vavuniya 1 1 0 0 1 1 0 0 1<br />
Total<br />
600<br />
500<br />
400<br />
300<br />
200<br />
100<br />
0<br />
Total<br />
families<br />
552 371 181 128 243 121 431 41 80<br />
No<br />
Yes<br />
Possess<br />
land<br />
67.2% 32.8% 34.5% 65.5% 21.9% 78.1% 33.9% 66.1%<br />
No<br />
No<br />
Yes Yes<br />
Possess<br />
land<br />
documents<br />
Possess<br />
house<br />
No<br />
Yes<br />
Possess<br />
house<br />
documents<br />
Welfare Centres Survey - Puttlam <strong>2006</strong><br />
Puttalam Welfare Centres Revalidation - <strong>2006</strong> Page 40 of 47
Kind of Documents to Prove Land Rights<br />
District<br />
Outright<br />
deeds Lease Permit Grant Total<br />
Mannar 1,794 7 54 37 1,892 77.29%<br />
Mullaitivu 307 1 27 6 341 13.93%<br />
Jaffna 139 6 3 148 6.05%<br />
Kilinochchi 43 6 49 2.00%<br />
Vavuniya 7 1 8 0.33%<br />
Trincomalee 7 7 0.29%<br />
Puttalam 2 2 0.08%<br />
Batticaloa 1 1 0.04%<br />
Total 2,300 8 94 46 2,448<br />
0.33%<br />
1.88%<br />
93.95% 0.33% 3.84%<br />
3.84%<br />
93.95%<br />
1.88%<br />
Grant Lease Outright deeds Permit<br />
Welfare Centres Survey - Puttlam <strong>2006</strong><br />
Puttalam Welfare Centres Revalidation - <strong>2006</strong> Page 41 of 47
Status of Land<br />
District Available In HSZ<br />
Occupied<br />
by other Landmines<br />
In buffer<br />
zone n/a Total<br />
Mannar 1,687 206 308 57 3 2472 4,733 76.46%<br />
Mullaitivu 272 57 84 5 7 233 658 10.63%<br />
Jaffna 128 20 44 8 1 391 592 9.56%<br />
Kilinochchi 58 8 11 1 69 147 2.37%<br />
Vavuniya 10 1 1 15 27 0.44%<br />
Trincomalee 3 1 4 8 16 0.26%<br />
Puttalam 2 6 8 0.13%<br />
Batticaloa 1 1 4 6 0.10%<br />
Ampara 2 2 0.03%<br />
Polonnaruwa 1 1 0.02%<br />
Total 2,161 294 452 71 11 3201 6,190<br />
34.91%<br />
34.91% 4.75% 7.30% 1.15%<br />
7.30%<br />
0.18%<br />
0.18%<br />
4.75%<br />
1.15%<br />
51.71%<br />
51.71%<br />
Available In buffer zone In HSZ Landmines n/a Occupied by other<br />
Welfare Centres Survey - Puttlam <strong>2006</strong><br />
Puttalam Welfare Centres Revalidation - <strong>2006</strong> Page 42 of 47
Type of House - District of Origin<br />
District Permanent Semi<br />
Permanent<br />
Temporary Total<br />
Mannar 1,115 362 635 2,112 80.58%<br />
Mullaitivu 145 40 61 246 9.39%<br />
Jaffna 117 23 43 183 6.98%<br />
Kilinochchi 40 7 9 56 2.14%<br />
Vavuniya 6 3 2 11 0.42%<br />
Trincomalee 2 2 1 5 0.19%<br />
Batticaloa 4 1 5 0.19%<br />
Polonnaruwa 1 1 0.04%<br />
Puttalam 1 1 0.04%<br />
Ampara 1 1 0.04%<br />
Total<br />
54.52%<br />
1,429 439<br />
753 2,621<br />
54.52% 16.75% 28.73%<br />
28.73%<br />
16.75%<br />
Permanent Semi permanent Temporary<br />
Welfare Centres Survey - Puttlam <strong>2006</strong><br />
Puttalam Welfare Centres Revalidation - <strong>2006</strong> Page 43 of 47
WELFARE CENTRES SURVEY<br />
PUTTLAM <strong>2006</strong><br />
- MAPS -<br />
Puttalam Welfare Centres Revalidation - <strong>2006</strong> Page 44 of 47
Kalpitiya<br />
Puttalam<br />
Mahakumbukkadawala<br />
Mundel<br />
Arachchikattuwa<br />
Chilaw<br />
Madampe<br />
Mahawewa<br />
Nattandiya<br />
Dankotuwa<br />
Wennappuwa<br />
IDPs in Puttalam District as per Welfare Centres Revalidation<br />
Preferred Durable Solutions by Division of Displacement<br />
Pallama<br />
The boundaries and names shown and the designations used on this map do not imply official endorsement or acceptance by the United Nations.<br />
�������������������������<br />
Anamaduwa<br />
Vanathavilluwa<br />
Karuwalagaswewa<br />
Nawagattegama<br />
Durable Solution<br />
Locally integrate - 14,982<br />
Return home - 552<br />
Number of Families<br />
8,492<br />
5,176<br />
1,329<br />
483<br />
Total Families : 15,480<br />
Total Individuals: 63,145<br />
<strong>UNHCR</strong><br />
GIS Unit<br />
Sri Lanka<br />
Sources: Puttalam Welfare Centres Revalidation March <strong>2006</strong><br />
Puttalam Welfare Centres Revalidation - <strong>2006</strong> Page 45 of 47<br />
WC Survey by Durable Solution.Wor
�������������������������<br />
IDPs in Puttalam District as per Welfare Centres Revalidation<br />
Preferred Durable Solutions by District of Origin<br />
25<br />
25<br />
PUTTALAM<br />
PUTTALAM<br />
PUTTALAM<br />
2,148 2,148 2,148<br />
2,148<br />
JAFFNA JAFFNA JAFFNA<br />
JAFFNA<br />
KILINOCHCHI<br />
KILINOCHCHI<br />
11,165<br />
11,165<br />
GAMPAHA<br />
GAMPAHA<br />
MANNAR<br />
MANNAR<br />
COLOMBO<br />
COLOMBO<br />
COLOMBO<br />
COLOMBO<br />
COLOMBO<br />
KURUNEGALA<br />
KURUNEGALA<br />
KALUTARA<br />
KALUTARA<br />
KEGALLE KEGALLE<br />
KEGALLE<br />
GALLE<br />
GALLE GALLE<br />
66<br />
66<br />
380<br />
380 380<br />
MULLAITIVU<br />
MULLAITIVU<br />
MULLAITIVU<br />
1,594<br />
1,594<br />
VAVUNIYA<br />
VAVUNIYA<br />
VAVUNIYA<br />
ANURADHAPURA<br />
ANURADHAPURA<br />
ANURADHAPURA<br />
MATARA MATARA<br />
MATARA<br />
MATALE<br />
MATALE<br />
KANDY<br />
KANDY<br />
RATNAPURA<br />
RATNAPURA<br />
RATNAPURA<br />
RATNAPURA<br />
NUWARA<br />
NUWARA<br />
ELIYA<br />
ELIYA<br />
The boundaries and names shown and the designations used on this map do not imply official endorsement or acceptance by the United Nations.<br />
63 63<br />
63<br />
TRINCOMALEE<br />
TRINCOMALEE<br />
POLONNARUWA<br />
POLONNARUWA<br />
333<br />
BADULLA<br />
BADULLA<br />
MONERAGALA<br />
MONERAGALA<br />
MONERAGALA<br />
HAMBANTOTA<br />
HAMBANTOTA<br />
Durable Solution<br />
Locally integrate - 14,928<br />
Return home - 552<br />
Number of Families<br />
BATTICALOA<br />
BATTICALOA<br />
BATTICALOA<br />
BATTICALOA<br />
2,200 to 11,165<br />
1,600 to 2,200<br />
500 to 1,600<br />
100 to 500<br />
1 to 100<br />
24<br />
24 24<br />
12<br />
12<br />
AMPARA<br />
AMPARA<br />
Total Families : 15,480<br />
Total Individuals: 63,145<br />
<strong>UNHCR</strong><br />
GIS Unit<br />
Sri Lanka<br />
Sources: Puttalam Welfare Centres Revalidation March <strong>2006</strong><br />
Puttalam Welfare Centres Revalidation - <strong>2006</strong> Page 46 of 47<br />
WC Survey by Durable Solution.Wor
Kalpitiya<br />
Puttalam<br />
Mahakumbukkadawala<br />
Mundel<br />
Arachchikattuwa<br />
Chilaw<br />
Madampe<br />
Mahawewa<br />
Nattandiya<br />
Dankotuwa<br />
Wennappuwa<br />
8,211<br />
8,211<br />
8,211<br />
8,211<br />
1,321<br />
1,321<br />
1,321<br />
1,321<br />
469<br />
469<br />
469<br />
469<br />
4,927 4,927 4,927<br />
4,927<br />
4,927<br />
4,927 4,927<br />
Pallama<br />
Anamaduwa<br />
Vanathavilluwa<br />
Karuwalagaswewa<br />
Nawagattegama<br />
The boundaries and names shown and the designations used on this map do not imply official endorsement or acceptance by the United Nations.<br />
Puttalam Welfare Centres Revalidation <strong>2006</strong><br />
Possession of Land and House for Local Integration in Puttalam Distriction<br />
LAND HOUSE<br />
Kalpitiya<br />
Puttalam<br />
Mahakumbukkadawala<br />
Mundel<br />
Arachchikattuwa<br />
Chilaw<br />
Madampe<br />
Mahawewa<br />
Nattandiya<br />
Dankotuwa<br />
Wennappuwa<br />
8,211<br />
8,211<br />
8,211<br />
1,321<br />
1,321 1,321 1,321<br />
1,321 1,321<br />
469<br />
469<br />
469 469<br />
4,927 4,927<br />
4,927 4,927 4,927<br />
4,927 4,927<br />
Pallama<br />
Anamaduwa<br />
Vanathavilluwa<br />
Karuwalagaswewa<br />
Nawagattegama<br />
�������������������������<br />
Total Families for<br />
Local Integration: 14,928<br />
Families for Local Integration<br />
8,211<br />
4,927<br />
1,321<br />
469<br />
Possession of Land<br />
No Land Available<br />
Land Available with Documents<br />
Land Available - No Documents<br />
Possession of House<br />
<strong>UNHCR</strong><br />
GIS Unit<br />
Sri Lanka<br />
No House Available<br />
House Available wit Documents<br />
House Available - No Documents<br />
Puttalam Welfare Centres Revalidation March <strong>2006</strong><br />
Land anD House by Division of Displacement.Wor
DRAFT – Not for Circulation<br />
Annex 1<br />
Final Report on the <strong>2006</strong> Revalidation of the Puttalam Welfare Centre Survey:<br />
Comparison of <strong>2006</strong> and 2004 Survey Results<br />
� Basic Demographic Information<br />
<strong>2006</strong> Survey<br />
15,480 families (63,145 individuals) in 141<br />
Locations<br />
Population Distribution by Division of<br />
Displacement:<br />
• 55% in Kalpitiya<br />
• 3% in Vanathavilluwa<br />
• 33% in Puttalam<br />
• 8% in Mundel<br />
Population Distribution by Place of Origin:<br />
• 14% Jaffna<br />
• 72% Mannar<br />
• 10% Mullaitivu<br />
• 3% Kilinochchi<br />
• Other Districts of Origin: Vavuniya,<br />
Batti, Ampara, Trinco, Polonnaruwa,<br />
Puttalam<br />
61% Unemployed<br />
2004 Survey<br />
14,493 families (61,763 individuals) in 123<br />
Locations<br />
Population Distribution by Division of<br />
Displacement:<br />
• 58% in Kalpitiya<br />
• 3% in Vanathavilluwa<br />
• 30% in Puttalam<br />
• 8% in Mundel<br />
Population Distribution by Place of Origin:<br />
• 13% Jaffna<br />
• 72% Mannar<br />
• 12% Mullaitivu<br />
• 3% Kilinochchi<br />
• Other Districts of Origin: Vavuniya,<br />
Batti, Ampara, Trinco<br />
64% Unemployed<br />
1
DRAFT – Not for Circulation<br />
Annex 1<br />
Final Report on the <strong>2006</strong> Revalidation of the Puttalam Welfare Centre Survey:<br />
Comparison of <strong>2006</strong> and 2004 Survey Results<br />
� Summary of Findings: Puttalam (Place of Displacement)<br />
<strong>2006</strong> Survey<br />
74% possess land in Puttalam (11,485 families)<br />
� 72% of those with land in Puttalam<br />
purchased the land (8,304 families)<br />
75% of landowners have documents for land in<br />
Puttalam (8,587 families)<br />
� 97% outright deeds<br />
� 1.5% permits<br />
� 1% grants<br />
� 0.5% leases<br />
* In <strong>2006</strong>, respondents were asked to show their<br />
Puttalam land documentation to enumerators<br />
Land ownership by District of Displacement:<br />
• Kalpitiya: 73% (52% have documents)<br />
• Mundel: 78% (53% have documents)<br />
• Puttalam: 75% (62% have documents)<br />
• Vanathavilluwa: 73% (64% have<br />
documents)<br />
Displacement:<br />
• Average years since first displacement<br />
- 16<br />
• Average years in current place of<br />
displacement – 10<br />
Voting Location:<br />
• 1,814 vote in Puttalam<br />
• 29,565 vote in place of origin<br />
Type of House in Puttalam<br />
� Permanent – 12%<br />
� Semi-permanent – 25%<br />
� Temporary – 63%<br />
2004 Survey<br />
70% possess land in Puttalam (10,172 families)<br />
85% of landowners have documents for land in<br />
Puttalam (8,625 families)<br />
(type of documents not available)<br />
Land ownership by District of Displacement:<br />
• Kalpitiya: 70% (79% have documents)<br />
• Mundel: 74% (90% have documents)<br />
• Puttalam: 70% (94% have documents)<br />
• Vanathavilluwa: 75% (83% have<br />
documents)<br />
N/A<br />
N/A<br />
N/A<br />
2
DRAFT – Not for Circulation<br />
Annex 1<br />
Final Report on the <strong>2006</strong> Revalidation of the Puttalam Welfare Centre Survey:<br />
Comparison of <strong>2006</strong> and 2004 Survey Results<br />
� Summary of Findings: Place of Origin<br />
<strong>2006</strong> Survey<br />
42% possess land in place of origin<br />
40% of landowners have documents for land in<br />
place of origin<br />
Status of land in place of origin:<br />
• 14% Available<br />
• 2% in HSZ<br />
• 3% Occupied by another<br />
• 0.5% Landmines<br />
Number of families who have members who<br />
have returned to their place of origin: 116<br />
2004 Survey<br />
61% possess land in place of origin<br />
81% of landowners have documents for land in<br />
place of origin<br />
Status of land in place of origin:<br />
• 35% Available<br />
• 7% in HSZ<br />
• 10% Occupied by another<br />
• 7% Landmines<br />
N/A<br />
3
DRAFT – Not for Circulation<br />
Annex 1<br />
Final Report on the <strong>2006</strong> Revalidation of the Puttalam Welfare Centre Survey:<br />
Comparison of <strong>2006</strong> and 2004 Survey Results<br />
� Durable Solution Information<br />
<strong>2006</strong> Survey<br />
Preferred Durable Solution:<br />
� Locally integrate – 96%<br />
� Return home – 4%<br />
Key Obstacles for Return:<br />
� Security reasons<br />
� Lack of access road<br />
� No access to water<br />
� Lack of education facilities<br />
� Lack of health facilities<br />
Key Obstacles for Local Integration:<br />
� No access to water<br />
� Lack of government support<br />
� Lack of health facilities<br />
� Lack of productive assets<br />
� Lack of access road<br />
� Landless<br />
Respondents wishing to locally integrate and<br />
who possess land in Puttalam – 75% (11,118<br />
families)<br />
Respondents wishing to return home who<br />
possess land in their place of origin – 68% (371<br />
families)<br />
2004 Survey<br />
Preferred Durable Solution:<br />
� Return home immediately – 2%<br />
� Return home in the future – 59%<br />
� Locally integrate – 38%<br />
Key Obstacles for Return:<br />
� Security reasons<br />
� Infrastructure facilities<br />
� Lack of employment/income<br />
� Landlessness<br />
Assistance Required to Locally Integrate:<br />
� Building material<br />
� Self-employment facilities<br />
� Water facilities<br />
� Health Facilities<br />
Respondents wishing to locally integrate and<br />
who possess land in Puttalam – 73% (4,402<br />
families)<br />
Respondents wishing to return home<br />
immediately and who possess land in their<br />
place of origin – 72% (234 families)<br />
Respondents wishing to return home in the<br />
future and who possess land in the place of<br />
origin – 65% (5,542 families)<br />
4