Georgian Court University Honor Roll of Donors
Georgian Court University Honor Roll of Donors
Georgian Court University Honor Roll of Donors

Create successful ePaper yourself
Turn your PDF publications into a flip-book with our unique Google optimized e-Paper software.
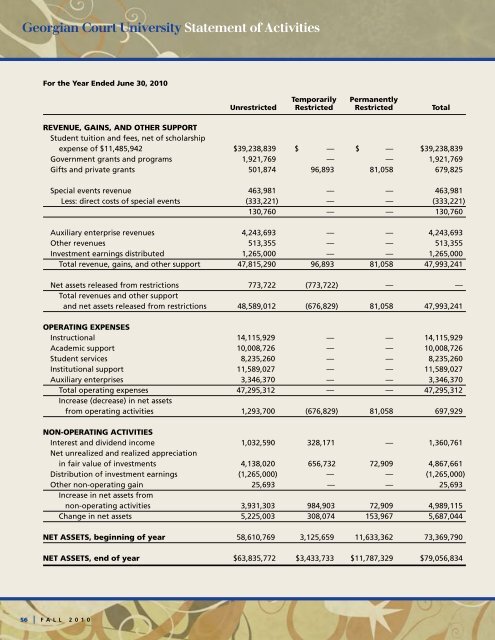
<strong>Georgian</strong> <strong>Court</strong> <strong>University</strong> Statement <strong>of</strong> Activities<br />
For the Year Ended June 30, 2010<br />
56 | F ALL 2010<br />
Temporarily Permanently<br />
Unrestricted Restricted Restricted Total<br />
REVENUE, GAINS, AND OTHER SUPPORT<br />
Student tuition and fees, net <strong>of</strong> scholarship<br />
expense <strong>of</strong> $11,485,942 $39,238,839 $ — $ — $39,238,839<br />
Government grants and programs 1,921,769 — — 1,921,769<br />
Gifts and private grants 501,874 96,893 81,058 679,825<br />
Special events revenue 463,981 — — 463,981<br />
Less: direct costs <strong>of</strong> special events (333,221) — — (333,221)<br />
130,760 — — 130,760<br />
Auxiliary enterprise revenues 4,243,693 — — 4,243,693<br />
Other revenues 513,355 — — 513,355<br />
Investment earnings distributed 1,265,000 — — 1,265,000<br />
Total revenue, gains, and other support 47,815,290 96,893 81,058 47,993,241<br />
Net assets released from restrictions 773,722 (773,722) — —<br />
Total revenues and other support<br />
and net assets released from restrictions 48,589,012 (676,829) 81,058 47,993,241<br />
OPERATING EXPENSES<br />
Instructional 14,115,929 — — 14,115,929<br />
Academic support 10,008,726 — — 10,008,726<br />
Student services 8,235,260 — — 8,235,260<br />
Institutional support 11,589,027 — — 11,589,027<br />
Auxiliary enterprises 3,346,370 — — 3,346,370<br />
Total operating expenses 47,295,312 — — 47,295,312<br />
Increase (decrease) in net assets<br />
from operating activities 1,293,700 (676,829) 81,058 697,929<br />
NON-OPERATING ACTIVITIES<br />
Interest and dividend income 1,032,590 328,171 — 1,360,761<br />
Net unrealized and realized appreciation<br />
in fair value <strong>of</strong> investments 4,138,020 656,732 72,909 4,867,661<br />
Distribution <strong>of</strong> investment earnings (1,265,000) — — (1,265,000)<br />
Other non-operating gain 25,693 — — 25,693<br />
Increase in net assets from<br />
non-operating activities 3,931,303 984,903 72,909 4,989,115<br />
Change in net assets 5,225,003 308,074 153,967 5,687,044<br />
NET ASSETS, beginning <strong>of</strong> year 58,610,769 3,125,659 11,633,362 73,369,790<br />
NET ASSETS, end <strong>of</strong> year $63,835,772 $3,433,733 $11,787,329 $79,056,834