fao:value chain analysis: a case study of mangoes in kenya
fao:value chain analysis: a case study of mangoes in kenya
fao:value chain analysis: a case study of mangoes in kenya

You also want an ePaper? Increase the reach of your titles
YUMPU automatically turns print PDFs into web optimized ePapers that Google loves.
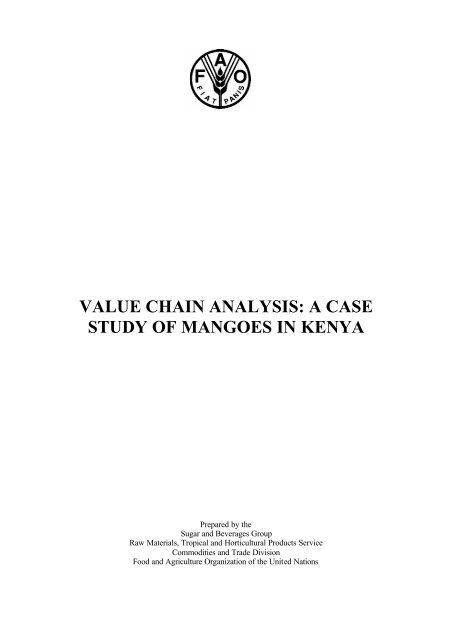
VALUE CHAIN ANALYSIS: A CASE<br />
STUDY OF MANGOES IN KENYA<br />
Prepared by the<br />
Sugar and Beverages Group<br />
Raw Materials, Tropical and Horticultural Products Service<br />
Commodities and Trade Division<br />
Food and Agriculture Organization <strong>of</strong> the United Nations
2<br />
Table <strong>of</strong> Contents<br />
Page<br />
I. INTRODUCTION 3<br />
II. MANGO PRODUCTION, MARKETING AND PROCESSING 4<br />
III. FACTORS PREVENTING THE DEVELOPMENT OF THE MANGO SUPPLY CHAIN 9<br />
IV. CONCLUSIONS AND RECOMMENDATIONS 10
3<br />
I. INTRODUCTION<br />
This document reviews fruit production and yield trends, mango production, market<strong>in</strong>g and<br />
process<strong>in</strong>g <strong>of</strong> smallholders and traders along the mango <strong>value</strong> <strong>cha<strong>in</strong></strong> <strong>in</strong> Kenya. It also exam<strong>in</strong>es future<br />
development prospects.<br />
The horticultural sub-sector <strong>in</strong> Kenya comprises ma<strong>in</strong>ly fruits, vegetables and cut flowers, and<br />
accounts for about 10 percent <strong>of</strong> urban food consumption and a much larger percentage <strong>in</strong> rural areas.<br />
Vegetables dom<strong>in</strong>ate horticultural production, followed by fruits and cut flowers. In 2003, a total area <strong>of</strong><br />
373 000 hectares was dedicated to horticultural production, produc<strong>in</strong>g 4.35 million tonnes <strong>of</strong> horticultural<br />
products, <strong>value</strong>d at US$494.4 million. The contribution to Gross Domestic Product (GDP) was 3.5 percent<br />
and 14.5 percent to Agric ultural Gross Domestic Product 1 . However, the <strong>value</strong> <strong>of</strong> production was lower<br />
than that <strong>of</strong> 2002 and 2001 which were US$503.6 million and US$528.4 million, respectively. The subsector<br />
also provides employment to a large number <strong>of</strong> Kenyans, currently estimated at 2 million, both<br />
direct and <strong>in</strong>direct jobs.<br />
Table 1: Percentage <strong>of</strong> cultivated area, volume <strong>of</strong> production and <strong>value</strong> <strong>of</strong> horticultural products<br />
(2003)<br />
% cultivated area %Volume <strong>of</strong> production % Value <strong>of</strong> Production<br />
Vegetables 59 55 57<br />
Fruits 40 44.8 32<br />
Cut flowers 1 0.2 11<br />
Fruit and vegetables are also important sources <strong>of</strong> foreign exchange earn<strong>in</strong>gs, which ranged<br />
between US$260 and US$350 million <strong>in</strong> recent years, rank<strong>in</strong>g second to tea, and account<strong>in</strong>g for 21<br />
percent <strong>of</strong> total domestic exports <strong>in</strong> 2003. Mango has been the third most important fruit <strong>in</strong> terms <strong>of</strong> area<br />
and total production over the last ten years with bananas (<strong>in</strong>clud<strong>in</strong>g planta<strong>in</strong>s) and p<strong>in</strong>eapples as number<br />
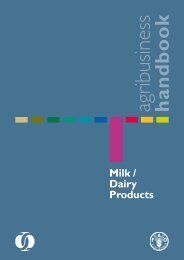
one and number two respectively <strong>in</strong> terms <strong>of</strong> production. Production trends are presented <strong>in</strong> Figures 1 and<br />
2. The output <strong>of</strong> <strong>mangoes</strong>, avocados and passion fruits has <strong>in</strong>creased rapidly, while output shares <strong>of</strong><br />
bananas and p<strong>in</strong>eapples have decl<strong>in</strong>ed.<br />
Figure 1: Production <strong>of</strong> <strong>mangoes</strong>, avocado, passion fruit and papaya (1992-2003)<br />
200,000<br />
Production (Tons)<br />
150,000<br />
100,000<br />
50,000<br />
-<br />
1992<br />
1993<br />
1994<br />
1995<br />
1996<br />
1997<br />
1998<br />
1999<br />
2000<br />
2001<br />
2002<br />
2003<br />
Mango<br />
Avocado<br />
Passion<br />
Pawpaw<br />
Year<br />
1<br />
In 2003, national GDP was estimated at US$14.2 billion, while Agricultural GDP was about US$3.4 billion.
4<br />
Figure 2: Value <strong>of</strong> major fruits grown <strong>in</strong> Kenya as a percent <strong>of</strong> total <strong>value</strong>, 2002 - 2003<br />
Share <strong>of</strong> Total Value<br />
50%<br />
45%<br />
40%<br />
35%<br />
30%<br />
25%<br />
20%<br />
15%<br />
10%<br />
5%<br />
0%<br />
Value 2002<br />
Value 2003<br />
Bananas<br />
P<strong>in</strong>eapples<br />
Mangoes<br />
Citrus<br />
Pawpaws<br />
Avocadoes<br />
Passion fruits<br />
Other fruits<br />
Fruit<br />
Source: Based on statistics from HCDA/MOA.<br />
II.<br />
MANGO PRODUCTION, MARKETING AND PROCESSING<br />
Mango output <strong>in</strong> Kenya has <strong>in</strong>creased steadily over the past decade as yields have improved to the<br />
current level <strong>of</strong> 10 tonnes per hectare (Figure 3).<br />
Figure 3: Yields (tonnes/ha.) <strong>of</strong> mango and passion fruits (1992-2003)<br />
14.00<br />
12.00<br />
Yield (Tons/Ha)<br />
10.00<br />
8.00<br />
6.00<br />
4.00<br />
2.00<br />
0.00<br />
Mango<br />
Passion<br />
1992<br />
1993<br />
1994<br />
1995<br />
1996<br />
1997<br />
1998<br />
1999<br />
2000<br />
2001<br />
2002<br />
2003<br />
Year<br />
In 2003, mango production was estimated at more than 183 000 tonnes (Table 2). Eastern<br />
Prov<strong>in</strong>ce accounted for 54 percent, Coast Prov<strong>in</strong>ce for 22 percent and Nyanza Prov<strong>in</strong>ce for 8 percent.
5<br />
Table 2: Mango production 2002/2003 by prov<strong>in</strong>ce<br />
Hectares (Ha)<br />
Production (MT)<br />
PROVINCE 2002 2003 2002 2003<br />
Central 650 749 5,224 6,577<br />
Coast 8,240 7,920 42,946 41,145<br />
Eastern 4,668 4,750 91,521 99,730<br />
Western 966 986 8,913 9,248<br />
Nyanza 1,258 1,850 16,806 13,837<br />
Rift Valley 566 683 6,579 8,337<br />
N/Eastern 325 330 4,515 4,612<br />
Total 16,673 17,268 176,504 183,486<br />
Source: M<strong>in</strong>istry <strong>of</strong> Agriculture Annual Reports, 2002/2003<br />
Two types <strong>of</strong> mango are grown <strong>in</strong> Kenya, the local and the exotic or improved varieties. The latter<br />
are usually grafted on local <strong>mangoes</strong> and are grown for the export market. Most local varieties tend to<br />
have high fibre content, commonly referred to as “str<strong>in</strong>gy”, and this characteristic makes them unpopular<br />
for fresh consumption. The local mango varieties are usually left to grow naturally without much crop<br />
husbandry.<br />
Both local and exotic varieties are grown <strong>in</strong> Eastern Prov<strong>in</strong>ce. The local varieties are Ngowe,<br />
Dodo, Boribo and Batawi. The exotic varieties <strong>in</strong>clude Apple, Kent, Keit, Tommy Atk<strong>in</strong>s, Van Dyke,<br />
Haden, Sensation, Sabre, Sab<strong>in</strong>e, Paf<strong>in</strong>, Maya, Kenston and Ges<strong>in</strong>e. The districts with higher percentage<br />
<strong>of</strong> improved mango varieties are Thika, Embu, Mbeere, Meru Central, Makueni, Machakos and Meru<br />
South, while Mw<strong>in</strong>gi and Kitui have very small areas cultivated with improved varieties. In Kitui for<br />
example, 1 287 hectares are under mango production , but less than 6 percent is cultivated with exotic<br />
varieties.<br />
Local varieties predom<strong>in</strong>ate <strong>in</strong> the production <strong>of</strong> Coast Prov<strong>in</strong>ce, namely, Ngowe (70 percent),<br />
Boribo, Batawi and a few m<strong>in</strong>or ones. The ma<strong>in</strong> exotic variety grown is Apple, which is ma<strong>in</strong>ly cultivated<br />
<strong>in</strong> Lamu, Mal<strong>in</strong>di and Kilifi districts.<br />
In the two P rov<strong>in</strong>ces (Eastern and Coast), mango production is primarily ra<strong>in</strong> fed. Where water is<br />
available , new orchards under irrigation have been established for production <strong>of</strong> exotic varieties for<br />
export.<br />
Pests are the ma<strong>in</strong> factor affect<strong>in</strong>g yields. The mango weevil is a major concern and farmers are<br />
mak<strong>in</strong>g an effort to use recommended control measures. For export production, the ma<strong>in</strong> difficulty for<br />
farmers is to comply with the standards required by the EUREPGAP Control Po<strong>in</strong>ts and Compliance<br />
Criteria, which is required for all fruits and vegetables dest<strong>in</strong>ed for the EC market.<br />
In Eastern Prov<strong>in</strong>ce, only one crop <strong>of</strong> mango is produced per year, while <strong>in</strong> Coast Prov<strong>in</strong>ce there<br />
are two harvest<strong>in</strong>g seasons. In the Mal<strong>in</strong>di and Kilifi districts, the two harvests yield an almost equal<br />
quantity. In Lamu 80 percent <strong>of</strong> the harvest is <strong>in</strong> April-July, while <strong>in</strong> the Tana River district, 70 percent <strong>of</strong><br />
harvest is between October and February. The ma<strong>in</strong> exotic variety, Apple, is harvested <strong>in</strong> early September,<br />
slightly later than other varieties.<br />
In the lower parts <strong>of</strong> Tana River District with<strong>in</strong> the delta area especially around Kip<strong>in</strong>i, there is a<br />
dist<strong>in</strong>ct production seasonality emerg<strong>in</strong>g from the effects <strong>of</strong> floodwaters. Mangoes <strong>in</strong> Kip<strong>in</strong>i Division <strong>of</strong><br />
Tana River District, Coast Prov<strong>in</strong>ce are harvested slightly earlier compared to other parts <strong>of</strong> the Prov<strong>in</strong>ce.<br />
In the whole <strong>of</strong> Coast Prov<strong>in</strong>ce, every district reported some mango harvest<strong>in</strong>g for at least seven months <strong>in</strong><br />
a year. In Kenya, generally, mango supply peaks between October and February (Figure 4). Seasonality<br />
has serious implications for mango process<strong>in</strong>g.
6<br />
Table 3: Mango production <strong>in</strong> selected districts <strong>in</strong> Eastern and Coast Prov<strong>in</strong>ces <strong>of</strong> Kenya, 2003<br />
District Hectares (Ha) Production (tonnes)<br />
Machakos 1 352 16 088<br />
Makueni 490 4 900<br />
Meru Central 600 5 400<br />
Meru South 192 1 490<br />
Embu 700 3 000<br />
Mbeere 300 2 350<br />
Mw<strong>in</strong>gi 340 2 850<br />
Kitui 1 287 12 870<br />
Tana River 1 300 12 000<br />
Mal<strong>in</strong>di 1 253 8 806<br />
Kilifi 1 295 9 667-<br />
Lamu 7 000<br />
Figure 4: Mango s upply seasonality <strong>in</strong> 2003<br />
700,000<br />
600,000<br />
500,000<br />
Quantity <strong>in</strong> tonnes<br />
400,000<br />
300,000<br />
200,000<br />
100,000<br />
0<br />
jan Feb Mar Apr May June July Aug Sept Oct Nov Dec<br />
Month<br />
Most <strong>of</strong> the <strong>mangoes</strong> produced are consumed with<strong>in</strong> the same production area, or sold <strong>in</strong> urban<br />
markets <strong>of</strong> Kenya. There are two ma<strong>in</strong> market dest<strong>in</strong>ations for fresh <strong>mangoes</strong>, the local and export<br />
markets. Exports <strong>of</strong> fresh <strong>mangoes</strong> comprise a small proportion <strong>of</strong> national production.
7<br />
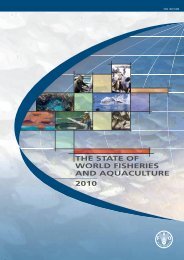
Chart 1: Mango distribution channel <strong>in</strong> Kenya<br />
Total production (2003)<br />
183 486 tonnes<br />
Consumed on farm level<br />
91 700 tonnes<br />
(50 percent)<br />
Sold for local consumption<br />
89 560 tonnes<br />
(49 percent)<br />
Exported<br />
2 226 tonnes<br />
(1 percent)<br />
In 2003, for <strong>in</strong>stance, total mango export was slightly above 1 percent <strong>of</strong> total production. Most <strong>of</strong><br />
the <strong>mangoes</strong> were bought from the farms by middlemen who transported them either to the local markets<br />
or sold them to export<strong>in</strong>g companies. The exotic varieties fetched better farm gate prices, rang<strong>in</strong>g from<br />
Kenya shill<strong>in</strong>gs (Kshs) 3 to 20 per piece, depend<strong>in</strong>g on the size, quality, season, buyer and the dest<strong>in</strong>ation<br />
market.<br />
Only high quality fruits <strong>of</strong> exotic varieties are sold <strong>in</strong> the export markets. The districts that export<br />
substantial quantities <strong>of</strong> <strong>mangoes</strong> <strong>in</strong>clude Machakos, Meru Central, Meru South and Makueni. Some <strong>of</strong><br />
the export<strong>in</strong>g companies buy <strong>mangoes</strong> directly from the farms and package them for export.<br />
The export market <strong>of</strong>fers better prices than the local market. In <strong>case</strong>s where the export<strong>in</strong>g<br />
companies buy directly from the farms, farmers sell at better prices than when they sell their products to<br />
middlemen. The prices <strong>of</strong>fered also depend on the mango season.<br />
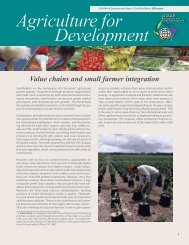
Figure 5 shows the various local, regional and <strong>in</strong>ternational market<strong>in</strong>g channels for <strong>mangoes</strong> <strong>in</strong><br />
Kenya, emphasiz<strong>in</strong>g the actors <strong>in</strong>volved <strong>in</strong> the process. The export market is served by a few large private<br />
sector farms. There are about 22 mango exporters <strong>in</strong> Kenya. Independent smallholders produce the bulk <strong>of</strong><br />
the <strong>mangoes</strong> for domestic markets. The brokers assemble the <strong>mangoes</strong> from producers and then supply the<br />
ma<strong>in</strong> open markets. Once consignments are delivered to the markets, wholesalers buy and sell to retailers<br />
who then sell to consumers <strong>in</strong> kiosks, other retail markets, green groceries and roadside markets.<br />
Processors <strong>of</strong>ten acquire the <strong>mangoes</strong> directly from the producers.<br />
At the high end <strong>of</strong> the market are two ma<strong>in</strong> supermarkets – Nakumatt and Uchumi – which sell<br />
high quality <strong>mangoes</strong> to the upper <strong>in</strong>come consumers. This outlet, however, only accounts for less than 5<br />
percent <strong>of</strong> the mango distributed <strong>in</strong> Kenya. The open market accounts for 56 percent <strong>in</strong> urban centres and<br />
more than 70 percent <strong>in</strong> rural areas, while kiosks account for 36 percent <strong>of</strong> mango sales.
8<br />
Figure 5: Domestic, regional and <strong>in</strong>ternational market<strong>in</strong>g channels for <strong>mangoes</strong> <strong>in</strong> Kenya<br />
Farmers and<br />
traders <strong>in</strong><br />
Tanzania,<br />
Uganda, Ethiopia<br />
etc.<br />
Smallholder Farmers<br />
Rural<br />
Assemblers &<br />
Purchas<strong>in</strong>g<br />
Agents<br />
International Exporters<br />
(Fresh and Processed)<br />
Rural-Urban Wholesalers and Brokers<br />
Local<br />
Processors<br />
Rural<br />
Retail<br />
Centers<br />
Open Air<br />
Retail<br />
Markets<br />
Kiosks<br />
(mid-class<br />
Green<br />
Grocers)<br />
High-end<br />
Green<br />
Grocers<br />
Hotels<br />
Supermarkets<br />
International<br />
markets<br />
(EU)<br />
Regional Fresh<br />
markets<br />
Urban Kenya<br />
Kenyan Urban Consumers<br />
Rural<br />
Consumers<br />
International<br />
Consum<br />
In 2003, fruits earned some Kshs 1.9 billion (US$24.98 million), represent<strong>in</strong>g close to 7 percent <strong>of</strong><br />
the total <strong>value</strong> <strong>of</strong> horticultural exports from Kenya. Mango exports accounted for 14.4 percent <strong>of</strong> the <strong>value</strong><br />
<strong>of</strong> fruit export earn<strong>in</strong>gs (Figure 6).<br />
Mango exports from Kenya are decl<strong>in</strong><strong>in</strong>g despite the expansion <strong>in</strong> demand for fresh fruits <strong>in</strong><br />
Europe and the Near East. Mangoes from Kenya cannot compete effectively because <strong>of</strong> unreliable<br />
supplies, aris<strong>in</strong>g from pest <strong>in</strong>festation and crop mismanagement, as well as <strong>in</strong>adequate <strong>in</strong>frastructure,<br />
which raise the costs and the risks <strong>of</strong> shipp<strong>in</strong>g products abroad.
9<br />
Figure 6: Value <strong>of</strong> fruit export earn<strong>in</strong>gs<br />
Fruits-Share <strong>in</strong> Value <strong>of</strong> Exports (2003)<br />
Macadamia<br />
0.4%<br />
P<strong>in</strong>eapples<br />
1.8%<br />
Mangoes<br />
14.4% Passion<br />
fruits<br />
20.8%<br />
Others<br />
15.5%<br />
Avocado<br />
47.1%<br />
Source: Based on data from MOA/HCDA.<br />
Mango process<strong>in</strong>g <strong>in</strong> Kenya has not expanded, and only a negligible share <strong>of</strong> total production is<br />
currently processed. Only one relatively large-size mango process<strong>in</strong>g firm based <strong>in</strong> Coast Prov<strong>in</strong>ce<br />
processes local products. Other local juice and jam makers import <strong>mangoes</strong> <strong>in</strong> the form <strong>of</strong> concentrates<br />
ma<strong>in</strong>ly from Mauritius, Egypt and South Africa. In pr<strong>in</strong>ciple, therefore, there is potential for <strong>in</strong>creas<strong>in</strong>g the<br />
process<strong>in</strong>g <strong>of</strong> local products. Local production, however, is <strong>of</strong> low quality. N<strong>in</strong>ety-five percent <strong>of</strong> mango<br />
produced <strong>in</strong> Kenya is made up <strong>of</strong> <strong>in</strong>digenous varieties. These, as already mentioned, are rich <strong>in</strong> fibre, and<br />
<strong>of</strong> little market <strong>value</strong> and are either consumed with<strong>in</strong> the households or sold at very low prices <strong>in</strong> the<br />
village markets.<br />
Table 4: Export Share <strong>of</strong> Mango Production <strong>in</strong> Kenya<br />
Year<br />
Area<br />
(ha)<br />
Total<br />
Production<br />
(tons)<br />
Total<br />
Value<br />
(‘000 Kshs)<br />
Export<br />
Export<br />
Value<br />
percent percent<br />
Export Export<br />
Volume (tons) (‘000 Kshs) Volume Value<br />
1992 11 839 90 160 396 959 1 745.17 56 369 2 14<br />
1993 2 357 97 426 671 418 2 348.91 93 956 2 14<br />
1994 2 028 88 129 823 314 2 850.38 131 117 3 16<br />
1995 0 865 89 258 989 309 2 277.17 104 750 3 11<br />
1996 1 143 88 076 846 489 4 245.47 195 291 5 23<br />
1997 3 208 66 707 855 557 2 524.84 195 570 4 23<br />
1998 5 288 150 812 1 550 299 2 505.35 162 848 2 11<br />
1999 15 647 162 322 1 576 933 3 994.76 311 591 2 20<br />
2000 15 027 112 608 5 308 876 2 686.85 118 287 2 22<br />
2001 16 542 179 638 5 366 815 3 166.18 485 353 2 9<br />
2002 16 673 176 504 1 078 928 7 081.00 341 371 4 32<br />
2003 17 268 183 486 1 108 435 2 226.55 273 612 1 25<br />
III. FACTORS PREVENTING THE DEVELOPMENT OF THE MANGO<br />
SUPPLY CHAIN<br />
The major constra<strong>in</strong>ts which are currently h<strong>in</strong>der<strong>in</strong>g the development <strong>of</strong> the mango supply <strong>cha<strong>in</strong></strong><br />
can be categorized accord<strong>in</strong>g to the four basic stages <strong>in</strong> the su8pply <strong>cha<strong>in</strong></strong>: the farm level, the market<strong>in</strong>g<br />
stage, the process<strong>in</strong>g stage and the export stage.
10<br />
At the farm-level, key constra<strong>in</strong>ts faced by farmers are the lack <strong>of</strong> clean plant<strong>in</strong>g material,<br />
<strong>in</strong>adequate technology, the length <strong>of</strong> the production cycle and <strong>in</strong>adequate post-harvest handl<strong>in</strong>g facilities.<br />
Concern<strong>in</strong>g plant<strong>in</strong>g material, there is a generalized shortage <strong>of</strong> grafted seedl<strong>in</strong>gs. Hence, farmers<br />
tend to use <strong>in</strong>ferior, low yield<strong>in</strong>g seedl<strong>in</strong>gs. Farmers do not have knowledge on improved production<br />
technology, and there is little or no use <strong>of</strong> fertilizers and pesticides. Pests – ma<strong>in</strong>ly the mango seed weevil<br />
and fruit fly – and diseases – ma<strong>in</strong>ly anthracnose and powdery mildew – are also major problems. Some<br />
fruit trees are so tall and big such that spray<strong>in</strong>g is only not viable but also impossible. Farmers <strong>of</strong>ten lack<br />
motorized pumps for effective pest and disease control. Coupled with this, is poor crop management<br />
practice, which leads to flower and fruit fall.<br />
Where mango is harvested only once a year, as <strong>in</strong> the <strong>case</strong> <strong>of</strong> Eastern Prov<strong>in</strong>ce, mango farmers<br />
have diversified to other crops, <strong>in</strong>clud<strong>in</strong>g passion fruits, melons and seedl<strong>in</strong>g production, to smooth their<br />
<strong>in</strong>come pattern throughout the year. At harvest time, there is <strong>of</strong>ten an oversupply which leads to low prices<br />
and product losses.<br />
Farmers suffer from poor post-harvest handl<strong>in</strong>g techniques, lead<strong>in</strong>g to significant losses, which<br />
affect returns to the farmer and traders. Furthermore, farmers do not have good storage facilities available<br />
at the farm level, and this forces them to sell their product immediately after harvest. No collective<br />
barga<strong>in</strong><strong>in</strong>g takes place on the price, and each farmer <strong>in</strong>teracts <strong>in</strong>dividually with the trader and other<br />
buyers, <strong>of</strong>ten receiv<strong>in</strong>g prices well below reign<strong>in</strong>g market prices.<br />
At the market<strong>in</strong>g stage, a major constra<strong>in</strong>t is the poorly developed transport <strong>in</strong>frastructure, such as<br />
the bad road conditions that serve production areas which further contribute to post-harvest losses and a<br />
deterioration <strong>of</strong> quality lead<strong>in</strong>g to low sell<strong>in</strong>g prices. In many districts, transport and shipp<strong>in</strong>g costs are <strong>in</strong><br />
fact prohibitive, both with<strong>in</strong> and outside the country.<br />
Supply is not well organized with collection, grad<strong>in</strong>g and pack<strong>in</strong>g facilities and, therefore, farmers<br />
are not able to separate higher quality fruits to be remunerated accord<strong>in</strong>gly. Moreover, farmers <strong>of</strong>ten lack<br />
the necessary <strong>in</strong>formation on alternative market<strong>in</strong>g possibilities and on alternative product uses, such as<br />
dry<strong>in</strong>g, and other options for <strong>value</strong> addition. Traders themselves <strong>of</strong>ten suffer from poor access to credit,<br />
which makes it difficult for them to f<strong>in</strong>ance their operations.<br />
In regard to exports, <strong>in</strong>adequate post-harvest/husbandry control, wrong varieties for sea freight,<br />
<strong>in</strong>adequate sea freight facilities and high air freight costs are among the major constra<strong>in</strong>ts. Moreover, the<br />
need to comply with the EUREGAP and traceability standards, which are necessary to enter the EC<br />
market, constitute a further problem. Exporters themselves <strong>of</strong>ten suffer from price <strong>in</strong>stability <strong>in</strong><br />
<strong>in</strong>ternational markets and from stiff competition from other countries like India, Pakistan, Brazil, Mexico<br />
and Costa Rica. These competitors <strong>of</strong>fer higher quality varieties at lower prices, due ma<strong>in</strong>ly to lower<br />
shipp<strong>in</strong>g costs.<br />
F<strong>in</strong>ally, concern<strong>in</strong>g process<strong>in</strong>g, major constra<strong>in</strong>ts are the <strong>in</strong>sufficient plant capacity and<br />
organization <strong>of</strong> supplies. Currently, less than 1 percent <strong>of</strong> <strong>mangoes</strong> produced <strong>in</strong> Kenya are processed. The<br />
better quality fruits are exported, and processors are left with fruits <strong>of</strong> the lowest quality. Seasonal<br />
production is only enough to supply factories for seven months <strong>of</strong> the year.<br />
On the consumption side, the price <strong>of</strong> natural mango juice is too expensive for domestic<br />
consumers, who mostly consume cheaper products and <strong>in</strong>digenous varieties. Relatively cheaper imported<br />
mango juices are available from Mauritius, South Africa and Egypt. These countries enjoy preferential<br />
tariffs under the regional trade agreement, COMESA. Further competition comes from locally<br />
manufactured, chemically sweetened mango flavoured s<strong>of</strong>t dr<strong>in</strong>ks.<br />
IV.<br />
CONCLUSIONS AND RECOMMENDATIONS<br />
Despite the existence <strong>of</strong> considerable potential and a steady growth <strong>in</strong> yields over the last decade,<br />
the development <strong>of</strong> the Kenyan mango supply <strong>cha<strong>in</strong></strong> appears to be h<strong>in</strong>dered by a number <strong>of</strong> structural
11<br />
problems. This has a negative effect on the country, both <strong>in</strong> terms <strong>of</strong> foregone potential <strong>in</strong>come and<br />
employment opportunities and <strong>in</strong> terms <strong>of</strong> reduced availability <strong>of</strong> locally produced high quality fruits and<br />
natural juices.<br />
Stakeholders <strong>in</strong> the <strong>in</strong>dustry could look at ways to improve exports <strong>of</strong> fresh fruit through better<br />
quality control and management <strong>of</strong> the <strong>value</strong> <strong>cha<strong>in</strong></strong>. Given that a sizeable quantity <strong>of</strong> fruits does not<br />
normally meet export standards, other utilization must be exam<strong>in</strong>ed. In the immediate future, the<br />
development <strong>of</strong> processed products seems to <strong>of</strong>fer the best market opportunities to this end, particularly<br />
for export, given that shipp<strong>in</strong>g and handl<strong>in</strong>g costs are lower for processed products.<br />
In the longer term, capacity build<strong>in</strong>g <strong>of</strong> farmers on crop husbandry, technological application and<br />
overall farm management are key to the development <strong>of</strong> the <strong>cha<strong>in</strong></strong>. Improvement <strong>in</strong> extension provided to<br />
mango farmers is required. The need to improve plant breed<strong>in</strong>g is required particularly for hybrid and<br />
improved varieties. In some areas, better quality could be achieved by adapt<strong>in</strong>g exist<strong>in</strong>g varieties, but<br />
develop<strong>in</strong>g new locally-adapted varieties <strong>in</strong> the long run should be explored.<br />
Def<strong>in</strong><strong>in</strong>g the needs and implement<strong>in</strong>g priorities <strong>of</strong> <strong>in</strong>frastructural development must be carried out<br />
to support the sub-sector. In the area <strong>of</strong> physical <strong>in</strong>frastructures, particular emphasis should be given to<br />
storage facilities and to transportation. Concern<strong>in</strong>g <strong>in</strong>stitutional <strong>in</strong>frastructures, the development <strong>of</strong><br />
adequate credit facilities and other services required by the supply <strong>cha<strong>in</strong></strong> and sett<strong>in</strong>g up collective farmers’<br />
bodies, responsible for market<strong>in</strong>g and for the <strong>in</strong>teraction with other stakeholders <strong>in</strong> the <strong>cha<strong>in</strong></strong>, must be<br />
exam<strong>in</strong>ed.