Agribusiness Handbook: Milk / Dairy Products - FAO
Agribusiness Handbook: Milk / Dairy Products - FAO
Agribusiness Handbook: Milk / Dairy Products - FAO

You also want an ePaper? Increase the reach of your titles
YUMPU automatically turns print PDFs into web optimized ePapers that Google loves.
agribusiness<br />
handbook<br />
<strong>Milk</strong> /<br />
<strong>Dairy</strong><br />
<strong>Products</strong>
agribusiness<br />
handbook<br />
<strong>Milk</strong> /<br />
<strong>Dairy</strong><br />
<strong>Products</strong>
This handbook is part of a series of agribusiness manuals prepared by<br />
the <strong>FAO</strong> Investment Centre Division, in collaboration with <strong>FAO</strong>’s Rural<br />
Infrastructure and Agro-Industries Division. It was prepared for the EBRD<br />
<strong>Agribusiness</strong> team, under the <strong>FAO</strong>/EBRD programme of cooperation.<br />
The production of the manuals was financed by <strong>FAO</strong> and by the EBRD<br />
multidonor Early Transition Countries Fund and the Western Balkans Fund.<br />
The purpose of this handbook is to help agribusiness bankers and potential<br />
investors in the Early Transition countries (ETCs) and the Western Balkan<br />
countries (WBCs) to acquire basic knowledge about the milk sector and to<br />
become acquainted with recent economic trends in the sector around the<br />
world, with a special focus on the ETCs and the WBCs. This volume was<br />
prepared by David Jones, <strong>Milk</strong> Expert, and reviewed by Inna Punda, <strong>FAO</strong><br />
<strong>Agribusiness</strong> Expert, as well as by members of the EBRD <strong>Agribusiness</strong><br />
team. Electronic copies can be downloaded from www.eastagri.org, where<br />
a database of agribusiness companies, including dairies that operate in<br />
the ETCs and the WBCs, is also available. Please send comments and<br />
suggestions for a future edition of the manual to TCI-Eastagri@fao.org.<br />
Design and page layout Alberto Pedro Di Santo<br />
The designations employed and the presentation of material in this information product<br />
do not imply the expression of any opinion whatsoever on the part of the Food and Agriculture<br />
Organization of the United Nations (<strong>FAO</strong>) concerning the legal or development status of any<br />
country, territory, city or area or of its authorities, or concerning the delimitation of its frontiers<br />
or boundaries. The mention of specific companies or products of manufacturers, whether or not<br />
these have been patented, does not imply that these have been endorsed or recommended by<br />
<strong>FAO</strong> in preference to others of a similar nature that are not mentioned. The views expressed in<br />
this information product are those of the author(s) and do not necessarily reflect the views of <strong>FAO</strong>.<br />
All rights reserved. Reproduction and dissemination of material in this information product for<br />
educational or other non-commercial purposes are authorized without any prior written permission<br />
from the copyright holders provided the source is fully acknowledged. Reproduction of material<br />
in this information product for resale or other commercial purposes is prohibited without written<br />
permission of the copyright holders. Applications for such permission should be addressed to:<br />
Director<br />
Investment Centre Division<br />
<strong>FAO</strong><br />
Viale delle Terme di Caracalla, 00153 Rome, Italy<br />
or by e-mail to: TCI-Eastagri@fao.org<br />
© <strong>FAO</strong> 2009<br />
2
TABLE OF CONTENTS<br />
INTRODUCTION 5<br />
1. MILK PRODUCTION 7<br />
1.1 Type and composition 7<br />
1.2 Animal numbers and yields 7<br />
1.3 Volume of milk production 9<br />
1.4 Regulatory regimes 9<br />
1.5 <strong>Milk</strong> quality 10<br />
1.6 <strong>Milk</strong> collection 11<br />
1.7 <strong>Milk</strong> prices 13<br />
1.8 Costs and margins of milk production 14<br />
2. MILK PROCESSING 17<br />
2.1 General 17<br />
2.2 Major manufacturing companies 20<br />
2.3 Scale of production and size of plants 21<br />
2.4 <strong>Milk</strong> processing costs 22<br />
2.5 <strong>Dairy</strong> product prices 23<br />
3. THE WORLD DAIRY MARKET 25<br />
3.1 Production of dairy products 25<br />
3.2 Consumption of dairy products 27<br />
3.3 Trade in dairy products 28<br />
4. THE WESTERN BALKAN COUNTRIES (WBDs) AND THE EARLY<br />
TRANSITION COUNTRIES (ETCs) 31<br />
4.1 <strong>Milk</strong> production and processing in the WBCs 31<br />
4.2 <strong>Milk</strong> production and processing in the ETCs 34<br />
4.3 Consumption and trade in the WBCs 40<br />
4.4 Consumption and trade in the ETCs 43<br />
4.5 Key priorities 46<br />
3
INTRODUCTION<br />
Lactating mammals produce milk to feed their young. Throughout history,<br />
humans have come to recognize in milk a product with uses and benefits<br />
far beyond this simple biological fact. <strong>Milk</strong> is a liquid containing nutrients in<br />
suspension. Its exact composition varies from species to species, but for the<br />
main part these nutrients may be classified as fat, protein and other solids.<br />
Consumers have come to value these nutrients in their diets. Farmers have<br />
been encouraged to engage in commercial dairy farming to produce raw milk<br />
to satisfy consumer demand, and dairy processors have enabled raw milk<br />
to be transformed into a wide variety of products to stimulate this demand.<br />
Technology has enabled the use of raw milk and its constituents in many<br />
individual products and as components in many foods and food preparations.<br />
A major global industry has evolved from humble beginnings. Governments<br />
have come to recognize the value of the dairy industry in providing a basis<br />
for agricultural and industrial development, and have employed policies<br />
accordingly. Not bad for such a simple product!<br />
5
1. MILK PRODUCTION<br />
1.1 Type and composition<br />
The composition of milk varies according to a range of factors, including<br />
species, stage of lactation and diet. Essentially, the product is an emulsion of<br />
fats (both saturated and unsaturated), proteins (casein and whey proteins),<br />
lactose, minerals (including calcium, potassium, magnesium and zinc),<br />
vitamins (including A, B, D and E) and other solids in water. The total solids<br />
content of cow's milk is some 13%, with fat representing about 4%, protein<br />
about 3.5% and lactose about 5%. Goats’ milk has a similar composition.<br />
Sheep milk has a typically higher fat content of 5%, a higher protein content<br />
and a total solids content of about 16%. Buffalo milk is typically 10% fat and<br />
has a total solids content of about 20%. Other mammals (e.g. seals and<br />
whales) lactate milk with significantly higher fat contents to feed their young.<br />
<strong>Milk</strong> is produced commercially across the globe from only a limited number of<br />
animal species. Of these, cow's milk production is by far the most significant,<br />
but sheep, goats, buffaloes and camels are also used to produce milk for<br />
human consumption on a lesser scale.<br />
Table 1: World production of milk by type, 2007<br />
Species M tons %<br />
Cow 560.49 83.49<br />
Buffalo 85.40 12.72<br />
Goat 14.80 2.20<br />
Sheep 9.15 1.36<br />
Camel 1.48 0.22<br />
Total 671.31 100.00<br />
Source: <strong>FAO</strong>STAT<br />
1.2 Animal numbers and yields<br />
In 2007, there were some 670 million head of milking animals in the world. About<br />
one-third of these are cows, producing more than 80% of the world’s milk output.<br />
Buffaloes account for about 8% of the world’s milking animals, and produce almost<br />
13% of the world’s milk output. There are also large numbers of milking sheep and<br />
goats, but each animal produces only a small volume of milk, and overall these<br />
animals (along with camels) account for less than 5% of world milk production.<br />
7
Table 2: <strong>Milk</strong>ing animals and yields, 2007<br />
Species M head Kg/year a<br />
Cow 245.08 2,287<br />
Buffalo 57.52 1,485<br />
Goat 170.07 87<br />
Sheep 195.36 47<br />
Camel 4.28 345<br />
Total 672.31 1,000<br />
a - 10 Nov quotation.<br />
Source: International Grains Council Grain Market Indicators, November 2008<br />
The quantity of milk (yield) produced in a year by an animal varies enormously<br />
according to breed, feed and management practices. The world average of<br />
2,300 kg/year per cow is somewhat meaningless because it is influenced<br />
heavily by the large numbers of poor-yielding animals in less developed<br />
countries across the globe. In many developed dairying countries, yields are<br />
typically 4,000–5,000 kg/head and exceptionally reach 6,000–8,000 kg/head<br />
in particular intensively managed enterprises. In such systems, cows will be<br />
selected on the basis of yield, the calving interval will be closely monitored<br />
(cows produce milk only when they have been put in calf), inseminations will<br />
be with bulls with high-yielding daughters (rather than having cows served<br />
by a local bull, for example), the animals will have their feeding rations and<br />
regime controlled, probably by computer, and they may be milked three times<br />
a day. The cows will produce significant volumes of milk, but will be kept for<br />
only a small number of lactations, maybe four or five. After this, the animals<br />
will be culled.<br />
The structure of dairy farming varies enormously from country to country.<br />
In many developing countries, the owner of the holding has just one cow,<br />
while in commercial dairying enterprises the worldwide average herd size is<br />
typically more than 100 animals – in the United States, many Californian herds<br />
have more than 1,000 animals. About 90% of California’s milk is produced<br />
in herds of more than 500 animals. Within the European Union (EU), there<br />
is a vast difference between the structure of dairying in a country such as<br />
the Netherlands and the dairy industries in Baltic countries, for example. In<br />
the former, the majority of herds consist in more than 100 animals and the<br />
average herd size is 60 animals per holding. In a country such as Lithuania,<br />
the average size of a dairy holding is five cows, and only 28% of animals are<br />
in herds of more than 50 cows.<br />
8
1.3 Volume of milk production<br />
Total world production of all kinds of milk amounts to some 670 million tons/<br />
year. Relatively little is produced in Africa and Oceania, even though Australia<br />
and New Zealand are two of the most important countries for world dairy<br />
trade. North, South and Central America produce a quarter of the world’s milk<br />
supply, with the region’s largest producer, the United States, producing around<br />
half of this total (84 million tons in 2007). Europe produces some 210 million<br />
tons of milk a year, with the EU producing 151 million tons and the Russian<br />
Federation a further 32 million tons. Asia accounts for one-third of world's milk<br />
production, with India the largest regional producer at 103 million tons. Of this<br />
quantity, more than half (57 million tons) is from buffaloes – India accounts for<br />
two-thirds of the world’s entire production of buffalo milk. China is the other<br />
large producer in the region, with 37 million tons of milk.<br />
Table 3: World milk production (million tons)<br />
Region 2003 2004 2004 2006 2007<br />
Africa 32.21 31.96 32.27 33.62 33.40<br />
Americas 146.91 148.76 154.96 160.67 161.28<br />
Asia 193.73 205.55 217.87 229.51 236.93<br />
Europe 217.43 214.76 215.43 214.97 213.43<br />
Oceania 24.49 25.21 24.79 25.65 26.26<br />
Total 614.76 626.24 645.33 664 671.30<br />
Source: <strong>FAO</strong>STAT<br />
World milk production has grown at an average rate of 2.3% per year since<br />
2003. However, annual growth in Asia has averaged 5.5% per year, and in<br />
the Americas 2.5% per year. In Europe, where much milk output is quotacontrolled,<br />
milk output has fallen since 2003, and in Oceania the growth has<br />
been only 1.8% per year, owing to adverse weather. Finally, in Africa, growth<br />
in milk production has averaged less than 1% per year since 2003, illustrating<br />
the problems caused by adverse climate and poverty.<br />
1.4 Regulatory regimes<br />
For a variety of reasons, most governments across the globe employ a policy of<br />
active management in their countries’ dairy industries. In developing countries,<br />
these policies tend to be aimed at stimulating domestic milk production, to<br />
create wealth in agriculturally-based communities or to reduce the import<br />
9
ill. In developed countries, the policies tend to be centred more on creating<br />
stability in the dairy industry, while ensuring that supplies reach consumers at<br />
reasonable prices and taxpayer costs are minimized. In most countries with<br />
a developed dairy industry, governments have sought to ensure that a basic<br />
level of support is provided to dairy farmers, to ensure that there is a regular<br />
and sustainable volume of milk produced to satisfy consumer markets. Over<br />
time these methods of price support have fallen into two basic categories:<br />
■ market price support – in which governments typically set minimum prices<br />
at which surplus product will be removed from the market and taken into<br />
store in the form of butter, powder or cheese when market prices are low<br />
and sold back to the market when prices are higher;<br />
■ deficiency payments – in which governments determine the quantity of<br />
product required by the domestic market and pay a subsidy to farmers to<br />
encourage the production of this quantity.<br />
The difficulty with both metods is that they are blunt instruments for dealing<br />
with a complicated supply chain; many governments (e.g. the United States<br />
and Japan), therefore, use a mixture of the two to meet policy objectives.<br />
Others (e.g. the EU) have found that relying wholly on market price support<br />
has tended to encourage the production of more milk than domestic markets<br />
can use and have overlaid a system of milk quotas to control output. In<br />
countries where stimulating additional milk output is a priority (e.g. the Russian<br />
Federationand China), government policy has included the use of domestic<br />
subsidies, rural and industrial development programmes, and trade barriers to<br />
encourage the domestic industry. All countries tend to struggle to find policies<br />
that are sufficiently flexible to cope with sustainable production of a relatively<br />
expensive raw material that is sold in domestic and export markets where<br />
there are competitively priced alternative protein and energy food sources.<br />
1.5 <strong>Milk</strong> quality<br />
Raw milk quality is assessed on the basis of composition and hygiene. As<br />
dairy technology has advanced, it has become increasingly important to the<br />
manufacturers of dairy products to know that the milk they purchase from<br />
suppliers is of a good compositional standard (i.e. fat and protein content),<br />
enabling a greater weight of product to be made from a fixed volume of milk,<br />
and that the milk is of a good hygienic standard (low bacteria and somatic<br />
cells), enhancing product-keeping quality. The more quickly milk is cooled<br />
after milking, the fewer handling stages through which it will pass. The speed<br />
10
with which it can be processed and put on sale to the consumer is key at the<br />
varius control stages in the dairy supply chain.<br />
The EU has established a hygienic quality regime for raw milk that aims to<br />
minimize the risks to human health from harmful bacteria such as listeria,<br />
salmonella and E. coli, all of which can be present in raw milk. These bacteria<br />
are destroyed by the pasteurization process, but more ever the EU has in<br />
place a set of legal standards for raw milk, to minimize public health risks and<br />
ensure appropriate animal welfare standards. Raw milk delivered from EU<br />
farms must come from herds free of tuberculosis and brucellosis. At milking,<br />
the milk must be cooled to a maximum temperature of 8 0 C or 6 0 C, unless<br />
subject to daily collection. The hygienic quality of the milk must satisfy a<br />
bacterium standard of < = 100,000/ml, measured by a plate count and a somatic<br />
cell count standard of < = 400,000/ml. Thus, all milk and milk-based products<br />
sold to consumers in the EU will have originated from raw milk that meets<br />
these standards. In addition, the cows must be kept in hygienic conditions,<br />
be subject to good management practices and be free from disease. The<br />
milk must not contain antibiotics and must have a freezing point greater than<br />
–0.515 °C, to guard against the presence of added water. The EU applies<br />
similar hygiene standards in respect of buffalo, sheep and goat's milk.<br />
Dairies and processing creameries typically encourage farmers to improve<br />
the hygienic quality of their milk above these legal standards by applaying<br />
a system of penalties and bonuses in their contractual arrangements. Most<br />
processing dairies will pay a higher price for milk with a better solids content<br />
(fat and protein), and farmers are encouraged to breed and feed to meet these<br />
higher compositional standards through the price mechanism. Processors<br />
obtain the benefit of improved milk-to-product conversion rates.<br />
1.6 <strong>Milk</strong> collection<br />
As the dairy industry develops, an increasing proportion of milk is delivered<br />
to dairies. Farmers have moved away from feeding their milk to livestock and<br />
farm households, and have been encouraged to deliver their milk to processing<br />
establishments and buy back the products that they need for themselves and<br />
their livestock. Today, it is not so much the surplus milk that is sold by the<br />
farmer, but rather all the milk, which is the main source of income for the<br />
farmer. In many countries (e.g. the United States and Australia), the concept<br />
of retaining milk on the farm has almost completely disappeared. In the EU-<br />
15, more than 95% of all the milk produced is now delivered to dairies, and<br />
even in the ten new EU Member States that joined in 2004, the proportion of<br />
milk delivered to darieshas increased from 70% in 2003 to 77% in 2007. For<br />
11
the latest EU members, the process of structural reform has a long way to<br />
go. In Romania, for example, it is estimated that only about 20% of the milk<br />
produced is delivered to dairies.<br />
Table 4: <strong>Milk</strong> deliveries to dairies (percentage of milk produced)<br />
Country 2003 2004 2005 2006 2007<br />
EU-15 95.3 95.4 95.7 96.3 96.2<br />
EU-10 70.4 73.7 77.5 77.2 77.0<br />
EU-27 88.7 88.6 89.6 90.0 89.9<br />
Source: IDF<br />
As structural change occurs and herd sizes increase, farmers have been<br />
encouraged to invest in on-farm milk storage facilities, with refrigerated bulk<br />
tanks capable of holding the contents of one or two days milking. <strong>Milk</strong> is<br />
collected by the processing dairy using insulated tankers and delivered to the<br />
factory. In Europe, the model of milk delivery has developed around regional<br />
cooperatives or private factories collecting milk from the farmers in their<br />
immediate vicinity, typically up to 100 km. <strong>Milk</strong> can be transported over longer<br />
distances, but logistics and economic factors govern this: milk tends not to<br />
be transported over longer distances in Europe, and this helps to minimize<br />
costs. In Germany, in 2008, the average cost of transporting milk from farm to<br />
factory was EUR 1.06/100 kg or 3% of the price paid to the dairy farmer. The<br />
transportation cost varied from EUR 0.80/100 kg in the former East Germany<br />
to EUR 1.13/100 kg in the former West Germany. The difference is due to<br />
the more advanced consolidation of factories in the former West Germany,<br />
meaning that the milk has to travel longer distances from farm to factory. In<br />
countries where milk deliveries are less developed and herds are small, the<br />
storing of milk on-farm to await collection is not economical. A more usual<br />
practice is for farmers to transport their own milk, usually in cans, from the<br />
farm to a collection point, where it is put into a central refrigerated bulk tank<br />
owned by either a group of farmers or a local cooperative. The tank holds the<br />
output from several farms in the vicinity, and the milk is transported from the<br />
collection centre to the factory in a tanker. Samples are taken of the milk at all<br />
stages, to determine its compositional and hygienic quality so that the farmers<br />
may be paid accordingly.<br />
12
1.7 <strong>Milk</strong> prices<br />
A milk producer normally has a contract with either a local cooperative or a<br />
private factory, and is paid according to the terms of this contract. Typically,<br />
the price that the farmer receives for his or her milk varies according to a<br />
number of parameters, which are likely to include milk compositional quality,<br />
hygienic quality, volume of milk supplied, time of year (seasonality), and the<br />
market into which the milk is sold.<br />
Table 5: Average producer milk prices (USD/100 kg)<br />
Country Currency 2003 2004 2005 2006 2007<br />
Germany USD 32.20 34.70 34.30 34.30 45.80<br />
Netherlands USD 36.20 38.50 38.50 37.70 47.90<br />
EU15 USD 32.80 35.70 35.00 34.60 43.50<br />
Poland USD 18.00 23.10 27.90 29.10 37.60<br />
United States USD 27.70 35.60 33.40 28.40 42.20<br />
Canada USD 42.60 46.20 53.00 57.70 64.00<br />
Australia USD 17.60 22.50 24.40 24.30 39.30<br />
New Zealand USD 20.30 25.90 23.60 23.90 47.10<br />
Japan USD 71.80 76.46 74.31 68.78 67.00<br />
Source: IDF<br />
There is significant variation in the prices paid to milk producers, even within a<br />
single currency area such as the Eurozone. When EU countries that are outside<br />
the Eurozone (e.g. Poland) are included, the variation becomes even greater.<br />
Over time, price levels in the ten new EU Member States are coming closer to<br />
EU-15 average levels, but there is still some way to go. <strong>Dairy</strong> products traded<br />
across international borders are normally priced in United States dollars, and a<br />
comparison of prices in United States dollars reveals the high level of support<br />
afforded to producers in Japan and Canada by their national governments.<br />
Japanese dairy farmers receive the highest price for their milk, but Canadian<br />
producers are not far behind. Traditionally, New Zealand dairy farmers have<br />
been reckoned to be the lowest-cost producers of milk, but appreciation of the<br />
New Zealand dollar over the 2003–2007 period has wrecked this position, at<br />
least for 2007. Countries in South America (Argentina, Chile) are the lowest<br />
cost producers, but a return to more normal trading conditions in 2009 is likely<br />
to restore New Zealand to the lowest-cost position.<br />
13
1.8 Costs and margins of milk production<br />
<strong>Milk</strong> production costs vary with the scale of operation, as well as with the<br />
normal fluctuations in operating expenses. Wisconsin is one of the main milk<br />
producing states in the United States. It is also a state where enterprises are<br />
smaller than the average, and cows are grazed, rather than fed indoors all<br />
year-round. In 2007, the total costs of production amounted to USD 34/100 kg.<br />
Important costs are labour, depreciation and – on the direct costs side – purchased<br />
feed.<br />
Table 6: Costs of milk production in Wisconsin, United States, 2007<br />
(USD/100 kg)<br />
Production cost 250 cows Average cost<br />
Direct costs<br />
Breeding 0.57 0.49 0.51<br />
Chemicals 0.51 0.29 0.51<br />
Custom hire 0.88 1.34 1.30<br />
Purchased feed 6.42 9.79 8.20<br />
Fertilizer 1.65 0.82 1.28<br />
Fuel, oil, gas 1.56 0.99 1.21<br />
Insurance 0.73 0.26 0.46<br />
Rent 0.90 1.37 1.39<br />
Repairs 2.18 1.50 1.90<br />
Seeds/plants 1.34 0.75 0.99<br />
Utilities 1.23 0.66 0.82<br />
Vet & medicine 1.01 1.41 1.23<br />
Other 4.27 6.26 4.98<br />
Indirect costs<br />
Interest 1.50 2.27 2.05<br />
Labour 2.89 4.70 4.17<br />
Depreciation 3.79 2.58 3.04<br />
Total costs 31.45 35.43 34.03<br />
Source: University of Wisconsin<br />
14
Labour costs tend to be lower on smaller farms, where less use is made of<br />
hired labour. Depreciation costs on smaller farms tend to be higher per unit<br />
of milk produced. Interest charges tend to rise as establishments increase in<br />
size and undertake greater borrowing. Owners of larger farms also tend to<br />
rely more on bought feed than do owners of smaller farms, who rely more on<br />
grazing of animals on their own land. Overall, the total costs associated with<br />
producing milk in Wisconsin are slightly higher, per unit of milk produced, on<br />
larger farms. However, on a per farm basis, the larger farms are significantly<br />
more profitable because they produce more milk per establishment.<br />
Net farm income in the United States in 2007 was positive, unlike the<br />
previous year. Net farm income is defined as the total of all farm income<br />
less all expenses, except the return to management and investment income.<br />
On average, farms in Wisconsin made a profit of USD 8.15/100 kg of milk<br />
produced in 2007. This equated to USD 942 per cow, or USD 139,328 per<br />
farm enterprise. Larger farms made an enterprise profit of USD 484,272 in<br />
2007, while smaller enterprises made a profit of USD 46,488.<br />
Table 7: Net farm income, Wisconsin, United States, 2007<br />
Farm income 250 cows Average<br />
USD per 100 kg 10.87 6.88 8.15<br />
USD per cow 1,126.00 803.00 942.00<br />
USD per farm 46,488.00 484,272.00 139,328.00<br />
Source: University of Wisconsin<br />
15
2. MILK PROCESSING<br />
2.1 General<br />
The milk industry has moved a long way from when milk was either consumed<br />
as soon as it came from the cow or churned to produce cream and then butter,<br />
with the resulting skim milk fed to livestock. The modern dairy industry is<br />
now concerned with maximizing the value of all the solids in milk, and a vast<br />
array of technological developments have enabled sophisticated products to<br />
be made from the same essential whole milk. There are three main product<br />
groupings of processed milk products. Worldwide, approximately 30% of milk<br />
production is used as liquid milk and products, 35% is used to manufacture<br />
cheese, and the remaining 35% is used to make butter and powdeed milk. Of<br />
course, these proportions vary enormously within and among countries.<br />
2.1.1 Liquid milk and fermented milk<br />
Raw milk is heat-treated by pasteurization or higher-temperature treatments<br />
to produce drinking products, including UHT, extended-life, sterilized and<br />
pasteurized milk in a range of fat variants (typically whole, semi-skim and<br />
skim). Low-fat varieties are made by combining whole milk with skim milk from<br />
the separation process (see below) in set proportions. Cultures may be added<br />
to pasteurized milk to produce products such as yogurt, kefir and junket.<br />
Compositional standards vary from country to country, but typically whole milk<br />
has a minimum fat content of 3.5% and a non-fat milk solids minimum of<br />
8.25%. Semi-skim milk has a fat composition of between 1.5 and 1.8%, and<br />
skim milk has a maximum fat content of 0.5%.<br />
2.1.2 Cream and butter products<br />
Raw milk is separated into skim milk and cream. The pasteurized skim milk<br />
may then be added back to whole milk to produce low-fat milk, evaporated<br />
to produce condensed milk, or dried further to produce powdeed milk. The<br />
cream may be used for consumer products such as whipping cream and<br />
coffee cream, or cultures may be added to produce soured cream, crème<br />
fraîche and other products. The cream may also be churned to produce butter,<br />
which may be sold in salted or unsalted forms to consumers.<br />
Butter has a typical composition of a minimum fat content of 82%, a maximum<br />
moisture content of 16% and a maximum content of solids other than fat of<br />
2%. Butter may also be manufactured to 80% minimum fat content and may<br />
contain salt, usually up to 1.5%. Powered skim milk typically has a maximum<br />
fat content of 1.5% and a maximum moisture content of 4%.<br />
17
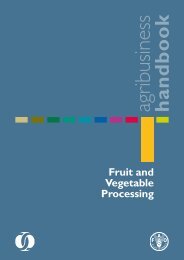
Figure 1: Butter manufacturing process<br />
Raw milk<br />
storage<br />
Separation<br />
Cream<br />
Skim milk<br />
Storage<br />
Pasteurization<br />
Starter culture<br />
Churning<br />
Pasteurization<br />
Storage<br />
Evaporation<br />
and drying<br />
Buttermilk<br />
Pasteurization<br />
Evaporation<br />
and drying<br />
Butter<br />
Working<br />
and salting<br />
Packaging<br />
Storage and<br />
distribution<br />
2.1.3 Cheese and whey products<br />
Raw milk is coagulated by the addition of the rennet enzyme and then separated<br />
into curds and whey. The curd may be treated in a variety of ways by adding<br />
flavours, moulds and pressings to produce hard, semi-hard, soft, fresh, blueveined<br />
and other types of cheese. The liquid whey may be subjected to further<br />
treatments to produce a range of products, including powered whey powder,<br />
whey protein concentrate and lactose.<br />
18
Figure 2: Cheese manufacturing process<br />
Raw milk<br />
Pasteurization<br />
Separation<br />
standardization<br />
Pre-pressing<br />
Curd<br />
manufacture<br />
Starter culture<br />
rennet<br />
Cheddaring<br />
Whey draining<br />
Moulding<br />
Milling<br />
Concentration<br />
Final pressing<br />
Salting<br />
Evaporation<br />
and drying<br />
Brining<br />
Final pressing<br />
Ripening<br />
Distribution<br />
Cheese composition varies greatly from product to product. Cheddar cheese<br />
normally has a milk-fat content of 50% a minimum in total solids and a maximum<br />
moisture content of 39%. Fresh cheeses may have a moisture content of 80%<br />
and fat contents in dry matter of just 5%. The product variety is endless.<br />
Most modern factories begin their manufacturing process by taking in raw<br />
milk, standardizing it to a specified solids content, pasteurizing it and then<br />
using it to manufacture dairy products. Many different processes and products<br />
are are possible in a modern factory to enable the production for example<br />
of either low-fat cheeses or cream cheese. Production standards for dairy<br />
products are tightly regulated to ensure the safety of public health and to<br />
guard against fraud. Typically, governments determine minimum product<br />
standards, covering hygiene and composition, that products must meet before<br />
they can be sold in the market. Commercial organizations also use product<br />
specifications to ensure that standards are met.<br />
19
Table 8: Litres of milk (4%) required to manufacture 1 ton of product<br />
Product<br />
<strong>Milk</strong> required - litres<br />
Cream (35% fat)<br />
Butter (82% fat)<br />
8,780<br />
Powered skim-milk 20,850<br />
Cheddar cheese<br />
10,400 (skim milk)<br />
Cream cheese(35% fat) 9,500<br />
2.2 Major manufacturing companies<br />
Some of the world’s largest food companies have their origins in the dairy<br />
business. Nestlé was ranked at the top of the list of the world’s largest<br />
dairy companies before 2000 and remained there as of 2007, despite its<br />
diversification into other product line. Danone moved up to the number two<br />
slot in 2007, displacing Lactalis. The merger between Campina and Friesland<br />
Foods in the Netherlands created the largest milk producing cooperative in the<br />
EU, ranking above Arla Foods. There are several US companies in the list, led<br />
by <strong>Dairy</strong> Farmers of America. The New Zealand-based cooperative, Fonterra,<br />
ranks as number seven in the list, and there are also companies from Canada<br />
and Italy ranking among the top 15 companies. This demonstrates the global<br />
nature of the dairy industry.<br />
20
Table 9: The world’s top dairy companies by turnover, 2007 (billion USD)<br />
Ranking Company Country <strong>Dairy</strong> turnover<br />
1 Nestle Switzerland 23.1<br />
2 Danone France 14<br />
3 Lactalis France 13.2<br />
4 Friesland/Campina Netherlands 12.1<br />
5 <strong>Dairy</strong> Farmers of America United States 11.1<br />
6 Dean Foods United States 10.4<br />
7 Fonterra New Zealand 10.4<br />
8 Arla Foods Denmark/Sweden 8.8<br />
9 Kraft Foods United States 6.4<br />
10 Unilever Netherlands/United Kingdom 6.1<br />
11 Saputo Canada 5<br />
12 Parmalat Italy 4.9<br />
13 Bongrain France 4.7<br />
14 Land o'Lakes United States 4.2<br />
15 Meiji Dairies Japan 4.1<br />
Source: Rabobank International<br />
2.3 Scale of production and size of plants<br />
As companies have sought ever-greater processing efficiencies to compete<br />
effectively in the global market, dairy processing plants have increased in size<br />
and scale. Even so, there is significant variation in size among the major milk<br />
producing areas of the world. In the EU, the largest manufacturing plants tend<br />
to be in the Netherlands, where butter factories each produce about 22,000<br />
tons/year, cheese factories about 25,000 tons/year and powdered milk plants<br />
about 16,000 tons/year. This scale of plant production compares favourably<br />
with the United States, but falls well below the scale of plant in New Zealand,<br />
where butter factories each produce about 35,000 tons/year, cheese factories<br />
about 31,000 tons/year and powdered milk plants a massive 70,000 tons/year.<br />
The size of processing plant production is related to the size of the relevant<br />
market. Thus, New Zealand, which serves the world market, has very large<br />
processing plants. In the EU, the Netherlands is the major exporter, and plant<br />
size reflects this. However, elsewhere in the EU, many plants are smaller,<br />
multipurpose and able to switch from one product line to another as market<br />
conditions demand.<br />
21
Table 10: Average plant processing capacity, 2001(thousand tons)<br />
Country Butter Cheese <strong>Milk</strong> powder<br />
Ireland 11.6 12 9.9<br />
Denmark 5.7 8.9 18.3<br />
Netherlands 21.7 24.7 16.0<br />
United States 8.5 9.6 16.1<br />
New Zealand 35.2 31.3 69.6<br />
Source: ICOS, USDA<br />
2.4 <strong>Milk</strong> processing costs<br />
The capital costs necessary to equip a modern dairy factory are large.<br />
The larger the factory, the greater the fixed costs associated with product<br />
manufacture. However, running costs can be minimized by maximizing the<br />
capacity utilization of the factory to produce product at the lowest possible<br />
average cost. This is what dairy factory managers seek to achieve.<br />
Table 11: <strong>Dairy</strong> product manufacturing costs, California, United States,<br />
2007 (USD/100 kg)<br />
Cost Category Butter Cheese Skim-milk powder<br />
Labour 10.295 10.295 7.341<br />
Other processing costs 11.353 19.642 20.326<br />
Packaging 2.8 5.114 3.262<br />
Other ingredients 0.485 2.557 n/a<br />
General/ administrative 2.755 5.07 1.918<br />
Return on investment 1.311 1.477 1.72<br />
Total cost 29.012 44.158 34.568<br />
Source: California Departement of Food and Agriculture<br />
For cheese, the average processing costs in 2007 in California, the United<br />
States, amounted to USD 440/ton, or 17.5 percent of the USD 2,490/ton<br />
support price. For butter and skim-milk powder, the average manufacturing<br />
costs were USD 290/ton and USD 345/ton, respectively, representing 16% of<br />
the support prices of USD 2,315/ton and USD 1,760/ton, respectively. These<br />
costs exclude the costs of the raw milk and of marketing the product. Labour is<br />
the largest single cost element, followed by other processing costs, including<br />
fuel.<br />
22
2.5 <strong>Dairy</strong> product prices<br />
Table 12: Domestic wholesale prices for dairy products (national<br />
currency/100 kg)<br />
Product/country Currency 2004 2005 2006 2007 2008<br />
2008<br />
USD/100Kg<br />
Butter<br />
Netherlands EUR 300.5 279.3 252.9 336.9 262.3 383.5<br />
France EUR 296.7 276.2 249.5 325.3 260.8 381.4<br />
United States USD 400.7 341.2 272.5 301.3 323.0 323.0<br />
Cheese<br />
Germany a EUR 378.3 369.6 351.8 384.2 439.5 642.7<br />
Italy b EUR 589.3 552.9 546.7 553.3 612.5 895.7<br />
United States USD 363.8 329.0 272.6 387.1 411.0 411.0<br />
Skim-milk powder<br />
Germany EUR 208.6 203.3 213.6 326.9 228.2 333.7<br />
Netherlands EUR 204.4 197.0 212.2 316.2 212.5 310.8<br />
United States USD 191.0 215.8 234.2 411.9 282.9 282.9<br />
a<br />
- Emmental; b - Grana Padano.<br />
Sources: PZ, USDA<br />
The majority of milk produced throughout the world is made into liquid milk<br />
and fresh products and consumed locally, or manufactured into storable dairy<br />
products such as cheese and butter. Most of these products are consumed in<br />
local markets and, with the major exception of New Zealand and to a lesser<br />
extent Australia, do not enter into world trade. Overall, less than 10% of<br />
global milk output is traded across international borders. <strong>Milk</strong> producers are,<br />
therefore, significantly dependent on the domestic prices for dairy products in<br />
their local markets to determine their return from milk sales.<br />
These prices are by and large supported by national governments through the<br />
use of minimum price regime and other safeguards, but they show considerable<br />
volatility above these minimum levels, particularly in recent years. Since<br />
2004, the EU has cut its support price for butter from an effective level of EUR<br />
274.70/100 kg (90% of the intervention support price) to the current level of<br />
EUR 221.80/100 kg. Generally, domestic prices have traded at a premium<br />
of about 10% over the support level, but in 2007 a world shortage of dairy<br />
products forced prices higher, to a premium of 50% over the support level. In<br />
23
2008, domestic prices fell to more normal levels. In the United States, a similar<br />
kind of volatility is perhaps even more marked, as domestic market prices<br />
react to selling conditions. Cheese prices follow the same general trends as<br />
butter and powered milk prices, even though cheese markets are generally<br />
slower to react to market conditions and there is enormous price variation<br />
among individual cheese types, with Italian hard-pressed varieties selling at<br />
the top end of the market and cheddar types selling nearer the bottom.<br />
Table 13: EU and United States support prices<br />
Country or region/<br />
2008<br />
Currency/unit 2005 2006 2007 2008<br />
product<br />
USD / 100 kg<br />
EU<br />
Butter EUR/100 kg 305.23 282.44 259.52 246.39 350.00<br />
Powered skim-milk EUR/100 kg 195.24 184.97 174.69 174.69 250.00<br />
United States<br />
Butter USD/lb 1.05 1.05 1.05 1.05 232.00<br />
Non-fat dried milk USD/lb 0.80 0.80 0.80 0.80 176.00<br />
Cheddar cheese USD/lb 1.13 1.13 1.13 1.13 249.00<br />
24
3. THE WORLD DAIRY MARKET<br />
World milk production increased by almost 10% between 2003 and 2007,<br />
and the proportion of total milk production delivered to dairies rose at an<br />
even faster rate. Of this milk, roughly 25% is processed into liquid milk. The<br />
proportion varies considerably from country to country; in the United States<br />
it is 30%, in the United Kingdom 50%, and in the EU 25%. The remainder of<br />
the milk delivered to dairies is processed into dairy products, mainly cheese,<br />
butter and powered milk.<br />
3.1 Production of dairy products<br />
Table 14: Production of cheese from cow's milk (thousand tons)<br />
Country/region 2003 2004 2005 2006 2007<br />
Africa 929 886 886 900 e 900 e<br />
Americas 5,474 5,660 5,810 6,078 f 6,246 f<br />
United States 4,231 4,378 4,506 4,676 4,745<br />
Asia 1,214 1,288 1,406 1450 e 1,500 e<br />
China 225 264 275 n/a n/a<br />
Europe 9,470 9,845 9,933 10,260 10,260<br />
EU 8,346 8,664 8,654 8,994 8,926<br />
Oceania 654 669 681 734 672<br />
World 17,740 18,348 18,716 19,422 f 19,578 f<br />
e<br />
- estimated; f - partly estimated.<br />
Source: <strong>FAO</strong>, USDA, Eurostat<br />
Approximately one-third of all the milk produced in the world is made into<br />
cheese, total production of which has increased by more than 10% since 2003<br />
to reach 19.6 million tons. Cheese remains a developed dairy market product<br />
in terms of both production and trade. Production is concentrated in Europe<br />
and North America, which represent more than three-quarters of world cheese<br />
output. The United States is by far the largest producer of cheese, contributing<br />
25% of total world output. The varieties of cheese produced are legion, from<br />
hard varieties such as Parmigiano Reggiano and Gruyère, to semi-hard<br />
types such as gouda and edam, soft types such as brie and mozzarella, and<br />
fresh cheeses and quarg. Sheep and goats’ milk are also popular for cheese<br />
production.<br />
25
Table 15: Production of butter from cow's milk (thousand tons)<br />
Country/region 2003 2004 2005 2006 2007<br />
Africa 229 230 228 230 e 230 e<br />
Americas 873 883 929 980 1,020<br />
United States 564 566 611 657 693<br />
Asia 3,776 3,961 4,171 4,200 e 4,200 e<br />
China 92 96 100 n/a n/a<br />
India 2,555 2,700 2,855 n/a n/a<br />
Europe 2,678 2,609 2,643 2,545 2,567<br />
EU 2,106 2,038 2,089 2,053 2,065<br />
Oceania 628 623 566 563 510<br />
World 8,185 8,307 8,537 8,518 f 8,527 f<br />
e<br />
- estimated; f partly estimated.<br />
Source: <strong>FAO</strong>, USDA, Eurostat<br />
Butter production also accounts for more than 25% of world milk deliveries,<br />
and has increased by 4% since 2003. About half of total world output is<br />
accounted for by India, with its huge use of ghee for cooking. Production of<br />
table butter in India is just 40,000 tons per year. The United States is still the<br />
largest producer of butter in the world, but EU countries such as Germany and<br />
France are also significant manufacturers, as is New Zealand.<br />
Table 16: Production of powered whole milk from cows’ milk (thousand tons)<br />
Country/Region 2003 2004 2005 2006 2007<br />
Africa 20 20 22 25 e 25 e<br />
Americas 907 959 1,031 1,115 f 1,090 f<br />
United States 18 19 15 14 14<br />
Asia 71 69 67 70 e 70 e<br />
Europe 972 938 958 920 920<br />
EU 817 785 800 780 765<br />
Oceania 817 864 798 810 795<br />
World 2,787 2,850 2,876 2,940 f 2,900 f<br />
e<br />
- estimated; f partly estimated.<br />
Source: <strong>FAO</strong>, USDA, Eurostat<br />
26
World production of powered whole- and semi-skim-milk powder has increased<br />
by 4% since 2003. The product is largely used for human consumption either<br />
in powder form or through recombination into liquid milk, mainly in developing<br />
countries. The world’s largest producer is New Zealand, with about 25% of<br />
world output, almost all of which is traded on world markets.<br />
World production of powered skim milk has fallen by more than 10% over the<br />
last five years, as more remunerative markets have been found for skim milk.<br />
These uses are largely in fresh milk products and cheeses in developed dairy<br />
markets. The consequence is that less powered skim milk has been available<br />
for international trade over the last five years. The United States is again the<br />
world’s largest producer of powered skim or non-fat dried milk.<br />
3.2 Consumption of dairy products<br />
Consumption levels of dairy products vary enormously around the world.<br />
Traditionally, consumption levels were highest in Western economies, and to<br />
a large extent this remains the case. However, Eastern economies are now<br />
starting to develop a taste for dairy products, and consumption levels, although<br />
still low in absolute terms, are beginning to increase.<br />
Table 17: Per capita consumption of dairy products, 2007 (kg/head)<br />
Country Liquid milk Butter Cheese<br />
Germany 94.7 6.4 22.2<br />
France 89.4 7.9 24.3<br />
United Kingdom 105.1 3.2 12.2<br />
EU-15 98.0 4.3 19.3<br />
EU-25 93.5 4.2 18.4<br />
United States 83.0 2.2 16.0<br />
Canada 94.3 2.8 12.6<br />
Argentina 43.9 0.7 11.2<br />
Australia 117.4 3.9 11.9<br />
Japan a 35.8 0.7 2.0<br />
a<br />
- 2006.<br />
Source: IDF<br />
Per capita consumption levels for liquid milk are highest in Scandinavian<br />
countries (in Iceland 150 kg), while in South America consumption levels are<br />
typically less than 50 kg, and in China nearer to 10 kg. Europe has the highest<br />
per capita consumption levels for cheese, at more than 20 kg (in France 24 kg).<br />
27
3.3 Trade in dairy products<br />
Table 18: World exports of dairy products (thousand tons)<br />
Product/country or region 2003 2004 2005 2006 2007<br />
Butter/butter oil<br />
World 850 880 840 840 800<br />
EU 301 333 311 243 211<br />
United States 12 9 9 11 41<br />
Australia a 83 74 72 78 66<br />
New Zealand a 378 330 320 391 364<br />
Cheese<br />
World 1,350 1,450 1,450 1,480 1,530<br />
EU 509 576 546 582 594<br />
United States 52 61 58 71 99<br />
Australia a 212 237 202 209 217<br />
New Zealand a 308 277 283 309 309<br />
Switzerland 55 56 57 56 59<br />
Argentina 23 36 52 58 47<br />
Powered skim milk<br />
World 1,080 1,180 1,100 1,150 1,100<br />
EU 222 281 189 88 196<br />
United States 147 270 289 292 257<br />
Australia a 161 152 165 184 134<br />
New Zealand a 287 250 220 316 281<br />
Ukraine 51 63 57 64 60<br />
India 10 17 53 33 32<br />
Powered whole milk<br />
World 1,600 1,730 1,680 1,700 1,580<br />
EU 481 509 486 434 364<br />
United States 11 15 12 10 12<br />
Australia a 159 161 165 144 110<br />
New Zealand a 657 629 576 645 680<br />
Argentina 106 182 166 215 115<br />
Brazil 3 22 25 17 42<br />
China 7 8 16 15 58<br />
Singapore 16 15 27 30 42<br />
a<br />
- year ending June of following year.<br />
Source: IDF World <strong>Dairy</strong> Situation, USDA<br />
World trade in dairy products grew steadily in the first five years of the twentyfirst<br />
century, but since 2005 the rate of growth has slackened, to begin with<br />
28
ecause of the rise in dairy product prices in 2006 and 2007, and then because<br />
of the reduction in world economic growth.<br />
World trade in butter amounts to some 800,000 tons/year. The world’s major<br />
exporters are New Zealand and the EU, and its major markets are the Russian<br />
Federation, the Middle East and Mexico. World trade in cheese is largely among<br />
the developed dairy nations, and amounts to some 1.53 million tons/year. New<br />
Zealand and Australia are important suppliers to the world market, while the<br />
Russian Federation, the United States and Japan are the main markets.<br />
Table 19: World imports of dairy products (thousand tons)<br />
Product/country or region 2003 2004 2005 2006 2007<br />
Butter/butter oil<br />
World 850 880 840 840 800<br />
EU 115 93 82 85 85<br />
Russian Federation 133 101 83 112 75<br />
Egypt 47 48 30 40 26<br />
Iran 28 27 43 26 40<br />
United States 27 40 40 32 29<br />
Mexico 46 63 71 49 59<br />
Cheese<br />
World 1,350 1,450 1,450 1,480 1,530<br />
EU 175 112 102 105 94<br />
Russian Federation 176 213 260 218 234<br />
Mexico 78 74 78 78 86<br />
United States 216 214 209 206 198<br />
Japan 194 219 212 207 225<br />
Australia a 49 50 50 60 64<br />
Powered skim milk<br />
World 1,080 1,180 1,100 1,150 1,100<br />
Algeria 81 91 84 68 91<br />
China 45 55 43 62 41<br />
Indonesia 72 85 87 86 91<br />
Philippines 110 120 87 95 98<br />
Singapore 37 55 61 60 62<br />
Japan 43 37 34 32 35<br />
Mexico 173 168 155 111 121<br />
29
Product/country or region 2003 2004 2005 2006 2007<br />
Powered whole milk<br />
World 1,600 1,730 1,680 1,700 1,580<br />
Russian Federation 20 25 30 82 65<br />
Algeria 130 161 167 182 160<br />
Saudi Arabia 36 49 75 75 70<br />
China 89 90 64 67 58<br />
Indonesia 20 21 26 27 27<br />
Malaysia 65 75 68 59 64<br />
Philippines 44 50 42 40 42<br />
Singapore 40 40 62 60 61<br />
Mexico 45 35 45 43 46<br />
Venezuela 61 45 46 44 47<br />
a<br />
- year ending June of following year.<br />
Source: IDF - World <strong>Dairy</strong> Situation, USDA<br />
In terms of international trade, powered whole milk powder is more significant<br />
than powered skim milk. New Zealand is by far the largest exporter of powered<br />
whole milk in the world, followed by the EU. Major markets for powered whole<br />
milk are in the Middle East, South East Asia and South America. For powered<br />
skim milk, New Zealand and the United States are now the world’s major<br />
suppliers, with demand concentrated in Southeast Asia, Mexico and Algeria.<br />
Table 20: World prices for dairy products (USD/ton)<br />
Product 2004 2005 2006 2007 2008<br />
Butter 1,870 2,030 1,880 3,090 3,760<br />
Cheddar cheese 2,730 3,040 2,750 4,180 4,780<br />
Power whole milk 2,130 2,290 2,300 4,270 3,920<br />
Power skim milk 2,040 2,230 2,340 4,300 3,160<br />
Source: USDA<br />
During 2006, world prices for powered milk began to increase sharply, almost<br />
doubling by the end of 2007. Import demand for these products is largely in<br />
less developed countries, and suffered as a result, particularly as oil prices,<br />
which had boomed, began to fall to more modest levels. Butter and cheese<br />
prices followed the upward trend in commodity prices in 2007, peaking in<br />
2008. Since then, world prices have declined, to stabilize at 2006 levels.4<br />
30
4. THE WESTERN BALKAN COUNTRIES (WBCs) AND THE<br />
EARLY TRANSITION COUNTRIES (ETCs)<br />
4.1 <strong>Milk</strong> production and processing in the WBCs<br />
<strong>Milk</strong> production in the WBCs totals some 4 million tons/year. Most milk is<br />
produced from cows, but there are significant goat and sheep populations in<br />
all countries. In terms of milk production, the most significant country in the<br />
region is Serbia, which produces about 1.7 million tons of cow's milk/year.<br />
<strong>Milk</strong> yields per animal are low, typically ranging from about 2,200 kg/year in<br />
Albania to 2,750 kg/year in Serbia.<br />
Table 21: <strong>Milk</strong> production in the WBCs (thousand tons)<br />
WBCs: Species 2003 2004 2005 2006 2007<br />
Cow 904.0 917.0 930.0 956.0 917.0<br />
Albania<br />
Goat 81.0 72.0 71.0 71.0 73.2<br />
Sheep 74.0 75.0 75.0 75.0 73.6<br />
Bosnia & Cow 537.3 582.6 629.4 682.9 587.0<br />
Herzegovina Sheep 18.4 16.4 18.2 20.6 20.0<br />
Cow 191.5 212.9 197.5 234.7 385.3<br />
FYR Macedonia Goat n/a n/a n/a n/a 29.9<br />
Sheep 52.5 47.9 48.7 56.6 36.6<br />
Montenegro<br />
Cow n/a n/a n/a 174.3 180.0<br />
Sheep n/a n/a n/a 9.0 9.5<br />
Serbia<br />
Cow n/a n/a n/a 1,725.0 1,700.0<br />
Sheep n/a n/a n/a 16.3 16.0<br />
Total WBCs All 1,858.7 1,923.8 1,969.8 4,021.4 4,028.1<br />
Source: <strong>FAO</strong><br />
31
Table 22: <strong>Dairy</strong> farming structures in the WBCs<br />
Country<br />
No. of cows<br />
(thousand head)<br />
Yield kg/cow<br />
Average<br />
herd size<br />
<strong>Milk</strong> price<br />
USD/100kg<br />
Albania 396 2,200 2.1 28<br />
Bosnia & Herzegovina 300 2,430 2.3 18.2<br />
FYR Macedonia 164 2,570 3.2 19.6<br />
Montenegro 75 2,450 2.9 22.4<br />
Serbia 602 2,750 2.7 15.6<br />
Source: Author<br />
More information on milk processing companies that operate in the ETCs and<br />
the WBCs can be downloaded from http://www.eastagri.org/agribusinesses/<br />
4.1.1 Albania<br />
Farm and herd sizes are small, with an average of 1.5 dairy cows per holding.<br />
Only 23% of the milk produced is delivered to dairies, the remainder being<br />
used for livestock feeding, consumed on farms or sold by farmers direct to<br />
local consumers. <strong>Milk</strong> quality standards are poor, and milk collection costs<br />
are high and exacerbated by the long distances over which milk has to be<br />
transported. Because milking quantities are so small, there is no incentive<br />
to invest in cooling facilities on farms, and most milk is sold at ambient<br />
temperatures. There are some 400 dairies in Albania, but most are smallscale<br />
village operations that do not satisfy any health and hygiene standards.<br />
Some 25 larger dairies operate in the country, handling between 10 and 40<br />
tons of milk/day. Cheese and yogurt are traditional products in Albania, and<br />
total annual output amounts to 12,900 tons of cheese, 14,700 tons of yogurt<br />
and 600 tons of butter.<br />
4.1.2 Bosnia and Herzegovina<br />
Livestock farming is a traditional industry in Bosnia and Herzegovina, but the war<br />
in the 1990s had catastrophic effects, causing a reduction of 60% in cow herd size,<br />
for example. The industry is now recovering, and milk production is increasing, but<br />
farm structure is very fragmented, with an average herd size of 2.3 cows per holding.<br />
Yields per animal are improving steadily, and now stand at more than 2,000 kg/<br />
year. Limitations are the quality of the breeding stock, the poor level of husbandry<br />
knowledge and the low feed quality. About 27% of the milk produced is delivered<br />
to dairies, and most is used to produce liquid milk (particularly UHT) products. In<br />
2007, the industry produced 140,000 tons of liquid milk, 20,500 tons of fresh dairy<br />
products, 3,450 tons of cheese and 400 tons of butter. Foreign companies such as<br />
Lactalis (France) and Meggle (Germany) have shown a willingness to invest in the<br />
dairy sector. Virtually all dairies are privately owned.<br />
32
4.1.3 The former Yugoslav Republic of Macedonia<br />
Farm structure is again typically fragmented, with an average herd size of 3.2<br />
cows per holding. <strong>Milk</strong> production is increasing as yields increase, but these are<br />
still less than half of EU levels, although yields at 2,500 kg/cow/year, they are<br />
better than many in the region. The standard problems of poor hygienic quality<br />
and high transportation costs apply. The industry produces some 230,000<br />
tons of liquid milk each year, with 16,400 tons of fresh milk products and 6,700<br />
tons of cheese in 2006. There is competition from foreign companies in the<br />
marketplace, but the largest dairies in the country can process in excess of 200<br />
tons of milk/day. Bi<strong>Milk</strong> processes 150 tons/day at its factory, and Ideal Shipka<br />
processes 100 tons/day. Zdravje Radovo is significantly smaller, processing 20<br />
tons/day.<br />
4.1.4 Montenegro<br />
The situation here is typical of the Balkans, with a small and fragmented farm<br />
structure. About 90% of holdings have fewer than five cows, and average herd<br />
size is 2.9 animals. Yields per animal are low, at 2,400 kg/year, hampered by<br />
breed structure, feed quality and farmer knowledge. Only 15% of all the milk<br />
produced is delivered to dairies. The remainder is used on farms for feeding to<br />
calves or for use by farm households, usually as cheese, yogurt and sourmilk<br />
products. Some cheese is sold direct from farms to consumers. The raw milk<br />
produced is of poor hygienic quality, and there is no on-farm cooling of milk.<br />
There are 19 small processing establishments in Montenegro (2007), which<br />
produce a total of 22,500 tons of fresh milk products, 300 tons of cheese<br />
and 30 tons of butter each year. There is no foreign investment in the dairy<br />
sector; the largest processing establishments – Sma, Doo Mljekara NIKA and<br />
Mljekara Zora – are locally based. There is competition from Serbian dairies<br />
and Serbian dairy products.<br />
4.1.5 Serbia<br />
Serbia has the largest dairy sector in the region, producing about 1.55 million<br />
tons of milk per year. However, farms are still very small and fragmented,<br />
with 600,000 cows on 220,000 farms, giving an average herd size of 2.7<br />
animals. The process of privatization away from state control is well advanced<br />
in Serbia, and 90% of milk is now produced on family farms. The state sector<br />
production has declined to less than 10% of total milk production, but state<br />
farms still achieve better annual yields per animal (of approximately 6,000 kg)<br />
than do private farms (2,500 kg). Some 27 processing companies each handle<br />
more than 10 tons of milk per day, and there are another 230 or so smaller<br />
establishments. The largest dairy processor in Serbia is Imlek-Beograd, part<br />
of the Danube Food Group, which processes 200 tons of milk per day. The<br />
33
industry produces 450,000 tons of liquid milk and 200,000 tons of fresh milk<br />
products each year. Annual output of cheese amounts to 18,300 tons; butter<br />
output is 2,900 tons and powered milk output is 5,800 tons (2007).<br />
4.1.6 Kosovo<br />
Following the war in 1999, Kosovo’s dairy industry is showing signs of<br />
strong positive development. There are no accurate statistics for the sector,<br />
but there are estimated to be some 83,000 livestock holdings with a total of<br />
140,000 cows. Average herd size is estimated to be fewer than two animals<br />
per holding. Most milk is retained on farms or sold direct to consumers. It is<br />
estimated that only about 3,000 farmers deliver milk to dairies, accounting<br />
for about 10% of all the milk produced. There are some 55 milk collection<br />
centres in Kosovo to assist deliveries to dairies, and there are an estimated<br />
19 processing establishments with intakes varying from 1 to 10 tons of milk<br />
per day. There is little foreign investment in the sector, although Tetrapak is<br />
engaged in a joint venture project with Devolli <strong>Dairy</strong>. UHT milk processing has<br />
seen the most investment since 1999.<br />
4.2 <strong>Milk</strong> production and processing in the ETCs<br />
<strong>Milk</strong> production in the ETCs amounts to more than 11 million tons per year.<br />
The major milk producing country in the region is Uzbekistan, which produces<br />
almost half of this total. Annual milk yields are typically very low, often less<br />
than 1,000 kg/cow, and nomadic lifestyles make data collection difficult.<br />
4.2.1 Armenia<br />
During the market-led reforms of 1991–1992, Armenia underwent a transition<br />
from the old Soviet regime, based on state and collective farms, to a privatized<br />
system. All 42 former state-owned dairies producing liquid milk and cheese<br />
have been privatized, and many have closed. <strong>Milk</strong> production has now<br />
increased to about 600,000 tons per year, the major portion produced by<br />
small farms each with one to two animals. There are some 300,000 cows in<br />
Armenia, with an average annual yield of about 2,000 kg/cow. Most of this milk<br />
remains on-farm or is sold locally. The farms that supply dairies are generally<br />
larger, with an average of 13 milking animals. <strong>Dairy</strong> processing is focused on<br />
liquid milk, cheese, yogurts, ice cream and sour milk.<br />
34
Table 23: <strong>Milk</strong> production in the ETCs (thousand tons)<br />
Armenia<br />
ETCs Species 2003 2004 2005 2006 2007<br />
Azerbaijan<br />
Georgia<br />
Kyrgyzstan<br />
Cow 498.1 535.8 573.8 598.0 613.0<br />
Goat 2.2 3.1 3.3 5.9 3.7<br />
Sheep 13.4 16.3 17.5 30.8 19.5<br />
Cow 1,147.0 1,188.6 1,226.1 1,273.0 1,301.0<br />
Goat 5.4 5.5 5.5 5.4 5.5<br />
Sheep 15.4 19.7 20.3 21.2 21.7<br />
Cow 743.3 755.0 760.8 690.0 734.0<br />
Goat 2.6 3.0 3.2 2.9 2.9<br />
Sheep 19.2 22.3 23.7 21.5 21.1<br />
Cow 1,159.2 1,132.5 1,151.4 1,165.2 1,192.0<br />
Goat 2.1 2.9 8.2 8.3 8.5<br />
Sheep 30.5 29.3 38.0 38.6 40.0<br />
Cow 570.2 604.0 627.1 595.3 573.2<br />
Republic of<br />
Moldova<br />
Goat 5.5 6.0 10.4 12.2 11.5<br />
Sheep 17.4 17.7 21.1 19.9 18.8<br />
Cow 292.4 328.6 300.0 325.0 335.0<br />
Mongolia Goat 29.5 29.0 30.0 30.0 32.0<br />
Sheep 25.0 28.0 28.0 30.0 32.0<br />
Tajikistan<br />
Cow 424.8 450.4 488.0 494.0 529.0<br />
Goat 34.4 39.8 45.0 50.9 54.6<br />
Cow 4,024.6 4,211.9 4,447.2 4,821.4 5,121.0<br />
Uzbekistan Goat 65.2 68.4 107.5 34.2 36.3<br />
Sheep 420.0 400.0 450.0 500.0 500.0<br />
Total ETCs All 9,547.4 9,897.8 10,386.1 10,773.7 11,206.3<br />
Source: <strong>FAO</strong><br />
4.2.2 Azerbaijan<br />
Following the breakdown of the Soviet system, the dairy industry in Azerbaijan<br />
collapsed and has yet to recover. Some 900,000 milk animals produce 1.3 million<br />
tons of milk a year, with an average yield of 1,300 kg/cow. Farming practices<br />
suffer from the lack of breeding policy or genetic inputs, poor cow housing and<br />
no infrastructure to enable milk delivery to dairies. It is understood that there<br />
are about 30 dairies in the country. The largest is <strong>Milk</strong> Pro, which operates two<br />
35
plants. The plant in Golchai is the largest in the country, and processes between<br />
25 and 50 tons of milk per day, depending on the season. The other plant is in<br />
the capital Baku, where most of the other dairy plants are located. These are<br />
generally small: six are estimated to process 5 tons of milk/day, for example.<br />
4.2.3 Georgia<br />
Livestock, especially cattle, are an important part of subsistence family<br />
livelihoods in Georgia. Primarily, they are a source of milk for consumption and<br />
conversion into cheese. According to a statistical survey conducted in 2007,<br />
individual farmers are responsible for 99.7% of Georgia’s milk production.<br />
Most of the increase in overall milk consumption has been covered by local<br />
production, thereby reducing the dependency on imports and increasing the<br />
self-sufficiency ratio from 68% in 1995 to 75% in 2005. The increase in total milk<br />
production was mainly due to an increased number of cows. Animal productivity<br />
is significantly limited by lack of access to veterinary services and animal health<br />
products and services, as well as expensive animal feed and poor-quality<br />
forage, and average milk yields are about 1,000 kg/cow. In 2007, the Russian<br />
dairy giant Wimm-Bill-Dann bought the third largest dairy producer in Georgia<br />
and has invested USD 500,000 in modernization of the 80-ton/day dairy plant,<br />
to serve the local market as well as the Azeri and Armenian markets.<br />
4.2.4 Kyrgyzstan<br />
In Kyrgyzstan, 87% of the agricultural land is pasture. The livestock sector is<br />
the most important activity on marginal lands and high-altitude pastures. It is<br />
dominated by cattle, followed by goats, sheep, horses and yaks. Kyrgyzstan<br />
has about 1.1 million head of cattle, tended by about 350,000 small farmers.<br />
The dairy herd produces about 1.2 million tons of milk, for a total farm-gate<br />
value of USD 170 million. Smallholders sell production in excess of on-farm<br />
consumption to traders, who then sell to three outlets: the local fresh market,<br />
processors and exporters. Export activities dominate in the areas bordering<br />
Kazakhstan, with Kazakh milk processors sending tankers to collect raw milk.<br />
Adverse weather conditions over the last three years have put enormous<br />
pressure on the feed base. With limited fodder, milk production has declined<br />
significantly. Soaring food and fuel prices and declining remittances are<br />
forcing farmers (apart from the four to five large dairy farms that grow their<br />
own crops for use in prepared feeds) to sell livestock. As a consequence,<br />
the dairy processing industry has been developing rapidly for the last several<br />
years, while milk production has been relatively stagnant.<br />
The European Bank for Reconstruction and Development (EBRD) has<br />
recently invested in the Kyrgyz dairy sector. In 2008, it acquired a 34% stake<br />
36
in Siut Bulak to support the company’s expansion, which had already received<br />
financial assistance from the Swiss government. In the same year, under the<br />
Direct Investment Facility (DIF), the EBRD also invested about EUR 1.2 million<br />
in the Kyrgyz cheese manufacturer <strong>Dairy</strong> Spring. Earlier, in 2006, Sheen-line,<br />
a dairy producer specializing in ice cream and located in Bishkek, obtained<br />
a USD 900,000 loan from the Kyrgyz Investment Credit Bank (KICB). KICB<br />
was established in 2000 by the EBRD, the Aga Khan Foundation and other<br />
shareholders, with technical assistance from Japan.<br />
4.2.5 The Republic of Moldova<br />
Following the dissolution of the Union of Soviet Socialist Republics (USSR),<br />
the Republic of Moldova embarked on a programme of privatization and land<br />
reform. This resulted in a very fragmented farm structure with many small<br />
plots, and led to a collapse of dairy farming. Cow herds and milk production<br />
declined. Since 2005, dairy cow herds have started to recover, and milk output<br />
has reached 575,000 tons. At 2,800 kg/cow, yields are better than those in<br />
many other countries in the region. Average herd size is about six cows per<br />
holding, and some large commercial farms each have 100 to 200 animals.<br />
4.2.6 Mongolia<br />
Following the end of the Soviet system in the 1990s, the dairy sector collapsed,<br />
and is only now staging something of a recovery. All kinds of animals are<br />
milked in Mongolia – camels, mares, yaks, cows, sheep and goats. Much of<br />
the milk is made into fermented products for local consumption. Cities have<br />
had to rely on imported products. Annual yields are extremely low at less than<br />
500 kg/cow, but there is no real infrastructure to enable commercial farming or<br />
processing to take place. Mongolia is three times the size of France, making<br />
any kind of national milk collection system unfeasible. Instead, attention has<br />
focused on developing dairies near the urban population centres. Only one<br />
dairy – the old state dairy at Ulaanbaatar – is capable of processing more than<br />
10 tons of milk a day. The remaining state farms and dairies were looted and<br />
equipment lost in the 1990s.<br />
4.2.7 Uzbekistan<br />
Growth potential in the Uzbek dairy sector is high. Today, the county’s average<br />
milk consumption per capita is about 10 litres/year, compared with almost 90<br />
litres/year in the early 1990s. <strong>Products</strong> such as milk, kefir, butter and the local<br />
dairy products kaymak (a variety of sour cream) and katyk (a variety of kefir)<br />
enjoy the greatest demand. In Uzbekistan, consumers make a clear distinction<br />
between raw and processed milk. Due to tradition and price factors, the share<br />
37
of raw, unprocessed milk on the Uzbek liquid milk market is still enormous, at<br />
90% to 95%. Raw milk is fresh milk that farmers or intermediaries sell directly<br />
without any thermal treatment. The bacteriological quality of raw milk is usually<br />
very poor. Processed milk is both imported and produced locally. However, the<br />
appearance of new consumption patterns, at least in urban areas, reveals an<br />
increasing demand for quality products in safer and more hygienic packaging.<br />
The modernization of the Uzbek dairy sector is limited by the low performance<br />
of local dairy farms, which have low productivity and produce milk of poor<br />
quality. The country also suffers from an underdeveloped milk collection<br />
system. Finally, the low purchasing power of most Uzbek consumers limits<br />
the sale prospects of higher-margin dairy products.<br />
The Uzbek government has recently tried to improve the situation. In March<br />
2006, it issued a decree allowing the opening of collection points working with<br />
both agricultural cooperatives and small farms. In 2008, it released 10% of the<br />
land used for cotton cultivation for the production of forage (and vegetables).<br />
Despite the constraints, some large dairy companies are operating. In 1996,<br />
Nestlé took the strategic decision to invest in the Uzbek market. In 2003, a EUR<br />
7.5 million framework guarantee facility was signed between Nestlé Uzbekistan<br />
and the EBRD, with the initial participation of a local bank, Uzjilsberbank. The<br />
project aimed to help Nestlé Uzbekistan increase its access to local currency<br />
borrowing. Nestlé is now the largest player in the Uzbek dairy market. In 2004,<br />
Wimm-Bill-Dann, one of Russia’s largest manufacturers of dairy products,<br />
juices and beverages, took over and modernized the Tashkent-Sut factory,<br />
formerly Uzbekistan’s largest dairy plant. On its Uzbek site, Wimm-Bill-Dann<br />
currently produces pasteurized milk, cream, sour cream and other dairy<br />
products, bearing the Domik v derevne and Veseliy molochnic brands. Wimm-<br />
Bill-Dann’s total investment in the Uzbek dairy sector is estimated at USD 7.3<br />
million.<br />
4.2.8 Tajikistan<br />
In the late 1990s, the conversion of pastures into farmland in Tajikistan was<br />
accompanied by a reduction in fodder crop production. Although livestock<br />
herds declined dramatically after independence, in recent years there have<br />
been some signs of recovery.<br />
38
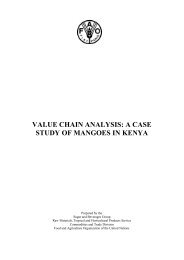
Figure 3: Development of cattle ownership, Tajikistan<br />
1,000 heads<br />
1,600<br />
1,400<br />
1,200<br />
1,000<br />
800<br />
600<br />
400<br />
200<br />
0<br />
1991 1997 2000 2001 2002 2003 2004<br />
State farms Derkhan farms Households<br />
Source: World Bank, 2005, based on National Statistics of Tajikistan<br />
The proportion of cows in the dairy herd has also increased, from 38% in 1988<br />
to 52% in 2003, reflecting the increased importance placed on dairy production.<br />
Most of the increase in the number of cattle occurred at the households level,<br />
with households owning 87% of the national herd. Only 3% of cattle are<br />
held by private dekhan farms (small farm units with fewer than 50 animals,<br />
created by splitting up kolkhozes and sovkhozes) and 10% by state farms.<br />
The privatization of state cattle farms was complicated by the indivisibility of<br />
fixed assets such as buildings and milking equipment and by other issues<br />
related to the decline of management skills in the agriculture sector. A World<br />
Bank assessment of livestock production, conducted in 2005, estimates the<br />
average annual milk production at 1,200 litres per cow on dekhan and state<br />
farms, compared with only 600 litres per cow on household farms. Although<br />
dekhan and state farms account for only 13% of total milk production, 36% of<br />
total marketed milk comes from these farms. Most of their production is sold<br />
to larger processors.<br />
Two groups of dairy processing plants can be distinguished. The first group<br />
consists of relatively large (processing capacities of 1,500 to 10,000 litres per<br />
day) usually state- or privately-owned factories. Processing equipment usually<br />
dates back to Soviet times. These processing plants do not buy the milk from<br />
household farms, but instead contract with bigger dehkans and state farms<br />
for defined quantities of milk per day, sending their vehicles to collect the milk.<br />
The second group of dairy processors consists of semi-industrial plants with<br />
smaller capacities. These companies have been established in recent years,<br />
mostly in urban centres. Collecting 200 to 500 litres of milk per day, either directly<br />
from producers or from traders, they produce ice cream, cheese or traditional<br />
39
products such as curd and sour cream. These plants often operate only during<br />
the summer months, when the availability of milk and electrical power is greater.<br />
On household farms, an important share of milk production is used for the<br />
feeding of calves and home consumption. The remaining milk is processed<br />
by the household into sour cream, yoghurt and other products. During the<br />
summer months, when milk production is high, households sometimes sell<br />
raw milk to local traders, consumers or processors.<br />
4.3 Consumption and trade in the WBCs<br />
4.3.1 Albania<br />
The country is a deficit area for production of milk and dairy products, and<br />
imports about 6,000 tons of liquid milk and cream and 1,200 tons of UHT milk<br />
each year. In addition, Albania imports cheese, butter, yogurt and powered<br />
milk. Until 2007, these quantities were gradually increasing, but the sharp rise<br />
in world dairy product prices resulted in a cutback in volumes in 2008.<br />
Table 24: Trade in dairy products, Albania (tons)<br />
<strong>Dairy</strong> products 2005 2006 2007 2008<br />
Imports<br />
Liquid milk & cream 2,855 5,507 7,464 6,319<br />
UHT milk 981 1,140 1,060 1,223<br />
Fermented milk 4,079 3,090 5,369 1,729<br />
Whey 184 342 360 290<br />
Butter & butterfat 982 925 1,323 581<br />
Cheese 1,549 1,621 1,405 1,331<br />
Source: UN<br />
There are no significant exports of dairy products from Albania. None of the<br />
factories meet health and hygiene standards to enable shipments to the EU.<br />
4.3.2 Bosnia and Herzegovina<br />
<strong>Dairy</strong> product consumption levels are low in comparison with Western<br />
European levels, but significantly higher than those in some other WBCs. In<br />
2007, per capita consumption levels was 44 kg of liquid milk, 7.7 kg of yogurt,<br />
2.7 kg of cream, 0.55 kg of butter and 3.1 kg of cheese. The country is not<br />
self-sufficient in dairy products, importing significant quantities of fermented<br />
40
milk and yogurt, butter and cheese. The main export is liquid milk, of which the<br />
quantities shipped rose to 33,000 tons in 2007. Croatia is the main destination<br />
for this milk, which is shipped in bulk for processing in Croatian dairies. Bosnia<br />
and Herzegovina imported 27,000 tons of liquid in 2007, and also 17,700 tons of<br />
yogurt, 7,300 tons of cheese and 2,600 tons of butter and butter fat products.<br />
Table 25: Trade in dairy products, Bosnia Herzegovina (tons)<br />
<strong>Dairy</strong> products 2005 2006 2007<br />
Imports<br />
Liquid milk & cream 29,097 24,501 27,074<br />
UHT milk 340 170 408<br />
Fermented milk 17,575 16,433 17,762<br />
Whey 698 889 1,312<br />
Butter & butterfat 2,934 2,855 2,605<br />
Cheese 8,985 7,154 7,275<br />
Exports<br />
Liquid milk & cream 18,706 22,727 32,965<br />
UHT milk 18 52 482<br />
Fermented milk 288 498 487<br />
Butter & butterfat 1 50 113<br />
Cheese 706 984 1,071<br />
Source: UN<br />
4.3.3 The former Yugoslav Republic of Macedonia<br />
Consumption of milk and dairy products in the former Yugoslav Republic of<br />
Macedonia centres on cheese, milk and yogurt. Consumption of cheese is<br />
reportedly very high, at more than 30 kg/capita, not dissimilar to consumption<br />
in neighbouring Greece. Imports of liquid milk, yogurt, cheese and butter<br />
come from Croatia, Serbia, Germany and Slovenia for the main part. There<br />
are few exports of dairy products, although some cheese is traded to Greece<br />
and Montenegro. The former Yugoslav Republic of Macedonia is a signatory<br />
to the World Trade Organization (WTO), and its import duties have been<br />
reduced accordingly. However, imported quantities of dairy products have<br />
increased only modestly over the last few years. In 2008, imported volumes<br />
were generally lower, perhaps as a result of higher prices on world markets.<br />
Domestic milk production boosted significantly in 2007.<br />
41
Table 26: Trade in diary products, Macedonia (tons)<br />
<strong>Dairy</strong> products 2005 2006 2007 2008<br />
Imports<br />
Liquid milk & cream 9,714 12,714 15,545 10,892<br />
UHT milk 727 619 424 562<br />
Fermented milk 2,249 3,041 3,400 3,274<br />
Whey 429 471 689 730<br />
Butter & butterfat 1,700 1,461 1,014 1,037<br />
Cheese 2,345 2,661 2,075 2,456<br />
Exports<br />
Liquid milk & cream 11,035 6,739 2,711 n/a<br />
Cheese 62 187 405 n/a<br />
Source: UN<br />
4.3.4 Serbia<br />
As the largest milk producing country in the region, Serbia has become a<br />
net exporter of dairy products in recent years. Consumption of dairy products<br />
is relatively low, with liquid milk at 80 kg/capita, and cheese at 8 kg/capita.<br />
Prices for dairy products are quite high, and the market is protected by import<br />
tariffs. Exports receive a subsidy and go mainly to Montenegro, the former<br />
Republic of Macedonia and Bosnia and Herzegovina. Imports are mainly of<br />
liquid milk, cheese and powered milk, and the main supplying countries are in<br />
the EU, particularly Germany and Slovenia, along with Croatia.<br />
Table 27: Trade in dairy products, Serbia (tons)<br />
<strong>Dairy</strong> products 2005 2006 2007 2008<br />
Imports<br />
Liquid milk & cream 1,324 869 2,682 3,555<br />
UHT milk 854 97 1,252 3,445<br />
Fermented milk 2,185 1,730 1,893 1,593<br />
Whey 1,842 2,435 2,813 2,567<br />
Butter & butterfat 182 182 155 572<br />
Cheese 568 547 785 1,042<br />
Exports<br />
Liquid milk & cream 9,072 30,083 32,942 30,019<br />
UHT milk 238 929 262 45<br />
Fermented milk 835 3,803 5,117 6,266<br />
Whey 7 39 7 158<br />
Butter & butterfat 424 933 753 835<br />
Cheese 950 3,550 3,724 3,909<br />
Source: UN<br />
42
4.4 Consumption and trade in the ETCs<br />
4.4.1 Armenia<br />
Total consumption of milk and dairy products in Armenia is some 150 kg/head.<br />
Imports of yogurt, milk powder, cheese and butter supplement domestic production.<br />
The majority of imports are from Ukraine. The only product that is exported in any<br />
quantity is cheese, and even here exports have fallen, to less than 500 tons in 2008.<br />
Table 28: Trade in dairy products, Armenia (tons)<br />
<strong>Dairy</strong> products 2005 2006 2007 2008<br />
Imports<br />
Liquid milk & cream 182 262 278 282<br />
UHT milk 3,277 3,178 4,926 3,210<br />
Fermented milk 728 673 643 753<br />
Whey 55 21 25<br />
Butter & butterfat 3,561 2,644 1,992 4,581<br />
Cheese 540 694 877 760<br />
Exports<br />
Cheese 2,273 936 567 473<br />
Source: UN<br />
4.4.2 Azerbaijan<br />
<strong>Milk</strong> product consumption levels in Azerbaijan are slightly higher than in neighbouring<br />
Armenia, at 170 kg/head. Exports of dairy products are nonetheless almost nonexistent,<br />
and fell to very low levels in 2008. Imports are more significant, and liquid<br />
milk, yogurt, cheese, butter and milk powder are all traded.<br />
Table 29: Trade in dairy products, Azerbaijan (tons)<br />
<strong>Dairy</strong> products 2005 2006 2007 2008<br />
Imports<br />
Liquid milk & cream 1,753 2,488 4,079 4,849<br />
UHT milk 5,545 5,862 5,582 6,738<br />
Fermented milk 2,761 4,253 6,672 8,189<br />
Whey 4 68 30 15<br />
Butter & butterfat 9,513 7,206 9,009 7,108<br />
Cheese 1,036 2,615 3,619 3,976<br />
Exports<br />
Liquid milk & cream 155 171 220 13<br />
UHT milk n/a 15 6 54<br />
Cheese 16 36 483 59<br />
Source: UN<br />
43
4.4.3 The Republic of Moldova<br />
Overall consumption of dairy products in the Republic of Moldova is low at<br />
130 kg/capita. Despite this, there are exports of milk powder, both whole and<br />
skim. Imports are mainly powered milk, but also include increasing quantities<br />
of cheese. Butter and liquid milk are also imported.<br />
Table 30: Trade in dairy products, the Republic of Moldova (tons)<br />
<strong>Dairy</strong> products 2005 2006 2007<br />
Imports<br />
Liquid milk & cream 161 352 625<br />
UHT milk 615 637 1,999<br />
Fermented milk 1,114 1,543 2,644<br />
Whey 16 93 36<br />
Butter & butterfat 463 1,404 1,613<br />
Cheese 259 494 687<br />
Exports<br />
Liquid milk & cream 15,932 28,955 24,021<br />
UHT milk 777 1,742 1,350<br />
Fermented milk 2,856 4,773 5,771<br />
Butter & butterfat 250 243 296<br />
Cheese 2,465 2,555 2,664<br />
Source: UN<br />
4.4.4 Mongolia<br />
Table 31: Trade in dairy products, Mongolia (tons)<br />
<strong>Dairy</strong> products 2005 2006 2007<br />
Imports<br />
Liquid milk & cream 4,051 3,741 3,320<br />
UHT milk 1,293 1,109 1,092<br />
Fermented milk 104 502 557<br />
Whey 27 10 31<br />
Butter & butterfat 8 104 115<br />
Cheese 155 253 333<br />
Source: UN<br />
Consumption of milk and milk products in Mongolia is about 140 kg/<br />
capita. There are no exports. Imports are made to satisfy the consumption<br />
requirements of the urban population, and include liquid milk, powered milk,<br />
yogurt and small quantities of butter and cheese.<br />
44
4.4.5 Georgia<br />
Consumption of milk and dairy products in Georgia is low at 130 kg/capita.<br />
There are no export. Imports of liquid milk, condensed milk, powdered milk,<br />
butter, yogurt and some cheese supplement domestic production.<br />
Table 32: Trade in dairy products, Georgia (tons)<br />
<strong>Dairy</strong> products 2005 2006 2007<br />
Imports<br />
Liquid milk & cream 1,123 1,282 1,212<br />
UHT milk 7,353 6,755 6,222<br />
Fermented milk 1,592 1,540 1,721<br />
Whey 199 296 267<br />
Butter & butterfat 5,698 3,043 1,626<br />
Cheese 676 789 746<br />
Exports<br />
UHT milk 370 215 20<br />
Butter & butterfat 11 20 118<br />
Source: UN<br />
4.4.6 Kyrgyzstan<br />
Kyrgyzstan is a rugged Central Asian republic with a population of 5 million<br />
people. Consumption of dairy products are relatively high at 230 kg/capita.<br />
Table 33: Trade in dairy products, Kyrgyzstan (tons)<br />
<strong>Dairy</strong> products 2005 2006 2007<br />
Imports<br />
Liquid milk & cream 161 352 625<br />
UHT milk 615 637 1,999<br />
Fermented milk 1,114 1,543 2,644<br />
Whey 16 93 36<br />
Butter & butterfat 463 1,404 1,613<br />
Cheese 259 494 687<br />
Exports<br />
Liquid milk & cream 15,932 28,955 24,021<br />
UHT milk 777 1,742 1,350<br />
Fermented milk 2,856 4,773 5,771<br />
Butter & butterfat 250 243 296<br />
Cheese 2,465 2,555 2,664<br />
Source: UN<br />
45
Imports of dairy products centre on condensed and fermented products,<br />
although imports of both butter and cheese are increasing. There is a strong<br />
export trade in liquid milk, yogurt and cheese. Almost all of the liquid milk is<br />
sent to Kazakhstan.<br />
4.4.7 Tajikistan<br />
Consumption of milk and milk products in Tajikistan is low at 90 kg/capita.<br />
There are no significant exports. Imports are mainly of condensed milk, and<br />
some butter.<br />
Table 34: Trade in dairy products, Tajikistan (tons)<br />
<strong>Dairy</strong> products 2005 2006 2007<br />
Imports<br />
Liquid milk & cream 1,600 1,900 448<br />
UHT milk 393 1,125 1,328<br />
Butter & butterfat 414 606 762<br />
Cheese 146 125 182<br />
Source: <strong>FAO</strong><br />
4.4.8 Uzbekistan<br />
Uzbekistan has by far the largest dairy industry of the ETCs, and a population<br />
of more than 20 million people. Consumption is on a par with that in Kyrgyzstan,<br />
its neighbour, at 230 kg/capita. Import levels are relatively low, consisting<br />
mainly of condensed milk and powered milk<br />
Table 35: Trade in dairy products, Uzbekistan (tons)<br />
<strong>Dairy</strong> products 2005 2006 2007<br />
Imports<br />
Liquid milk & cream 5 619 601<br />
UHT milk 1,720 1,747 1,527<br />
Butter & butterfat 6,154 6,310 4,927<br />
Cheese 259 126 83<br />
Source: <strong>FAO</strong><br />
4.5 Key priorities<br />
All of the WBCs are aspiring to be members of the EU. They suffer many<br />
disadvantages, which will need attention in the years ahead. Farms are small,<br />
46
and the farm structure is fragmented. The age structure of the farming population<br />
is not favourable. Husbandry is poor due to low education standards, poor<br />
cattle genetics and limited knowledge. Yields are, therefore, low. Labour costs<br />
are low, but transportation costs are high and typically involve small volumes<br />
of milk. Hygienic milk quality is poor, and there are typically few cooling<br />
facilities for raw milk. Health and hygiene standards on farms and in dairies<br />
are well below EU norms. With a few exceptions, the level of foreign inward<br />
investment in the WBCs has been low; as a result, the current processing<br />
infrastructures are small-scale, and technological improvement is needed.<br />
Some countries in the region have been more open to foreign investment than<br />
others. Domestic industries suffer from import competition from both within<br />
and outside the region and, without restructuring of and investment in these<br />
industries, this competition will increase over time.<br />
The ETCs suffer from the same problems as do those in the WBCs. Some<br />
countries have better infrastructure, as a legacy from the days of the Soviet<br />
regime, but all countries lack investment in transport, processing infrastructures<br />
and the rural environment. Consumption levels are generally low. Without<br />
new investment in farming and processing infrastructures, the dependence<br />
on dairy imports will grow as consumers expand their buying habits and diets.<br />
47