Agribusiness Handbook: Milk / Dairy Products - FAO
Agribusiness Handbook: Milk / Dairy Products - FAO
Agribusiness Handbook: Milk / Dairy Products - FAO

Create successful ePaper yourself
Turn your PDF publications into a flip-book with our unique Google optimized e-Paper software.
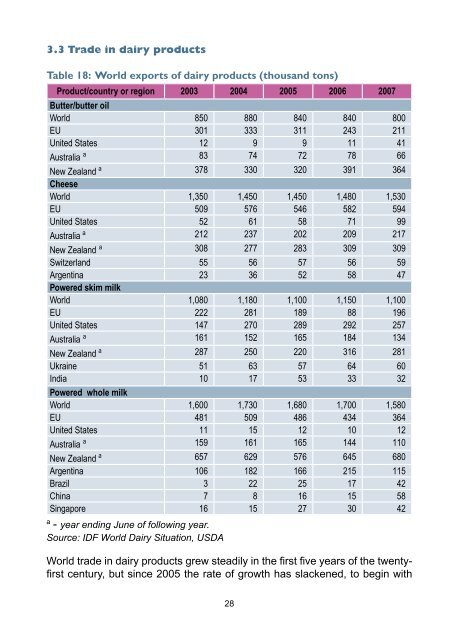
3.3 Trade in dairy products<br />
Table 18: World exports of dairy products (thousand tons)<br />
Product/country or region 2003 2004 2005 2006 2007<br />
Butter/butter oil<br />
World 850 880 840 840 800<br />
EU 301 333 311 243 211<br />
United States 12 9 9 11 41<br />
Australia a 83 74 72 78 66<br />
New Zealand a 378 330 320 391 364<br />
Cheese<br />
World 1,350 1,450 1,450 1,480 1,530<br />
EU 509 576 546 582 594<br />
United States 52 61 58 71 99<br />
Australia a 212 237 202 209 217<br />
New Zealand a 308 277 283 309 309<br />
Switzerland 55 56 57 56 59<br />
Argentina 23 36 52 58 47<br />
Powered skim milk<br />
World 1,080 1,180 1,100 1,150 1,100<br />
EU 222 281 189 88 196<br />
United States 147 270 289 292 257<br />
Australia a 161 152 165 184 134<br />
New Zealand a 287 250 220 316 281<br />
Ukraine 51 63 57 64 60<br />
India 10 17 53 33 32<br />
Powered whole milk<br />
World 1,600 1,730 1,680 1,700 1,580<br />
EU 481 509 486 434 364<br />
United States 11 15 12 10 12<br />
Australia a 159 161 165 144 110<br />
New Zealand a 657 629 576 645 680<br />
Argentina 106 182 166 215 115<br />
Brazil 3 22 25 17 42<br />
China 7 8 16 15 58<br />
Singapore 16 15 27 30 42<br />
a<br />
- year ending June of following year.<br />
Source: IDF World <strong>Dairy</strong> Situation, USDA<br />
World trade in dairy products grew steadily in the first five years of the twentyfirst<br />
century, but since 2005 the rate of growth has slackened, to begin with<br />
28