He Ritenga Whakaaro - New Zealand Doctor
He Ritenga Whakaaro - New Zealand Doctor
He Ritenga Whakaaro - New Zealand Doctor

You also want an ePaper? Increase the reach of your titles
YUMPU automatically turns print PDFs into web optimized ePapers that Google loves.
<strong>He</strong> <strong>Ritenga</strong> <strong>Whakaaro</strong>:<br />
Māori experiences of health services
<strong>He</strong> <strong>Ritenga</strong> <strong>Whakaaro</strong>:<br />
Māori experiences of health services
© Mauri Ora Associates<br />
Printed by Proclaim Solutions Group<br />
First printed January 2009<br />
ISBN 978-0-473-14643-6<br />
PO Box 33577, Takapuna, North Shore City 0740<br />
Level 1, 7 Anzac Street, Takapuna , Auckland, <strong>New</strong> <strong>Zealand</strong><br />
Ph: +64 9 486 7148 | Fax: +64 9 486 7150<br />
www.mauriora.co.nz
Discussions with the Māori advisory committees for this project led to the adoption of the title <strong>He</strong> <strong>Ritenga</strong><br />
<strong>Whakaaro</strong>: Māori experiences of health services. <strong>He</strong> ritenga whakaaro refers to the similar experiences that many<br />
Māori have when accessing mainstream services.<br />
Citation: Jansen P, Bacal K, Crengle S. <strong>He</strong> <strong>Ritenga</strong> <strong>Whakaaro</strong>: Māori experiences of health services. Auckland,<br />
Mauri Ora Associates 2008.<br />
This document is available on Mauri Ora Associates website:<br />
www.mauriora.co.nz<br />
<strong>He</strong> <strong>Ritenga</strong> <strong>Whakaaro</strong>: Māori experiences of health services | 3
Acknowledgements<br />
Tēnei te mihi whānui atu ki a koutou katoa.<br />
Tokomaha rawa anō i āwhina nui i tēnei kaupapa, nō reira ka mihi whānui. Kāore e taea te whakahua i ngā ingoa<br />
katoa kei wareware tētahi, heoi, he mihi kau ake nei. Ko te kaupapa i whakawhāiti nei i a tātou, ko te whakapiki i<br />
te hauora o ngāi tāua, otirā te whakatika i te ratonga hauora ki te iwi. <strong>He</strong> kaupapa nui hoki tēnei, nō reira ka mihi,<br />
tēnā koutou, tēnā koutou, tēnā rā koutou katoa.<br />
This research study was undertaken by Mauri Ora Associates and was supported (in part) by a contract from<br />
the <strong>He</strong>alth Research Council of <strong>New</strong> <strong>Zealand</strong> (HRC), the Ministry of <strong>He</strong>alth and the Accident Compensation<br />
Corporation (ACC).<br />
We thank those individuals and groups that contributed to this report by providing information, time and expertise.<br />
We are particularly indebted to the following for their generous contribution to the study:<br />
Jimmy Aoake, Edward Ellison, Waaka Gage, Whakawhiti Gage, Naida Glavish, Riripeti Haretuku, Moe Milne, Te<br />
Uwira Papanui, Maaka Tibble, Amster Reedy (members of the Kaumātua Advisory Committee and Consumer<br />
Advisory Committee)<br />
Special thanks to Patrick Thompson who coordinated the development of materials for deaf Māori, the locating of<br />
tri-lingual interpreters and the interviews of deaf Māori.<br />
Donella Parker and Steve Allen (technical advisors)<br />
Manujon Pemerika (hui facilitator)<br />
Dr Fiona Cram (reviewer)<br />
Special thanks also to Verna Ohia-Gate (ACC), Sharon McCook (HRC), Tu Williams (HRC), Kiri Waldegrave (MoH),<br />
Paula Searle (MoH), Monique Priston (MoH), Catherine Dunkley, the Waikato Regional Ethics Committee, local hui<br />
co-ordinators and members of the funding partners’ Consumer Advisory Committee.<br />
Our thanks and acknowledgement to Proclaim for designing the front cover incorporating the tokotoko.<br />
We acknowledge those who are working to improve health and disability services for Māori and the many Māori<br />
individuals, whānau and communities that have taken an active role in developing and improving services for Māori<br />
– ngā mihi ki a koutou katoa.<br />
nā, Peter Jansen<br />
4 | <strong>He</strong> <strong>Ritenga</strong> <strong>Whakaaro</strong>: Māori experiences of health services
Table of Contents<br />
1 Whakarāpopototanga – Executive Summary 8<br />
2 Tātaritanga Ā Rangahau Hāngai - Literature Review 13<br />
2.1 <strong>He</strong>alth Inequalities . . . . . . . . . . . . . . . . . . . . . . . . . . . . . . . . . . . . . . . . . . . . . . . . . . . . . . . . . . . . . . . 13<br />
2.2 Access And Outcomes . . . . . . . . . . . . . . . . . . . . . . . . . . . . . . . . . . . . . . . . . . . . . . . . . . . . . . . . . . . . 14<br />
2.3 Understanding Disparities . . . . . . . . . . . . . . . . . . . . . . . . . . . . . . . . . . . . . . . . . . . . . . . . . . . . . . . . . 17<br />
2.4 Consumer Assessment Of Services . . . . . . . . . . . . . . . . . . . . . . . . . . . . . . . . . . . . . . . . . . . . . . . . . . 26<br />
2.5 The Present Study . . . . . . . . . . . . . . . . . . . . . . . . . . . . . . . . . . . . . . . . . . . . . . . . . . . . . . . . . . . . . . . 32<br />
3 Ngā Tapuae Me Ngā Raraunga – Methodology 35<br />
3.1 Research Oversight . . . . . . . . . . . . . . . . . . . . . . . . . . . . . . . . . . . . . . . . . . . . . . . . . . . . . . . . . . . . . . 35<br />
3.2 Overview Of Research Methods . . . . . . . . . . . . . . . . . . . . . . . . . . . . . . . . . . . . . . . . . . . . . . . . . . . . 35<br />
3.3 Hui Method . . . . . . . . . . . . . . . . . . . . . . . . . . . . . . . . . . . . . . . . . . . . . . . . . . . . . . . . . . . . . . . . . . . . 37<br />
3.4 Survey Method . . . . . . . . . . . . . . . . . . . . . . . . . . . . . . . . . . . . . . . . . . . . . . . . . . . . . . . . . . . . . . . . . 38<br />
4 Ngā Tukunga Iho O Ngā Hui – Hui Findings 44<br />
4.1 Participants’ Experiences Of General Practice . . . . . . . . . . . . . . . . . . . . . . . . . . . . . . . . . . . . . . . . . . 44<br />
4.2 Participant Experiences At Hospital, Including A&E . . . . . . . . . . . . . . . . . . . . . . . . . . . . . . . . . . . . . 49<br />
4.3 Participants’ Experiences With ACC . . . . . . . . . . . . . . . . . . . . . . . . . . . . . . . . . . . . . . . . . . . . . . . . . 52<br />
4.4 Patient Experiences With Other <strong>He</strong>alth Services . . . . . . . . . . . . . . . . . . . . . . . . . . . . . . . . . . . . . . . . 54<br />
4.5 Patient Experiences With Funding Bodies . . . . . . . . . . . . . . . . . . . . . . . . . . . . . . . . . . . . . . . . . . . . . 55<br />
4.6 Discussion . . . . . . . . . . . . . . . . . . . . . . . . . . . . . . . . . . . . . . . . . . . . . . . . . . . . . . . . . . . . . . . . . . . . . 57<br />
5 Ngā Tukunga Iho O Ngā Rārangi Uiui – Survey Findings 60<br />
5.1 <strong>He</strong>alth Status . . . . . . . . . . . . . . . . . . . . . . . . . . . . . . . . . . . . . . . . . . . . . . . . . . . . . . . . . . . . . . . . . . . 60<br />
5.2 Service Utilisation . . . . . . . . . . . . . . . . . . . . . . . . . . . . . . . . . . . . . . . . . . . . . . . . . . . . . . . . . . . . . . . . 60<br />
5.3 Feedback On <strong>He</strong>alth Services . . . . . . . . . . . . . . . . . . . . . . . . . . . . . . . . . . . . . . . . . . . . . . . . . . . . . . 63<br />
5.4 Respondents’ Attitudes . . . . . . . . . . . . . . . . . . . . . . . . . . . . . . . . . . . . . . . . . . . . . . . . . . . . . . . . . . . 68<br />
5.5 Subgroup Formation And Analysis . . . . . . . . . . . . . . . . . . . . . . . . . . . . . . . . . . . . . . . . . . . . . . . . . . . 70<br />
5.6 Discussion . . . . . . . . . . . . . . . . . . . . . . . . . . . . . . . . . . . . . . . . . . . . . . . . . . . . . . . . . . . . . . . . . . . . . 74<br />
6 References 78<br />
7 Kupu Māori 89<br />
8 Glossary 90<br />
9 Appendices 92<br />
<strong>He</strong> <strong>Ritenga</strong> <strong>Whakaaro</strong>: Māori experiences of health services | 5
List of Appendices, Figures & Tables<br />
List of Appendices<br />
Appendix A. Literature review methodology 93<br />
Appendix B. Hui data 94<br />
Appendix C. Explanatory letter 98<br />
Appendix D. Survey questionnaire 101<br />
Appendix E. Survey respondents’ nearest town, city or area 113<br />
Appendix F. Detailed information about analysis of survey questionnaire 114<br />
Appendix G. Questionnaire reliability and validity 115<br />
Appendix H. Modelling analysis of overall satisfaction and revisit intention 119<br />
Appendix I. Demographics for Group 1 and Group 2 128<br />
List of Figures<br />
Figure 1. Life expectancy at birth 1950 to 2000, Māori and non-Māori 14<br />
Figure 2. ACC 2003 claim rates by ethnicity, gender and age group 16<br />
Figure 3. Unmet need for general practitioner in last 12 months, by ethnic group and sex (age-standardised) 22<br />
Figure 4. Deprivation Index 42<br />
Figure 5. Respondents’ health status by service used (%) 61<br />
Figure 6. Services used by different health groups 62<br />
Figure 7. <strong>He</strong>alth card comparison 130<br />
Figure 8. Income comparison 130<br />
List of Tables<br />
Table 1. Respondent’s, experiences of health service visits, percentage agreement 10<br />
Table 2. Hui dates, locations, and demographic characteristics of participants 37<br />
Table 3.Gender and age groups of respondents 40<br />
Table 4. Number of people living in respondents’ household (including respondent) 40<br />
Table 5 Household composition and working status 41<br />
Table 6 Respondent’s annual household income 41<br />
Table 7 Respondent’s with Community Services Card and/or High Use <strong>He</strong>alth Card 42<br />
Table 8. Respondent’s Māori language ability 42<br />
Table 9. Response on behalf of self or other 43<br />
Table 10. Current health status 60<br />
Table 11 Number of respondents’ who had used health services in past 6 months, N=651 60<br />
Table 12. Current health status and services used in past 6 months 61<br />
Table 13. <strong>He</strong>alth services respondents’ surveyed about, N=651. 62<br />
Table 14. Survey response and services used in past six months 63<br />
Table 15. Respondent’s experiences of health service visits 64<br />
Table 16. Respondents’ attitudes towards visiting the doctor 68<br />
6 | <strong>He</strong> <strong>Ritenga</strong> <strong>Whakaaro</strong>: Māori experiences of health services
List of Appendices, Figures & Tables<br />
Table 17. Respondents’ attitudes about GPs and doctors 69<br />
Table 18. Respondents’ attitudes about cultural competency 69<br />
Table 19. Respondents’ attitudes towards other health staff 70<br />
Table 20. Respondents’ attitudes towards the <strong>New</strong> <strong>Zealand</strong> health system 70<br />
Table 21. A comparison of Group 1 and Group 2 respondents’ satisfaction with, and willingness to revisit, health<br />
services 71<br />
Table 22. Respondents’ perceptions of health and willingness to visit 71<br />
Table 23. Respondents’ relationships with their GP 72<br />
Table 24. Respondents’ rapport with health personnel 72<br />
Table 25. Respondents’ perceptions of GP care 72<br />
Table 26. Patient perceptions of hospitals 73<br />
Table 27. Patient perceptions of the healthcare system 73<br />
Table 28. Services utilised 74<br />
Table 29. GPs: Intention to revisit 119<br />
Table 30. GPs: Overall visit rating 120<br />
Table 31. GPs: Overall rating vs. time spent listening 120<br />
Table 32. GPs: Observed vs. predicted ratings 121<br />
Table 33. Specialists: Intention to revisit 121<br />
Table 34. Specialists: Overall visit rating 122<br />
Table 35. Specialists: Observed vs. predicted 122<br />
Table 36. A&E: Intention to revisit 123<br />
Table 37. A&E: Overall visit rating 123<br />
Table 38. A&E: Observed vs. predicted 124<br />
Table 39. Hospital Intention to revisit 124<br />
Table 40. Hospital: Overall visit rating 125<br />
Table 41. Hospital: Observed vs. predicted 125<br />
Table 42. Funding Bodies: Intention to revisit 125<br />
Table 43. Funding Bodies: Overall visit rating 126<br />
Table 44. Funding Bodies: Observed vs. predicted 126<br />
Table 45. Other Services: Intention to revisit 127<br />
Table 46. Other Services: Overall visit rating 127<br />
Table 47. Other Services: Observed vs. predicted 127<br />
Table 48. Attitude group demographics 128<br />
Table 49. Attitude group Māori language ability 129<br />
Table 50. Attitude group demographics 129<br />
<strong>He</strong> <strong>Ritenga</strong> <strong>Whakaaro</strong>: Māori experiences of health services | 7
1 Whakarāpopototanga – Executive Summary<br />
The Ministry of <strong>He</strong>alth and the Accident Compensation Corporation (ACC) have identified addressing the poor<br />
health status of Māori as being of the highest priority (ACC 2005; Ministry of <strong>He</strong>alth 2005). While Māori have lower<br />
life expectancy, greater morbidity and higher rates of disability, they have less access to health and rehabilitation<br />
services than do non-Māori. The perceptions of Māori consumers can contribute to understanding how the health<br />
system is or is not facilitating their access to health care. The present study explored these perceptions.<br />
Background<br />
Internationally, researchers have identified both barriers to, and facilitators of, access to health care for minority<br />
patients in their search for explanations for health disparities. <strong>New</strong> <strong>Zealand</strong> studies have similarly identified<br />
organisational, human resource, and patient-community issues in access to health care.<br />
At the organisational level barriers include: the timing and availability of services, the universal, Western approach<br />
to health care, the under-representation of Māori in the health professions, appointment systems, and the lack of<br />
appropriate educational and promotional material.<br />
At the human resource level barriers include: the characteristics of non-Māori health staff, including their<br />
perceptions of and attitudes about Māori patients; and appropriate provider-patient communication, or lack thereof.<br />
At the individual or community level barriers include: the socio-economic position of many Māori which makes<br />
healthcare unaffordable; and patient attitudes, beliefs and preferences which may make healthcare inappropriate,<br />
feared and/or not a priority.<br />
Patient feedback about their satisfaction with health care providers can provide valuable information about barriers<br />
to, and facilitators of, healthcare which, in turn, can aid clinicians in their ability to provide accessible healthcare to<br />
Māori. Legal services, car repairs and healthcare have been described as ‘credence goods’ in that consumers must<br />
rely on the credibility of the expert provider in diagnosis and treatment of their problem. The consumer cannot<br />
easily assess the technical competence of the health provider (such as diagnostic abilities, clinical knowledge and<br />
surgical skills) but is well placed to judge the interpersonal aspects of the service they receive.<br />
The interpersonal skills of health providers are therefore most often critiqued by consumers with satisfaction<br />
dependent on, for example, consumers’ perceptions of trust, respect, sensitivity and understanding. Good<br />
communication by the provider is one of the most important predictors of patient satisfaction.<br />
The present research examined Māori perceptions of the healthcare system and what Māori themselves identify as<br />
barriers to access. Findings from an initial qualitative study examining Māori experiences of health care informed<br />
the development of a survey questionnaire that was then pilot-tested with a random sample of Māori from across<br />
the country.<br />
Research Objective<br />
Through analysing existing information on health service use and surveying Māori consumers, this research project<br />
sought to understand the expectations, preferences and experiences of Māori consumers of health and disability<br />
services, including Accident Compensation Corporation (ACC) services. The objective of the present research was<br />
therefore to increase understanding of:<br />
Māori use of health and disability services,<br />
Māori experiences, expectations and perceptions of, and satisfaction with, health and disability services,<br />
Māori consumers’ understanding of the information they are given by health and disability providers, and<br />
Barriers to optimal use of health and disability services by Māori.<br />
Furthermore, another objective of the present research was to test the survey tool with Māori consumers, including<br />
the testing of individual questions, so as to validate its use in future research into how well services meet the needs<br />
and expectations of Māori.<br />
8 | <strong>He</strong> <strong>Ritenga</strong> <strong>Whakaaro</strong>: Māori experiences of health services
Whakarāpopototanga – Executive Summary 1<br />
Methodology<br />
The present research took a Kaupapa Māori, ‘by Māori, for Māori’, approach in that, for example, the research was<br />
led by, and guided by, Māori. Māori participant experiences were privileged. And the analysis of research findings<br />
was strengths-based and performed within a systems analysis. The research project was also overseen and guided<br />
by Kaumātua and consumer advisory groups.<br />
The research focused on Māori only, as one goal of the project was to develop and validate a survey tool that was<br />
specifically designed for use with Māori populations.<br />
The first part of the research involved a series of ten hui with Māori consumers of health and disability services. The<br />
number of participants at each hui ranged from five to 15, with a total of 86 people attending the hui.<br />
The findings from the hui were used alongside existing ‘experiences of care’ surveys to develop a semi-structured<br />
survey questionnaire to collect data on Māori experiences with health and disability services. A telephone survey<br />
with a random sample of Māori from across the country, combined with face-to-face interviews with a sample<br />
of 50 deaf Māori, yielded survey responses from a total of 651 Māori (384 females (59%) and 267 males (41%)).<br />
Respondents were asked about the health and disability services, as well as ACC, they had been to in the six<br />
months prior to being questioned.<br />
Limitations<br />
As the research focused exclusively on Māori consumers, per the study’s goal of developing a Māori-specific<br />
evaluation tool, it provided no comparative data.<br />
The survey sample was representative of the Māori community but not comprehensive, and respondents for both<br />
the hui and survey phases were those who were willing to speak about their experiences. As a result the views of<br />
those who feel dis-enfranchised and refuse to participate may be under-represented in the findings. Nevertheless<br />
few of those contacted during the survey phase declined to participate.<br />
The survey results are based on a survey that aimed to sample the responses of 650 Māori (including 50 Māori deaf)<br />
about their experiences with health care services in the six months prior to the telephone survey. To avoid overrepresentation<br />
from primary care experiences a quota was set to ensure that 30% of the final responses were from<br />
Māori reporting on non-general practice encounters.<br />
The research aimed to develop a survey instrument that would be suitable for use with Māori consumers. Because<br />
of this, the goal of the research was to test the tool and its questions.<br />
Ngā Tukunga Iho o Ngā Hui – Hui Findings<br />
The hui participants talked about their experiences and opinions of a range of health and disability services.<br />
Although experiences differed according to the services being discussed, four key themes emerged about barriers<br />
to healthcare. These barriers were greatest for Māori with disabilities (ngā hunga hauā).<br />
Organisational barriers included: the distance to travel for care, the availability of appointments at suitable times,<br />
waiting times, the (lack of) choice of provider, inflexibility of healthcare systems, and poor experiences (e.g., lack of<br />
response to complaints, lengthy resolution times).<br />
Cost barriers included: direct costs (e.g., consultation costs, prescription charges), and indirect costs (e.g., loss<br />
of wages due to time off work while obtaining care, expenses relating to travel or childcare). Participants also<br />
questioned whether a general practitioner visit was ‘value for money’.<br />
<strong>He</strong>alth provider barriers included: perceptions of negative or racist health provider attitudes toward Māori, and<br />
being talked ‘down to’ or treated with disrespect by staff. When both good communication and good health care<br />
provision was experienced, relationship building was reported.<br />
Cultural fit barriers included: consumer attitudes such as ‘shyness’, reticence to challenge authority, a ‘wait and see’<br />
attitude toward sickness or injury that was often related to cost, prior bad experiences and perceptions of being<br />
patronised, and a preference (often unfulfilled) for Māori clinicians or Māori providers.<br />
<strong>He</strong> <strong>Ritenga</strong> <strong>Whakaaro</strong>: Māori experiences of health services | 9
1 Whakarāpopototanga – Executive Summary<br />
Compared with previous research, the participants at the hui talked less about socio-economic barriers to<br />
healthcare and more about whether or not they were treated with respect, whether the service was ‘value for<br />
money’, and (for a few participants) the clinical skills of health workers. These judgements about respect, value<br />
and skill may signal Māori consumers’ growing willingness to voice their concerns about their experiences of<br />
disrespect, racism and clinical practice.<br />
Ngā Tukunga Iho o Ngā Rārangi Uiui – Survey Findings<br />
Over half of the survey respondents (54.4%) had no health condition that required on-going treatment. The<br />
remaining respondents had health conditions (23.7%), physical conditions (10.6%), sensory conditions (9.8%), and/<br />
or a mental or intellectual disability (1.2%). General practitioners were the health service utilised most often by all<br />
participants in the six months prior to being surveyed.<br />
Overall, respondents’ experiences of different services were positive. The services were compared on a number of<br />
questions, with the following results as shown in Table 1.<br />
Table 1. Respondents experiences of health service visits, percentage agreement<br />
Question / Topic GP Hospital A&E Specialist ACC Other 1<br />
Number of visits reported on 502 200 139 174 77 137<br />
Able to get a suitable appointment time 94% 2 N/A N/A 3 90% N/A N/A<br />
Seen on time 64% N/A N/A 80% N/A N/A<br />
Confidence and trust in the service<br />
provider 4 92% 82% N/A 91% 65% 93%<br />
Receptionist was polite 96% N/A 86% 93% N/A N/A<br />
The service provider (e.g., doctor) asked<br />
enough questions<br />
87% 83% 86% 88% N/A N/A<br />
Service provider spent enough time<br />
listening<br />
89% N/A N/A 85% 78% 84%<br />
Service provider spent enough time with<br />
respondent<br />
90% 84% 86% 90% N/A N/A<br />
Service provider explained things well 87% 82% 81% 86% 58% 82%<br />
Respondent given enough privacy 98% 83% 89% 94% 73% 97%<br />
Respondent treated with respect 96% 87% 91% 97% 82% 96%<br />
Service provider respected respondent’s<br />
culture and beliefs<br />
N/A 81% N/A N/A 75% 86%<br />
Service provider said respondent’s name<br />
properly<br />
83% N/A N/A 86% N/A N/A<br />
Overall satisfaction = ‘Good’ 79% 64% 63% 74% 48% 79%<br />
Would visit this service again 93% 82% 82% 87% 82% 90%<br />
Notes.<br />
1.<br />
‘Other’ included other health and disability services that respondents had accessed (e.g., physiotherapy,<br />
occupational therapy). 2. Percentage of participants agreeing with service statement. 3. ‘N/A’ indicates that this<br />
question was not asked for this service. 4. Respondents may have rated a doctor from their GP visit, a doctor or<br />
nurse from their A&E, other health professionals from their hospital visit, a staff member from ACC, or a health<br />
professional/worker from their other health services experiences.<br />
With the exception of ACC (and A&E which was not rated on this question), most respondents (82%-93%) reported that<br />
10 | <strong>He</strong> <strong>Ritenga</strong> <strong>Whakaaro</strong>: Māori experiences of health services
Whakarāpopototanga – Executive Summary 1<br />
they had confidence and trust in most service providers. GP, specialist and other health services were rated as ‘good’ by<br />
most of the respondents (74-79%). Just under half (48%) of the respondents asked, rated their last ACC visit as ‘good’.<br />
Most respondents (78%-89%) reported that their GP, specialist, ACC staff member, or other health service provider<br />
had spent enough time listening to them.<br />
With the exception of ACC, most service providers were rated as explaining things well by respondents. Just over<br />
half of the respondents (58%) reported that the ACC person they had met with had done so.<br />
A majority of respondents reported that their service provider had given them enough privacy (73%-98%), and<br />
treated them with respect (82%-97%).<br />
Most respondents reported that they would visit the same service again (82%-93%).<br />
Respondents were also asked about their attitudes about their own health and about visiting different health<br />
services. Just over half of the respondents agreed with the statement ‘I am in excellent health’. A similar number<br />
agreed with the statement that ‘I have some concerns about my health’.<br />
A cluster analysis performed on respondents’ answers to the attitude questions, to look for groups of respondents<br />
with similar attitudes, differentiated between two groups: Group 1 comprised 73.3% of the total sample (78% of the<br />
sample included in the cluster analysis), while Group 2 comprised 20.7% of the total sample (22% of those included<br />
in the cluster analysis). The only significant demographic differences between the two groups were that:<br />
Group 2 was younger than Group 1 (mean age = 39 vs. 47 years respectively; t=6.284, p
1 Whakarāpopototanga – Executive Summary<br />
<strong>New</strong> <strong>Zealand</strong> European population than they were to older Māori (>45 years) or Pacific peoples. This may have<br />
enabled those in Group 2 to feel more empowered to express disapproval about the health care they had received.<br />
In contrast older Māori may have felt that it was less appropriate for them to express negative views of health<br />
providers (noho whakaiti) as they were concerned with relationship maintenance.<br />
Discussion<br />
The overall survey findings were that Māori were reasonably satisfied with their encounters with the health services,<br />
including ACC. However a subgroup of those questioned expressed disapproval for the health care they and the<br />
general Māori community receive.<br />
This younger cohort of respondents may signal a growing trend among Māori, also noted in the findings from the<br />
hui, to critique the health system. If this is the case then the challenge for the health system is to ‘up its game’ by<br />
improving its delivery of health care services that are appropriate, accessible and effective for Māori. In this way, the<br />
health system can become a leading solution in the ‘crisis in Māori health’ that is evident in current disparities.<br />
12 | <strong>He</strong> <strong>Ritenga</strong> <strong>Whakaaro</strong>: Māori experiences of health services
Tātaritanga ā Rangahau Hāngai - Literature Review 2<br />
Considerable local and international evidence about inequalities in health has become available in the last decade<br />
(MOH 2002; Smedley et al 2002; Robson & Harris 2007). <strong>He</strong>alth inequalities occur between population groups<br />
according to numerous factors, including cultural and historical, socio-economic status, geographical place of<br />
residence, ethnic identity, and gender.<br />
A contributing factor to these inequalities is the unequal access to health services experienced by different<br />
population groups (MOH 2002). Disparities in access to health services have been found in many different health<br />
care settings (Todd 1993; Lillie-Blanton 2000; Geiger 2001; Fiscella et al 2002) including: home-based or community<br />
services; preventive and primary care services (Gemson et al 1988; Ashford et al 2000; Williams et al 2001; Franks<br />
et al 2005); injury treatment services (Bismark 2006; Bismark et al 2006); and a range of hospital services (Pruss<br />
et al 2000; Arroll et al 2002; Ellison-Loschmann et al 2002; McNaughton et al 2002; Tukuitonga & Bindman 2002;<br />
Davis et al 2006). In addition, ethnic disparities in healthcare have been shown to remain even after adjustment for<br />
socioeconomic differences and other healthcare access-related factors (such as life insurance) (Smedley et al 2002).<br />
In order to understand these disparities, research has examined the barriers to, and facilitators of, marginalised groups’<br />
access to health care along the continuum of care. This research demonstrates that the capacity of the health sector to<br />
meet the needs of these groups is questionable at every level – from the individual patient to the interactions between<br />
patients and health professionals to the health system of a country (Smedley et al 2002; La Fond et al 2002).<br />
The perceptions of patients themselves are important in understanding how the health system is (not) facilitating<br />
their access to care and operating to improve their health. While patients may not be able to accurately judge the<br />
technical aspects of their care, they can assess the structural and procedural components of the health care they<br />
receive (<strong>New</strong>some & Wright 1999). Patient feedback on these components is now integral to quality assurance and<br />
quality improvement in many countries (Fitzpatrick 1991; Steele 1992; <strong>New</strong>some & Wright 1999).<br />
In Aotearoa <strong>New</strong> <strong>Zealand</strong> Māori experience the greatest levels of health inequality, with Māori mortality and<br />
morbidity being significantly worse than non-Māori (Sporle et al 2002; Ajwani et al 2003; Westbrooke et al 2001).<br />
The present chapter examines the extent of the health inequalities experienced by Māori, with a particular focus on<br />
the disparities that exist in the access Māori and non-Māori have to health care. Explanations for these disparities<br />
are then explored before attention is turned to the question of how patient feedback on the health system is best<br />
obtained. The following chapter then discusses issues related to Māori involvement in research, as gaining feedback<br />
on Māori patient experiences is a form of research. This sets the scene for a description of the approach taken in the<br />
present study. (See Appendix A for the methodology used for the literature review).<br />
2.1 <strong>He</strong>alth Inequalities<br />
There are discrepancies in the health status of <strong>New</strong> <strong>Zealand</strong>ers based on socioeconomic status, geographic place<br />
of residence, ethnic identity and gender (MOH 2002). Māori have the greatest level of health inequality, with<br />
measures of mortality and morbidity showing significant gaps even after controlling for deprivation, access to<br />
care and health needs (Westbrooke et al 2001; Arroll et al 2002; Carr et al 2002; Sporle et al 2002; Tukuitonga<br />
& Bindman 2002; Ajwani et al 2003; MOH 2006). Not only is the health status of Māori worse than that of non-<br />
Māori at all levels of deprivation, but the gap between Māori and non-Māori increases as deprivation increases<br />
(Tukuitonga & Bindman 2002; Ajwani et al 2003; MOH & University of Otago 2006).<br />
In addition, analysis of the 2002/03 <strong>New</strong> <strong>Zealand</strong> <strong>He</strong>alth Survey questions on self-reported racial discrimination<br />
and self-rated health led the researchers to conclude that both deprivation and experiences of perceived racial<br />
discrimination contribute to inequalities in health outcomes between Māori and European <strong>New</strong> <strong>Zealand</strong>ers, noting<br />
that in spite of probable underestimation of the effects of discrimination (Harris et al 2006:2008), 1<br />
… the combination of deprivation and discrimination as measured seems to account for much of<br />
the disparity in the health outcomes assessed.<br />
1 The study included responses from Māori (n=4108) and Europeans (n=6269). The authors analysed the responses to five questions about discrimination: verbal attacks, physical attacks, and unfair<br />
treatment by a health professional, at work, or when buying or renting housing, with logistic regression analyses to assess the effect of adjustment for experience of racial discrimination and deprivation<br />
on ethnic inequalities for various health outcomes. It was reported that Māori were more likely to report discrimination in response to these questions, and were almost ten times more likely to report<br />
discrimination in three or more settings than were Europeans (4·5% [95% CI 3·2–5·8] vs. 0·5% [0·3–0·7]). After adjustment for discrimination and deprivation, odds ratios (95% CI) comparing Māori and<br />
European ethnic groups were reduced from 1·67 (1·35–2·08) to 1·18 (0·92–1·50) for poor or fair self-rated health, 1·70 (1·42–2·02) to 1·21 (1·00–1·47) for low physical functioning, 1·30 (1·11–1·54) to<br />
1·02 (0·85–1·22) for low mental health, and 1·46 (1·12–1·91) to 1·11 (0·82–1·51) for cardiovascular disease.<br />
<strong>He</strong> <strong>Ritenga</strong> <strong>Whakaaro</strong>: Māori experiences of health services | 13
2 Tātaritanga ā Rangahau Hāngai - Literature Review<br />
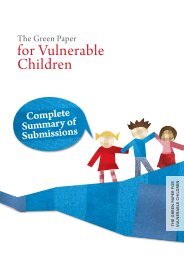
Life expectancy is a key indicator of health and is showcased here before attention is turned to disparities in access<br />
to health care. Mortality data from the <strong>New</strong> <strong>Zealand</strong> <strong>He</strong>alth Information Service confirms that, at all ages, Māori<br />
have a higher death rate than non-Māori (MOH 2006). For example, the death rate for Māori females in their 50s<br />
and 60s is roughly three times that of non-Māori females of the same age. As a result, in 2000-2002, life expectancy<br />
at birth was 8.2 years longer for non-Māori males and 8.8 years for non-Māori females, compared to Māori. In<br />
addition, when mortality rates over the 1980s and 1990s are recalculated to adjust for numerator-denominator bias 2 ,<br />
it is clear that the disparities between Māori and non-Māori life expectancy widened substantially over this 20 year<br />
period (Figure 1) (Ajwani et al 2003).<br />
Figure 1. Life expectancy at birth 1950 to 2000, Māori and non-Māori<br />
80<br />
75<br />
70<br />
65<br />
60<br />
Non-Maori Male<br />
Maori pre 1980 Female<br />
adj. Maori, sole Male<br />
Non-Maori Female<br />
adj. Maori, prioritised Male<br />
adj. Maori, sole Female<br />
Maori pre 1980 Male<br />
adj. Maori, prioritised Female<br />
55<br />
50<br />
1950 1960 1970 1980 1990 2000<br />
Adapted from Tatau Kahukura: Māori <strong>He</strong>alth Chart Book (MOH 2006)<br />
2.2 Access and Outcomes<br />
In the 2002 Reducing Inequalities in <strong>He</strong>alth (p.20-22) the Ministry of <strong>He</strong>alth identified four possible sites for<br />
interventions to reduce inequalities and improve health:<br />
Structural – social, economic, cultural and historical factors fundamentally determine health.<br />
Intermediary pathways – the impact of social, economic, cultural and historical factors on health status is mediated<br />
by various factors.<br />
<strong>He</strong>alth and disability services – what services can specifically do.<br />
Impact – minimising the impact of disability and illness.<br />
Similarly the authors of the Decades of Disparity reports (Ajwani et al 2003; Blakely et al 2007; MOH 2005c; MOH<br />
& University of Otago 2006) outline the possible reasons for ethnic disparities as:<br />
1. Social structural: inequalities in income and other economic or social benefits impact adversely on health.<br />
2. Epidemiological: both risk factors for major chronic diseases (obesity, tobacco use and diet) and the diseases<br />
themselves (diabetes, cardiovascular disease and cancer) are more prevalent in Māori than non-Māori<br />
communities.<br />
3. <strong>He</strong>alth services: both lesser access to care and lower quality of care may contribute to disparities.<br />
Although the relative importance of each factor or their combined effects has yet to be clearly resolved,<br />
Decades of Disparity III suggests that only about half of the disparity for Māori may be due to socioeconomic<br />
status MOH & University of Otago 2006).<br />
2 During the 1980s and early 1990s Māori and Pacific mortality was seriously undercounted, because ethnicity was recorded differently on death registration forms than in the census. The <strong>New</strong> <strong>Zealand</strong><br />
Census–Mortality Study (Public <strong>He</strong>alth Intelligence, Ministry of <strong>He</strong>alth), a record linkage study in which death registration data is linked anonymously and probabilistically to census data, enabled the<br />
extent of this ‘numerator-denominator bias’ to be calculated. Undercount adjusters derived from this study were applied to ethnic specific mortality rates for the 20-year period 1980–1999, giving rise to a<br />
mortality time series largely free of numerator – denominator bias.<br />
14 | <strong>He</strong> <strong>Ritenga</strong> <strong>Whakaaro</strong>: Māori experiences of health services
Tātaritanga ā Rangahau Hāngai - Literature Review 2<br />
Addressing inequalities across all these levels is imperative for both Māori health and the health of the entire<br />
population (Mackenback 2002). At the level of health and disability services Māori experience unequal access and<br />
unequal outcomes at all levels of the healthcare system in <strong>New</strong> <strong>Zealand</strong> (Ruakere 1998; Baxter 2002; Schoen et al<br />
2002; Crengle et al 2005; MOH 2002). The following examples highlight this problem while the following section<br />
looks at the explanations for this denial of access.<br />
2.2.1 Public <strong>He</strong>alth<br />
Skegg and McCredie show that excess cancer death among Māori accounts for two thirds of the excess death in<br />
males, and one quarter of excess death in females (in <strong>New</strong> <strong>Zealand</strong> compared to Australia) (Skegg et al 2002).<br />
2.2.2 Primary Care<br />
A number of studies have reviewed ethnic group differences in utilisation of primary care services or access to<br />
hospital services (Davis et al 2006; MOH 2006). These studies have shown lesser access for Māori compared with<br />
non-Māori <strong>New</strong> <strong>Zealand</strong>ers. In addition, from an analysis of the 1996/7 NZ <strong>He</strong>alth Survey, Scott concluded that<br />
there are barriers for Māori accessing primary care services that are in addition to those related to income and all<br />
other variables (Scott et al 2000).<br />
Some studies have examined the processes and outcomes of care for ethnic groups. For example the 1997 National<br />
Nutrition Survey included measurement of blood pressure and the collection of information about the use of<br />
anti-hypertensive medication. About 10 percent of participants were taking anti-hypertensive medication and an<br />
additional 10 percent were hypertensive at the time of the interview but not taking medication. While nearly half of<br />
those taking anti-hypertensive medication were still hypertensive at the time of the interview, a greater proportion<br />
of Māori and Pacific participants were hypertensive while on medication.<br />
Arroll et al (2002) studied the prevalence of depression and the use of anti-depressants at an Auckland-based<br />
university general practice. The prevalence of depression measured using the Beck Depression Inventory was 13.8<br />
percent, and general practitioners (GPs) identified 51 percent of cases, with Māori patients no more likely to be<br />
depressed than non-Māori patients and no less likely to be correctly diagnosed as depressed. However only one of<br />
the 24 Māori diagnosed with depression was provided treatment compared with 24 of the 53 non-Māori patients.<br />
The differential treatment findings of the Arroll study were supported by an analysis of the National Primary<br />
Medical Care Survey (NatMedCa) by Crengle et al (2005). NatMedCa is a nationally representative study of the<br />
characteristics of over 200 GPs and the practices they work in, the patients they see, the problems they manage and<br />
the investigations and treatments that they offer. Report 6 of the study compares the experiences of Māori patients<br />
with non-Māori patients. In total doctors logged 40,189 consultations, of which 12.2 percent were with Māori<br />
patients (a smaller percentage of Māori than in the general population). Detailed visit information was provided on<br />
9124 visits, of which 12.3 percent were by Māori patients. Analysis of this information revealed that:<br />
• The percentage of Māori patients in Māori provider practices (58.9%) was substantially higher than in private<br />
GPs (11.8%), or community governed non-profits (19.4%).<br />
• Māori were more likely to hold a Community Services Card than non-Māori, and a high proportion of Māori<br />
resided in areas of high deprivation.<br />
• On average Māori had had fewer healthcare visits in the previous year than non-Māori (mean=6.1 vs. 6.7).<br />
• <strong>Doctor</strong>s reported lower levels of rapport with Māori patients, and the overall mean length of consultation<br />
time spent with Māori patients was shorter than for non-Māori (mean=13.7 vs. 15.1 minutes). 3<br />
• Tests and investigations were ordered in 21.0 percent of Māori visits, compared to 25.4 percent of non-<br />
Māori visits.<br />
3 These data were not standardised for age and, compared to non-Māori, a higher percentage of Māori patients were young. As paediatric patients are often seen for shorter times, this could account<br />
for some of the observed differences. However the authors also reported that the mean duration of consultation was slightly lower for Māori than for non-Māori in all age groups, for both sexes and<br />
across all deprivation groups.<br />
<strong>He</strong> <strong>Ritenga</strong> <strong>Whakaaro</strong>: Māori experiences of health services | 15
2 Tātaritanga ā Rangahau Hāngai - Literature Review<br />
• A slightly larger proportion of Māori visits resulted in the prescription of a drug (69.6% versus 65.9% of non-<br />
Māori visits).<br />
• While the average number of prescription items was higher for Māori than for non-Māori, other findings<br />
in the report suggest that some prescribing practices for Māori remain problematic. For example, among<br />
patients with a diagnosis (either new or existing) of chronic obstructive respiratory disease, only 62.6 percent<br />
of Māori received a prescription for a respiratory drug (compared to 71.0% of non-Māori), falling to 9.5<br />
percent of new chronic obstructive airways disease problems resulting in a prescription for a respiratory drug<br />
(versus 77.8% of non-Māori with a new diagnosis of COPD).<br />
• Overall, Māori and non-Māori received similar numbers of non-prescription treatments. Follow-up within<br />
three months was recommended for 54.6 percent of Māori and 57.5 percent of non-Māori visits, and<br />
referrals were slightly less common for Māori (14.7%) than for non-Māori (16.2%).<br />
The authors note that this report confirms that, as a group, Māori have different experiences with general practice<br />
than do non-Māori. These differences (and disparities) are even more marked when the higher burden of disease<br />
among Māori is considered.<br />
2.2.3 Access To Injury Treatment 4<br />
Māori serious injury claims account for 26.9 percent of all ‘open’ serious injury cases compared to the Māori census<br />
population of 16 percent, showing a disproportionately high rate of serious injury. 5 Serious injury accidents to Māori<br />
have been concentrated in the Auckland, Bay of Plenty and Waikato regions, with 46.6 percent of the Māori serious<br />
injury claims related to motor vehicles (compared to 42.8% among non-Māori), and 28.9 percent (compared with<br />
20.2% for non-Māori) of claims falling in the Non-earners category. Fatality rates are also disproportionately high<br />
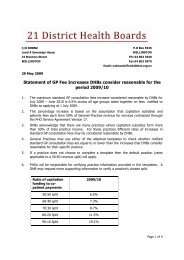
among Māori according to ACC data (ACC 2005). Overall, claim rates show that Māori access ACC services less<br />
than other groups, with this disparity most marked in older age groups and non-earners (primarily those not in<br />
employment, mothers and their children) (see Figure 2).<br />
Figure 2. ACC 2003 claim rates by ethnicity, gender and age group<br />
3,500<br />
3,000<br />
2,500<br />
2,000<br />
1,500<br />
1,000<br />
500<br />
0<br />
0-4 05-09 10-14 15-19 20-24 25-29 30-34 35-39 40-44 45-49 50-54 55-59 60-64 65-69 70-74 75-79 80-84 85+<br />
Māori female Other ethnic groups female Māori male Other ethnic groups male<br />
Source: ACC<br />
4 Injury treatment providers collect ethnicity data on over 90 percent of service users covered by the Accident Compensation Corporation (ACC),3 and 93.7 percent of new entitlement claims listed a<br />
known ethnicity in 2002/2003.<br />
5 ACC data are not adjusted for age.<br />
16 | <strong>He</strong> <strong>Ritenga</strong> <strong>Whakaaro</strong>: Māori experiences of health services
Tātaritanga ā Rangahau Hāngai - Literature Review 2<br />
2.2.4 Secondary Care Services<br />
Analysis of the National Minimum Database over the period 1990-1999 by Tukuitonga et al (2002) suggested bias<br />
against Māori receiving cardiac revascularisation procedures despite the much greater clinical need for intervention<br />
among Māori, with more severe illness, higher rates of risk factors and higher prevalence of disease amongst Māori.<br />
Similar evidence of bias is available for interventions and outcomes following stroke (Lillie-Blanton et al 2000),<br />
obstetric interventions (Sadler et al 2001), heart failure (Carr et al 2002), and asthma (Ellison-Loschmann et al 2002).<br />
McNaughton et al (2002) found that Non-Europeans had longer hospital stays than Europeans following an acute stroke<br />
(median 36 days vs. 18 days), with this difference possibly related to the age of the patient as well as their ethnicity<br />
(McNaughton et al 2002). Māori and Pacific people admitted with acute stroke are younger on average than European<br />
patients, and it is harder to find inpatient rehabilitation services for younger patients. Put another way, the organisation of<br />
rehabilitation services (more beds for older patients) tends to reflect the needs of those of European descent.<br />
2.2.5 Treatment Injuries, Complaints and Other Services<br />
To assess disparities in the quality of hospital care, Davis et al reviewed records from 6579 admissions to 13<br />
public hospitals in 1998 (Davis et al 2006). Preventable adverse events were used as an indicator of suboptimum<br />
treatment. After age standardisation, significantly more Māori admissions were associated with an adverse event<br />
compared with non-Māori/non-Pacific admissions (14% vs. 11%, p=0.01). This disparity persisted after controlling<br />
for age, other sociodemographic factors, and case mix (adjusted odds ratio 1.47; p=0.05),change to "indicating that<br />
Māori patients were more likely to receive suboptimum care while in hospital.<br />
Bismark et al (2006) further examined access to ACC entitlements for treatment injuries and access to complaints<br />
about treatment services. A comparison of hospital records with <strong>He</strong>alth and Disability Commission records and ACC<br />
records found that fewer than 5 percent of all eligible patients claimed ACC compensation (under the former ‘medical<br />
misadventure’ scheme), and only 1 in 25 patients who suffered serious preventable injuries complained to the <strong>He</strong>alth<br />
and Disability Commissioner. In addition, when disability and eligibility for compensation was controlled, Māori had<br />
considerably lower rates of claims than did other <strong>New</strong> <strong>Zealand</strong>ers (Odds ratio 0.4, p
2 Tātaritanga ā Rangahau Hāngai - Literature Review<br />
Addressing Māori access to healthcare can be viewed as a capacity issue; that is, does the health sector have the<br />
capacity to deliver equitable health care to Māori? Capacity is defined here as ‘the ability of individuals, organisations,<br />
and whole societies to define and solve problems, make informed choices, order their priorities and plan for their<br />
futures, as well as implement programs and projects to sustain them’ (Nair, 2003:1). LaFond, Brown and Macintyre<br />
(2000) identify four levels of health sector capacity while emphasising the links between levels (see Diagram 1 pg 18).<br />
These levels are a useful way of looking at the barriers to, and facilitators of, access to health care for Māori and, as<br />
such, each is explored below. Researchers often report barriers and facilitators across multiple levels and, when this<br />
occurs, the findings have been assigned to the appropriate levels. While this is a useful device for discussing access<br />
for Māori, it should be remembered that these levels are interdependent; for example, human resource capacity is<br />
often dependent on the organisation within which health personnel work (LaFond et al. 2002).<br />
Locating reports of successful initiatives to overcome barriers to care for Māori is challenging. Recent evaluations of<br />
healthcare programmes include the ACC pilots aimed at reducing the barriers for disadvantaged populations and<br />
the evaluation of general practice projects aimed at reducing inequalities, are included below, mostly in relation to<br />
the individual/community level.<br />
<br />
<br />
<br />
<br />
<br />
<br />
Diagram 1. Levels of health system capacity<br />
<strong>He</strong>alth system level – the entire health care system<br />
within a country, including organisations and personnel.<br />
Organisation level – the processes, structures and<br />
management systems of health care organisations.<br />
Human resource (health programme personnel) level –<br />
the people who work in health care.<br />
Individual or community level – individuals who<br />
engage with the health sector; for example, as<br />
staff, as committee members, and as patients.<br />
Source. LaFond et al (2002:17, Figure 1)<br />
2.3.1 <strong>He</strong>alth System<br />
The focus of the 2000 <strong>New</strong> <strong>Zealand</strong> <strong>He</strong>alth Strategy (Minister of <strong>He</strong>alth 2000) is on tackling inequalities in<br />
health. This strategy sets the context for the Ministry of <strong>He</strong>alth’s 2002 Māori health strategy, ‘<strong>He</strong> Korowai<br />
Oranga’, as well as for a range of other research and policy initiatives from the Ministry that are designed to<br />
guide the health system in its task of reducing inequalities in health. Recent policy interventions<br />
(www.moh.govt.nz) have sought to improve Māori health by:<br />
• Reducing cost barriers to care, such as capitation models for primary care funding with targeting to Māori,<br />
Pacific and low income groups;<br />
• Reducing differential quality of care offered, such as evidence-based priority scoring systems for surgical<br />
interventions;<br />
• Reducing the incidence of risk factors for disease, by targeted smoking cessation programmes;<br />
• Creating targeted programmes such as the Māori Provider Development Scheme supporting health<br />
promotion and community based services;<br />
• Developing health equity tools to assess the potential of initiatives to contribute to the reduction of<br />
inequalities (e.g., <strong>He</strong>alth Equity Assessment Tool (HEAT), Whānau Ora <strong>He</strong>alth Impact Assessment); and<br />
• Monitoring of Māori – non-Māori health disparities (MOH 2006)<br />
18 | <strong>He</strong> <strong>Ritenga</strong> <strong>Whakaaro</strong>: Māori experiences of health services
Tātaritanga ā Rangahau Hāngai - Literature Review 2<br />
2.3.2 <strong>He</strong>alth Organisation<br />
Several organisational factors have been noted by researchers as barriers to Māori access to care, including primary<br />
care (Barwick 2000), diabetes care (Baxter 2002) and cancer care (Cormack et al 2005). These barriers include:<br />
• The universal focus of the health system in which one service for all often means that services are not<br />
culturally appropriate for Māori patients (Ratima et al 1993; Barwick 2000; Baxter 2002).<br />
• Workforce composition; that is, few Māori personnel (Barwick 2000; Baxter 2000; <strong>He</strong>alth Waikato 2001;<br />
Cormack et al 2005).<br />
• The timing and availability of services (Crengle 2000) including service configuration and location (Cormack<br />
et al 2005) and patients’ lack of awareness of available services (Bryant & Campbell 1996).<br />
• Funding and resources, including the physical environment (<strong>He</strong>alth Waikato 2001; Cormack et al 2005).<br />
• Appointment systems currently utilised (hospital-based systems were viewed as overly rigid) (Bryant &<br />
Campbell 1996).<br />
• A lack of relevant educational and promotional material, and appropriate (e.g., Māori-specific) information<br />
(Bryant & Campbell 1996; Crengle 2000; <strong>He</strong>alth Waikato 2001).<br />
• Failure by providers to identify and treat those in greatest need (Crengle 2000).<br />
• Unclear continuity of care, including follow-up and maintenance of treatment (Crengle 2000; <strong>He</strong>alth Waikato<br />
2001).<br />
• Lack of use of the Māori language (<strong>He</strong>alth Waikato 2001).<br />
The provision of culturally appropriate services, including customised and targeted services, has been noted by<br />
several researchers as a key facilitator of Māori access to health care (Ratima et al 1993; Barwick 2000; Baxter 2002).<br />
Often this is closely associated with services having more Māori staff, and Māori-friendly non-Māori staff (Bryant<br />
& Campbell 1996; Barwick 2000; <strong>He</strong>alth Waikato 2001). Māori women, for example, have often reported that they<br />
would prefer to go to services run by Māori women to have cervical smears (Lynch & Kanuku 1990).<br />
Having a healthcare provider that is both understanding of and understandable to the patient has consistently been<br />
shown to predict patient satisfaction, the acceptability of treatment, and treatment success (Cross et al 1989; Isaacs<br />
& Benjamin 1991). When there is concordance between the cultural beliefs and understanding of the provider and<br />
the patient, access is improved and adherence to treatment is enhanced (Cross et al 1989; Isaacs & Benjamin 1991;<br />
Penn et al 1995). These findings also apply to Māori (Jansen 1998; Cram et al 2003). Generally speaking, however,<br />
there is a lack of cultural concordance between Māori patients and predominantly non-Māori health providers in<br />
Aotearoa <strong>New</strong> <strong>Zealand</strong>.<br />
Evaluation of the 2005/6 ACC pilot programmes found that communications with disadvantaged communities<br />
need to be targeted appropriately and delivered in appropriate ways by relevant groups (rather than government<br />
agencies) (ACC 2007).<br />
2.3.3 Human Resource<br />
Human resource barriers to Māori access to health care include:<br />
• Characteristics of non-Māori staff, including their perceptions, attitudes, biases, and beliefs (Cormack et<br />
al 2005; <strong>He</strong>alth Waikato 2001) For example, staff’s perceived (by Māori patients) lack of understanding<br />
of the social and cultural context of diabetes for Māori (<strong>He</strong>alth Waikato 2001). In addition, McCreanor<br />
and Nairn (2002) found that non-Māori GPs ‘blame Māori for their own condition or variously justify<br />
established approaches that doctors take’. These GPs were of the opinion that, for example, Māori do not<br />
take medication, do not attend follow-up appointments, and do not embrace preventative health practices.<br />
Perhaps a worse kind of blame emerged from a survey of <strong>New</strong> <strong>Zealand</strong> psychiatrists (Johnstone & Read<br />
2000) which found that 11.3 percent (N=28) of respondents held the inaccurate belief that Māori were<br />
biologically or genetically more predisposed than others to mental illness.<br />
<strong>He</strong> <strong>Ritenga</strong> <strong>Whakaaro</strong>: Māori experiences of health services | 19
2 Tātaritanga ā Rangahau Hāngai - Literature Review<br />
• Provider-patient communication (<strong>He</strong>alth Waikato 2001; Cormack et al 2005). In the NatMedCa study, for<br />
example, doctors themselves reported a lower level of rapport with Māori compared to non-Māori (Crengle<br />
et al 2005). Cram et al (2003) reported on Māori patients’ views on the importance of rapport.<br />
• There have not been studies conducted in this country of differences in the actual interactions Māori and<br />
non-Māori patients have with health providers. However local findings from interviews with clinicians<br />
(Buetow et al 2002; McCreanor & Nairn 2002) match those of Van Ryn and Fu (2003) who, in a study based<br />
on actual clinical encounters, found that, compared to white patients, doctors rated black patients as:<br />
• less intelligent;<br />
• less educated;<br />
• more likely to abuse drugs and alcohol;<br />
• more likely to fail to comply with medical advice;<br />
• more likely to lack social support; and<br />
• less likely to participate in cardiac rehabilitation.<br />
These findings persisted even after patients’ income, education, and personality characteristics were taken into<br />
account, suggesting that provider perceptions and attitudes toward patients are influenced by patient race or<br />
ethnicity. This is also supported by other international research findings (Maheux & Beland 1987; Crandall et al<br />
1993; Crandall et al 1997; Rathore et al 2000; Wilson et al 2004). Van Ryn and Fu’s (2003) findings may be further<br />
complicated by those of Bach et al (2004) that different groups of patients are ‘to a large extent treated by different<br />
physicians’, and that those clinicians who treat predominantly non-white patients are often less well trained clinically<br />
and have less access to clinical resources.<br />
A report for the <strong>He</strong>nry J. Kaiser Family Foundation and the American College of Cardiology Foundation, entitled<br />
Racial/Ethnic Differences in Cardiac Care: The Weight of the Evidence (Lillie-Blanton et al 2002), reported<br />
on a review of 81 studies of cardiac care where racial or ethnic groups were compared. Of these, 68 studies<br />
found racial/ethnic differences in cardiac care for at least one of the minority groups under study. In a summary<br />
of the main findings it was reported that the majority of the peer-reviewed studies investigating racial/ethnic<br />
differences in cardiac care are methodologically rigorous and conclusively find that racial/ethnic minority groups<br />
are less likely than whites to receive the procedure or treatment under study. Furthermore the studies rated to be<br />
methodologically stronger ‘provide credible evidence that African-Americans are less likely than whites to receive<br />
diagnostic procedures, revascularisation procedures and thrombolytic therapy’ and document that ‘racial/ethnic<br />
differences in care remain after adjustment for clinical and socioeconomic factors.’ Studies reviewed by the Institute<br />
of Medicine (IOM) (Smedley et al 2002), including the van Ryn and Fu study (2003), found that:<br />
• patients’ attitudes, such as their preferences for treatment, do not vary greatly by race or ethnicity;<br />
• there is considerable evidence of unconscious implicit negative attitudes and stereotypes towards ethnic<br />
minorities amongst providers;<br />
• these implicit assumptions can result in self-fulfilling prophecies in social interactions, such as consultations<br />
with patients; and<br />
• the time pressures and uncertainties that providers face when assessing patients or making treatment<br />
decisions can cause providers to incorporate implicit assumptions into their recommendations.<br />
20 | <strong>He</strong> <strong>Ritenga</strong> <strong>Whakaaro</strong>: Māori experiences of health services
Tātaritanga ā Rangahau Hāngai - Literature Review 2<br />
While it is likely that patients also have similar unconscious implicit attitudes and stereotypes about providers the<br />
IOM noted that little research has been conducted to date on how patients influence the clinical encounter. The<br />
report suggested that minority patients may appropriately perceive bias and therefore avoid care, or convey their<br />
mistrust in subtle ways to providers who may (mis)interpret that attitude and provide less intensive treatment or<br />
investigations. The authors’ concluded that:<br />
‘Patients’ and providers’ behaviour and attitudes may therefore influence each other reciprocally,<br />
but reflect the attitudes, expectations, and perceptions that each has developed in a context<br />
where race and ethnicity are often more salient than these participants are even aware of’.<br />
Schouten et al (2007) note the lack of research on the communication process between doctors and patients of<br />
different cultural backgrounds. Their own study examined how patients’ active involvement (e.g., asking questions)<br />
in an interaction influenced white Dutch doctors’ communication behaviour, as well as the effect this had on patient<br />
satisfaction and mutual understanding. The researchers found that patients differed in their participation, with less<br />
participation by non-Western patients compared to Dutch patients. However the strongest finding was that GPs’<br />
affective verbal behaviour was positively related to both patient participation and patient satisfaction, leading the<br />
authors to endorse communication training for GPs.<br />
2.3.4 Individual or Community<br />
Three individual or community barriers to Māori accessing health care are discussed by researchers: socioeconomic<br />
position, attitudes, and health status. Each of these is explored below.<br />
Socioeconomic position<br />
The cost of health services, including physically getting to the service (e.g., location, transport, and having to take<br />
time off work), is a concern for many Māori (Ratima et al 1993; Bryant & Campbell 1996; Crengle 2000; Cram et al<br />
2001; Zgibor & Simmons 2002; Clemenger BBDO 2004). Financial barriers are more likely to impact on Māori due<br />
to the lower socioeconomic of many Māori compared with non-Māori.<br />
Rameka (2006:50) writes that ‘a lot of rural whānau do not go to the hospital or do not access secondary care<br />
because of the hidden costs associated with being in hospital’. These costs include transport, accommodation, food,<br />
and hospital car park rates. Even if whānau can be reimbursed for these costs, they must still be able to meet them<br />
in the first instance.<br />
In the 2002/03 <strong>New</strong> <strong>Zealand</strong> <strong>He</strong>alth Survey (MOH 2004b) 12 percent of adults said that they had needed to see a<br />
GP in the last 12 months but had not, with reasons including:<br />
• Costs too much (49% of the 12%).<br />
• Didn’t want to make a fuss, or couldn’t be bothered (26%).<br />
• Difficulty getting an appointment (22%).<br />
• Couldn’t spare the time (18.8%).<br />
The burden of such unmet need falls more on the Māori population (Figure 3).<br />
A recent study for the Commonwealth Fund which assessed adult patients’ primary care experiences in Australia,<br />
Canada, <strong>New</strong> <strong>Zealand</strong>, the United Kingdom and the United States confirmed that access to care is related to costs,<br />
with those countries having the highest cost barriers to primary care also reporting the highest rates of patients not<br />
being able to obtain timely medical treatment, prescriptions or preventative care (Schoen et al 2004).<br />
<strong>He</strong> <strong>Ritenga</strong> <strong>Whakaaro</strong>: Māori experiences of health services | 21
2 Tātaritanga ā Rangahau Hāngai - Literature Review<br />
Figure 3. Unmet need for general practitioner in last 12 months, by ethnic group and sex (age-standardised)<br />
<br />
<br />
<br />
<br />
<br />
<br />
<br />
<br />
<br />
<br />
<br />
<br />
<br />
<br />
<br />
<br />
Source: Ministry of <strong>He</strong>alth (2004)<br />
<strong>He</strong>alth insurance can improve access by allowing users to bypass the gatekeeper assessments by primary care<br />
providers and/or hospital specialists. However Māori at all levels of socioeconomic status are less likely to have<br />
health insurance (TPK 2000). These findings are in keeping with studies in other countries such as the United<br />
Kingdom and the United States where minority or deprived groups have lower levels of insurance coverage and<br />
lesser access to care (Miller 1996; Schoen et al 2002).<br />
In <strong>New</strong> <strong>Zealand</strong>, ACC data demonstrate that Māori still receive reduced access to services even in those programmes<br />
for which there are no direct costs, such as home help or other social assistance packages (TPK 2000). This suggests that<br />
other access barriers are more important than the direct cost for these services. For example, people may not be willing<br />
to attend a culturally inappropriate service even if it is available and affordable (Durie 2001).<br />
Patient attitudes, beliefs and preferences<br />
Patient knowledge, attitudes, beliefs, values, and preferences are also associated with access to care (Baxter 2002;<br />
Buetow et al 2002; Mauri Ora Associates 2002; Zgibor & Simmons 2002; Cram & Smith 2003; Cormack et al 2005).<br />
Attitudes to health care are often informed by people’s past experiences and/or the experiences of their whānau and<br />
others close to them (Cram et al 2003). Previous negative experiences with the healthcare system and/or perceptions<br />
of bias, such as Pākehā health services not being seen as acceptable or clients hearing negative comments from<br />
others, can prevent people from accessing health care (Bryant & Campbell 1996; <strong>He</strong>alth Waikato 2001).<br />
Māori taking part in ACC focus groups (Clemenger BBDO 2004) also talking about the indirect costs of accessing care.<br />
This was described as ‘hoha’ and included hassles or barriers such as having to ‘stop and arrange my day’ (i.e., arranging<br />
time off work, organising transport, changing clothes, etc.). There was also a perception within the ACC focus groups<br />
that there would be lots of forms and information to try and understand, collate, organise, and explain; all of which was<br />
perceived as an inconvenience that led many of them to choose not to engage with the health system.<br />
Reluctance to access care may also stem from a belief, and its associated fear, that hospitals are places people go<br />
to die (<strong>He</strong>alth Waikato 2001). Other sources of fear identified by health professionals talking about GP care for<br />
22 | <strong>He</strong> <strong>Ritenga</strong> <strong>Whakaaro</strong>: Māori experiences of health services
Tātaritanga ā Rangahau Hāngai - Literature Review 2<br />
asthma for Māori and Pacific peoples include fear of: embarrassment, wasting GP time, causing offence, receiving<br />
offence, loss of privacy (Buetow et al 2002). Māori diabetics also identified fears, including fear about: the disease,<br />
its consequences, the care environments, and the changes to lifestyle that are required (<strong>He</strong>alth Waikato 2001).<br />
Members of ACC focus groups felt that Māori would be concerned that if they used ACC services they would most<br />
likely be 'pulled' up or 'told off' for lifestyle choices (e.g., smoking). They were also worried by what else the doctor<br />
may discover about their health, stating that they would prefer not to know (Clemenger BBDO 2004).<br />
Attitudes to health care may also be important, such as not making personal health care a priority due to other roles<br />
and commitments within their community (Brant & Campbell 1996; MOH 2005b), and the perception that health<br />
care is irrelevant or that it is too late in life to worry (Bryant & Campbell 1996). A lack of support or encouragement<br />
from whānau members may also mean that a person does not access health care (Bryant & Campbell 1996). The<br />
isolation (social/physical) of some kuia may also be a barrier to health care (Bryant & Campbell 1996).<br />
Whakamā, which is often translated as shyness or embarrassment, is also seen as barrier to health care (Bryant<br />
& Campbell 1996; Cram & Smith 2003). There is little discussion in the health literature about the cultural<br />
appropriateness of whakamā, particularly when Māori patients engage with health professionals who have little<br />
understanding of them and/or their circumstances (Cram et al 2003). Māori focus group members involved in<br />
an ACC study in 2004 reported that Māori are apprehensive about being ‘put on the spot’ and being unable to<br />
articulate their concerns or to understand the doctor’s questions, thus looking unintelligent or foolish (Clemenger<br />
BBDO 2004).<br />
<strong>He</strong>alth status<br />
<strong>He</strong>alth status has also been reported as a barrier to access (Bryant & Campbell 1996). Many Māori are reluctant<br />
to access care services unless they feel ill with this probably intertwined with the above two barriers of cost and<br />
attitudes (<strong>He</strong>alth Waikato 2001; ACC 2007). In the 2004 ACC study Māori also stated a reluctance to seek help for<br />
any injury unless it was thought to be severe enough (Clemenger BBDO 2004).<br />
<strong>He</strong> <strong>Ritenga</strong> <strong>Whakaaro</strong>: Māori experiences of health services | 23
2 Tātaritanga ā Rangahau Hāngai - Literature Review<br />
2.3.5 Overcoming Barriers<br />
During 2005 and 2006 ACC undertook pilot programmes focussing on Māori, Pacific, Asian people and those<br />
with low incomes (ACC 2007). One group of pilot programmes addressed financial barriers to general practice<br />
and radiology services, while the second group addressed non-financial barriers such as: a lack of information<br />
about available services, transport, or attitudes and perceptions of injured people. The evaluation report noted<br />
that transport did not appear to be a strong barrier (ACC 2007). The projects aimed at reducing financial barriers<br />
provided additional subsidies to all patients of selected providers; that is, the additional funding was not targeted to<br />
those with least access. These pilot studies did see a small increase in access for disadvantaged people but the most<br />
advantaged groups improved their access at an even greater rate, thus worsening the disparity. No evidence was<br />
found for faster rehabilitation.<br />
Many of the 35 General Practice projects that were allocated funds from the 2002 Reducing Inequalities<br />
Contingency Fund (MOH 2005b) identified the direct cost of health services and transport as major barriers to<br />
health care and set out to address these. However the evaluators reported that for many clients, factors other than<br />
financial or transport barriers must explain reduced utilisation of services as clients may live close to services and<br />
face zero or very low fees, but still underutilise appropriate services. With regard to Māori clients the evaluators<br />
reported that access to services might be lessened because:<br />
• Other priorities take precedence over individual health needs;<br />
• Staff at primary care services can appear to be ‘unwelcoming’, causing some Māori to avoid the service;<br />
• Even low cost access fees may be unaffordable for some.<br />
The evaluation reported mixed results in terms of improving access, reducing the burden of illness, impacts on<br />
utilisation of services and continuity of care. Overall the evaluators noted that establishing services with hard-toreach<br />
populations takes time and resources, as well as knowledge of the target community.<br />
The <strong>He</strong>alth Waikato Regional Diabetes (WRD) Service report (<strong>He</strong>alth Waikato 2001) identified that, in order to<br />
improve the health of Māori, it was important to consider cultural factors when developing health promotion<br />
strategies, such as:<br />
• Māori world view and reality;<br />
• Links between socio-economic determinants, health and the setting of priorities within the whānau;<br />
• Impact that whānau can have in influencing individual attitudes and behaviours;<br />
• Importance of Māori language and customs to Māori and their healthcare;<br />
• Māori centred routines, habits and behaviours (e.g., food related issues such as eating times and types of<br />
food and attending marae and hui);<br />
• Need for more Māori-oriented services (including increases in Māori staff numbers, Māori specific resources,<br />
diabetes education hui and mobile marae and community based services);<br />
• Targeting health promotion and treatment services for Māori groups in the community;<br />
• Improving the existing service by providing education in the community focused on people with diabetes<br />
and their entire whānau in marae-based forums; and<br />
• Educating communities with people of all ages, starting in Kōhanga Reo.<br />
An example of such an intervention is seen in the findings of Lieu et al (2004) in a study of 1663 children with<br />
asthma from low income families in California who were followed over one year. In this study providers with high<br />
cultural competence scores were associated with less under-use of preventive asthma medications 6 and higher<br />
parent ratings of care. Similarly policies for access and continuity of care were associated with less under-use of<br />
preventive medications, 7 while feedback of outcomes of care to clinicians predicted less preventive medication<br />
6 Odds Ratio: 0.15; 95% Confidence Interval: 0.06–0.41 for the highest versus lowest categories<br />
7 OR: 0.56; 95% CI: 0.34–0.93.<br />
24 | <strong>He</strong> <strong>Ritenga</strong> <strong>Whakaaro</strong>: Māori experiences of health services
Tātaritanga ā Rangahau Hāngai - Literature Review 2<br />
under-prescribing, 8 better parent ratings of care, and better asthma physical status at follow-up. This study Lieu<br />
et al (2004), and reviews by other authors (such as Beach et al 2004), demonstrates that targeted programmes are<br />
required to address minority health issues, incorporating:<br />
• Policies that support cultural competence combined with best clinical practice;<br />
• Training health workers in communications skills including cultural competencies;<br />
• The use of reminder systems; and<br />
• Performance measures with feedback reports to staff.<br />
The Robert Wood Johnson Foundation in the United States has conducted systematic reviews of interventions<br />
to address racial and ethnic health care disparities for cardiovascular disease (Davis et al 2007), diabetes (Peek<br />
et al 2007), depression (Van Voorhees et al 2007), and breast cancer (Masi et al 2007). Two additional papers<br />
examined interventions using cultural leverage (Fisher et al 2007), and pay-for-performance and public reporting of<br />
performance measures (Chien et al 2007). The review of disparities in depressive order outcomes (Van Voorhees<br />
et al 2007) found that case management and socioculturally tailored interventions can play an important role in<br />
reducing disparities. Case management was also important in patient access to treatment following abnormalities<br />
being found during breast screening (Masi et al 2007). For screening itself, programmes that were culturally-tailored<br />
and/or addressed financial barriers were most effective.<br />
In the area of cardiovascular disease Davis et al (2007) found value in: patient registries, multidisciplinary teams,<br />
and community outreach by nurses. Patient interventions, such as sodium restriction for African American patients,<br />
also yielded benefits. These authors concluded from their review ‘that interventions in primary care should consider<br />
organisation-level interventions, such as clinic reorganisation, rather than provider-level interventions that attempt<br />
to change physicians prescribing behaviours’ (p.82). They also recommended the involvement of nurses in<br />
outreach and management strategies that aim to address inequalities. A follow-up programme funded by the Robert<br />
Wood Johnson Foundation, entitled ‘Expecting Success: Excellence in Cardiac Care’, has also demonstrated the<br />
importance of hospitals collecting and analysing patient race, ethnicity and language data on patients (The George<br />
Washington University Medical Center 2007).<br />
The review of interventions to address ethnic and racial disparities in diabetes (Peek et al 2007) identified the<br />
importance of: programmes tailored to the culture of the patients; one-on-one patient education and feedback; and<br />
the involvement of nurses as case managers and clinicians. The authors highlight questions that remain unanswered<br />
from their review, including what the ideal target for intervention is (e.g., patient, provider, organisation). They also<br />
conclude that the ‘patients most at risk for poor outcomes are those on the fringe of health care systems’ (p.144).<br />
That is, those without a regular healthcare provider who rely on emergency care for routine health care.<br />
The key findings from the reviews are summarised by Chin et al (2007). The promising intervention strategies they<br />
identify are:<br />
1. Multifactorial interventions that address multiple levels of change. Such interventions will operate across the<br />
levels of health care, and throughout the continuum of care.<br />
2. Culturally tailored quality improvement. Individualised care, and thereby improved outcomes, may be<br />
improved by culturally tailored approaches with Chin et al (2007:23) arguing that ‘ultimately the specific<br />
barriers facing particular individuals, communities, and health care organisations need to be addressed’.<br />
3. Nurse-led interventions. Many of the qualities of nurses (e.g., ability to work in teams, providing patientcentred<br />
care, knowledge of culturally tailored approaches) mean that they are well-suited to providing health<br />
care identified as most effective for reducing ethnic and racial inequalities.<br />
Overall, the reviews and Chin et al (2007) point to the need for more planned interventions that are then evaluated.<br />
8 OR: 0.33; 95% CI: 0.16–0.69<br />
<strong>He</strong> <strong>Ritenga</strong> <strong>Whakaaro</strong>: Māori experiences of health services | 25
2 Tātaritanga ā Rangahau Hāngai - Literature Review<br />
2.3.6 Summary<br />
Barriers to, and facilitators of, access to health care for Māori have been identified at four levels of the health<br />
system: system, organisation, human resource, and individual or community. While direct and indirect financial<br />
costs are often seen as key barriers to health care for Māori, research and evaluation has found that if services<br />
are not culturally appropriate then, even if they are free, they may not be fully utilised by Māori. Cultural<br />
appropriateness, in turn, rests on the tailoring of services to be more in tune with Māori through the provision of<br />
Māori staff and Māori-friendly, non-Māori staff. Often non-Māori staff bring attitudes and perceptions to health care<br />
delivery that reflect little understanding of Māori realities and cultural values. Turning this around will require both<br />
education and commitment to Māori health gains, as well as guidance through leadership and policy at a national<br />
level. This is explored under ‘Interpersonal Relationship Skills’ (2.4.2 pg 28).<br />
The responsiveness of the health system to the current crisis in Māori health can be monitored in many ways; for<br />
example, the analysis of Māori:non-Māori disparities in terms of mortality and morbidity. Patient feedback on their<br />
experiences with health services, as well as their overall rating of each encounter, is another monitoring tool, albeit<br />
one that is not sensitive to accounting for those who do not get as far as engaging because the barriers to doing<br />
so are too great. Even so, patient feedback can provide valuable input into how a health organisation and health<br />
personnel can facilitate Māori access to health care. The next section examines the role of consumer assessments of<br />
health services.<br />
2.4 Consumer Assessment of Services<br />
Research has repeatedly shown that measures of patient satisfaction are correlated with health outcomes (see<br />
Stewart 1995,for example), and consumer evaluation of health services is increasingly seen as an important part<br />
of quality assurance and quality improvement activities (Fitzpatrick 1991; Steele 1992; <strong>New</strong>some & Wright 1999).<br />
This includes early identification of consumer concerns or service failures, and feedback to staff which can support<br />
professionalism and performance rewards. In addition, many studies that have examined patient preferences,<br />
satisfaction or priorities report that patients want healthcare providers to have both technical competence and high<br />
levels of interpersonal relationship skills (Bartlett et al 1984; Carroll et al 1998; Wensing 1998; Elwyn et al 1999;<br />
Mechanic & Meyer 2000). Of these two components, interpersonal relationship skills are easier by far for patients<br />
to assess and are the larger contributor to overall satisfaction (ProCare <strong>He</strong>alth Ltd 1995). In this respect healthcare is<br />
similar to many other professional services.<br />
Consumer assessments of healthcare services, along with their assessments of car repair services, legal services,<br />
and other services where technical competency is difficult for consumers to assess, were examined in a University<br />
of Auckland study (Colgate et al 2003). The researchers found that the reasons why most consumers remained<br />
satisfied with, and loyal to, their service providers fell into two broad categories: their relationship with the service<br />
provider and their not having a reason to leave. Furthermore the study noted that in spite of unease about the<br />
quality of services or the value of the service offered, consumers would often remain with an existing provider until<br />
a critical incident precipitated change.<br />
Nicholls and Jaye (2002) also noted similar issues of a critical incident being required to change provider in a<br />
study of reasons why <strong>New</strong> <strong>Zealand</strong> patients change GPs. In large part the reasons for change were related to what<br />
patients perceived to be GPs’ negative comments or unacceptable attitudes. Patients remained loyal even when<br />
diagnostic errors were made so long as the patient-physician rapport was good, but they would contemplate<br />
change if that rapport were damaged. The author noted that ‘effective communication is the basis of good general<br />
practice and lack of this seems to be one common cause of dissatisfaction. Another is the patronising attitudes and<br />
behaviours of the doctor’.<br />
Consumers of healthcare can and do make assessments of the care they receive and they focus these assessments<br />
primarily on their satisfaction with interpersonal relationship aspects until/unless a major negative incident occurs.<br />
With this in mind, the present section examines the two components of assessments of services; namely, technical<br />
competence and interpersonal relationship skills. Satisfaction as a key indicator of the performance of a health<br />
service is then critiqued. Following this an overview of the present study completes this chapter.<br />
26 | <strong>He</strong> <strong>Ritenga</strong> <strong>Whakaaro</strong>: Māori experiences of health services
Tātaritanga ā Rangahau Hāngai - Literature Review 2<br />
2.4.1 Technical Competence<br />
Evaluating patients’ perceptions of their health care is complicated by the fact that most patients have difficulty<br />
assessing the technical aspects of health services. Rather it is (only) health professionals who are able to judge the<br />
clinical quality of the service provided. This discrepancy between the ability of the patient and provider to assess<br />
technical competence is encapsulated in the notion of ‘credence goods’. Dulleck and Kerschbamer (2006) define a<br />
credence good as,<br />
‘…goods and services where an expert knows more about the quality a consumer needs than the<br />
consumer himself [such as automotive repairs or computer services]. The consumer can ex post<br />
only observe (but might [still] be unable to verify) whether the problem still exists’. (p 5)<br />
If the problem no longer exists the consumer can not necessarily tell whether they got the appropriate level of<br />
service or one that was unnecessarily high (and therefore inappropriately expensive). Furthermore they may not<br />
even be able to tell whether a suggested treatment was provided or if they received the prescribed (and billed) level<br />
of service.<br />
Dulleck and Kerschbamer (2006) cite several studies that demonstrate that, in keeping with the notion of a<br />
credence good, healthcare services are not provided in a uniform fashion, including reports that: an average<br />
person’s probability of receiving a major surgical intervention is one third greater than that of a physician or member<br />
of a physician’s family; optometrists often prescribe unnecessary treatment; the frequencies of caesarean deliveries<br />
compared to normal childbirths vary with the fee differentials of health insurance companies; and the frequency of<br />
cervical cytology treatments is correlated with the fee for the treatment. As the authors write (p. 32),<br />
‘Medical treatments offer the most complicated and maybe the most important environment [for<br />
credence goods]… Patients usually are either physically not able to observe treatment – as during<br />
an operation – or simply lack the education to verify the treatment delivered by [a clinician]’.<br />
Confirmation that patients cannot judge technical aspects of care was found by Rao et al (2006) who compared<br />
older patients’ assessments of care with a review of practice records. They found that patients’ assessments were<br />
not an adequate reflection of the technical quality of their primary care, concluding that both patient-based and<br />
records-based measures of quality are required.<br />
Given that the technical aspects of healthcare are only imperfectly understood and evaluated by most patients,<br />
how can consumers assess quality? Despite unfamiliarity with many aspects of the credence good or service the<br />
consumer can still come to a judgment, even for those services that are complex or that have unclear outcomes<br />
(<strong>New</strong>some & Wright 1999; Leiper et al 2006) However, the criteria by which that judgment will be made are likely to<br />
be different from those that would be used by an expert in the field.<br />
‘Service users who cannot judge the technical quality of the outcome effectively will base their<br />
quality judgments on structure and process dimensions such as physical settings, the ability to solve<br />
problems, to empathise, time keeping, courtesy, and so on’. (<strong>New</strong>some & Wright 1999 p. 164)<br />
For example, in their research on consumer views and experiences of primary health care in <strong>New</strong> <strong>Zealand</strong>, Kerse<br />
and colleagues (2004) found that that, alongside good communication skills and the importance of the doctorpatient<br />
relationship, many participants also prioritised doctors’ professional expertise. This incorporated medical<br />
knowledge (e.g., including their diagnostic skills and up-to-date professional knowledge) as well as communication<br />
and relationship skills, with participants possibly resting their judgements of doctors’ professional expertise on<br />
criteria such as problem-solving and empathy.<br />
A number of <strong>New</strong> <strong>Zealand</strong> (ProCare <strong>He</strong>alth Ltd. 1995; Nicholls & Jaye 2002) and international (Edgman-Levitan<br />
& Cleary 1996; Booske et al 1999; Feldman et al 2000; Fowles et al 2000; Beaulieu 2002) studies have looked at<br />
consumer preferences for clinicians; that is, how consumers select health providers or what kind of information<br />
consumers want to receive about a provider. Consumer preferences for information about selecting a provider are<br />
influenced by what information they are given and how it is presented. Information on the technical performance of<br />
<strong>He</strong> <strong>Ritenga</strong> <strong>Whakaaro</strong>: Māori experiences of health services | 27
2 Tātaritanga ā Rangahau Hāngai - Literature Review<br />
providers (e.g., from professional societies or government authorities) is often presented in ways that are not easy<br />
for consumers to understand as much of the information comes from a clinical or management perspective rather<br />
than from a consumer perspective. As a result, patients may prefer to rely on their own perceptions of care or on the<br />
experience and recommendations of friends and relatives.<br />
In addition a Commonwealth Fund–supported study (Pillittere et al 2003) found that consumers understand and<br />
value information related to domains of quality such as effectiveness, patient-centeredness, and safety, if they are<br />
given a carefully constructed frame of reference. In this regard the researchers noted that the choice of words was<br />
critical to ensuring that consumers and providers had a common understanding of the concepts being described.<br />
For example, some patients have thought that the term ‘patient-centred’ meant ‘a place where patients go for care’<br />
rather than ‘having a focus on the needs of patients’.<br />
The researchers also found differences within ethnic groups based on socioeconomic status and age. Older patients<br />
were more concerned with doctor-patient relationships compared with younger patients, while the lower socioeconomic<br />
groups appeared to have different understandings of some concepts of health service quality. These findings<br />
(different concerns based on socio-economic status and a greater desire for a trusting relationship by older patients)<br />
have also been found in Māori focus group meetings convened by the ACC (Clemenger BBDO 2004).<br />
In summary, technical competence is difficult for patients to assess accurately and, as such, their judgements about<br />
technical competence may rely upon assessments of other aspects of their care, such as physical setting, timekeeping<br />
and the opinions of friends and family. When care is taken to construct a frame of reference for patients’<br />
assessment of technical competence then differences are found based on age and socio-economic status.<br />
2.4.2 Interpersonal Relationship Skills<br />
Both <strong>New</strong> <strong>Zealand</strong> and overseas studies document the importance of patient-clinician rapport (and particularly<br />
the communication or interpersonal skills of the provider) for effective healthcare. For example, the 1995 ProCare<br />
survey of patient preferences for general practices in Auckland found that the majority of patient satisfaction was<br />
comprised of elements related to provider communications (ProCare <strong>He</strong>alth Ltd 1995). The reports by Nicholls<br />
and Jaye (2002) and by Kerse and colleagues (2004) described above note that <strong>New</strong> <strong>Zealand</strong> patients place great<br />
importance on the communication and relationship skills of their GPs. Patients only leave a provider when these<br />
behaviours or attitudes are unacceptable.<br />
In a qualitative study of the knowledge, attitudes, and healthcare experiences of deaf women (Steinberg et al 2002),<br />
the authors noted that deaf women have unique cultural and linguistic issues that affect healthcare experiences.<br />
Participants reported negative experiences and avoidance or non-use of health services when there was a lack of a<br />
common language with healthcare providers or insensitive behaviours towards the deaf. Smiler (2006) uncovered<br />
similar issues when researching the experiences of deaf Māori in <strong>New</strong> <strong>Zealand</strong>.<br />
Satisfaction with care, then, is dependent on developing a trusting relationship with a provider that is in tune with<br />
the expectations, preferences and priorities of the patient. Krupat et al (2001) found that patients whose beliefs<br />
were congruent with the beliefs of their physician were more likely to trust and endorse their physician. In a<br />
Swedish study of ratings by psychiatric patients the authors reported that patients put the highest emphasis on staff<br />
empathic qualities such as being interested and understanding, respecting patients, while the least importance was<br />
ascribed to characteristics of the physical environment (Hansson et al 1993).<br />
These findings are consistent across countries and ethnic groups. In a review of MEDLINE articles over the period<br />
1983 to 1993, Stewart (1995) found that numerous studies reported a correlation between effective doctor-patient<br />
communications and improvements in health outcomes. The positive outcomes were in the areas of emotional<br />
health, symptom resolution, improved blood pressure or blood sugar control and control of pain. Similarly<br />
poor experiences of care, low satisfaction ratings and reduced trust have been shown to impact adversely on<br />
adherence to care and complaints. This need for effective communication requires doctors to be ‘bilingual’, able to<br />
communicate not only with their peers in the language of science but also in lay terms with their patients (Persaud<br />
2005). Unfortunately doctors often communicate poorly with their patients – but do not realise they are doing so<br />
(Ford et al 1996).<br />
28 | <strong>He</strong> <strong>Ritenga</strong> <strong>Whakaaro</strong>: Māori experiences of health services
Tātaritanga ā Rangahau Hāngai - Literature Review 2<br />
Little et al (2001) also reported that a positive, patient-centred approach results in greater patient satisfaction,<br />
greater enablement, a lesser burden of symptoms, and lower rates of referral. Most of the ‘patient-centred’<br />
approach relied upon good communications skills and relationship development.<br />
Crow et al (2002) in a major review of literature for an NHS <strong>He</strong>alth Technology Assessment of measurement of<br />
satisfaction, reported on studies that investigated the patient-clinician relationship and the importance of that<br />
bond to patient ratings of satisfaction.. The eight studies reviewed by Crow confirm that patient satisfaction is<br />
more closely related to provider communication skills (and attitudes) than to issues of service access or availability.<br />
Crow also reported on 43 studies that examined the features of patient-clinician relationships, noting that the key<br />
elements that predict satisfaction are:<br />
1. Affective behaviours, such as those demonstrating:<br />
• worth and respect (Kenny 1995)<br />
• friendliness (Korsch et al 1968; Stewart 1989; Bertakis et al 1991; Greene et al 1994; Gross et al 1998; Hall<br />
et al 1998)<br />
• trust (Ben-Sira 1990; De La Cuesta 1997)<br />
• courtesy and empathy (Comstock et al 1982)<br />
• supportiveness (Greene et al 1994)<br />
• sensitivity (Holloway et al 1989)<br />
• understanding (Treadway 1983)<br />
2. Clear explanations and information sharing (Korsch et al 1968; Stiles et al 1979; Kent Smith et al 1981;<br />
Comstock et al 1982; Brody et al 1989; Stewart 1989; Robbins et al 1993; Kenny 1995; De La Cuesta 1997;<br />
Kvamme & Hjortdahl 1997; Gross et al 1998; Hall et al 1998; Krupat et al 2000; Jackson et al 2001)<br />
By contrast Crow et al noted that patient satisfaction decreased in studies that reported:<br />
• overly technical discussions, (Kent Smith et al 1981; Wartman et al 1983; Bartlett et al 1984; Robbins et al<br />
1993)or<br />
• clinician-dominated discussions (Bertakis et al 1991; Buller & Buller 1987).<br />
Furthermore Crow et al (2002) reported that the consistent finding from all parts of the health sector was that, ‘<br />
… the most important factor affecting satisfaction is the patient-practitioner relationship, including information<br />
giving’. The importance of this relationship has been suggested to underlie the public’s interest in alternative and<br />
complementary therapies.<br />
‘Patients find these practitioners speak a language that is more easily understood than what they<br />
perceive as the unintelligible gobbledygook of the scientifically trained doctor… Alternative<br />
health practitioners are often better at communication because they use a more patient friendly<br />
and simplistic model; doctors’ scientific training often leaves them wrestling with how to<br />
communicate the complexity of clinical uncertainties’. (Persaud 2005)<br />
Steinberg (2002) refined this further, concluding that good communication between the patient and clinician (as<br />
perceived by the patient) is perhaps the most important predictor of patient experiences, satisfaction, and trust, as<br />
well as being associated with improved clinical outcomes. The establishment of rapport is not only key to making<br />
the correct diagnosis, but it is also how patients (and their families) are convinced of the value of the recommended<br />
treatment plan (Cram et al 2003; Persaud 2005).<br />
As mentioned above, doctors often lack good communication skills (Beckman & Frankel 1984; Buetow et al 1996;<br />
Falvo & Tippy 1998; Marvel et al 1999; Lamont & Christakis 2001), in spite of self-belief to the contrary (Ford et al<br />
1996). International research clearly shows that these difficulties are exacerbated when communication crosses<br />
cultural boundaries, such as between white doctors and non-white patients (Schouten et al 2007). For example,<br />
non-white patients with advanced AIDS rated the quality of communication with white physicians about their<br />
end-of-life care lower than did white patients with advanced AIDS (Curtis et al 1999). In another study, Johnson et<br />
<strong>He</strong> <strong>Ritenga</strong> <strong>Whakaaro</strong>: Māori experiences of health services | 29
2 Tātaritanga ā Rangahau Hāngai - Literature Review<br />
al (2004) used audiotape and questionnaire materials to assess the communication process, patient-centeredness,<br />
and emotional tone (affect) of 458 patient visits to 61 Maryland doctors in 1998 through 2002. They found that,<br />
physicians were 23 percent more verbally dominant and engaged in 33 percent less patient-centred communication<br />
with their African-American patients compared to their white patients.<br />
Similarly, when analysing data of standardised patients from over 330,000 simulated encounters, Van Zanten et al<br />
(2004) found greater patient satisfaction when the patient and the doctors shared the same ethnicity. This finding<br />
may be explained in part by ease of communication, both verbal and non-verbal, that can arise when the provider<br />
and the patient share a common frame of reference due to their common cultural background. Even in the absence<br />
of this connection, however, there is evidence that good communication techniques have a beneficial impact for<br />
minority patients. For example, a study (McFall et al 2001) of 535 Cherokee Nation patients in five clinics found that<br />
patients were more satisfied when they received communications and advice (even from non-Cherokee clinicians)<br />
in terms that were understandable to them.<br />
Cross-cultural training, including communication, was a key recommendation of the Institute of Medicine in its<br />
report ‘Unequal Treatment’ (Smedley et al 2002). Taylor (2004:SP1) defines ‘culturally competent communication’<br />
as ‘communicating with awareness and knowledge of healthcare disparities and understanding that sociocultural<br />
factors have important effects on health beliefs and behaviours, as well as having the skills to manage these factors<br />
appropriately’. For culturally competent communication to contribute to the reduction of health disparities, it needs<br />
to be an attribute of the patient-provider interaction, the health care organisation, and the health system (Taylor<br />
2004). (Also see section 2.3.5, ‘Reducing Disparities’, above).<br />
In summary, interpersonal relationship skills and communication skills are key to patient satisfaction and to patient<br />
outcomes. While communications may be facilitated when they occur between providers and patients who share<br />
the same cultural background, the potential for miscommunication when cultural backgrounds are different is<br />
lessened when communications are patient-centred. Communication skills can be taught (Lee et al 2002), and staff<br />
are often motivated to learn (Richardson et al 2006). However, even learning these skills does not necessarily lead<br />
to them being applied effectively or with all patients (Edwards et al 2005). Moving beyond mere communication<br />
skills to a culturally competent communication approach, across all levels of health care, holds more promise for<br />
addressing racial and ethnic disparities. The next section takes the notion of patient ‘satisfaction’ reports and<br />
inquires into what is being measured.<br />
2.4.3 Satisfaction as a Measure<br />
In recent times patient satisfaction has been seen as a key indicator of performance both in <strong>New</strong> <strong>Zealand</strong> and<br />
overseas (Jenkinson 1997; Jenkinson & McGee 1998; Hayes et al 2000). However ‘satisfaction’ as a concept lacks a<br />
clear definition and conceptual foundation (Avis et al 1995; Baker 1997), and traditional approaches to measuring<br />
‘satisfaction’ may unintentionally omit some consumer considerations (Linnell 2005). Researchers also note that<br />
satisfaction ratings usually reflect three variables: the personal preferences of the patient, the patient’s expectations,<br />
and the realities of the care received. The first two of these, and possibly also the third, are culturally based<br />
(Jenkinson 1997; Jenkinson & McGee 1998; Duff et al 2000; Hayes et al 2000).<br />
Expectations, for example, are the result of things such as cultural norms, disabilities, health status, previous<br />
experiences, and public attitudes which are in turn influenced by many factors including the media. Expectations<br />
are often simply defined as a person’s belief regarding desired outcomes, but more elaborate definitions also<br />
exist (Thompson & Sunol 1995; Staniszewska 1999). Models relating to the fulfilment of expectations have been<br />
described although these remain under debate. A common model used is one in which consumers compare their<br />
perception of the good or service against their pre-visit expectations, and ‘satisfaction’ is then defined based on<br />
how closely these expectations matched the post-visit perceptions. The value of this may by limited by, among<br />
other things, unrealistic expectations. For example, local expectations may be high because of historical patterns<br />
of service (such as historically shorter waiting times for elective surgery in the South Island). So if service levels<br />
were reduced to more ‘usual’ standards and patient expectations were no longer met, satisfaction ratings would<br />
likely decline even though overall services would be appropriate and conform to legitimate national requirements<br />
(Zeuthaml 1993).<br />
30 | <strong>He</strong> <strong>Ritenga</strong> <strong>Whakaaro</strong>: Māori experiences of health services
Tātaritanga ā Rangahau Hāngai - Literature Review 2<br />
There is also evidence that ethnicity affects patient satisfaction evaluations (Cooper et al 2003; LaVeist et al 2003).<br />
Using the SF-36 health status questionnaire Scott et al (2000) found that the health-related attitudes of younger<br />
Māori were more similar to those of the NZ European population than to Pacific people or older Māori (>45 years).<br />
However, Devlin et al (2000) using a EuroQol EQ-5D questionnaire, found no such differences between age or<br />
ethnic groups. This second finding may be explained by (a) heterogeneity of opinion in the Māori community, and/<br />
or (b) inadequate sample size to appreciate (subtle) differences (Perkins et al 2004)<br />
A Californian study (Murray-Garcia et al 2000) that investigated patients’ ratings of quality of primary care services<br />
(including technical competence, communication, accessibility, prevention and health promotion, and overall<br />
satisfaction) found significant race-based differences in satisfaction. The authors concluded that the findings may<br />
represent actual differences in quality of care or variations in: patient perceptions, patient expectations, and/or<br />
questionnaire response styles. These concerns run through much of the satisfaction research. The differences in<br />
levels of satisfaction, however, become harder to ignore in larger studies.<br />
Using nationally representative data from over 120,000 respondents to the 1998 USA National Research<br />
Corporation <strong>He</strong>althcare Market Guide survey, Havilland et al (2003) found that non-white minorities were less<br />
satisfied with their healthcare than white patients. This has been found in other studies including the survey by Taira<br />
et al (2001) of 6,092 employees in Massachusetts. In that study subjective ratings of care (knowledge of patient by<br />
doctor, skills of doctor), access to care, and continuity of care, varied by ethnicity with lower ratings given by nonwhite<br />
minority groups compared to white groups.<br />
In a study of patient perceptions of their doctors, Doescher et al (2000) reviewed data from the 1996 and 1997<br />
Community Tracking Survey. They examined two conceptually distinct measures, namely:<br />
• trust in the doctor (e.g., patients’ perception that the doctor: would place the patients’ needs above other<br />
considerations, would refer when necessary, was not influenced by monetary considerations, would not<br />
perform unnecessary tests), and<br />
• style of the doctor (e.g., listening skills, explanations, thoroughness).<br />
After adjustment for socioeconomic and other factors, minority group members reported less positive perceptions<br />
of physicians on both of these two scales than did whites. Minority group members who lacked physician continuity<br />
on repeat clinic visits reported even less positive perceptions of their physicians on these two scales.<br />
Saha et al (2003) analysed data from The Commonwealth Fund’s 2001 <strong>He</strong>althcare Quality Survey and found that<br />
barriers in the patient-physician relationship contribute to racial disparities in the experience of healthcare. In<br />
particular both satisfaction with care and use of health services were lower for some ethnic minorities than for white<br />
groups. The authors report that differences in the quality of doctor-patient interactions (i.e. communication skills)<br />
contributed to the observed disparities in satisfaction.<br />
In a further analysis of the Commonwealth Fund survey, Johnson et al (2004) found that doctor-patient<br />
communication, along with demographics and source of care, explain most racial and ethnic differences in patient<br />
perceptions of their primary care providers’ ability to interact with patients from different cultural backgrounds.<br />
However, even when controlling for these factors the authors found that non-white minority groups were still more<br />
likely to perceive that they were judged poorly by medical staff and that the care they received was of lower quality.<br />
2.4.4 Summary<br />
The measurement of patient satisfaction has been challenged on the basis of the culturally-embedded nature<br />
of patient preferences and expectations, and possibly also the realities of the care they receive. Even so large<br />
international surveys have found patient satisfaction to vary by race, with minority group patients reporting<br />
significantly lower levels of satisfaction (compared with white patients). An explanation for these findings based<br />
on the different expectations or perceptions of minority groups still leads to a conclusion that health services are<br />
not meeting their needs. And this, in turn, is probably related to the relationship and communication skills of health<br />
personnel and the cultural competence of the health organisation.<br />
<strong>He</strong> <strong>Ritenga</strong> <strong>Whakaaro</strong>: Māori experiences of health services | 31
2 Tātaritanga ā Rangahau Hāngai - Literature Review<br />
2.5 The Present Study<br />
The objective of the present research was to develop a tool to increase understanding of:<br />
• Māori use of health and disability services,<br />
• Māori experiences, expectations and perceptions of, and satisfaction with, health and disability services,<br />
• Māori consumers understanding of the information they were given by the health and disability providers,<br />
and<br />
• Barriers to optimal service use by Māori.<br />
The Accident Compensation Corporation (ACC) was also interested in:<br />
• How Māori identify appropriate providers to consult when suffering an injury,<br />
• How Māori identify when it is appropriate to seek treatment for injury, and<br />
• Whether Māori with injuries differ in their expectations from other Māori health and disability consumers.<br />
The research had the explicit goal of developing a survey tool and conducting Kaupapa Māori research. These two<br />
elements came together to set in motion the research that would address the above objectives.<br />
2.5.1 Developing a Measure of Patient Experience<br />
A typical satisfaction survey question such as ‘How satisfied were you with your care in service X?’ cannot reflect<br />
the diversity of patient backgrounds, expectations and experiences. A positive rating from a survey question like<br />
this reflects only that the (low) expectations of service users have been met but does not indicate whether the care<br />
delivered was appropriate to the patient’s needs. To become tools for quality improvement, surveys also need to<br />
gather information on whether key elements of care did in fact occur, that is, to reflect patients’ perceptions about<br />
normative expectations (Coulter 2001; Coulter & Cleary 2002; Jenkinson et al 2003). To do this requires a measure<br />
of patients’ experience based on standard questions about whether or not certain processes or events occurred<br />
during the course of a specific episode of care (Jenkinson et al 2003). Instruments to measure patients’ experiences<br />
were developed by researchers at Harvard Medical School with funds from the Picker/Commonwealth Program for<br />
Patient-Centred Care (http://www.pickereurope.org/research/publications.htm). The aim was to explore patients’<br />
needs and concerns as defined by patients.<br />
The Harvard team developed a patient feedback programme derived from qualitative research designed to find<br />
out what patients value about the experience of receiving healthcare and what they considered unacceptable.<br />
They conducted focus groups with patients and their family members, reviewed the literature and consulted with<br />
healthcare professionals to determine key priorities. This approach to measuring patients’ experience has since<br />
been adopted for use in the CAHPS surveys in the USA, the WHO responsiveness surveys and the national NHS<br />
patient survey programme in England.<br />
A similar approach was developed for the present study; namely, focus group hui were held and feedback from<br />
health consumers at these hui, combined with a review of the literature and other satisfaction surveys, led to the<br />
development of a Māori health consumer satisfaction survey. The second consideration in the development and<br />
delivery of this survey was the need for a ‘by Māori, for Māori’, or Kaupapa Māori, approach. This is considered<br />
after a brief examination of Māori engagement with survey research.<br />
2.5.2 Survey Research with Māori<br />
There is some evidence that methodological problems exist in sampling Māori households. While Māori make<br />
up some 16 percent of the population (StatsNZ 2002), evidence suggests they are under-represented in research<br />
studies undertaken by market research companies in <strong>New</strong> <strong>Zealand</strong>. Digipoll, a Hamilton-based organisation that<br />
specialises in surveys and political polls, report that Māori typically made up only 6-8 percent of households in<br />
the <strong>New</strong> <strong>Zealand</strong> <strong>He</strong>rald political polls over 2003-2004, and that Māori men are even more likely to be underrepresented<br />
(personal communication from Digipoll director).<br />
32 | <strong>He</strong> <strong>Ritenga</strong> <strong>Whakaaro</strong>: Māori experiences of health services
Tātaritanga ā Rangahau Hāngai - Literature Review 2<br />
Several factors could explain this, including that Māori are more likely to live in households containing two or more<br />
families, leading to undercounting, and that they are less likely to live in a household with a telephone and will thus<br />
be more frequently missed by telephone surveys (StatsNZ 2002). However other studies suggest that the underrepresentation<br />
is not entirely due to methodological problems. Although there is only limited research available,<br />
preliminary data indicate that Māori view participation in surveys differently than do non-Māori.<br />
Māori have often expressed reluctance to being observed and researched by non-Māori (Harvey 2002). Other<br />
researchers have documented similar reluctance to be involved in research which is felt not to value Māori<br />
knowledge, recognise Māori aptitudes, or stands to benefit Māori (Bishop 1994; Smith 1999). In addition, previous<br />
poor experiences with researchers have led some Māori to reject research and academic theories (Smith 1990).<br />
In an effort to encourage Māori participation one study developed interview questions from a Māori perspective,<br />
included an over-sample of Māori, and generated lists of Māori households from the electoral offices’ ethnicity<br />
database (Dacey 1998). The authors report that this approach was successful in ensuring that Māori had a high<br />
response rate compared to other surveys.<br />
Studies have also shown that:<br />
• Māori-based research processes are preferred by Māori participants (Dyall 1999), including those that make<br />
use of whānau, hui, people-centred approaches (Barnes 2000), and face-to-face discussions (Bishop & Glynn<br />
1992).<br />
• A Kaupapa Māori approach is preferred – where Māori are involved at all stages in the research and research<br />
is designed to be empowering for the individuals participating as well as for the Māori community as a whole<br />
(Bishop 1994).<br />
A literature search for Māori-oriented patient satisfaction surveys and contacts among all District <strong>He</strong>alth Boards and<br />
major primary care organisations in <strong>New</strong> <strong>Zealand</strong> uncovered only three Māori-specific satisfaction survey tools. Like<br />
other satisfaction surveys a variety of methods for collection of data have been used including: kanohi-ki-te-kanohi<br />
(face-to-face), mail-out, and written questionnaires with reply-paid forms.<br />
Lessons were also taken on board from a study of access to healthcare services for Medi-Cal enrolees in the United<br />
States (Solis & Rodriguez 2002). The response rates of minority groups (such as Asian American/Pacific Islanders,<br />
Native American, Blacks, and Latinos) in this study were greatly improved by:<br />
• Offering telephone or in-person interviews rather than mail surveys (especially relevant to groups with lower<br />
literacy);<br />
• Having appropriate reviewers examine the survey tool for cultural and linguistic relevancy;<br />
• Using survey questions that had been validated in other studies and that were specific to the survey<br />
requirements; and<br />
• Utilising bilingual/bicultural interviewers that reflect the target groups.<br />
2.5.3 Kaupapa Māori research<br />
Historically, the majority of research about Māori has been conducted by non-Māori, who perceived a ‘problem’<br />
and then provided a ‘solution’ based on their non-Māori world-view. Since the 1970s Māori researchers have<br />
debated and discussed appropriate research methods when Māori are involved in research as subjects and<br />
participants (Bishop 1994).<br />
Cunningham identifies three types of research approaches with Māori including (Cunningham 1999):<br />
Research involving Māori – where Māori are a minor component in research controlled by non-Māori researchers.<br />
Māori-centred research – where Māori are included as a significant part of a research project controlled by non-<br />
Māori researchers.<br />
Kaupapa Māori research – where Māori data or participants are a significant or an exclusive part in the research<br />
project, the research methodology incorporates Māori and mainstream tools or methods, and the research is<br />
controlled and analysed from a Māori context.<br />
<strong>He</strong> <strong>Ritenga</strong> <strong>Whakaaro</strong>: Māori experiences of health services | 33
2 Tātaritanga ā Rangahau Hāngai - Literature Review<br />
Glover (1997) and Barnes (2000) have suggested that Kaupapa Māori research developed because of Māori discontent<br />
with the prevailing Western methods and control, and the revitalisation of Māori knowledge, culture and values. Reid<br />
(1998) agreed and added that Kaupapa Māori research challenges the universal approach by demonstrating that<br />
research methods may need to be culturally tailored to the study population in order to obtain valid results.<br />
Linda Smith (1999) describes the Kaupapa Māori approach as the ‘development and promotion of appropriate<br />
methodologies for research with Māori’ (Smith 1999). Irwin describes it as ‘research which is culturally safe, which<br />
involves the mentorship of kaumātua, which is culturally relevant and appropriate, while satisfying the rigour of<br />
research, and which is undertaken by a Māori researcher, not a researcher who happens to be Māori’ (Irwin 1994).<br />
Graham Smith (1990) suggests that the theory of Kaupapa Māori has several aspects, namely that it is aligned to<br />
being Māori; is based on Māori principles; assumes the validity and legitimacy of Māori language and culture; and is<br />
connected with the struggle for Māori self-determination. Kaupapa Māori research asserts that Māori are involved<br />
in the research and that the research outcome is intended to make a positive difference for Māori. Barnes adds that<br />
Kaupapa Māori originates from a Māori world-view.13<br />
Pihama (1993, 2001) describes the link of Kaupapa Māori research with critical theory as an act that exposes the<br />
assumptions that underlie dominant groups and inequalities.<br />
As Cunningham suggests, Kaupapa Māori research continues to develop, and critique by Māori and non-Māori<br />
researchers alike can assist in ensuring Kaupapa Māori research methods have a sound philosophical base<br />
(Cunningham 1999).<br />
The Kaupapa Māori approach taken in the present research meant that:<br />
• The research was led, and controlled, by Māori.<br />
• Māori consumer voices were taken seriously and were used to inform the design of the research, including<br />
the analysis of the data gathered.<br />
• Māori advisors, including kaumatua, consumers and academics, were involved to ensure that the study was<br />
culturally and scientifically sound.<br />
• Māori communities were involved in organisation and running of the hui, to facilitate participant involvement<br />
and ensure the adherence to local protocols.<br />
• The survey questionnaire was pre-tested with a Māori panel to ensure that it was worded appropriately and<br />
that the process for its delivery would facilitate Māori involvement.<br />
• A strengths-based approach, as opposed to a deficit, victim-blaming approach, was taken to the data analysis<br />
and report. This centred Māori perspectives and looked for systemic explanations for findings.<br />
34 | <strong>He</strong> <strong>Ritenga</strong> <strong>Whakaaro</strong>: Māori experiences of health services
Ngā Tapuae me Ngā Raraunga – Methodology 3<br />
This methods section describes the advisory groups that were put in place to assist with the present research and<br />
the ethical protocols that were adopted. The research methods are then outlined, followed by a description of<br />
the implementation of the hui method and the survey questionnaire. Following on from this chapter, two findings<br />
chapters explore the results from the hui and from the survey.<br />
3.1 Research Oversight<br />
A project team was established in July 2004, including an expert Māori facilitator (Manujon Pemerika) and the<br />
Mauri Ora Associates Project Team. In addition a technical advisory committee, a kaumātua advisory committee,<br />
and a consumer advisory committee were established (refer to Acknowledgements for names). The Kaumātua and<br />
Consumer Advisory Committees included Māori with knowledge of health and disability and ACC services. The<br />
committee members came from all major iwi and geographic regions throughout <strong>New</strong> <strong>Zealand</strong>. The groups initially<br />
met separately but as the project progressed the preference of the Kaumatua and Consumer Advisory Committees<br />
was for joint meetings. This joint committee then met regularly for several months to review background material,<br />
advise on how the hui should be designed and run, and to review the hui findings.<br />
Ethics approval was obtained from the Waikato Ethics Committee (WAI/03/12/089) on 13 April 2004.<br />
Representatives from the local Māori groups were then contacted to assist with participant recruitment, arranging<br />
facilities, holding the hui, and consulting with other key organisations.<br />
In addition to obtaining ethical approval for the research proposal, the current project also:<br />
• Utilised Kaupapa Māori methodology and ensured the diverse needs of Māori were addressed;<br />
• Directly involved and benefited Māori consumers;<br />
• Gained informed consent from Māori consumers;<br />
• Maintained strict confidentiality and privacy;<br />
• Ensured that intellectual property issues were managed;<br />
• Established a koha or reciprocity policy for participants;<br />
• Encouraged full participation of Māori health consumers and services, while maintaining the safety of<br />
consumers; and<br />
• Focused on community-based treatment or rehabilitation services (including Rongoā) rather than tertiary or<br />
institutional services.<br />
Māori researchers were involved throughout this project, and other Māori staff were recruited and trained to<br />
undertake research roles as part of the commitment of building Māori research capacity. Collaboration with Māori<br />
communities and Māori healthcare organisations allowed for effective recruitment of Māori staff and also facilitated<br />
Māori participation in the research.<br />
3.2 Overview of Research Methods<br />
Building on available information, the current study first applied qualitative methods to examine barriers to Māori<br />
use of health services, together with the expectations, preferences, understanding and experiences of Māori<br />
consumers of injury, health and disability services. As described below, hui (focus groups) elicited the likes and<br />
dislikes arising from those experiences. The literature review was reviewed by the technical advisory group in<br />
developing a guide for the hui facilitator. Along with a summary of the literature review, this guide was then<br />
reviewed by Kaumatua and Consumer advisory groups.<br />
<strong>He</strong> <strong>Ritenga</strong> <strong>Whakaaro</strong>: Māori experiences of health services | 35
3 Ngā Tapuae me Ngā Raraunga – Methodology<br />
Diagram 2. Survey development process<br />
<br />
<br />
<br />
<br />
<br />
<br />
<br />
<br />
<br />
<br />
<br />
The findings from the hui, in turn, informed the second, quantitative, data collection phase in which Māori health<br />
consumers (or, in some instances, their caregivers) were surveyed via telephone or face-to-face (see Diagram 2).<br />
Using the results from the 10 hui and a literature search, a semi-structured 1 survey questionnaire was developed to<br />
gather information about issues, barriers, constraints, and incentives around Māori use and experiences of health<br />
and disability services.<br />
The survey tool was designed to be applicable for Māori consumers or the parents of Māori children. Care was<br />
also taken to ensure that the survey questions would be easily understood by the majority of Māori respondents<br />
interviewed. This survey tool was developed in consultation with Māori individuals, consumers, and a panel of<br />
Māori health experts:<br />
• The technical advisory group was provided with the results of the 10 hui, the literature review, information<br />
on surveys of consumers’ experiences or satisfaction (e.g., Dacey 1998, Kers et al 2004, ProCare <strong>He</strong>alth<br />
Ltd 1995, Picker Institute Europe 2005, Ministry of <strong>He</strong>alth ‘Confidence in Your <strong>He</strong>alth Practitioner’ 2004),<br />
and information about relevant standards of care for a range of health services in <strong>New</strong> <strong>Zealand</strong>. From this<br />
information the group considered components of care and questions that could be asked. The issues<br />
reported in the hui were incorporated into the questions to ensure that the tool accurately reflected Māori<br />
concerns. The team then reviewed and discussed the questions to ensure their appropriateness. Questions<br />
were rewritten or omitted if they were thought to be confusing, lacking in clarity, or phrased inappropriately.<br />
• A panel of four Māori health professionals were asked to review the draft questionnaire for its<br />
understandability and validity (i.e., face validity, content validity, and construct validity). They were then<br />
interviewed as key informants and asked to nominate additional items and/or to indicate items they thought<br />
were irrelevant or redundant. Minor changes were made based on this feedback.<br />
• The modified survey tool (along with the methods of use and the instructions for the interviewers) was<br />
then reviewed by the Kaumātua and Consumer advisory groups. These groups provided feedback on: the<br />
language used and the clarity and understandability of the questions, the methods of data collection, the flow<br />
of the survey, and the relevance of the issues canvassed.<br />
Final revisions were then made and the survey was then ready to be administered to a Māori respondent sample<br />
(see below).<br />
1 In other words, some open ended questions were included, but the majority of the questions were focused in nature, with a limited range of possible responses.<br />
36 | <strong>He</strong> <strong>Ritenga</strong> <strong>Whakaaro</strong>: Māori experiences of health services
Ngā Tapuae me Ngā Raraunga – Methodology 3<br />
3.3 Hui Method<br />
A series of ten hui were held in both rural and urban areas across the country between 7 September 2004 and 12<br />
March 2005. All hui were organised in conjunction with leaders of local marae or community groups, followed<br />
local kawa, and were facilitated by Māori from the project team. Hui participants were Māori users of health and<br />
disability services and/or ACC services and included rangatahi, pakeke, kaumātua, tāne and wāhine. The number of<br />
participants at each hui ranged from five to 15, with a total of 86 participants attending the hui (Table 2).<br />
Table 2. Hui dates, locations, and demographic characteristics of participants<br />
Group Date Location (number of attendees) Demographic Characteristics<br />
1 7 Sept 04 Urban/Rural, Waikato (9) Hauora/ Whara – Tāne<br />
2 16 Sept 04 Urban, Wellington (5) Hauā/ Whara – Wāhine<br />
3 21 Sept 04 Rural, East Cape (9) Hauora/ Whara – Wāhine<br />
4 1 Oct 04 Urban, Auckland (8) Hauā/ Whara – Wāhine and Tāne<br />
5 8 Oct 04 Urban, Christchurch Rangatahi (6) Wāhine and Tāne<br />
6 8 Oct 04 Urban, Christchurch (8) Hauora/ Whara – Wāhine<br />
7 29 Oct 04 Urban/Rural, Waikato (8) Hauā/ Whara – Tāne<br />
8 22 Nov 04 Urban, Auckland Rangatahi (9) Wāhine and Tāne<br />
9 24 Nov 04 Rural, Waikato (15) Hauora/ Whara – Tāne<br />
10 12 Mar 05 Urban, Hawkes Bay Hauā (9) Ngati Kāpō<br />
Total participants = 86<br />
Participants were recruited by the ‘snowball’ method. 2 Telephone or personal contact with local leaders was<br />
followed by written materials for distribution to groups associated with the marae or organisation, inviting their<br />
participation. Some hui were held specifically for people with disabilities while others were open to everyone. Many<br />
of the participants were supported at the hui by supporters, friends, and/or whānau members.<br />
Each hui began with formal protocols, including the welcoming of participants, as appropriate for the location of<br />
the hui. These were followed by researcher introductions, followed by an explanation of the research objectives<br />
and the hui process. Participants then signed an informed consent form and filled in a demographic questionnaire.<br />
Group introductions followed. The hui then proceeded along the following lines:<br />
• General reflections on experiences – participants were asked to describe a recent visit to a health service,<br />
with the group discussing the similarities and differences between their experiences.<br />
• Important qualities – participants were asked to write down the things about the health services they dealt<br />
with that are important to them and their families. This was followed by discussion after which participants<br />
had a second opportunity to consider and identify the things that were important to them.<br />
Participants were then asked whether there were other issues they wanted to raise and, following this, the hui was<br />
summed up by the facilitator and the hui was then formally closed.<br />
The hui, with one exception, were video- and audio-taped and subsequently transcribed. At one hui the participants<br />
did not wish to be recorded and extensive notes were taken by project team members. All participant comments<br />
were included in a thematic analysis whereby the hui transcripts were read and re-read by the research team. The<br />
purpose of this reading and re-reading was to look for patterns or common themes within and across participants’<br />
talk (Quinn Paton 2002). These themes were then discussed and agreed upon by the research team. (A summary of<br />
the hui is in Appendix B).<br />
2 This recruitment method starts with a small, target group of potential participants who are then asked to recruit others in their networks who, likewise, may also be invited to recruit others from their<br />
networks. This method is often used to recruit difficult to reach or ‘hidden’ subpopulations. Such participant samples are often neither random nor representative.<br />
<strong>He</strong> <strong>Ritenga</strong> <strong>Whakaaro</strong>: Māori experiences of health services | 37
3 Ngā Tapuae me Ngā Raraunga – Methodology<br />
3.4 Survey Method<br />
3.4.1 The Survey<br />
To ensure adequate recall of events, coverage across the different services, and to keep the interview to a<br />
manageable length of time, people responded only to the health provider sections they had experience of in the<br />
past six months. A total of 651 Māori were surveyed.<br />
The questionnaire (Appendix C) was set up in a series of sections:<br />
• Introduction and explanation<br />
• General health and health services visited over past 6 month period (6 questions)<br />
• In the interests of time, it was decided not to ask every respondent to describe every visit for the purpose of<br />
the study. Instead, a quota system was used to ensure an adequate collection of information about all of the<br />
different services. The data collection therefore solicited information about different healthcare providers<br />
until a sufficient number of respondents from an appropriate demographic range had answered questions<br />
about that particular service. Once that quota had been reached, subsequent respondents were not asked<br />
about their experiences with that type of care provider. In this way, after a certain point, data gathering on<br />
the more commonly used services (i.e. primary care) was eschewed, and subsequent respondents were<br />
asked only about their experiences with other services, such as secondary care.<br />
• GP section (38 questions)<br />
• Specialist section (38 questions)<br />
• A&E section (25 questions)<br />
• Hospital section (26 questions)<br />
• Funding Bodies (ACC primarily, but also WINZ) section (17 questions)<br />
• Other services (e.g., physiotherapy, occupational therapist) section (15 questions)<br />
• Attitudes towards health and service providers section (31 questions)<br />
• Demographic section (11 questions)<br />
The bulk of questions relating to health provider experience (Sections 3-8) used a binary ‘Yes/No’ response<br />
method. This was done to facilitate responses to a large number of questions. (The alternative of using a 5- or<br />
7- point Likert-type scale would have imposed too much of a processing burden upon respondents, resulting in<br />
fatigue and early termination of the interviews.) In addition the ‘Yes/No’ response ensured that answers were not<br />
biased due to literacy or language issues. Lastly, the ‘Yes/No’ response minimised the time required to complete the<br />
survey.<br />
At the end of each of these sections an overall experience question was asked using a 3-point scale (Good/<br />
Average/Poor), and two open-ended questions were asked relating to overall positive and negative impressions of<br />
the visit. Responses to these questions were recorded verbatim.<br />
To assess attitudes a series of statements was read and subjects were asked to respond on a 3-point scale (Agree/<br />
Disagree/Neither agree nor disagree). The statements covered a range of topics including attitudes about: personal<br />
health, providers, quality of care, and cultural competency.<br />
38 | <strong>He</strong> <strong>Ritenga</strong> <strong>Whakaaro</strong>: Māori experiences of health services
Ngā Tapuae me Ngā Raraunga – Methodology 3<br />
3.4.2 Delivery of the Survey<br />
Although much of the literature on research with Māori recommends face-to-face interviewing, a modified<br />
telephone approach was proposed as the most appropriate method for this project because:<br />
• Providers of research field services (e.g., Digipoll (Hamilton), BRC Marketing & Social Research (Wellington),<br />
SHORE (Massey University, Auckland)) have been successfully conducting telephone research with Māori<br />
for several years. In addition, there are published studies using this method (Dacey 1998).<br />
• With a large sample preferred, face-to-face research would have taken a long time. Telephone offers the<br />
ability to quickly carry out projects.<br />
• Telephone is by far the most cost effective approach to obtain a nationwide representative sample from a<br />
widely dispersed population.<br />
The process was as follows: (1) a telephone call to recruit people, (2) a letter in English and Māori explaining the<br />
project (Appendix D), and then (3) a further call to conduct the study. The letters were on Mauri Ora letterhead,<br />
outlining the nature of the study and inviting people to participate when the call came. This was done to follow<br />
Kaupapa Māori research methods more closely and to increase response rates (Barnes 2000; Smith 1999).<br />
On average each interview took 22 minutes to complete. The survey company used to provide the telephone data<br />
collection service (Digipoll) had Māori speaking interviewers available for the interviewing process.<br />
Some Māori, particularly those in households without landline telephones, were excluded from our survey. In spite<br />
of this, demographic analysis of the final sample (see below) showed that a representative sample of the target<br />
population had been obtained.<br />
It was expected that people with physical and sensory disabilities would be interviewed via the telephone, the<br />
deaf being the only group not possible to interview in this way. Fifty deaf Māori were recruited through the Deaf<br />
Association’s Māori Deaf Development Manager and interviewed face-to-face with the help of interpreters to<br />
ensure coverage of this particular group. These interviews took approximately 45 minutes to complete. The Deaf<br />
Association also provided assistance with: re-designing the information leaflets and consent forms, advertising<br />
the research within the Māori Deaf community, sourcing trilingual interpreters, and arranging meetings with the<br />
interviewers.<br />
3.4.3 Survey Sample<br />
The sample for this study was chosen to obtain an even spread across the Māori electoral seats (7 in all, covering<br />
<strong>New</strong> <strong>Zealand</strong>) because the constituency of each of these seats encompasses equally the diversity and concentration<br />
of Māori community. A total of 1000 letters where sent to Māori on the electoral rolls advising them of the survey<br />
ahead of the telephone calls seeking information on their experiences of care.<br />
During the survey phase respondents were asked about the last experience of health care they had received. The<br />
sample included a 30% quota for non-general practice contacts. This was included because the majority of health<br />
system contacts occur with GPs but feedback on the survey was required from people about other elements of the<br />
health system. Sampling continued until the pre-determined number of 651 surveys was completed by telephone<br />
and through interviews with Māori deaf using tri-lingual interpreters.<br />
The sample was divided by gender (41% male, 59% female) to approximate both population demographics (49%<br />
male, 51% female 3 ) and the gender bias of health system consumers (MOH 2006).<br />
3.4.4 Survey Respondent Demographics<br />
Fifty-nine percent (N=384) of the survey respondents were female, 41 percent (N=267) were male. The majority of<br />
respondents were aged between 25 and 60 years.<br />
3 Statistics NZ (2005). National Ethnic Population Projections (2001 base)<br />
<strong>He</strong> <strong>Ritenga</strong> <strong>Whakaaro</strong>: Māori experiences of health services | 39
3 Ngā Tapuae me Ngā Raraunga – Methodology<br />
Table 3.Gender and age groups of respondents’<br />
Count %<br />
Gender<br />
Male 269 41%<br />
Female 382 59%<br />
Total 651 100%<br />
Lowest thru 19 10 2%<br />
20 thru 24 29 4%<br />
Age group<br />
25 thru 29 43 7%<br />
30 thru 34 69 11%<br />
35 thru 39 96 15%<br />
40 thru 44 103 16%<br />
45 thru 49 76 12%<br />
50 thru 54 67 10%<br />
55 thru 59 48 7%<br />
60 thru 64 34 5%<br />
65 thru 69 29 4%<br />
70 plus 42 7%<br />
Total 646 100%<br />
Over half of the respondents’ (59.3%, N=384) lived in households of two to four people (including themselves)<br />
(Table 4. Just under one in 10 respondents’ lived by themselves (N=59, 9.1%).<br />
Table 4. Number of people living in respondents’ household (including respondent)<br />
Number of people N %<br />
1 59 9.1<br />
2 133 20.5<br />
3 98 15.1<br />
4 153 23.6<br />
5 90 13.9<br />
6 67 10.3<br />
7 24 3.7<br />
8 10 1.5<br />
9+ 14 2.2<br />
Total 648 100.0<br />
Over two-thirds of the respondents’ (N=465, 71.4%) lived in family households with children (Table 4). The children<br />
were mainly: school-age (N=270, 41.5%), adult (N=112, 17.2%), or pre-school (N=83, 12.7%).<br />
40 | <strong>He</strong> <strong>Ritenga</strong> <strong>Whakaaro</strong>: Māori experiences of health services
Ngā Tapuae me Ngā Raraunga – Methodology 3<br />
Table 5 Household composition and working status<br />
Household type N %<br />
Family with mainly school age children 270 41.5<br />
Family with mainly adult children living at home 112 17.2<br />
Family with mainly pre-school children 83 12.7<br />
Older couple with no children at home 81 12.4<br />
Older single person living alone 53 8.1<br />
Flatting with others 23 3.5<br />
Young couple with no children at home 14 2.2<br />
Young single person living alone 8 1.2<br />
Refused to answer 7 1.1<br />
Total 651 100.0<br />
Working status %<br />
Employed full time (30 hours or more) 297 46%<br />
Employed part-time (under 30 hours) 92 14%<br />
Full-time student 32 5%<br />
Unemployed/not working 63 10%<br />
Homemaker 94 14%<br />
Retired 69 11%<br />
Refused 4 1%<br />
651 100%<br />
Approximately one-fifth of respondents’ (21.4%) had a household income of less than $21,000 per year (Table 6).<br />
Sixteen percent of respondents’ had an annual household income greater than $77,000.<br />
Table 6 Respondents’ annual household income<br />
Combined household income before tax N %<br />
Under $21,000 139 21.4<br />
$21,000 - $33,000 107 16.4<br />
$33,000 - $52,000 135 20.7<br />
$52,000 - $77,000 113 17.4<br />
Over $77,000 104 16.0<br />
Don’t Know/Refused 53 8.1<br />
Total 651 100.0<br />
Half of the respondents’ (N=327, 50.2%) did not have either a Community Services Card (CSC) or a High Use<br />
<strong>He</strong>alth Card (HUHC) (Table 7). Just under half of the respondents’ held a Community Services Card, either by itself<br />
(N=286, 43.9%) or in conjunction with a High Use <strong>He</strong>alth Card (N=22, 3.4%).<br />
<strong>He</strong> <strong>Ritenga</strong> <strong>Whakaaro</strong>: Māori experiences of health services | 41
3 Ngā Tapuae me Ngā Raraunga – Methodology<br />
Table 7 Respondents’ with Community Services Card and/or High Use <strong>He</strong>alth Card<br />
Card(s) held by respondents N %<br />
Neither 327 50.2<br />
Community Services Card (CSC) only 286 43.9<br />
High Use <strong>He</strong>alth Card (HUHC) only 13 2.0<br />
Both CSC and HUHC 22 3.4<br />
Don’t know/Refused 3 0.5<br />
Total 651 100.0<br />
Over half of the respondents’ (61.8%) said that they could speak some Māori language, with one fifth of<br />
respondents’ (21%) stating that they could speak the Māori language well or very well (Table 8). Nearly 15 percent<br />
of respondents’ (N=84, 14.8%) said that they could not speak the Māori language at all.<br />
Table 8. Respondent’s Māori language ability<br />
Ability to speak the Māori language N %<br />
Very well 81 14.3<br />
Well 38 6.7<br />
Fairly well 98 17.3<br />
Not very well 133 23.5<br />
A few words or phrases 132 23.3<br />
Not at all 84 14.8<br />
Total 566 100.0<br />
The biggest groups of respondents’ came from, or were based near, Hamilton/Cambridge/Te Awamutu (N=103,<br />
15.8%); Auckland (N=99, 15.2%); and Whangarei (69, 10.6%) (see Appendix E).<br />
Over half of the respondents’ (N=341, 52.4%) lived in the areas that are described by the NZDeprivation Index as<br />
the most and second-most deprived in the country (Figure 4). Only 15.4% (N=100) of the respondents’ lived in<br />
areas of least deprivation (1-5).<br />
Figure 4. Deprivation Index<br />
<br />
<br />
250<br />
200<br />
150<br />
100<br />
50<br />
0<br />
<br />
<br />
2<br />
3<br />
4<br />
5<br />
6<br />
7<br />
8<br />
9<br />
<br />
42 | <strong>He</strong> <strong>Ritenga</strong> <strong>Whakaaro</strong>: Māori experiences of health services
Ngā Tapuae me Ngā Raraunga – Methodology 3<br />
The majority of respondents’ (N=553, 84.9%) chose to answer the survey about their own experiences (Table 9).<br />
Just over 10% (N=70) responded on behalf of a child or youth, and a small number of respondents’ (N=25, 3.8%)<br />
responded on behalf of an adult or spouse who they looked after.<br />
Table 9. Response on behalf of self or other<br />
Focus of responses N %<br />
Myself 553 84.9<br />
A child/youth 70 10.8<br />
An adult/spouse I look after 25 3.8<br />
Other 3 0.5<br />
Total 651 100.0<br />
3.4.5 Analysis of survey results<br />
Each health provider section (e.g., GP visit, Specialist visit) consisted of three main sets of measures:<br />
• Service standards measures: These were measured using a dichotomous Yes/No response. These were<br />
analysed using simple counts. In investigating relationships between these variables and others of interest<br />
(e.g., income, location), appropriate statistics (e.g., chi square) have been used depending on the other<br />
variable (e.g., categorical, ordinal) under investigation.<br />
• Overall experience: The overall evaluation of each visit was measured with a 3-point ordinal scale (Good/<br />
Average/Poor). These were analysed using simple counts and the mode. Related to the overall experience,<br />
comments were gathered on elements of the experience people liked, and another question on what was<br />
disliked. These were recorded verbatim, and have been coded into categories and analysed using simple<br />
counts.<br />
• Importance of service standards: Elements of the different visits were modelled to determine which were<br />
significant in predicting the Overall Experience variable and Intention to Revisit.<br />
More information about the quantitative analysis is in Appendix F. Tests of the surveys reliability and validity were<br />
also carried out and are reported in Appendix G.<br />
<strong>He</strong> <strong>Ritenga</strong> <strong>Whakaaro</strong>: Māori experiences of health services | 43
4 Ngā Tukunga Iho o Ngā Hui – Hui Findings<br />
The views expressed by hui participants are presented in this chapter. Participants talked about their experiences<br />
across a range of health services, including general practice, hospital and ACC. All participant comments were<br />
included in the thematic analysis except where comments were unclear (e.g., inaudible). The themes arising from<br />
this analysis are presented here: firstly grouped by service, and secondly grouped by three of the capacity levels<br />
described in the Introduction; namely:<br />
<strong>He</strong>alth organisation – the processes, structures and management systems<br />
Human resource – the people who work in health care<br />
Patient or community – the people who engage with the health sector<br />
This second level of grouping has been used because the themes fitted easily into these levels and it allowed for<br />
an analysis of similarities and differences between the present findings and the findings from previous research<br />
outlined in the Introduction.<br />
Hui participants have been quoted in order to illustrate the themes. Quotes are verbatim unless deliberate<br />
alterations were necessary to protect the identity of participants. Care has been taken that such changes have not<br />
altered meaning.<br />
4.1 Participants’ Experiences of General Practice<br />
Participants’ experiences of general practice were, in the main, related to how they had been treated by health<br />
staff, and their hesitancy about seeking treatment. This hesitancy, or ‘wait and see’ attitude, described by many<br />
participants was associated with their financial concerns and their values and beliefs, as well as with their knowledge<br />
of how general practice staff were likely to treat them based on their previous experiences. Participants’ experiences<br />
of specialists are also included in this section as feedback in this area was limited.<br />
4.1.1 <strong>He</strong>alth Organisation<br />
Issues such as inflexible schedules, distance to the nearest clinician, and waiting times, were raised by participants<br />
as barriers to them accessing a GP.<br />
“I come home from work at odd hours now. I don’t know when I can go.” (Auckland)<br />
“We’re from an isolated area and it will take you about two hours to get to the closest town.”<br />
4.1.2 Human Resources<br />
Participants expressed their views about how they were treated by general practice staff. Many participants felt<br />
that they were treated with disrespect because they were Māori. Participants were also critical of the way staff<br />
communicated health information to them. Finally, a criticism of staffs’ clinical skills also began to surface at the hui.<br />
Disrespect and racism<br />
One of the participants’ major concerns was their perception that non-Māori health providers were biased against<br />
Māori patients.<br />
“Māori feel [clinicians] think, ‘Oh, there they are again, bludgers.’ No Māori wants to feel as if<br />
he’s a bludger.” (Waikato)<br />
“I think [clinicians] all look at us in that way. They’re always asking if you’ve got a community<br />
card. If you are Māori, you get asked if you’ve got a card. Have you got a community card?”<br />
(Waikato)<br />
“I said to one doctor, ‘Would you have been so rude if I was Pākehā?’” (East Cape)<br />
44 | <strong>He</strong> <strong>Ritenga</strong> <strong>Whakaaro</strong>: Māori experiences of health services
Ngā Tukunga Iho o Ngā Hui – Hui Findings 4<br />
“The [Māori patients] are put aside, made to wait two to three minutes when they arrive before<br />
anyone talks to them. While they are waiting, five Pākehā go through.” (East Cape)<br />
Sometimes staff behaviours were perceived as being inflexible or lacking in empathy.<br />
“I’m actually here to see the doctor. I don’t want to go through this huge process with everyone<br />
sitting around listening to what I’m saying to the receptionist.” (Christchurch)<br />
“I felt that you were just a number.” (Hawkes Bay hauā)<br />
Communication<br />
Communication was frequently cited as a major barrier to healthcare, with staff described by participants as unable<br />
or unwilling to explain health issues to patients. Sometimes this was explicitly identified by participants as another<br />
form of prejudice against Māori, as in the third quote below.<br />
“Sometimes they don’t say it in an easy way that you can understand. I think they use too many<br />
medical words, and some people might not understand it. Not everybody can go to a medical<br />
textbook and open it and know what a word means in Māori or English.” (Auckland)<br />
“I had a good doctor, he was a good doctor, but he explained nothing. I just went on my merry<br />
way doing everything that I shouldn’t have been doing, but I didn’t know that I shouldn’t have<br />
been doing it.” (Hawkes Bay hauā)<br />
“[There are] very few Māori doctors, so the majority of Māoris go to a Pākehā doctor. Whether<br />
[the Pākehā doctors] do it deliberately or not, they don’t encourage [patients] to take the services<br />
that are available to them.” (Waikato)<br />
Specialists were also noted as having difficulties communicating effectively. One way to improve their<br />
communication was by patients challenging their behaviour and attitude; as the participant quoted below did.<br />
“They think they’re above God and everything else. I said, ‘Listen, what’s happening here? What<br />
are you doing?’ <strong>He</strong> said I don’t need to know – more or less, shut up and let me get on with<br />
my business. I said, ‘Look here!’ <strong>He</strong> knew I had started to get a bit more serious. <strong>He</strong> started to<br />
explain things, and I said, ‘Good man’.” (Hawkes Bay hauā)<br />
Participants pointed out that communications might be better if staff learned about Māori, with some also<br />
acknowledging that to learn about another culture was far from an easy task:<br />
“They’re more interested in red tape than in the actual person. That red tape is on the other side,<br />
isn’t it? So the atmosphere and all that, it’s just totally different cultures.” (Waikato)<br />
“I guess they need to know about Māori… It’s not something you learn in a night. It’s not like you<br />
can learn this mate, and you’re onto it.” (Waikato)<br />
There was also a belief that doctors from a similar cultural background to patients would provide better health care.<br />
“[<strong>Doctor</strong>s] need to meet your needs, but sometimes it doesn’t happen unless you have a Māori<br />
doctor.” (Christchurch)<br />
“Māori doctors… seem as though they care about you and they actually are interested in you and<br />
what is wrong with you.” (Auckland Rangatahi)<br />
<strong>He</strong> <strong>Ritenga</strong> <strong>Whakaaro</strong>: Māori experiences of health services | 45
4 Ngā Tukunga Iho o Ngā Hui – Hui Findings<br />
Clinical skills<br />
Some participants questioned the clinical skills of the GP or nurse they were seeing, and tended to link this to a<br />
more general disrespect on the part of the health professional.<br />
“How do you get through to doctors and nurses that think they know everything? How do you<br />
tell them? You have a doctor who goes and says to you, ‘I had 20 years, and I know what I’m<br />
doing,’ and the next minute the needle has gone right through the vein, but nothing has been<br />
drawn out.” (Wellington)<br />
4.1.3 Patient - Community<br />
Participants’ reluctance to see a doctor has been described here as a ‘wait and see’ attitude; that is, wait and see if you<br />
get better before going to the doctor. There are multiple reasons for this attitude, including participants’ knowledge<br />
of how they may be treated by the general practice, financial concerns, a perception that visits to doctors are often<br />
not good value, and participants’ concerns about privacy. For some participants, however, access was often seen as a<br />
necessity, and there were calls for it to be seen by Māori as a right. These themes are explored below.<br />
‘Wait and see’<br />
When discussing GP visits, many participants, both men and women, shared a philosophy that visiting the doctor<br />
should occur only when it is clear that the condition will not resolve itself on its own.<br />
“I was sick for two weeks before I went to the doctor. The only reason I [went] was because I<br />
wasn’t getting any better.” (Christchurch Rangatahi)<br />
“That went on for a long, long time until I said [to him], ‘Oh, I think I’d better ring the doctor.’ <strong>He</strong><br />
said,” No, no, no, I’m not sick.’ One day he said, ‘I think you’d better ring the doctor.’ <strong>He</strong> was –<br />
bang! – straight into hospital.” (Hawkes Bay hauā)<br />
This ‘wait and see’ attitude was seen whether illness or injury was under discussion and was the same for those with<br />
disabilities and those without. The only difference suggested by some participants was a gender-based one, with<br />
Māori men seen as inclined to believe that they should be tough and not seek health care. The second quote above<br />
illustrates that sometimes participants waited and left health problems too long and, in this case at least, required<br />
hospitalisation as a result. A more serious consequence of this ‘wait and see’ attitude was death.<br />
“I’ve seen so many of our whānau who have died because they tried to hang in there, hang in<br />
there, hang in there. We’ve got to be honest and say that a major factor is money.” (Waikato).<br />
Financial concerns<br />
Hui participants said that many times their own ‘wait and see’ attitude to health care was related to financial<br />
concerns.<br />
“It costs a lot to go to the doctor and prescriptions on top of that. You really hold off until you’re<br />
really desperate to go to the doctor.” (Christchurch Rangatahi)<br />
Sometimes money problems prevented access to care, even when a GP visit is desired and sought after.<br />
“I had an incident with mokopuna up from Wellington. <strong>He</strong> had to go to the doctor, but I was<br />
refused because I had an unpaid bill, so they wouldn’t take my moko, my grandson.” (East Cape)<br />
“The biggest thing on my mind is, how much is this going to cost me? Can I afford the<br />
prescriptions that they’re going to give me?” (Waikato)<br />
46 | <strong>He</strong> <strong>Ritenga</strong> <strong>Whakaaro</strong>: Māori experiences of health services
Ngā Tukunga Iho o Ngā Hui – Hui Findings 4<br />
It was also clear that ‘low cost’ is a relative term.<br />
“They think you can afford it… with the community services card. [But] the medication might be<br />
$30 and they only reduce it to $15. That’s still heaps of money.” (Auckland Rangatahi)<br />
“Too many Māori deaf are very poor and they can’t afford [health care].” (Wellington)<br />
A related financial factor influencing the decision to see a doctor or not was the lack of transportation.<br />
Value<br />
Many participants saw the GP visit as another burden associated with being ill, rather than as a tool to improve their<br />
health. There was also a perceived lack of value in many GP visits due to, for example, the shortness of the visit, not<br />
feeling any better as a result of visiting a GP, and the lack of willingness of the GP to discuss more than one health<br />
issue. Some participants also felt that regular visits (e.g., in conjunction with medication refills) were of no benefit<br />
to their health but merely a drain on their resources. All of these issues may also be linked with the communication<br />
issue explored above; that is, patients may question the value of a GP visit because the doctor has not explained<br />
things fully and understandably to them.<br />
“[It] costs a mint to go to the family doctor for a two minute kōrero.” (East Cape)<br />
“You’re paying big money and then you come out dissatisfied. You don’t mind paying that money<br />
if you come out and you feel good. [But it’s different] if you have paid $30 or $40 and you don’t<br />
feel as though they’ve helped you.” (Hawkes Bay Hauā)<br />
“If you have an injury in your leg and something wrong with your ears too, they just want to know<br />
about your leg. You’ve got to then come back later about your ear. You’re trying to explain that<br />
you’ve got a sore ear, and they’re just trying to look at your leg. I like to go and get them all seen<br />
to, my ear and my knee.” (Auckland Rangatahi)<br />
There were also participants who believed that a Western doctor could not heal them and was therefore of little<br />
value.<br />
“Like all my family, they don’t go. They stay true to their old medicine. My auntie who I live with…<br />
she’s really sick at the moment… She won’t go to the doctor because she doesn’t think the doctor<br />
can give her anything for what she has. That’s how she is. That is how she was brought up. She<br />
doesn’t need a doctor to fix her.” (Auckland Rangatahi)<br />
Drawing attention to oneself<br />
For some participants the ‘wait and see’ attitude described above stemmed from their feelings that it was<br />
inappropriate to call attention to themselves or their individual needs.<br />
“We don’t make a noise; it’s just not our way. We just sit there and just grin and bear it. It’s just<br />
not our way to make a fuss, to formalise it, to challenge something. We will just sit there and bide<br />
time, hoping that someone will realise we need help.” (Waikato)<br />
Sometimes drawing attention to individual needs was seen as a waste of a doctor’s time because the health issue<br />
was perceived by the participant to be only minor.<br />
“I was thinking, ‘No, I’m not going in there wasting the doctor’s time.’ You know, this is only<br />
a bite; that’s all it is. I can do it myself, which I did, until the end… I think a lot of us do this.<br />
Eventually it healed, but it took four months.” (Christchurch)<br />
<strong>He</strong> <strong>Ritenga</strong> <strong>Whakaaro</strong>: Māori experiences of health services | 47
4 Ngā Tukunga Iho o Ngā Hui – Hui Findings<br />
For some participants the problem was not simply the monetary cost, but the fact that the money was being spent<br />
on an individual and not the community. This posed a problem for those whose values included putting the whānau<br />
ahead of themselves.<br />
“Basically it’s my kids, my family. I look at them first before myself.” (Waikato)<br />
“<strong>He</strong>’s thinking of money and stuff. <strong>He</strong> would rather put that money aside for when we go to the<br />
doctors, or when we need something done to us. <strong>He</strong>’s thinking, I’m already a man, so I should be<br />
looking out for us.” (Christchurch Rangatahi)<br />
Spending money on their own health care was akin to drawing too much attention to themselves.<br />
Shyness and privacy<br />
Hui participants described different cultural norms regarding privacy that inhibit some Māori and prevent them from<br />
seeking help a doctor.<br />
“I won’t go and see a doctor. I’m too shy. I’m too shy to see a doctor and have him touching me.”<br />
(Waikato)<br />
“If you have a personal problem to do with a private part of your body, you’re not going to go.<br />
You don’t want to do that.” (Hawkes Bay hauā)<br />
“The other thing with us, I think, as kaumātua, we’re still at that stage where we don’t like<br />
standing there getting undressed in front of the men, if you like. That’s a very sacred thing still to<br />
us and to all of our people, regardless of whether we are men or women. We don’t like standing<br />
there. It doesn’t matter how many babies we’ve had, we’re still like that.” (Christchurch)<br />
For some Māori this desire to keep personal things private extended to a general avoidance of doctors because they<br />
themselves did not want to know that they might be ill.<br />
“If you go to the doctor, they’re going to say something is wrong with you, and you didn’t<br />
even know you had it. That’s what my mum has always said, and that’s why she hates going.”<br />
(Christchurch Rangatahi)<br />
While this section has been included as part of the patients’ beliefs and preferences, it also reflects on the health<br />
organisation and human resources. More Māori staff would facilitate access for Māori with issues of shyness and privacy.<br />
In addition, good communication and relationship building on the part of non-Māori staff may also facilitate access.<br />
Accessing services<br />
Sometimes the cost of going to see a doctor was off-set by the need for participants to ensure that their<br />
employment was not put at risk because they were sick or injured.<br />
“My biggest [concern] is that I’ve got [to get] basically a letter to say to my employer, I’ve done<br />
the legal side of it, I’m allowed these days. That’s safeguarding my job. That’s the biggest thing<br />
for me, just taking time off when you are sick.” (Waikato)<br />
Some participants felt that the health care they were receiving was appropriate.<br />
“I come from a family that never had a doctor on [a named small] Island… Everyone lived and we<br />
used Māori medicine. Since [then] I’ve had a double bypass. I take 14 tablets a day, and I listen<br />
to that doctor. Whether it’s transitional, or whatever it is, we have the best of two worlds. Our<br />
people should have the best of both worlds.” (Waikato)<br />
48 | <strong>He</strong> <strong>Ritenga</strong> <strong>Whakaaro</strong>: Māori experiences of health services
Ngā Tukunga Iho o Ngā Hui – Hui Findings 4<br />
And one participant suggested that a ‘mind shift’ was needed whereby Māori would know that they had the right to<br />
access health services when they were needed, rather than ‘waiting to see’.<br />
“I think a mind shift, or an attitude shift, that Māori have the right to go in straight away. We<br />
don’t have to go, ‘Oh, it’s only us and there will be someone more important or something more<br />
important.’ It’s an entire mind shift that if there’s the slightest thing wrong we deserve to have<br />
the best service and rightly.” (Christchurch)<br />
4.2 Participant Experiences at Hospital, Including A&E<br />
Hui participants’ experiences at hospital, including A&E, were largely connected with the behaviour and attitudes<br />
of hospital staff. While participants voiced their concerns about hospital waiting times, particularly in A&E, they<br />
also noted that they wanted to be told why they were waiting and when they would be seen. Poor communication<br />
was a more general issue for those participants with disabilities, who reported that they were often treated like they<br />
were children. When participants perceived that health care was being delivered in a respectful way, and when<br />
communication was good, participants reported that they felt more comfortable in a hospital setting. These themes<br />
are explored below.<br />
4.2.1 <strong>He</strong>alth Organisation<br />
Hui participants reported a number of organisational barriers related to hospital care, including location, waiting<br />
time, and service delivery:<br />
“We used to live in Turangi, and there’s nothing. We had to move down to Wellington for<br />
everything. There’s just nothing up there. The nearest hospital was Rotorua.” (Wellington)<br />
“I went to the hospital when I broke my arm, nearly three Christmases ago, and I had to wait for<br />
an operation for three or four days, because it was Christmas. There was a minimum of staff.”<br />
(Auckland)<br />
Participants noted the lack of capacity within hospitals. For some this meant that they had to care for whānau<br />
members themselves rather than relying on staff.<br />
“If my sister hadn’t have been at that hospital with me, there are lots of things, like getting to the<br />
toilet, getting to the shower, [that wouldn’t have happened]. She had to do all of that. The nurses<br />
came and thanked her and said that they were so short-handed.” (Hawkes Bay hauā)<br />
Sometimes participants described how they had to wait for health care to be provided, not wishing to complain in<br />
case future care was compromised.<br />
“They asked for the nurse to go and change her dressing. That nurse went out and never came<br />
back for eight hours. I stayed up there all the time. When that sort of thing happens, we don’t<br />
want to go and complain, as we’re frightened that it might get worse.” (Waikato)<br />
Waiting times were frequently cited in the hui as a major barrier at the A&E.<br />
“This was in the ambulance, mind you, and they said, ‘She’s got to wait out here.’ I thought<br />
to myself, I’m not going to wait out there in the waiting room. I said, ‘When you come in, it’s<br />
an emergency thing, and you have to be seen straightaway.’ Well, that was when I had to wait<br />
around for about eight hours before I went to the actual unit. I thought, why should I have to wait<br />
for that time?” (Hawkes Bay hauā)<br />
<strong>He</strong> <strong>Ritenga</strong> <strong>Whakaaro</strong>: Māori experiences of health services | 49
4 Ngā Tukunga Iho o Ngā Hui – Hui Findings<br />
“Down in Otago I used to play rugby as well. Even if you did play rugby, and you got injured, you<br />
really didn’t want to go to the A&E Clinic, because you’d sit for hours and hours.” (Christchurch<br />
Rangatahi)<br />
“I took him up to the hospital. I handed over the letter which I was given by the doctor. I waited<br />
and waited and waited. It got to lunchtime, and I waited and waited. My dad was getting tired.<br />
I went back to them and said, ‘My dad is really tired, and I’m sick, and I want to go home.’ They<br />
said, ‘Just wait’.” (Hawkes Bay hauā)<br />
4.2.2 Human Resources<br />
Disrespect and communication were closely linked in hui participants’ discussion of their experiences of hospital<br />
care. Merely being Māori and/or engaging in Māori cultural practices, such as having whānau accompany a patient,<br />
were seen as engendering disrespect from health professionals. Participants also raised issues about the clinical<br />
skills of hospital staff.<br />
Disrespect<br />
Participants felt that being talked about, rather than being talked to, by health professionals was disrespectful.<br />
“I went through that hospital system just like I was a box, or a letter with a stamp on having to<br />
go through as a letter being posted, you know? People talked about me, not to me. These very<br />
bright, intelligent, and capable people talked about me.” (Hawkes Bay hauā)<br />
And a rangatahi participant felt that he should have been treated more kindly when he needed stitches, rather than<br />
what he perceived as his ‘rough’ treatment as ‘just another drunk’.<br />
“I was out of town, and I fell over on a piece of glass. I cut my hand open. I needed stitches, so<br />
I went to the hospital. I was intoxicated, but not abusive or anything of that sort. The way the<br />
nurse treated me, she was so rough. She was like, just another drunk, blah blah blah. She was<br />
really rough. It wasn’t very nice. She was like, ‘Have you had your tetanus?’ I was like, ‘I can’t<br />
remember.’ She was like, ‘Oh.’ And throws it into my arm, really rough. I wasn’t impressed.”<br />
(Christchurch Rangatahi)<br />
Communication<br />
There was a perception of poor communication and uncaring attitudes among hospital staff.<br />
“The doctor came in. <strong>He</strong> said, ‘Okay, this is what’s wrong with you.’ I could see these photos, and obviously that’s<br />
my body. I was like, ‘What’s that?’ <strong>He</strong> said, ‘You don’t really need to worry about that.’ I was really, really angry. My<br />
sister had trained to be a nurse for awhile, and she was trying to ask questions. <strong>He</strong> was there for about five minutes,<br />
and he said, ‘I want you to take these.’ <strong>He</strong> wrote out a prescription and I was like in shock.” (Christchurch)<br />
Poor communication was a barrier at the A&E as well.<br />
“The thing is, when you get the service, it’s usually good, but there is no one communicating<br />
with you during the time you’re waiting. It’s not like ‘you’re next in line’ or ‘there are a few more<br />
people before you’. That was really frustrating.” (Christchurch Rangatahi)<br />
“Problems [exist] for deaf people when they go to emergency services. They have trouble<br />
communicating.” (Wellington)<br />
Patients with disabilities also reported frustrations with the healthcare system, often related to issues of<br />
communication and a lack of respect for those with disabilities.<br />
50 | <strong>He</strong> <strong>Ritenga</strong> <strong>Whakaaro</strong>: Māori experiences of health services
Ngā Tukunga Iho o Ngā Hui – Hui Findings 4<br />
“<strong>Doctor</strong>s and nurses need to know how to communicate with deaf patients.” (Wellington)<br />
“They’re only about four feet away from me. I said, ‘<strong>He</strong>y, are you talking to me or about me?’<br />
This sort of stuff. Because you are blind, you are dumb, you are thick. You get treated like that.”<br />
(Hawkes Bay hauā)<br />
“They talk to us like we’re simple minded. We’re very intelligent people.” (Hawkes Bay hauā)<br />
“I’ve had doctors that have treated me like a little child because of my disability, and that’s not<br />
always easy [to endure]. Once I had a Pākehā doctor who gave me an injection. She said, ‘This<br />
will be stingy, stingy, hurty, hurty.’ She treated me like a little baby.” (Auckland)<br />
“Some talk down to you, people do talk down to you because they don’t understand that you<br />
might know more than they think you know. You get treated like a child, rather than an adult. You<br />
might behave like a child for that reason. It’s just very hard some of the time.” (Auckland)<br />
Sometimes hui participants associated this poor communication with the cultural differences between themselves<br />
and hospital staff.<br />
“My father was in the [local] Hospital, and it’s hard for Pākehā to relate to Māori needs.”<br />
(Waikato)<br />
“There is a change in ethnicities. We have a lot of Asians coming over. They are totally different<br />
to us. Their ways and mannerisms are totally different. Some of those people have senior<br />
positions.” (Waikato)<br />
When good communication exists within a hospital setting, a strong relationship can develop.<br />
“They make people comfortable. They explain what your injury is about, how you did it, how they<br />
can work with it and stuff. They don’t get too close too fast. Like say you’ve got something on<br />
you, they don’t start examining you straightaway. They ask you to explain instead of just saying,<br />
‘Let’s have a look’ and getting straight into it.” (Auckland Rangatahi)<br />
“They checked up on me regularly. I just came to expect that. I knew they knew what they were<br />
doing. They would wake me up in the middle of the night, but I knew they had to do their job… It<br />
was good.” (Christchurch Rangatahi)<br />
“It was all right because I had my family there, my whānau was there. It was sweet because my<br />
mother was always there all the time, and my brother. There were family and friends coming in. I<br />
had a good support base. The nurses and the doctors were good.” (Christchurch Rangatahi)<br />
Good communication and care did not always necessarily mean that all a patient’s concerns were taken care of in an<br />
appropriate fashion. Sometimes patients still missed out on health care information.<br />
“I went through the cancer, and I was treated actually quite good. One thing where they went<br />
kind of wrong, they didn’t educate me on the different sorts, where the public health could pay<br />
you for. I was supposed to get all of my teeth done. I paid it through my own pocket, and there<br />
was a free dental clinic up there.” (Waikato)<br />
<strong>He</strong> <strong>Ritenga</strong> <strong>Whakaaro</strong>: Māori experiences of health services | 51
4 Ngā Tukunga Iho o Ngā Hui – Hui Findings<br />
Clinical skills<br />
Sometimes the clinical skills of staff were questioned because of participants’ experiences.<br />
“I had to go to the hospital for a blood test, and the nurse stuck it in my arm, and she goes, ‘Sorry,<br />
love, I’ve just missed the vein.” She took it out and put it back in again. She was rattling it around.<br />
She was going, ‘Hang on, it’s around here somewhere.’ I was like, ‘Come on, hurry up,’ and she<br />
took it out. On about the fifth time, she finally got the vein.” (Christchurch Rangatahi)<br />
4.2.3 Patient - Community<br />
There was not much comment about patient or community attitudes and values as a barrier to hospital care. Participants<br />
did talk about people being scared of going into hospital because it was seen as a place where people died.<br />
“Our people are so frightened of going into doctors and so frightened of going into the hospital,<br />
that they are frightened they won’t come out.” (Waikato)<br />
Sometimes within the hospital the poor communication and lack of respect from health professionals was met by<br />
silence from Māori. Participants felt that Māori ‘clam up’ when they are not being listened to.<br />
“If we haven’t got the confidence in what they’re saying, we’re not going to say anything. Even in<br />
the hospital, when the doctors talk to us, we clam up. Well, I do. I‘m not going to tell you all this,<br />
because you’re really not listening to me. You only want to hear what you want to hear. I’m not<br />
going to tell you anymore. We [Māori] clam up a lot, we really do.” (Christchurch)<br />
4.3 Participants’ Experiences with ACC<br />
Communication was the main issue that hui participants identified about ACC. There was a perception that<br />
ACC was reluctant to tell participants what they were entitled to, that what information was provided was not<br />
understandable, and that eligibility to entitlements was often a mystery. These issues are elaborated below.<br />
4.3.1 Organisation<br />
Two organisational issues were raised by participants: the lack of Māori staff at ACC, and information not being<br />
understandable.<br />
Workforce composition<br />
Participants with experience of ACC, often over a number of years, noted the lack of Māori staff within the<br />
organisation.<br />
“In regard to Māori case managers, over the years we’ve seen out of, say, 30, we will have two<br />
Māori.” (Waikato)<br />
Information<br />
Participants complained that, even when ACC information is presented, it is often not understandable.<br />
“Half the booklets that are out there, instead of sticking to the facts of what people want to know,<br />
you get a lot of booklets that have big long write-ups of each thing. People that aren’t good<br />
at reading and writing, they can’t understand. They look at it and don’t bother straightaway.”<br />
(Wellington)<br />
“Things have to be done in simpler form too, in that respect… so that our people understand.”<br />
(Christchurch)<br />
52 | <strong>He</strong> <strong>Ritenga</strong> <strong>Whakaaro</strong>: Māori experiences of health services
Ngā Tukunga Iho o Ngā Hui – Hui Findings 4<br />
4.3.2 Human Resources<br />
Communication<br />
Communication problems, compounded by lack of understanding about Māori culture, were often cited by hui<br />
participants as problems with ACC and other funding bodies resulting in the under-utilisation of these services by Māori.<br />
“ACC has all this information. The onus is on them to get it out to the people, not on us to tell<br />
people [at ACC what we need]. Why should we have to? They’re the ones who have the money.<br />
It’s their onus. It’s their baby. It’s that minister that should send that information down to us. Why<br />
is that not happening? Why isn’t that happening?” (Waikato)<br />
“They’re not going to tell you what you’re entitled to.” (Waikato)<br />
“My doctor didn’t say to me, ‘Fill a form in for ACC.’ I don’t know nothing.” (Hawkes Bay hauā)<br />
“They knew nothing about if you were working, you can get your wages compensated. Our men<br />
were just going to go on the sickness benefit.” (Waikato)<br />
Sometimes participants’ complaints about ACC were related to difficulties they had had getting ACC to respond to<br />
the issues they were experiencing.<br />
“The ACC went back on everything we asked them about. They don’t tell you anything, you’ve<br />
got to ask. That’s what the worst problem is.” (Wellington)<br />
“Everybody out there, especially ACC, they said we can’t help [your young son]. [<strong>He</strong> had] no<br />
physical injuries, but he suffered more than me. There was nobody out there that could direct us<br />
to any place that could help him. It took 12 months before we actually found a Māori facilitator<br />
that would do it for nothing.” (Waikato)<br />
Having the role of support people questioned was also seen as disrespectful.<br />
“<strong>Doctor</strong>s frown upon [bringing in the whānau], certainly ACC [does]… They frown upon the fact<br />
that we’ve got the whole whānau here. ‘This is a bit rough; we can’t have that.’ I’m saying that I<br />
would see very much the need for, it’s not intervention, but a support person being involved.”<br />
(Hawkes Bay hauā)<br />
4.3.3 Patient - Community<br />
Some participants emphasised that Māori behaviours could change as well. That is, Māori had to be less reluctant<br />
about asking for help.<br />
“What our Pākehā counterparts did [was to ask], ‘Have you got the ACC papers?’ because the<br />
Pākehā doctors would tell them. Our people are too shy, our nannies are too shy to talk about<br />
that. It’s our generation, we have to awhi [help] them, to teach them, plus our kids.” (Waikato)<br />
“It’s only the squeaky wheel that gets the oil. That’s what we have to be. We just can’t be too<br />
proud.” (Waikato)<br />
<strong>He</strong> <strong>Ritenga</strong> <strong>Whakaaro</strong>: Māori experiences of health services | 53
4 Ngā Tukunga Iho o Ngā Hui – Hui Findings<br />
4.4 Patient Experiences with Other <strong>He</strong>alth Services<br />
Hui participants also commented about other health services they had received or were receiving. The complaints<br />
that participants had about other services were often related to the support services they were receiving<br />
because of their health or disability. Participants were concerned about people not doing their job properly (e.g.,<br />
housecleaning) and about staff turnover that meant that they often lost the services of good people.<br />
4.4.1 Organisation<br />
Several participants mentioned the lack of Māori staff as a problem. Expectations of, or requests for, Māori staff<br />
could often not be met by organisations and sometimes even ‘knowledgeable’ Pākehā were not appropriate service<br />
providers for Māori.<br />
“They bring a Pākehā woman with them. The old [Māori] lady wouldn’t undress, wouldn’t<br />
undress. A Māori woman, kei te pai, take off her clothes, no trouble. Pākehā woman, very<br />
knowledgeable Pākehā woman. She had years in the nursing profession and you couldn’t get a<br />
better person with the knowledge. They never got to first base, never. The old lady just would<br />
not take her clothes off in front of the Pākehā woman.” (Waikato)<br />
“I had these people twice turn up on my doorstep. Now I was a bit confused, because one of<br />
them was an occupational therapist, and the other was a driving instructor. I was expecting a<br />
couple of Māori to come around.” (Waikato)<br />
“For two years, I asked for a Māori careers officer to help me plan my future for where I am right<br />
now. Two years ago, I asked for it. They only gave it to me last month. They’re saying, ‘Oh, we<br />
didn’t know we had one.’” (Waikato)<br />
Turnover of staff was a problem for some participants as it often meant starting over again to build a relationship<br />
with the new person who may or may not know what they are doing.<br />
“A client gets used to how they want to be dressed, and then someone [new] comes along and<br />
okay, they might start putting the socks and slippers on first, and the rest of the body has got<br />
nothing on… Everyone is different in the way they work.” (Wellington)<br />
“The only way she got to know me was having huis at home and to actually see my injuries and to<br />
feel. She actually had a heart, she had a heart. She went out of her way to try and help me. Once<br />
that was starting to happen for me, she got changed, and I got this dick who said it’s just like<br />
having a baby.” (Waikato)<br />
Problems related to having to wait for a service or to fill in too many forms in order to receive a service, were also<br />
evident. These often led to participants not using services.<br />
“<strong>He</strong>’s had to wait for ages before he could claim with ACC. <strong>He</strong> had to go in and get quotes and<br />
stuff and then ACC have to come back and say yes or no. Sometimes it can take longer, and you’d<br />
rather pay for it yourself and not wait.” (Christchurch Rangatahi)<br />
“We just filled out the same thing everywhere we went. I filled out everything that was wrong<br />
with my shoulder and then when I went to the physio, I did it again.” (Christchurch Rangatahi)<br />
54 | <strong>He</strong> <strong>Ritenga</strong> <strong>Whakaaro</strong>: Māori experiences of health services
Ngā Tukunga Iho o Ngā Hui – Hui Findings 4<br />
4.4.2 Human Resources<br />
Many hui participants reported good experiences with (often specialised) service providers. These good<br />
experiences were linked with both good communication and good health care provision.<br />
“She’s someone I could talk to and she made me feel better. When I get injured again, I’ll<br />
definitely be going to Sports Med. They specialise in what they do. They make you feel like they<br />
know what they’re talking about.” (Christchurch Rangatahi)<br />
“They put me on this treadmill and said straightaway that it was cartilage. They took x-rays and in<br />
that five years before, no one had taken an x-ray. It was cartilage the whole time. It was five years<br />
with pain.” (Christchurch Rangatahi)<br />
Others participants were of the opinion that good service depended very much on the individual providing it.<br />
“There are physios that are really, really good, and there are others that aren’t so good. It<br />
depends on who you go to.” (Auckland)<br />
“Rehabilitation, they’ve got their own codes of rehabilitation, and it’s got to be done their way.<br />
They don’t understand that we’re independent people, and we want to do it how we want to do<br />
it. Nobody can understand what pain, what level of rehabilitation we can go through.” (Waikato)<br />
“[The housekeepers] shouldn’t be asking me [questions] every five minutes. Look, people are<br />
using the scrubbing brush for the toilet in the bathtub. That’s not me, that’s not Māori or Pākehā.<br />
And that’s what I said to her, ‘Where’s the hygiene? Aren’t you guys teaching these people how<br />
to do their work?’” (Wellington)<br />
4.5 Patient Experiences with Funding Bodies<br />
As with other services, participants felt that there was bias and malfeasance at the funding bodies, which made the<br />
participants less likely to seek their services. Participants’ views were that these organisations went to great lengths<br />
not to provide services; that Māori were particularly disadvantaged by racism and (for some Māori) by their own<br />
shyness; and that people needed to start demanding their entitlements from these funding bodies.<br />
4.5.1 Organisation<br />
Explanations for the denial of service often revolved around the motivation services had for saving money. Money<br />
saved was seen by participants as, for example, payable as bonuses to staff responsible for the savings or used to<br />
fund overseas trips for staff.<br />
“They don’t give you any money, and that person [at the funding body] gets a bonus. I think<br />
that is why they tell you nothing. At the end of the day, or at the end of the year, there is<br />
supplementary money inside their pocket, and that will justify that the money is not being used<br />
for people like us.” (Waikato)<br />
“They are trying to save money for themselves so that they can go on trips overseas.” (Waikato)<br />
Participants also reported that their access to services varied according to the staff who were involved. A different<br />
doctor or case worker would mean different answers or advice, often leaving the participants with a feeling that<br />
they were getting the run-around from services.<br />
<strong>He</strong> <strong>Ritenga</strong> <strong>Whakaaro</strong>: Māori experiences of health services | 55
4 Ngā Tukunga Iho o Ngā Hui – Hui Findings<br />
“I have been pillar to post with doctors, WINZ. <strong>Doctor</strong> wants him on sickness benefit, [but] the<br />
doctors keep changing. I have been to three or four doctors. They can’t make up their mind<br />
which illness, and WINZ won’t pay a benefit until they know which illness.” (East Cape)<br />
“In terms of service that’s available and how service is received, it varies almost from man to<br />
woman, woman to man, from whoever is on the other side of that desk. The next person that<br />
comes along will give a different answer. This is from ACC to WINZ, to hospital admissions, to<br />
patient treatment and care, and the like.” (Hawkes Bay hauā)<br />
“It was the same sort of thing: she’s had five different case workers. You would talk to one and<br />
start to get things moving, and then they would change to another one. We would have to talk to<br />
another one. Things were going around and around in circles for a few years.” (Waikato)<br />
This perception of a ‘run-around’ was also experienced by participants in relation to accessing information and<br />
having to provide certain information to a service.<br />
“Trying to access things for me that I really needed took ages. It took ages for me to find out<br />
how I could get all of these resources. Not even the social workers knew how to go about it.”<br />
(Waikato)<br />
“Food needs to get on the table, and you’re delayed a week just running around and getting<br />
information. ‘Oh, no, you need to see this doctor to get that, sir.’ I mean, that’s just my<br />
impression. I don’t go to the doctor that often; well, I try not to.” (Waikato)<br />
The overall impression hui participants had was of services that did not want to provide benefits or services to<br />
people, so that people had to literally plead for help.<br />
“They have got to be more transparent, more open, more giving. At the moment, they’re like this<br />
locked up, you can’t get anything. We’re standing here like this, please, please, please, begging.”<br />
(Waikato)<br />
4.5.2 Human Resources<br />
One participant offered the following hypothetical conversation to describe their perception that (1) non-Māori<br />
are more familiar with what services are available to them, (2) non-Māori are more forceful about demanding those<br />
entitlements and (3) that staff at funding bodies go out of their way to provide services to Pākehā (‘Mrs Smith’), but<br />
tend to stonewall Māori (‘Mrs Tupaki’).<br />
“How many of us have gone to WINZ and said, ‘Is there any way that you can help with this and<br />
that?’ ‘I’m sorry, Mrs Tupaki. No, we can’t, but it was nice of you to ask anyway.’ Now Mrs Smith<br />
comes along and Mrs Smith says, ‘I understand that I’m entitled to such and such a benefit to add<br />
to my benefit to buy myself a washing machine. I’ve broken mine and can’t afford another one.’<br />
‘Oh, certainly, Mrs Smith!’” (Hawkes Bay hauā)<br />
Other participants also suspected that the service they were receiving was less than what a Pākehā person in the<br />
same position would receive.<br />
“You see, my concern as a Māori is that if he was Pākehā, would he have that knowledge that<br />
there was dental treatment? That’s what really gets me going. Would he, if he was Pākehā, what<br />
are the chances that he would have been empowered with that knowledge?” (Waikato)<br />
56 | <strong>He</strong> <strong>Ritenga</strong> <strong>Whakaaro</strong>: Māori experiences of health services
Ngā Tukunga Iho o Ngā Hui – Hui Findings 4<br />
4.5.3 Patient - Community<br />
Cultural differences in communication and behaviour were cited by hui participants as a reason for some Māori not<br />
accessing services.<br />
“[Māori] won’t ask them to explain it to them, because they think they will then sound dumb.”<br />
(Christchurch)<br />
“Our people don’t know how to express themselves. They get very shy and they don’t know how<br />
to communicate to the ACC. You walk into the office, and you know they are very well dressed.<br />
People like our people, they are dressed casually and feel intimidated.” (Waikato)<br />
“Too whakamā. What they don’t know, they won’t ask. It’s a knowledge thing. Also [we’re]<br />
brought up to think whānau will look after us.” (East Cape)<br />
Some participants encouraged people to find out what they were entitled to and then to demand this for the<br />
services they were seeing.<br />
“Everyone can go in there [to WINZ] and demand, but they need to do their homework first<br />
before they demand. You walk into WINZ, the brochures are there. A lot don’t read those on<br />
what they can and can’t do.” (Waikato)<br />
“I’m a solo parent on the DPB. WINZ has a lot of benefits for me that I don’t know about. Because<br />
they don’t tell me about it, I will go and find out. I won’t sit there and be whakamā and waikore. I<br />
will go and find out. I won’t wait for someone to tell me.”<br />
“You find with the younger generation, they do know how to access Māori services and<br />
everything, whereas the older generation don’t. The younger generation do to a certain extent.”<br />
(Wellington)<br />
4.6 Discussion<br />
Hui to discuss Māori experiences of health and disability services were organised in conjunction with local<br />
communities that had been provided with information about the present research. While hui are the Māori way<br />
to meet and discuss ideas, they also serve to allay suspicion about the research. Particular attention was paid to<br />
ensuring the use of culturally appropriate approaches and language at the hui. Overall the approach taken helped<br />
maximise Māori participation; Māori came to the hui and talked openly about their experiences and opinions.<br />
The hui reported that costs were greater for those with health problems who also have disabilities. Participants<br />
reported that providers are more likely to talk ‘down’ to these patients. In addition, these patients belong to another<br />
culture (e.g., deaf culture as well as Māori) with specific needs and preferences, but most services are not suited to<br />
the needs of hunga hauā (location, service arrangements, physical barriers, etc.).<br />
The hui revealed that barriers to use of services by Māori differed by the type of service, but there was a great<br />
deal of overlap. This discussion touches upon three main barriers identified by hui participants: the ‘cost’ of health<br />
services, health professionals’ engagement with Māori, and the prior experiences Māori have had of health services<br />
that influence and inform their expectations.<br />
Following on from this some of the limitations of the hui research are explored, leading into the next chapter on the<br />
quantitative survey.<br />
<strong>He</strong> <strong>Ritenga</strong> <strong>Whakaaro</strong>: Māori experiences of health services | 57
4 Ngā Tukunga Iho o Ngā Hui – Hui Findings<br />
4.6.1 ‘Cost’<br />
Unsurprisingly, given the disproportionately high levels of deprivation in the Māori community, financial<br />
considerations loomed large for most participants. Related issues of access (waiting time, travel distance,<br />
inconvenient appointment times) were also mentioned repeatedly. Systems and policies of the services were<br />
also perceived as unsuitable or unfriendly by many hui participants, who cited impersonal and disempowering<br />
environments as well as inflexible bureaucracies.<br />
‘Cost’ refers to the larger issue of ‘perceived value’, which includes both financial and non-financial considerations.<br />
Monetary considerations will frequently be an important factor for Māori, as Māori are over-represented in lower<br />
socio-economic groups. The availability of lower cost primary care services does not appear to have eliminated this<br />
concern. This may indicate that even when out-of-pocket costs are reduced or eradicated, ‘cost’ remains a concern and<br />
thus is used broadly by patients to encompass fees paid to providers (GPs and physios for example), follow-on costs<br />
(prescriptions, for example), non-treatment costs (time off work, child care), and the question of value for money.<br />
For this reason, it is important to realise that ‘cost’ relates not just to the amount of money needed to see a<br />
general practitioner, but to a perception that the effort required (financial effort, time commitment, associated<br />
inconveniences, etc.) to access or use the service outweighs its potential benefits. Other ‘costs’ include: difficulty<br />
arranging transportation to a healthcare provider (including bus fare, securing time off work and its concomitant<br />
reduction in income, affording the cost of gas, etc.), struggling to make an appointment (due to unwieldy clinic<br />
procedures, lack of a home telephone, or language differences), needing to arrange alternate child or elder care,<br />
costs of follow-up or follow-on needs such as medicines, x-rays or allied health visits, waiting times (an often<br />
unpredictable period) to see the clinician, and lost (or delayed) wages. It is the consideration of all these issues,<br />
together with the other barriers associated with health visits (see below), that leads Māori healthcare consumers<br />
(like other healthcare consumers) to assess the overall value (or ‘cost’) of a visit.<br />
4.6.2 <strong>He</strong>alth Professionals<br />
<strong>He</strong>alth and disability service providers were also mentioned as contributing to the problem of access, through<br />
behaviour that was perceived to range from uninformed to disrespectful to racist. Many hui participants felt that<br />
service providers generally do not provide the same quality or level of care to Māori as to non-Māori, in part<br />
because of different cultural mores. Māori participants reported that providers lacked respect and understanding<br />
and did not listen to them. All of this is in keeping with McCreanor and Nairn’s (2002) findings about non-Māori GPs<br />
perceptions of their Māori patients. Providers’ poor communication skills were mentioned repeatedly and included<br />
inconsistent explanations as well as a lack of awareness and understanding about Māori culture and values.<br />
As noted in the literature review, communication skills have an enormous impact on healthcare satisfaction and<br />
treatment effectiveness. Good communication skills help to strengthen the relationships between providers<br />
and patients, increase mutual trust and respect, impact health outcomes (including adherence to therapy and<br />
physiological measures such as perceived pain, blood pressure, and blood glucose levels), as well as potentially<br />
reducing patient complaints (Cross et al 1989; Isaacs & Benjamin 1991). Where the provider and the patient do not<br />
share a common cultural background, there are increased difficulties in establishing effective communication and<br />
productive relationships (Cross et al 1989; Isaacs & Benjamin 1991; Penn et al 1995). In <strong>New</strong> <strong>Zealand</strong>, the majority<br />
of healthcare interactions for Māori patients do not involve clinicians from the same cultural background. There is<br />
therefore great potential for misunderstandings and reduced effectiveness (Cram et al 2003; Jansen 1998). This is a<br />
particular problem for Māori with disabilities, such as Māori deaf.<br />
Many hui participants described their belief that certain attitudes that make it difficult to obtain care are more<br />
prevalent among Māori. These range from a more resigned approach to illness, a greater concern for privacy, a<br />
reluctance to put one’s own needs ahead of others, and a mistrust of the overwhelmingly non-Māori healthcare<br />
system. In addition, many hui participants repeatedly expressed a conviction that some Māori have a culturallybased<br />
reluctance to ask for information, to question a doctor’s diagnosis or treatment, or to be forceful when having<br />
difficulty with ACC.<br />
From a Māori point of view, this attitude may be viewed as manuhiri– which is appropriate behaviour when<br />
interacting with unknown people in a new environment – or to be noho whakaiti – which is to be appropriately<br />
58 | <strong>He</strong> <strong>Ritenga</strong> <strong>Whakaaro</strong>: Māori experiences of health services
Ngā Tukunga Iho o Ngā Hui – Hui Findings 4<br />
quiet and watchful when in the presence of someone of higher status. Quiet listening in this context demonstrates<br />
respect. Hui participants argued that these behaviours (to be manuhiri and to be noho whakaiti) may be both<br />
normal and polite for many Māori, but can be a source of misunderstanding for non-Māori clinicians. This in turn<br />
can lead to confusion and miscommunication, as documented in other comments made at the hui about providers’<br />
lack of knowledge of Māori culture and lack of respect for Māori patients.<br />
There was also some overlap between the issue of being ‘too shy’ and that of a lack of ‘cultural fit’. For some hui<br />
participants behaviours such as accepting all treatment advice without question and being reluctant to engage<br />
in self-advocacy were seen as a shortcoming of the patient (too shy), while other hui members clearly described<br />
the same actions as appropriate patient behaviour that was misinterpreted by a culturally incompetent provider<br />
(manuhiri: acting as a visitor and waiting to be invited to participate fully in the consultation).<br />
4.6.3 Prior experiences<br />
For any patient, past experience will influence current and future healthcare interactions (Bryant & Campbell 1996;<br />
Cram et al 2003; <strong>He</strong>alth Waikato 2001). Perceptions of health services will also be shaped through community<br />
experiences and the media. All patients, including Māori and their whānau, will have expectations and perceptions<br />
of care that are formed from these collective experiences. Some patients reported repeated bad experiences as<br />
they progressed through the healthcare system from primary and pre-primary interactions through secondary<br />
and referred services to tertiary services and those involving return to the community, community placement or<br />
support services. Many Māori involved in the hui reported an expectation that care will be provided to them at a<br />
lesser quality, of a lesser intensity and by people who are either disrespectful, do not understand Māori or provide<br />
understandable information to Māori.<br />
It was clear that all of these factors contribute to a reluctance among Māori (and presumably other groups, including<br />
those with limited financial resource and those with disabilities) to utilise healthcare unless the illness or injury<br />
grows more serious. A significant insight from the hui was the perception that as people progressed through<br />
the healthcare system, barriers to care were actually multiplied and loomed larger. This relates to the number<br />
and complexity of interactions with providers. The hui also highlighted that for many Māori there was a complex<br />
interplay between the barriers and their expectations of care, and that this impacts on both pre-visit and post-visit<br />
intentions.<br />
4.6.4 Study Limitations<br />
As with any study, there are limitations to this analysis that restrict the ability to generalise from the findings. When<br />
reading the sections on the qualitative aspects of this research it is important to keep in mind that it is an account<br />
of the experiences of Māori who participated in focus groups (hui) conducted by the research team. While a wide<br />
range of Māori participated in those hui the research does not represent the views of all Māori. We actively sought a<br />
diversity of views and, as a result, we believe the insights and perspectives expressed by hui participants reflect the<br />
barriers to healthcare access for most Māori.<br />
4.6.5 Future Research<br />
The most immediate influence of the hui findings on research was in the development of a survey questionnaire<br />
on Māori use and experience of health and disability services (see next chapter). Many of the findings from the hui<br />
reiterated and expanded upon previous research on barriers to health care for Māori. While socio-economic factors<br />
were less stressed, issues around ‘value for money’ and the clinical skills of health workers were more to the fore.<br />
Future research exploring how Māori judge ‘value’ and ‘skill’ may help Māori in assessing and providing feedback<br />
about their healthcare.<br />
<strong>He</strong> <strong>Ritenga</strong> <strong>Whakaaro</strong>: Māori experiences of health services | 59
5 Ngā Tukunga Iho o Ngā Rārangi Uiui – Survey Findings<br />
5.1 <strong>He</strong>alth Status<br />
Over half of the respondents reported that they had no health or physical conditions that required on-going<br />
treatment (N=354, 54.4%). (Table 10) Nearly a quarter of the respondents had a health condition(s) that required<br />
on-going treatment (N=154, 23.7%), of which the most common was a chronic illness such as asthma or diabetes.<br />
The remainder of the respondents who answered this question had a physical (e.g., loss of limb) (N=69, 10.6%), or<br />
sensory (e.g., deafness, blindness) condition (N=64, 9.8%), or a mental or intellectual disability (N=8, 1.2%). Two<br />
respondents refused to answer this question.<br />
Table 10. Current health status<br />
<strong>He</strong>alth or physical conditions that require on-going treatment N %<br />
No condition 354 54.4<br />
<strong>He</strong>alth condition e.g., asthma, diabetes 154 23.7<br />
Physical e.g., lost a limb, polio 69 10.6<br />
Sensory e.g., sight or hearing disability 64 9.8<br />
Mental or intellectual disability 8 1.2<br />
Don’t know/Refused 2 0.3<br />
Total 651 100.0<br />
5.2 Service Utilisation<br />
In the six months prior to being surveyed, most of the respondents (94.2%, N=613) had visited their GP (Table 11).<br />
In addition, 21.8% (N=142) of the respondents had visited an A&E, 31.3% (N=204) reported a hospital stay, 27.3%<br />
(N=178) had visited a specialist, 15.1% (N=98) had an interaction with a funding body (primarily ACC), and 30%<br />
(N=195) had utilised ‘Other Services’.<br />
Table 11 Number of respondents’ who had used health services in past 6 months, N=651<br />
<strong>He</strong>alth service N %<br />
A GP 613 94.2<br />
A hospital 204 31.3<br />
A specialist 178 27.3<br />
An A&E or A&M 142 21.8<br />
ACC or WINZ 98 15.1<br />
Other services e.g., x-rays, physio 195 30.0<br />
Total 1430<br />
Between 42% and 56% of the visits made to different health services in the past six months were made by<br />
respondents with no ongoing health condition (Table 12, Figure 5). Respondents with chronic health conditions<br />
made between one fifth (to A&E, N=31, 21.8%) and one third (to a Specialist, N=60, 33.7%) of the total visits made<br />
by all respondents to different health services.<br />
60 | <strong>He</strong> <strong>Ritenga</strong> <strong>Whakaaro</strong>: Māori experiences of health services
Ngā Tukunga Iho o Ngā Rārangi Uiui – Survey Findings 5<br />
Table 12. Current health status and services used in past 6 months<br />
<strong>He</strong>alth or physical<br />
conditions that require<br />
on-going treatment<br />
Services been to in past 6 months<br />
GP A&E Hospital Specialist<br />
ACC or<br />
WINZ<br />
Other<br />
services<br />
Number (%) Number (%) Number (%) Number (%) Number (%) Number (%)<br />
No ongoing condition 324 (52.9%) 80 (56.3%) 97 (47.7%) 75 (42.1%) 45 (45.9%) 83 (42.6%)<br />
Chronic health condition 148 (24.1%) 31 (21.8%) 54 (26.5%) 60 (33.7%) 26 (26.5%) 56 (28.7%)<br />
Physical condition 68 (11.1%) 20 (14.1%) 30 (14.7%) 31 (17.4%) 18 (18.4%) 36 (18.5%)<br />
Sensory condition 63 (10.3%) 9 (6.3%) 22 (10.8%) 9 (5.1%) 6 (6.1%) 15 (7.7%)<br />
Mental / intellectual<br />
disability<br />
8 (1.3%) 2 (1.4%) 1 (0.5%) 3 (1.7%) 2 (2.0%) 5 (2.6%)<br />
Don’t know/Refused 2 (0.3%) 0 (0.0%) 0 (0.0%) 0 (0.0%) 1 (1.0%) 0 (0.0%)<br />
Total 613 142 204 178 98 195<br />
Figure 5. Respondents’ health status by service used (%)<br />
<br />
<br />
<br />
<br />
<br />
<br />
<br />
<br />
<br />
<br />
<br />
<br />
<br />
<br />
<br />
<br />
<br />
<br />
<strong>He</strong> <strong>Ritenga</strong> <strong>Whakaaro</strong>: Māori experiences of health services | 61
5 Ngā Tukunga Iho o Ngā Rārangi Uiui – Survey Findings<br />
Across all the health conditions, the most common service visited by respondents was the GP. This ranged from<br />
one-third (N=68, 33.5%, row percentage not shown in Table 12) of all health-related visits to different services made<br />
by those with a physical condition, to one half (N=63, 50.8%) of the visits made by those with a sensory condition<br />
(Figure 6).<br />
Figure 6. Services used by different health groups<br />
<br />
<br />
<br />
<br />
<br />
<br />
<br />
<br />
<br />
<br />
<br />
<br />
<br />
<br />
<br />
<br />
<br />
<br />
<br />
The survey quota system of asking respondents about different healthcare providers resulted in data being<br />
collected on visits to the GP from 77.1% (N=502) of the respondents; visits to hospital from 30.7% (N=200) of<br />
the respondents; visits to a specialist from 26.7% (N=174) of the respondents; visits to A&E from 21.4% (N=139)<br />
of the respondents; visits to ACC from 11.8% (N=77) of the respondents; and visits to other services (e.g.,<br />
physiotherapist, x-rays) from 21.0% (N=137) of the respondents (Table 13).<br />
Table 13. <strong>He</strong>alth services respondents’ surveyed about, N=651.<br />
<strong>He</strong>alth service N %<br />
GP visit 502 77.1<br />
Hospital 200 30.7<br />
Specialist 174 26.7<br />
A&E 139 21.4<br />
ACC 77 11.8<br />
Other services 137 21.0<br />
Total 1229<br />
As described in the survey respondent demographics (see above), most of the respondents chose to answer the<br />
survey on their own behalf (N=553, 84.9%). This was reflected in the survey responses across the different services<br />
(Table 14). Between 74.8% (A&E visits, N=104) and 88.3% (other services visit, N=121) of the responses about the<br />
different services were made by respondents on their own behalf (Table 14). The highest proportion of responses<br />
made on behalf of another person were for A&E services, with respondents answering questions on behalf of a<br />
child or youth (N=24, 17.3% of A&E responses).<br />
62 | <strong>He</strong> <strong>Ritenga</strong> <strong>Whakaaro</strong>: Māori experiences of health services
Ngā Tukunga Iho o Ngā Rārangi Uiui – Survey Findings 5<br />
Table 14. Survey response and services used in past six months<br />
GP visit<br />
Hospital visit<br />
Specialist visit<br />
A&E visit<br />
ACC visit<br />
Other services<br />
Survey responses made on behalf of:<br />
Number<br />
(%)<br />
Number<br />
(%)<br />
Number<br />
(%)<br />
Number<br />
(%)<br />
Number<br />
(%)<br />
Number<br />
(%)<br />
Myself<br />
434<br />
(86.5%)<br />
160<br />
(80.0%)<br />
148<br />
(85.1%)<br />
104<br />
(74.8%)<br />
62<br />
(80.5%)<br />
121<br />
(88.3%)<br />
A child/<br />
youth<br />
54<br />
(10.8%)<br />
28<br />
(14.0%)<br />
16<br />
(9.2%)<br />
24<br />
(17.3%)<br />
7<br />
(9.1%)<br />
10<br />
(7.3%)<br />
An adult/<br />
spouse I<br />
look after<br />
14<br />
(2.8%)<br />
11<br />
(5.5%)<br />
10<br />
(5.7%)<br />
8<br />
(5.8%)<br />
7<br />
(9.1%)<br />
6<br />
(4.4%)<br />
Other<br />
0<br />
(0.0%)<br />
1<br />
(0.5%)<br />
0<br />
(0.0%)<br />
3<br />
(2.2%)<br />
1<br />
(1.3%)<br />
0<br />
(0.0%)<br />
Total<br />
502<br />
200<br />
174<br />
139<br />
77<br />
137<br />
5.3 Feedback on <strong>He</strong>alth Services<br />
This next section provides an overview of respondent feedback on the various health services they were asked<br />
about. A full account of the findings can be found in Appendices D-I. The findings from the modelling of overall<br />
satisfaction and intention to revisit are also summarised here, with the full description of this analysis in Appendix H.<br />
This section concludes with a look at how respondents’ ratings of each service compared (Table 15).<br />
5.3.1 General Practice Visits<br />
Overall, respondents were satisfied with their visits to a GP (Table 15). They reported that they had confidence and<br />
trust in the doctor (92%); that the doctor asked enough questions (87%), explained things well (87%), treated them with<br />
respect (96%), and said their name properly (83%). The majority said that they would see the same doctor again (93%),<br />
and 73% rated their overall satisfaction with the doctor as ‘good’ (on a 3-point scale: ‘good’, ‘average’, ‘poor’).<br />
On the whole, the 36% of the respondents who reported that they had to wait to be seen by a doctor, also reported<br />
that they were not told how long they would have to wait (86% of those who had to wait), or why they had to wait<br />
(84% of those who had to wait). Waiting time impacted significantly on respondents’ overall satisfaction rating.<br />
Eight-six percent of those who were seen on time rated their overall GP visit as ‘good’ compared to 67% of those<br />
who reported that they were not seen on time (z-test, p
5 Ngā Tukunga Iho o Ngā Rārangi Uiui – Survey Findings<br />
Table 15. Respondents’ experiences of health service visits<br />
Question / Topic GP Hospital A&E Specialist ACC Other<br />
Number of visits reported on 502 200 139 174 77 137<br />
Able to get a suitable appointment 410<br />
154<br />
N/A N/A<br />
time<br />
(94% 1 )<br />
(90%)<br />
N/A N/A<br />
Seen on time<br />
280<br />
(64%)<br />
N/A N/A 80% N/A N/A<br />
Confidence and trust in the service<br />
provider 2<br />
92% 82% N/A 91% 65% 93%<br />
Receptionist was polite 96% N/A 86% 93% N/A N/A<br />
The service provider (e.g., doctor)<br />
asked enough questions<br />
87% 83% 86% 88% N/A N/A<br />
Service provider spent enough<br />
time listening<br />
89% N/A N/A 85% 78% 84%<br />
Service provider spent enough<br />
time with respondent<br />
90% 84% 86% 90% N/A N/A<br />
Service provider explained things<br />
well<br />
87% 82% 81% 86% 58% 82%<br />
Respondent given enough privacy 98% 83% 89% 94% 73% 97%<br />
Respondent treated with respect 96% 87% 91% 97% 82% 96%<br />
Service provider respected<br />
respondent’s culture and beliefs<br />
N/A 81% N/A N/A 75% 86%<br />
Service provider said respondent’s<br />
name properly<br />
83% N/A N/A 86% N/A N/A<br />
Overall satisfaction = ‘Good’ 79% 64% 63% 74% 48% 79%<br />
Would visit this service again 93% 82% 82% 87% 82% 90%<br />
Notes. 1. Percentage of respondents agreeing with service statement. 2. Respondents may have rated a doctor from<br />
their GP visit, a doctor or nurse from their A&E, other health professionals from their hospital visit, a staff member<br />
from ACC, or a health professional/worker from their other health services experiences. 3. ‘N/A’ indicates that this<br />
question was not asked for this service.<br />
The modelling analysis of the GP responses examined which elements were most associated with respondents:<br />
overall satisfaction, and intention to revisit. This analysis found that ‘good’ overall satisfaction was associated with:<br />
respondents being able to make an appointment in a timeframe they felt was appropriate, the doctor listening to them,<br />
the doctor clearly explaining their condition to them, and the doctor warning them of any potential side effects of the<br />
recommended treatment. This model correctly classified 88.2% of respondents’ overall satisfaction ratings.<br />
Intention to revisit was found to be less likely if the doctor did not ask enough questions to find out what was<br />
wrong, and the respondent did not have confidence and trust in the doctor. A revisit was more likely if respondents<br />
had seen the same doctor before.<br />
Respondents were asked about what they liked or disliked about their last visit to the GP. Common answers (given<br />
by at least 10% of respondents) about their ‘likes’ were: the overall service/process, the usual/normal service, and<br />
the polite and respectful manner of the GP. The common dislike was the waiting time.<br />
64 | <strong>He</strong> <strong>Ritenga</strong> <strong>Whakaaro</strong>: Māori experiences of health services
Ngā Tukunga Iho o Ngā Rārangi Uiui – Survey Findings 5<br />
5.3.2 Hospital Visits<br />
Overall, respondents were satisfied with their visits to the hospital (Table 15). Most respondents reported that<br />
they had confidence and trust in the people who were looking after them (82%); that the staff asked enough<br />
questions (83%), explained things well (82%), and treated them and their family members with respect (87%).<br />
Most respondents (81%) also said that their culture and beliefs were respected. And most (82%) rated their overall<br />
satisfaction with their visit as ‘good’.<br />
Seventy-three percent of the respondents reported that they were prescribed further treatment and/or drugs at<br />
hospital, and most of these respondents (88%) said that they had received an explanation for this.<br />
Respondents were asked about what they liked or disliked about their last visit to hospital. Common answers (given<br />
by at least 10% of respondents) about their ‘likes’ were: that the overall service was good; that it was clean/warm/<br />
good food; and that they were treated with politeness and respect. The common dislike was the waiting time.<br />
With respect to the overall visit rating, the modelling analysis found that a ‘good’ rating was less likely if the<br />
respondents felt (1) that the staff did not ask sufficient questions, (2) that the staff consulted with each other while<br />
ignoring the patient, (3) that they were not treated with respect, (4) that their privacy was not respected, or (5)<br />
that doctors did not tell them what to expect after they were discharged from the hospital. This model correctly<br />
classified 77.6% of respondents’ overall satisfaction ratings.<br />
Intention to revisit the hospital was found to be less likely if staff did not always introduce themselves, and<br />
respondents were not given enough privacy during their stay. A revisit was more likely if respondents felt that staff<br />
had not talked in from of them as if they were not there.<br />
5.3.3 A&E Visits<br />
Over half of the respondents described the reason for their visit to A&E as ‘extremely serious’ (N=40, 28.8%) or<br />
‘very serious’ (N=41, 29.5%). Thirty-seven visits (26.6%) were described as ‘serious’, with the remaining visits<br />
(N=21, 15.1%) described as ‘not that serious’.<br />
Overall, respondents said that they, and the people they were with, had been treated with politeness (86%) and<br />
respect (91%) by the A&E receptionist. Just over half of the respondents (55%) were told how long they would have<br />
to wait, with 46% being told the reason for the wait. Most of respondents (77%) spoke to a nurse or doctor within 30<br />
minutes of their arrival at A&E, and 70% were examined within this timeframe.<br />
Overall, respondents were satisfied with their visit to A&E (Table 15). They reported that they and any people with<br />
them were treated with respect (91%); and that the doctor or nurse asked enough questions (86%) and explained<br />
things well (81%). The majority of respondents (86%) reported that the reason they went to A&E was dealt with to<br />
their satisfaction.<br />
Seventy-three percent of the respondents reported that they were prescribed further treatment and/or drugs at the<br />
A&E, and the majority of these respondents (90%) had received an explanation for this.<br />
Respondents were asked about what they liked or disliked about their last visit to A&E. Common answers (given by at<br />
least 10% of respondents) about their ‘likes’ were: that the service was thorough and efficient; that the treatment was<br />
good/excellent; and that they were treated with politeness and respect. The common dislike was the waiting time.<br />
With respect to the overall visit rating, the modelling analysis found that a good rating was less likely if the respondents<br />
felt (1) that they were not seen in a fair and reasonable order, (2) the staff did not introduce themselves, (3) the staff did<br />
not spend sufficient time with them, (4) their privacy was not respected, or (5) the reason they went to the A&E was not<br />
dealt with adequately. This model correctly classified 78.4% of respondents’ overall satisfaction ratings. Respondents<br />
were less likely to revisit the A&E if they felt that staff had not seen patients in a fair order.<br />
<strong>He</strong> <strong>Ritenga</strong> <strong>Whakaaro</strong>: Māori experiences of health services | 65
5 Ngā Tukunga Iho o Ngā Rārangi Uiui – Survey Findings<br />
5.3.4 Specialist Visits<br />
Overall, respondents were satisfied with their visits to a Specialist (Table 15). They reported that they had<br />
confidence and trust in the Specialist (91%); that the Specialist asked enough questions (88%), explained things<br />
well (86%), treated them with respect (97%), and said their name properly (86%). Most said that they would see the<br />
same Specialist again (87%), and 74% rated their overall satisfaction with the Specialist as ‘good’ (on a 3-point scale:<br />
‘good’, ‘average’, ‘poor’).<br />
Most respondents (80%) reported that they were seen by the Specialist on time. A third of those who had to wait<br />
also reported that they were told how long the wait would be (32% of those who waited) and/or why they had to<br />
wait (27% of those who waited).<br />
Sixty-seven percent of respondents were prescribed further treatment and/or drugs by the Specialists. The majority<br />
of this group (93%) said that they received an explanation for this, and 67% said that they received an explanation of<br />
potential side effects. Four out of five (78%) of those receiving a prescription collected it.<br />
The modelling analysis of the Specialist responses examined which elements were most associated with<br />
respondents: overall satisfaction, and intention to revisit. This analysis found that ‘good’ overall satisfaction was less<br />
likely if respondents felt that the Specialist did not ask them enough questions about what was wrong with them.<br />
This model correctly classified 79.0% of respondents’ overall satisfaction ratings.<br />
Intention to revisit was found to be less likely if the Specialist did not spend enough time listening to them and<br />
explaining matters, and did not pronounce their name properly.<br />
Respondents were asked about what they liked or disliked about their last visit to the Specialist. Common answers<br />
(given by at least 10% of respondents) about their ‘likes’ were: the overall service/process; the polite and respectful<br />
manner of the Specialist; and being consulted and kept informed. The main dislike was the waiting time.<br />
5.3.5 ACC Visits<br />
Overall, most respondents felt that they were treated with respect (82%) by ACC. Many reported that their culture<br />
and beliefs were respected (75%), that they were listened to sufficiently (78%), and that they were given enough<br />
privacy (73%). Approximately two-thirds of respondents felt that they were given all the information they needed<br />
about their claim or entitlement (68%), that they had trust and confidence in the person they met with (65%), and<br />
that they had received a clear explanation of what would happen after their visit (58%).<br />
Respondents were asked about what they liked or disliked about their last visit to ACC. Common answers (given by<br />
at least 10% of respondents) about their ‘likes’ were: the polite and respectful service, being kept informed/listened<br />
to/receiving good explanations, and the thorough and efficient service. The common dislike was the waiting time.<br />
With respect to the overall ACC visit rating, the modelling analysis showed that a good rating was less likely if the<br />
respondents felt (1) that they were not given all the information they needed or (2) that they were not given a clear<br />
explanation of what would happen after their visit. A ‘good’ rating was more likely if respondents had visited ACC<br />
before for the same issue. The model correctly classified 81.8% of respondents’ overall satisfaction ratings.<br />
Intention to revisit was found to be less likely if the respondent felt that the person they saw did not listen to their<br />
views.<br />
5.3.6 Other Services Visits<br />
The most common ‘other services’ were x-rays (30%) and physiotherapy (23%). Overall, the majority of respondents<br />
felt that they were treated with respect (96%), were given enough privacy (96%), and had confidence and trust<br />
in the service provider (93%). Most felt that their culture and beliefs were respected (86%) and that the service<br />
provider explained things well (82%) (Table 15).<br />
Respondents were asked about what they liked or disliked about their last visit to the service provider. Common<br />
answers (given by at least 10% of respondents) about their ‘likes’ were: the polite and respectful service, being kept<br />
informed/listened to/receiving good explanations, the thorough and efficient service, and the outcome/speed of<br />
the treatment. There were no common dislikes.<br />
66 | <strong>He</strong> <strong>Ritenga</strong> <strong>Whakaaro</strong>: Māori experiences of health services
Ngā Tukunga Iho o Ngā Rārangi Uiui – Survey Findings 5<br />
With respect to the overall visit rating, the modelling analysis showed that a good rating was less likely if the<br />
respondents felt (1) that they lacked trust and confidence in their clinician, (2) that the staff did not communicate in<br />
an open and honest manner, or (3) they did not receive a clear explanation of why they needed the treatment. This<br />
model correctly classified 85.5% of respondents’ overall satisfaction ratings. Similarly, a revisit was less likely if the<br />
respondents reported a lack of confidence and trust in the clinician.<br />
5.3.7 Comparing Services<br />
This section briefly draws some comparisons across service ratings.<br />
• GP, specialist and other health services were rated as ‘good’ by most of the respondents (74-79%). Slightly<br />
less than half (48%) of the respondents asked, rated their last ACC interaction as ‘good’.<br />
• With the exception of ACC (and A&E which was not rated on this question), most respondents (82%-93%)<br />
reported that they had confidence and trust in most service providers. Two-thirds (65%) of respondents said<br />
that they had confidence and trust in the ACC person they had met with.<br />
• Most respondents (78%-89%) reported that their GP, specialist, ACC staff member, or other health service<br />
provider had spent enough time listening to them.<br />
• With the exception of ACC, most respondents reported that their service provider explained things well. Just<br />
over half of the respondents (58%) reported that the ACC person they had met with had done so.<br />
• The majority of respondents reported that their service provider had given them enough privacy (73%-98%)<br />
and treated them with respect (82%-97%).<br />
• Most respondents reported that they would visit the same service again (82%-93%).<br />
• A common dislike about most services was the waiting time.<br />
• Overall satisfaction was generally related to the nature of the interaction between the respondents and the<br />
service provider (e.g., whether it was respectful, polite, and informative).<br />
• Respondents’ intention to revisit a service was generally related to similar issues as their satisfaction (e.g.,<br />
politeness, being listened to, being given privacy).<br />
<strong>He</strong> <strong>Ritenga</strong> <strong>Whakaaro</strong>: Māori experiences of health services | 67
5 Ngā Tukunga Iho o Ngā Rārangi Uiui – Survey Findings<br />
5.4 Respondents’ Attitudes<br />
Respondents were asked a series of questions about their attitudes towards their own health, doctors’ attitudes<br />
towards Māori, and the overall health system. Ratings were collected using a 3-point scale (‘agree’, ‘neither agree or<br />
disagree’, ‘disagree’).<br />
5.4.1 Respondents’ Own <strong>He</strong>alth<br />
Just over half of the respondents agreed with the statement ‘I am in excellent health’. A similar number of<br />
respondents agreed with the statement ‘I have some concerns about my health’.<br />
5.4.2 Visiting the <strong>Doctor</strong><br />
When asked about visiting the doctor, approximately two-thirds of respondents agreed with statements that: they<br />
would have to be quite sick before going to the doctor (73%), they would usually wait until the last minute before<br />
going (68%), and that it is too expensive to go to the doctor every time they felt sick (63%) (Table 16). Respondents<br />
were split over whether the cost of seeing the doctor was not value for money; 41% of respondents agreed that it<br />
was not good value while 48% disagreed. Two-thirds of the respondents (64%) did not expect their family/whānau<br />
to look after them when they were sick as an alternative to going to the doctor. And respondents were also split<br />
about taking drugs for their illness; half did not like doing it (51%).<br />
Table 16. Respondents’ attitudes towards visiting the doctor<br />
Statement Agree (%)<br />
Neither Agree or<br />
Disagree (%)<br />
Disagree (%)<br />
I have to be quite sick before I’ll go to a doctor 73 3 24<br />
I usually wait until the last minute to go to see a doctor 68 4 28<br />
It is too expensive to go the doctor every time I feel sick 63 4 33<br />
The cost of seeing a doctor is not good value for money 41 11 48<br />
I expect my family/whānau to look after me when I’m sick<br />
rather than going to the doctor<br />
26 10 64<br />
I don’t like taking drugs for my own illnesses 51 8 41<br />
The majority of the respondents agreed that were treated with respect (93%) by their GP. Most agreed that they had a<br />
good relationship with their GP (84%), could trust their GP (87%), and were treated as well as any other patient (85%)<br />
(Table 17). Most of the respondents also disagreed with statements about: their GP not treating them like an adult (89%),<br />
the respondent not asking questions (86%), and the respondent being too shy to argue with the doctor if they think<br />
s/he is wrong (76%). Two-thirds of the respondents (68%) disagreed with the statement that doctors do not listen to<br />
their patients. And just over half of the respondents (56%) agreed that their doctor had given them ACC information,<br />
with 29% neither agreeing nor disagreeing with this statement (possibly because it was not relevant for them.<br />
68 | <strong>He</strong> <strong>Ritenga</strong> <strong>Whakaaro</strong>: Māori experiences of health services
Ngā Tukunga Iho o Ngā Rārangi Uiui – Survey Findings 5<br />
Table 17. Respondents’ attitudes about GPs and doctors<br />
Statement Agree (%)<br />
Neither Agree or<br />
Disagree (%)<br />
Disagree (%)<br />
The GP I last went to treated me with respect 93 1 5<br />
I can trust my GP 87 6 7<br />
The GP treats me as well as any other patients he/she has 85 9 6<br />
I have a good relationship with my GP 84 7 9<br />
The doctor does not treat me like an adult 10 2 89<br />
I don’t like to ask the doctor questions 12 2 86<br />
I am too shy to argue with the doctor if I think he/she is wrong 19 5 76<br />
<strong>Doctor</strong>s don’t really listen to their patients 19 13 68<br />
The doctor gave me all the information I needed to get ACC 56 29 15<br />
5.4.3 Cultural Competency<br />
Many respondents disagreed with the statement that doctors did not really care about their Māori patients (75%),<br />
or that hospitals should treat Māori differently to Pākehā (63%) (Table 18). Approximately half of the respondents<br />
disagreed with four other statements about cultural competency; namely: having a preference for a doctor<br />
from their own ethnic group (53%), having a Māori doctor rather than a Pākehā doctor (49%), hospital staff not<br />
recognising Māori culture (46%), and being looked after better by Māori health staff (46%), While less than onethird<br />
(26%-30%) of respondents agreed with these last four statements, a similar proportion of respondents (21%-<br />
30%) neither agreed nor disagreed.<br />
Table 18. Respondents’ attitudes about cultural competency<br />
Statement<br />
Neither Agree or<br />
Agree (%) Disagree (%)<br />
Disagree (%)<br />
<strong>Doctor</strong>s don’t really care about their Māori patients 10 14 75<br />
Hospitals should treat Māori differently to Pākehā 24 13 63<br />
I would prefer to see a doctor of my own ethnic group 26 21 53<br />
I would rather see a Māori doctor than a Pākehā doctor 22 30 49<br />
Hospital staff don’t recognise Māori culture 28 26 46<br />
I would get looked after better if I was to deal with Māori people<br />
in my health system provider<br />
30 24 46<br />
I would prefer to see a doctor of my own gender 38 17 45<br />
Respondents were split about preferring to have a doctor of their own gender; 45% disagreed with this statement<br />
while 38% agreed.<br />
5.4.4 <strong>He</strong>alth Providers & <strong>He</strong>alth System<br />
Two-thirds of the respondents (66%) felt that they were treated well in the hospital (Table 19). Many respondents<br />
disagreed with statements about them not being treated with respect by providers (80%), people in the health<br />
system making it difficult for them to get what they want (70%), and hospital staff not treating them with respect<br />
(68%). Respondents were split over whether they got different answers from different people in their health system<br />
provider (40% agreeing, 51% disagreeing), and it being hard to get a straight answer from people in the health<br />
system (39% agreeing, 48% disagreeing).<br />
<strong>He</strong> <strong>Ritenga</strong> <strong>Whakaaro</strong>: Māori experiences of health services | 69
5 Ngā Tukunga Iho o Ngā Rārangi Uiui – Survey Findings<br />
Table 19. Respondents’ attitudes towards other health staff<br />
Statement Agree (%)<br />
Neither Agree or<br />
Disagree (%)<br />
Disagree (%)<br />
I get well treated in the hospital 66 20 14<br />
I don’t get treated with respect by provider1 14 6 80<br />
The people in my provider make it difficult for me to get what I<br />
want<br />
21 9 70<br />
Hospital staff don’t treat me with respect 15 16 68<br />
I get different answers from different people in my provider 40 9 51<br />
It is hard to get a straight answer from people in the health<br />
system<br />
39 13 48<br />
Note. The term ‘provider’ is used in the question asked to refer to the respondent’s health system provider (e.g.,<br />
GP, hospital, ACC or other service provider).<br />
Just over half of respondents (53%) agreed that the overall NZ health system is very good, while less than half<br />
(43%) agreed that it is ‘good value for money’ (Table 20). Approximately one in five respondents neither agreed nor<br />
disagreed with these statements.<br />
Table 20. Respondents’ attitudes towards the <strong>New</strong> <strong>Zealand</strong> health system<br />
Statement Agree (%)<br />
Neither Agree or<br />
Disagree (%)<br />
Disagree (%)<br />
Overall I think the health system in NZ is very good 53 18 29<br />
Overall I think the health system in NZ is good value for<br />
money<br />
43 17 40<br />
5.5 Subgroup Formation and Analysis<br />
A cluster analysis (SPSS 2-step cluster analysis) was performed to look for groups of respondents with similar<br />
attitudes. 1 This was done using respondents’ answers to the questions in the attitudes section above (i.e.,<br />
questions 125 to 156, see Appendix C). After these two groups had been determined, they were compared on the<br />
demographic variables and then on respondents’ responses to other survey questions.<br />
Six percent of the respondents were classified as outliers in the cluster analysis and dropped from further<br />
consideration. 2 From the remaining respondents, two groups could easily be differentiated: Group 1 comprised<br />
73.3% of the total sample (78% of the sample included in the cluster analysis), while Group 2 comprised 20.7% of<br />
the total sample (22% of those included in the cluster analysis).<br />
5.5.1 Demographic Comparison<br />
Demographically, Group 2 was significantly younger than Group 1 (mean age = 39 vs. 47 years respectively;<br />
t=6.284, p
Ngā Tukunga Iho o Ngā Rārangi Uiui – Survey Findings 5<br />
5.5.2 Attitudinal Comparison<br />
Groups 1 and 2 were significantly different (using z-tests at the 95% confidence level) in many of their attitudes, many of<br />
their visit ratings, and their intentions regarding future use of services. These differences are reported on below.<br />
Compared with those in Group 2, a significantly higher proportion of respondents in Group 1 (i.e., the older group)<br />
rated their GP, Specialist, A&E and Hospital visits as ‘good’ (ratings from 73%-89% vs. 32%-53% for Group 2), and stated<br />
that they would go back to the GP, Specialist or Hospital if sick again (ratings of 98%, 93% and 89% respectively vs.<br />
Group 2 ratings of 80%, 74% and 59%) (Table 21). A significantly higher proportion of respondents in Group 2 rated their<br />
ACC visit as ‘poor’ (28% vs. 9% in Group 1) and their visit to other services as ‘average’ (29% vs. 11% in Group 1).<br />
Table 21. A comparison of Group 1 and Group 2 respondents’ satisfaction with, and willingness to revisit,<br />
health services<br />
Issue Group 1 % Group 2 %<br />
Overall GP visit rated Good* 89 51<br />
Overall Specialist visit rated Good* 79 53<br />
Overall A&E visit rated Good* 74 32<br />
Overall Hospital visit rated Good* 73 37<br />
Overall ACC visit rated Poor* 9 28<br />
Overall Other Service visit rated Average* 11 29<br />
I would go to this doctor again if I were sick* 98 80<br />
I would go to this specialist again if I were sick* 93 74<br />
If I had a choice, I would go to this hospital again if I were sick* 89 59<br />
If I had a choice, I would you use ACC again if I needed to* 90 79<br />
If I had a choice, I would go to this A&E again if I were sick 87 74<br />
If I had a choice, I would use this other service again if I needed treatment 94 96<br />
Note. * indicates that the difference between the two groups is statistically significant (p
5 Ngā Tukunga Iho o Ngā Rārangi Uiui – Survey Findings<br />
Respondents in Group 1 and Group 2 differed significantly with respect to their reported relationship with their<br />
GP (Table 23). Compared to the majority of respondents in Group 1, only two-thirds of those in Group 2 agreed<br />
that they could trust their GP (69% vs. 99%), that their GP treated them as well as other patients (66% vs. 94%),<br />
and that they had a good relationship with their GP (63% vs. 95%). In addition, a significantly lower proportion of<br />
respondents in Group 2 agreed that their GP had treated them with respect the last time they went (82% vs. 99%<br />
in Group 1). These ratings may be confounded by the fact that members of Group 2 were more likely to be visiting<br />
that GP for the first time (29% vs. 16% of Group 1).<br />
Table 23. Respondents’ relationships with their GP<br />
Issue Group 1 % Group 2 %<br />
The GP I last went to treated me with respect* 99 82<br />
I can trust my GP* 96 69<br />
The GP treats me as well as any other patients he/she has* 94 66<br />
I have a good relationship with my GP* 95 63<br />
Note. * indicates that the difference between the two groups is statistically significant.<br />
Compared to the low proportion of respondents in Group 1 who agreed with negative statements about rapport,<br />
a third to a half of Group 2 respondents agreed that: they did not like to ask the doctor questions (29% vs. 5%),<br />
the doctor did not really listen to them (51% vs. 9%), and they are too shy to argue with the doctor if they think s/<br />
he is wrong (42% vs. 10%, table 24). These differences were significant. In addition, respondents in Group 2 were<br />
significantly more likely than those in Group 1 to agree that the doctor did not treat them like an adult (33% vs. 3%).<br />
Table 24. Respondents’ rapport with health personnel<br />
Issue Group 1 % Group 2 %<br />
The doctor does not treat me like an adult* 3 33<br />
I don’t like to ask the doctor questions* 5 29<br />
<strong>Doctor</strong>s don’t really listen to their patients* 9 51<br />
I am too shy to argue with the doctor if I think s/he is wrong* 10 42<br />
The doctor gave me all the information I needed to get ACC 58 53<br />
Note. * indicates that the difference between the two groups is statistically significant.<br />
Respondents in Group 2 were significantly more likely than those in Group 1 to agree that they ‘would get looked<br />
after better’ if they were being cared for by other Māori (70% vs. 18%, table 25). In addition, one third of those<br />
in Group 2, compared with only 2% of those in Group 1, agreed that ‘doctors don’t really care about their Māori<br />
patients’ (38% vs. 2%).<br />
Table 25. Respondents’ perceptions of GP care<br />
Issue Group 1 % Group 2 %<br />
I would get looked after better if I was to deal with Māori people in my<br />
provider*<br />
18 70<br />
<strong>Doctor</strong>s don’t really care about their Māori patients* 2 38<br />
I would prefer to see a doctor of my own ethnic group 13 67<br />
I would rather see a Māori doctor than a Pākehā doctor 10 63<br />
I would prefer to see a doctor of my own gender 30 59<br />
Note. * indicates that the difference between the two groups is statistically significant.<br />
72 | <strong>He</strong> <strong>Ritenga</strong> <strong>Whakaaro</strong>: Māori experiences of health services
Ngā Tukunga Iho o Ngā Rārangi Uiui – Survey Findings 5<br />
The differences between Group 1 and Group 2 for agreement with the statements about their preference for a<br />
doctor from their own ethnic group and for a Māori doctor were not significant. Likewise, the groups were not<br />
significantly different in their preference for a doctor of their own gender.<br />
Two-thirds of the respondents in Group 1 agreed that they got treated well in the hospital, compared to less than<br />
half of those in Group 2 (75% vs. 42%). This difference was significant (Table 26). Compared to respondents in<br />
Group 1, a significantly higher proportion of those in Group 2 agreed with negative statements about hospital<br />
treatment; namely, that ‘hospital staff don’t recognise Māori culture’ (67% vs. 17%), and that hospital staff do not<br />
treat them with respect (37% vs. 9%). Half of those in Group 2, compared with 16% in Group 1, also agreed that<br />
‘hospital staff should treat Māori differently to Pākehā’. This was also a significant difference.<br />
Table 26. Patient perceptions of hospitals<br />
Issue Group 1 % Group 2 %<br />
I get well treated in the hospital* 75 42<br />
Hospital staff don’t recognise Māori culture* 17 67<br />
Hospital should treat Māori differently to Pākehā * 16 50<br />
Hospital staff don’t treat me with respect* 9 37<br />
Note. * indicates that the difference between the two groups is statistically significant.<br />
Most of those in Group 2, compared with around a quarter of those in Group 1, agreed that they got ‘different<br />
answers from different people in my provider’ (85% vs. 25%), and that ‘it is hard to get a straight answer from<br />
people in the health system (82% vs. 24%, table 27). These differences were significant. Those in Group 2 were also<br />
significantly more likely to agree that: ‘the people in my provider make it difficult for me to get what I want (59% vs.<br />
8%), and ‘I don’t get treated with respect by provider’ (34% vs. 6%).<br />
The two groups also differed significantly in their agreement with overall statements about the <strong>New</strong> <strong>Zealand</strong> health<br />
system. More than half of those in Group 1, compared with a third or less in Group 2, agreed that: the ‘health<br />
system in NZ is very good’ (60% vs. 33%), and ‘the health system is good value for money’ (51% vs. 20%).<br />
Table 27. Patient perceptions of the healthcare system<br />
Issue Group 1 % Group 2 %<br />
I get different answers from different people in my provider* 25 85<br />
It is hard to get a straight answer from people in the health system* 24 82<br />
The people in my provider make it difficult for me to get what I want* 8 59<br />
I don’t get treated with respect by provider* 6 34<br />
Overall I think the health system in NZ is very good* 60 33<br />
Overall I think the health system in NZ is good value for money* 51 20<br />
Despite their reports of a greater reluctance to use the system and their greater dissatisfaction with it, Group<br />
2 reported similar utilisation rates of healthcare services to Group 1 over the last six months (Table 28). Most<br />
respondents in both groups had seen a GP in the past six months, and between 13% and 31% had visited other<br />
health services, including ACC.<br />
<strong>He</strong> <strong>Ritenga</strong> <strong>Whakaaro</strong>: Māori experiences of health services | 73
5 Ngā Tukunga Iho o Ngā Rārangi Uiui – Survey Findings<br />
Table 28. Services utilised<br />
Service Group 1 % Group 2 %<br />
GP/<strong>Doctor</strong> 96 91<br />
Accident and Emergency 21 26<br />
Hospital 32 31<br />
Specialist 26 27<br />
ACC 13 21<br />
Other services 28 29<br />
5.6 Discussion<br />
While general satisfaction surveys have been undertaken across <strong>New</strong> <strong>Zealand</strong>, little has been reported about Māori<br />
experiences of healthcare. The current study sought to learn about Māori perceptions of, and experiences with,<br />
the healthcare system within a Kaupapa Maori framework. Previous surveys of patient ‘satisfaction’ as a measure<br />
of quality in the healthcare setting tended to reflect the values of managers and clinicians; in other words, those<br />
who design and administer the survey rather than the values of the patients themselves. The current survey took<br />
into account previous research on Māori as well as the results of ten hui with Māori health consumers to produce a<br />
survey tool more in-tune with Māori health experiences.<br />
The survey sought to test the instrument for validation purposes. The survey solicited feedback from Māori about a<br />
number of different health services, including ACC. Respondents were also asked a series of attitudinal questions which<br />
led to the identification of two sub-groups who held different opinions about health services. This discussion first looks<br />
briefly at service utilisation before discussing the findings about health services. The limitations of the methodology are<br />
then addressed, followed by the implications of the findings for health services as well as for future research.<br />
5.6.1 <strong>He</strong>alth Services Ratings<br />
When asked about their experiences of the GP, hospital, A&E, specialist and ‘other health provider’ in the last six<br />
months, most respondents reported that the health provider had spent an appropriate amount of time with them,<br />
listened to them, and explained relevant health issues. Most respondent also reported that they had been treated<br />
with respect and given enough privacy, and that they had confidence and trust in the health service provider. ACC<br />
differed mostly in respect to the provider not explaining things well and the respondent not having confidence<br />
and trust in the provider. However, positive ratings on these issues were still given by over half of the respondents<br />
surveyed on their experience of ACC. Many of the respondents also said that their culture and beliefs were<br />
respected by the hospital, ACC and ‘other health provider’. Most respondents said that they would visit these<br />
services again, and most reported that they were satisfied overall with the service they had received (with this<br />
dropping to half of those rating their ACC experience).<br />
Overall satisfaction ratings and intentions to revisit were largely related to respondents’ experiences of rapport<br />
and respect, with some variation across services. This is in keeping with other research that has found that overall<br />
satisfaction is dependent on developing a trusting relationship with a provider who is in tune with the expectations,<br />
preferences and priorities of the patient. It is more difficult for patients to know whether the technical aspects of<br />
care were delivered so patients often rate the interaction on the rapport and respect they perceive, forming an<br />
overall opinion about the service based on these aspects (see section 2.4 for fuller discussion).<br />
5.6.2 Attitudes<br />
Most respondents said that they put off going to see the doctor until the last minute. This corresponds with the `wait<br />
and see’ attitude expressed at the hui. The hui participants linked this attitude with the costs of visiting their GP,<br />
with many challenging whether such a visit was value for money. The survey respondents were similarly split over<br />
whether the cost of seeing the doctor was value for money. This reinforces the findings of some studies (Zgibor<br />
& Simmons 2002; Clemenger BBDO 2004; Cram & Smith 2003) that cost poses a barrier to healthcare utilisation,<br />
while contradicting other study findings.(Ministry of <strong>He</strong>alth. 2005; Scott et al 2003).<br />
74 | <strong>He</strong> <strong>Ritenga</strong> <strong>Whakaaro</strong>: Māori experiences of health services
Ngā Tukunga Iho o Ngā Rārangi Uiui – Survey Findings 5<br />
The similar split in respondents’ attitudes toward taking drugs for their illness may reflect financial concerns as well<br />
as issues about the efficacy of GP communication to patients about prescribed drugs. While the majority of those<br />
who were recommended further treatment and/or drugs by their GP received an explanation, only half reported<br />
that they were told about the side effects of drugs. Even so, most collected their prescription. It is conceivable that a<br />
lack of explanation from the GP about the drug or its side effect made some respondents somewhat hesitant about<br />
taking their medicine.<br />
Most of the respondents who were asked about GP visits agreed that they had a good relationship and good<br />
rapport with their GP. Most respondents also thought that they were generally respected by their health provider,<br />
whoever that provider was. Most also felt that doctors cared about their Māori patients, and while around half<br />
thought that they would get better care from Māori health providers, a sizable proportion of the respondents (20-<br />
30%) were ambivalent about this (saying that they neither agreed nor disagreed).<br />
Respondents were split about the ‘answers’ they received from their health provider. Around two out of five<br />
respondents thought that they received different answers from different people, and that it was hard to get a<br />
‘straight answer’. On the other hand, half of the respondents disagreed with these statements. This may relate<br />
to health being a credence good whereby it is difficult for some patients to handle multiple opinions and advice<br />
without them seeming to be contradictory or not ‘straight’ answers.<br />
The splitting of the respondent sample into two subgroups based on their attitudes revealed a smaller, younger group<br />
of respondents (Group 2) who were less likely to report that they intended to visit the same provider in the future and<br />
also less likely to report that their relationship with the doctor was good, respectful and enabling of rapport. This group<br />
was also more likely to be cynical about the care provided by doctors to Māori patients, and more likely to say that they<br />
would be better looked after by Māori health professionals. They were also more critical of the recognition of Māori<br />
culture within hospitals, wanting hospitals to treat Māori differently to Pākehā (presumably in a culturally appropriate<br />
way). Most of the respondents in this group also agreed that they got different answers from different people in the<br />
health provider, and that it was hard to get a straight answer from people.<br />
One explanation for these findings is that while both groups have similar experiences with health professionals,<br />
Group 2 respondents are more likely to identify and articulate dissatisfaction. The one in five Māori respondents<br />
comprising Group 2 reported significantly less overall satisfaction with their experiences and had much lower<br />
intentions of revisiting providers compared with the older Group 1 respondents.<br />
This explanation is in line with other research findings that the health-related attitudes of younger Māori were<br />
more similar to those of the <strong>New</strong> <strong>Zealand</strong> European population, than they were to older Māori (>45 years) or Pacific<br />
peoples (Scott 2000). Other authors have also found a diversity of views and cultural identities amongst Māori<br />
(Durie, 1994; Williams, 2000; Te Hoe Nuku Roa 1999; Houkamau 2000). In general these studies found that older<br />
Māori were more grounded in a Māori cultural identity while younger Māori were typically located within one or<br />
two groups: a disaffected group unconnected to the Māori world, or a cohort that moves easily and confidently<br />
within both Māori and Pākehā worlds (Houkamau 2000). Both of these groups may feel more empowered to<br />
express disapproval about the health care they had received. In contrast, older Māori may have felt that it was less<br />
appropriate for them to express negative views of health providers (noho whakaiti).<br />
5.6.3 Limitations of Methodology<br />
The pilot survey was delivered by telephone (or face-to-face with respondents who were deaf) to a sample chosen<br />
from the Māori electoral roll. Māori are becoming more accustomed to both research and to being surveyed over<br />
the phone, this method excluded people in households without landlines. Other limitations included:<br />
• The sample was made up of people who had had some form of interaction with the healthcare service in the past<br />
six months. Therefore, the study does not analyse barriers to health system usage from the perspective of people<br />
who either choose not to use the system at all or who had not needed to use it in the past six months.<br />
• Face-to-face interviews using trilingual interpreters were used (only) for the sample of 50 Māori deaf.<br />
This group faces significant barriers to care, so this style of interviewing was deemed necessary to obtain<br />
information for this study, despite the lack of methodological consistency that it introduced.<br />
<strong>He</strong> <strong>Ritenga</strong> <strong>Whakaaro</strong>: Māori experiences of health services | 75
5 Ngā Tukunga Iho o Ngā Rārangi Uiui – Survey Findings<br />
• The exact nature of the ailment or injury that resulted in a visit to a health professional was not asked in the<br />
survey.<br />
• In order to explore the differences between Māori and non-Māori, it would be necessary to have a<br />
corresponding sample of non-Māori with which to compare these findings. Non-Māori comparisons were<br />
not performed because the scope of the research was to test the survey tool among Māori (only). The<br />
completion of a comparison study was never a goal of the current research.<br />
• While the sampling was designed to ensure coverage of Māori across all regions, this is not a representative<br />
sample of Māori visits to health and disability providers, as a quota was used to ensure that a sufficient<br />
number of visits to each service was obtained. Without such a sampling frame, GP visits would have<br />
dominated the responses and limited the depth of the data obtained.<br />
• Data from patient contacts with service providers relates to individual visits rather than episodes of illness.<br />
Furthermore the reliability and validity of the information provided by Māori patients has not been confirmed<br />
by independent measurement.<br />
• While the survey instrument was derived from a number of sources (including comparison with validated<br />
measures of patient experience) the reliability of the instrument has not been independently tested.<br />
However, the sample size and response rate add validity to the instrument.<br />
5.6.4 Implications for <strong>He</strong>alth Policy and Services<br />
The present pilot survey has stressed the importance of relationships and rapport if Māori are to have good<br />
engagements with health care providers. While the relationship element has been challenged by the Group 2<br />
cohort, it is still important for the older Group 1 cohort (who made up 78% of the sample in the cluster analysis). This<br />
group is currently in the majority, with care needing to be taken to meet the criticism of those in Group 2 as they in<br />
all likelihood represent the future.<br />
Based on the findings from the pilot survey the following implications for health policy and services are suggested:<br />
• Continue to build the capacity of the Māori health and disability workforce so that consumers can have the<br />
option of seeing a Māori staff member at a health service.<br />
• Encourage health organisations to tailor health education and promotional material (including ACC-related<br />
material) so that it is appropriate for Māori consumers. In addition, staff should be encouraged to use such<br />
material in their communications with Māori.<br />
• Continue to provide cultural competency and communication skills training for non-Māori staff. Such training<br />
should include information about Māori cultural preferences as well as an analysis of Māori health disparities.<br />
Training should also address the needs and preferences of disabled Māori groups.<br />
• Encourage frontline staff to explain to waiting patients and their whānau: why the wait is necessary and how<br />
long they might expect to be kept waiting. In addition, reduce waiting times when feasible.<br />
5.6.5 Future Research<br />
The findings from this pilot-test of the satisfaction survey have highlighted the different experience of health that a<br />
younger group of respondents has had, compared with their older counterparts. If it is assumed that this finding is<br />
generalisable and that it is a cohort effect, then it could be anticipated that Māori dissatisfaction with the health care<br />
they receive will continue in coming years as those who are more inclined to voice their disquiet grow older and<br />
their dissatisfaction spreads through subsequent cohorts.<br />
• The challenge for future research is therefore to test these assumptions, namely:<br />
• Are the attitudes and the lower level of overall satisfaction among the younger group of respondents in the<br />
present study replicable and generalisable?<br />
76 | <strong>He</strong> <strong>Ritenga</strong> <strong>Whakaaro</strong>: Māori experiences of health services
Ngā Tukunga Iho o Ngā Rārangi Uiui – Survey Findings 5<br />
• If so, can this be confidently attributed to expectations of lesser standards of service among this cohort or to<br />
expectations of greater levels of service than they have observed? And is this cohort more like Pākehā than they<br />
are like older Māori in their capability to express dissatisfaction?<br />
• That younger Māori have both a personal and a systems analysis of the healthcare they receive. In other words,<br />
they have an opinion on how they are treated personally, within the context of how the system treats Māori.<br />
• Future research should also continue to test the reliability and validity of the shorter version of the current<br />
satisfaction survey that is developed based on:<br />
• The modelling analysis of which questions best predict overall satisfaction and intention to revisit services, and<br />
• The attitude questions (perhaps selecting those which distinguish most reliably between the two attitude<br />
subgroups).<br />
<strong>He</strong> <strong>Ritenga</strong> <strong>Whakaaro</strong>: Māori experiences of health services | 77
6 References<br />
Accident Compensation Corporation. 2004. Report to Te Roopu Manawa Mai. Wellington: ACC.<br />
Accident Compensation Corporation. 2005. Briefing to the Incoming Minister for ACC. Wellington: ACC.<br />
Accident Compensation Corporation. 2005. Māori Second Quarterly Report 2004-2005. Wellington: ACC.<br />
Accident Compensation Corporation. 2007. Pilot Studies Evaluated: Information for General Practitioners and<br />
Radiologists. Wellington: ACC.<br />
Ajwani S, Blakely T Robson B Tobias M & Bonne M. 2003. Decades of Disparity: Ethnic Mortality Trends in <strong>New</strong><br />
<strong>Zealand</strong> 1980-1999, Wellington: Ministry of <strong>He</strong>alth and University of Otago.<br />
Arroll B, Goodyear-Smith F & Lloyd T. 2002. ‘Depression in Patients in an Auckland General Practice’. NZMJ 115,<br />
no. 1152.<br />
Ashford A et al. 2000. ‘Cancer Screening and Prevention Practices of Inner-City Physicians’. Am J Prev Med 19, no.<br />
1: 59-62.<br />
Avis M, Bond M & Arthur A. 1995. ‘Satisfying Solutions? A Review of Some Unresolved Issues in the Measurement<br />
of Patient Satisfaction’. J Adv Nurs 22: 316-22.<br />
Ayanian JZ et al. 1999. ‘Quality of Care by Race and Gender for Congestive <strong>He</strong>art Failure and Pneumonia’. Med<br />
Care 37, no. 12: 1260-69.<br />
Ayanian JZ et al. 1999. ‘The Effect of Patients’ Preferences on Racial Differences in Access to Renal Transplantation’.<br />
NEJM 341, no. 22: 1661-69.<br />
Bach PB et al. 2004. ‘Primary Care Physicians Who Treat Blacks and Whites ‘. NEJM 351, no. 6: 575-84.<br />
Baker R. 1997. ‘Pragmatic Model of Patient Satisfaction in General Practice: Progress Towards a Theory’. Qual<br />
<strong>He</strong>alth Care 6 : 201-4.<br />
Barnes H. 2000. ‘Kaupapa Māori: Explaining the Ordinary’. Pacific <strong>He</strong>alth Dialog 7, no. 1.<br />
Bartlett E, Grayson M Barker R Levine D Golden A & Libber S. 1984 ‘The Effects of Physician Communication Skills<br />
on Patient Satisfaction, Recall and Adherence’. J Chronic Dis 37: 755-64.<br />
Barwick H. 2000. ‘Improving Access to Primary Care for Māori and Pacific Peoples’. Wellington: <strong>New</strong> <strong>Zealand</strong><br />
<strong>He</strong>alth Funding Authority.<br />
Baxter J. 2002. Barriers to <strong>He</strong>alth Care for Māori With Known Diabetes: A Literature Review and Summary of<br />
Issues. Wellington: <strong>New</strong> <strong>Zealand</strong> National Working Group on Diabetes and Te Roopu Rangahau Hauora a Ngai<br />
Tahu, Wellington.<br />
Beach et al. 2004. Strategies for Improving Minority <strong>He</strong>althcare Quality. Summary, Evidence Report/Technology<br />
Assessment: Number 90, Washington DC: Agency for <strong>He</strong>althcare Research and Quality.<br />
Beaulieu N. 2002. ‘Quality Information and Consumer <strong>He</strong>alth Choices’. J <strong>He</strong>alth Eco 21: 43-63.<br />
Beckman H, Frankel R. 1984. ‘The Effect of Physician Behaviour on the Collection of Data’. Ann Intern Med 101:<br />
692-96.<br />
Ben-Sira Z. 1990.‘Universal Entitlement for <strong>He</strong>alth Care and Its Implications on the <strong>Doctor</strong>-Patient Relationship ‘.<br />
Adv Med Sociol 1: 99-108.<br />
Bertakis K, Roter D Putnam S. 1991. ‘The Relationship of Physician Medical Interview Style to Patient Satisfaction’. J<br />
Fam Pract 32: 175-81.<br />
Bishop R & Glynn T. 1992. ‘<strong>He</strong> Kanohi Kitea: Conducting an Evaluation Educational Research’. <strong>New</strong> <strong>Zealand</strong> Journal<br />
of Educational Studies 27, no. 2.<br />
Bishop R. 1994. ‘Initiating Empowering Research’. NZ J of Educational Studies 29, no. 1.<br />
Bismark M. 2006. ‘Ethnic Disparities in Claims and Complaints Following Medical Injury’.Mauri Ora Symposium.<br />
78 | <strong>He</strong> <strong>Ritenga</strong> <strong>Whakaaro</strong>: Māori experiences of health services
References 6<br />
Bismark MM, Brennan TA Paterson RJ et al. 2006. ‘Relationship Between Complaints and Quality of Care in <strong>New</strong><br />
<strong>Zealand</strong>: a Descriptive Analysis of Complainants and Non-Complainants Following Adverse Events’. Qual Saf <strong>He</strong>alth<br />
Care 15, no. 1: 17-22.<br />
Blakely T, Tobias M, Atkinson J, Yeh L-C, Huang K. 2007. Tracking Disparity: Trends in ethnic and socioeconomic<br />
inequalities in mortality, 1981–2004. Wellington: Ministry of <strong>He</strong>alth.<br />
Booske BC, Sainfort F & Hundt AS. 1999. ‘Eliciting Consumer Preferences for <strong>He</strong>alth Plans’. HSR: <strong>He</strong>alth Service<br />
Research 34, no. 4: 839-54.<br />
Brody D, Miller S Lerman C Smith D Lazaro C & Blum M. 1989. ‘The Relationship Between Patients’ Satisfaction<br />
With Their Physicians and Perceptions About Interventions They Desired and Received’. Med Care 27: 27-35.<br />
Bryant S, Campbell S. 1996. Final Evaluation of Te Mammography Pilot Project for Māori Women in the Waikato<br />
Waiora Region, Te Awamutu: Te Karere Matauranga Māori Research and Development Consultancy.<br />
Buetow S, Adair V Coster G Hight M Gribben B & Mitchell. 2002.‘Reasons for Poor Understanding of When and<br />
How to Access GP Care for Childhood Asthma in Auckland <strong>New</strong> <strong>Zealand</strong>’. Fam Prac 19, no. 4: 319-25.<br />
Buller M, Buller D. 1987. ‘Physicians’ Communication Style and Patient Satisfaction’. J <strong>He</strong>alth Soc Behav 28: 375-88.<br />
Butow PM, Kazemi JN Beeney LJ Griffin AM Dunn S. M & Tattersall MH. 1996. ‘When the Diagnosis Is Cancer:<br />
Patient Communication Experiences and Preferences’. Cancer 77, no. 12: 2630-7.<br />
Canto JG et al. 2000. ‘Relation of Race and Sex to the Use of Reperfusion Therapy in Medicare Beneficiaries With<br />
Acute Myocardial Infarction’. NEJM 342, no. 15: 1094-100.<br />
Carr J, Robson B Purdie G & Workman P. 2002. ‘<strong>He</strong>art Failure: Ethnic Disparities in Morbidity and Mortality in <strong>New</strong><br />
<strong>Zealand</strong>’. NZMJ 15, no. 1146.<br />
Carr-Hill RA. 1992. ‘The Measurement of Patient Satisfaction ‘. J Pub <strong>He</strong>alth Med 14: 236-49.<br />
Carroll L et al. 1998. ‘Good <strong>He</strong>alth Care: Patient and Professional Perspectives’. Br J Gen Pract 48: 1507-8.<br />
Chen J et al. 2001. ‘Racial Differences in the Use of Cardiac Catheterization After Acute Myocardial Infarction’.<br />
NEJM 344, no. 19: 1443-49.<br />
Chien A T, Chin M H, Davis A M & Casalino L P. 2007. Pay for performance, public reporting, and racial disparities in<br />
health care: How are programs being designed? Med Care Res Rev 64: 283-304.<br />
Chin M H, Walters A E, Cook S C & Huang E S. 2007. Interventions to reduce racial and ethnic disparities in health<br />
care. Med Care Res Rev 64: 7-28.<br />
Clemenger BBDO. 2004. Encouraging Māori to Claim Their Entitlements: Qualitative Investigation, State of Mind,<br />
the strategic planning unit of Clemenger BBDO Wellington. Prepared for ACC.<br />
Colgate M, Nguyen V & Lee C. 2003. ‘Back From the Brink: An Analysis of Why <strong>New</strong> <strong>Zealand</strong>ers Remain With Their<br />
Service Providers’. Uni Auck Bus Rev 5, no. 1: 1-10.<br />
Comstock, L. Hooper E. Goodwin J. Goodwin J. 1982. ‘Physician Behaviours That Correlate With Patient<br />
Satisfaction. ‘ J Med Educ 57: 105-12.<br />
Cooper et al. 2002. ‘Designing and Implementing Interventions to Eliminate Racial and Ethnic Disparities in <strong>He</strong>alth<br />
Care. ‘ J Gen Int Med 17: 477-86.<br />
Cooper, LA et al. 2003. ‘Patient-Centered Communication, Ratings of Care, and Concordance of Patient and<br />
Physician Race’. Ann Intern Med 139, no. 11: 907-15.<br />
Cormack D, Robson B Purdie G et al. 2005. Access to Cancer Services for Māori: A Report Prepared for the Ministry<br />
of <strong>He</strong>alth, Wellington: Ministry of <strong>He</strong>alth and Wellington School of Medicine and <strong>He</strong>alth Sciences.<br />
Coulter A, Cleary P. 2002. ‘Measuring and Improving Patients’ Experiences: How Can We Make <strong>He</strong>alth Care Systems<br />
Work for Patients? ‘Measuring Up: Improving <strong>He</strong>alth Systems Performance in OECD Countries. Canada: OECD.<br />
<strong>He</strong> <strong>Ritenga</strong> <strong>Whakaaro</strong>: Māori experiences of health services | 79
6 References<br />
Coulter A. 2000. ‘The Patients Perspective Regarding Appropriate <strong>He</strong>alth Care’, 454-64. London: Sage.<br />
Coulter A. 2001. ‘Quality of Hospital Care: Measuring Patients’ Experiences’. Proceedings of the Royal College of<br />
Physicians of Edinburgh 31: 34-36.<br />
Coulter A. 2002. ‘Patients Views of the Good <strong>Doctor</strong>’. BMJ 325: 668-9.<br />
Cram F & Smith L. 2003. Māori women talk about accessing health care. <strong>He</strong> Pukenga Kōrero, 7, 1-8.<br />
Cram F, Smith L & Johnstone W. 2003. ‘Mapping Themes of Māori Talk About <strong>He</strong>alth’. NZMJ 116, no. 1170.<br />
Crandall, SJ et al. 1993. ‘Medical Students’ Attitudes Toward Providing Care for the Underserved. Are We Training<br />
Socially Responsible Physicians?’ JAMA 269, no. 19: 2519-23.<br />
Crandall, SJ et al. 1997. ‘A Longitudinal Investigation of Medical Student Attidutes Toward the Medically Indigent’.<br />
Teach Learn Med. 9, no. 4: 254-60.<br />
Crengle S, Lay-Yee R Davis P Pearson J. 2005. A Comparison of Māori and Non-Māori Patient Visits to <strong>Doctor</strong>s: The<br />
National Primary Medical Care Survey (NatMedCa): 2001/02, Report 6, Wellington: Ministry of <strong>He</strong>alth.<br />
Crengle S. 2000. ‘The Development of Māori Primary Care Services’. Pac <strong>He</strong>alth Dialog 7. no. 1: 48-53.<br />
Cromarty I. 1996. ‘What Do Patients Think About During Their Consultations? A Qualitative Study ‘. BrJ Gen Pract<br />
46: 525-28.<br />
Cross T, Brabazon B Dennis K & Isaacs M. 1989. Towards a Culturally Competent System of Care, Volume 1.<br />
Washington DC: Georgetown University Child Development Center.<br />
Crow, R. Gage H. Hampson S. Hart J. Kimber A. Storey L. Thomas H. 2002. ‘The Measurement of Satisfaction With<br />
<strong>He</strong>althcare’. <strong>He</strong>alth Technology Assessment 6, no. 32.<br />
Cunningham C. 1999. Responsive Research in Māori Education, a Paper Prepared for the Research Division,<br />
Ministry of Education, Wellington: Ministry of Education.<br />
Curtis, J. R. Patrick D. L. Caldwell E. Greenlee H. Collier A. C. 1999. ‘The Quality of Patient-<strong>Doctor</strong> Communication<br />
About End-of-Life Care: a Study of Patients With Advanced AIDS and Their Primary Care Clinicians’. AIDS 13, no.<br />
9: 1123-31.<br />
Dacey, B. 1998. ‘The Development of Quantitative Methods in Māori <strong>He</strong>alth Research: CATI Surveying’.<br />
Proceedings of Te Oru Rangahau.<br />
Davis A M, Vinci L M, Okwuosa T M, Chase A R & Huang E S. 2007. Cardiovascular health disparities: A systematic<br />
review of health care interventions. Med Care Res Rev 64: 29-100.<br />
Davis P, Lay-Yee R, Dyall L, Briant R, Sporle A, Brunt B & Scott A. 2006. ‘Quality of Hospital Care for Māori Patients<br />
in <strong>New</strong> <strong>Zealand</strong>: Retrospective Cross-Sectional Assessment’. Lancet 367: 1920-25.<br />
De La Cuesta, C. 1997. ‘An Exploratory Investigation of the Sources of Patient Satisfaction in Ambulatory Care’. Soc<br />
Sci <strong>He</strong>alth 3: 222-31.<br />
Devlin N, Hansen P & <strong>He</strong>rbison P. 2000. ‘Variations in Self-Reported <strong>He</strong>alth Status: Results From a <strong>New</strong> <strong>Zealand</strong><br />
Study’. NZ Med J 113, no. 1123: 517-20.<br />
Doescher MP et al. 2000. ‘Racial and Ethnic Disparities in Perceptions of Physician Style and Trust’. Arch Fam Med<br />
9, no. 10 (2000): 1156-63.<br />
Dowell MA. Rozell B. Roth D. Delugach H. Chaloux P. & Dowell J. 2004. ‘Economic and Clinical Disparities in<br />
Hospitalised Patients With Type 2 Diabetes. J Nurs Scholarsh 36, no. 1: 66-72.<br />
Druss B. Rosenheck R. & Sledge W. 2000. ‘<strong>He</strong>alth and Disability Costs of Depressive Illness in a Major U.S.<br />
Corporation. ‘ American Journal of Psychiatry 157, no. 8: 1274-78.<br />
Duff LA. Lamping D. L. & Ahmed L. B. 2001. ‘Evaluating Satisfaction With Maternity Carte in Women From Minority<br />
Ethnic Communities: Development and Validation of a Sylheti Questionnaire’. Int J Qual <strong>He</strong>alth Care 13, no. 3: 215-30.<br />
80 | <strong>He</strong> <strong>Ritenga</strong> <strong>Whakaaro</strong>: Māori experiences of health services
References 6<br />
Dulleck U & Kerschbamer R. 2006. ‘On <strong>Doctor</strong>s, Mechanics and Computer Specialists - The Economics of Credence<br />
Goods’. J Eco Lit 44, no. 1: 5-42.<br />
Durie MH. 2001. Mauri Ora: The Dynamics of Māori <strong>He</strong>alth. Auckland: Oxford University Press.<br />
Dyall L. 1999. ‘Māori Outcomes: Expectations of Mental <strong>He</strong>alth Services (1)’. Social Policy J NZ.<br />
Edgman-Levitan S & Cleary PD. 1996. ‘What Information Do Consumers Want and Need? ‘<strong>He</strong>alth Affairs 15, no. 4:<br />
42-56.<br />
Edwards, A et al. 2005. ‘Shared Decision Making and Risk Communication in Practice: A Qualitative Study of GPs’<br />
Experiences’. Br J Gen Pract 55, no. 510: 6-13.<br />
Ellison-Loschmann L, Cheng S & Pearce N. 2002. ‘Time Trends and Seasonal Patterns of Asthma Deaths and<br />
Hospitalisations Among Māori and Non-Māori’. NZMJ 115, no. 1146.<br />
Elwyn, G et al. 1999. ‘Shared Decision-Making in Primary Care; the Neglected Second Half of the Consultation’. Br J<br />
Gen Pract 49: 477-82.<br />
Fallowfield L, Hall A, Maguire GP & Baum M. 1990. ‘Psychological Outcomes of Different Treatment Policies in<br />
Women With Early Breast Cancer Outside a Clinical Trial’. Br Med J 301, no. 6752: 575-80.<br />
Falvo D & Tippy P. 1988. ‘Communicating Information to Patients--Patient Satisfaction and Adherence As Associated<br />
With Resident Skill. ‘ J Fam Prac 26: 643-47.<br />
Feldman R, Christianson J & Schultz J. 2000. ‘Do Consumers Use Information to Choose a <strong>He</strong>alth-Care Provider<br />
System? ‘ The Milbank Quarterly 78, no. 1: 47-77.<br />
Fiscella, K. et al. 2002. ‘Disparities in <strong>He</strong>alth Care by Race, Ethnicity, and Language Among the Insured: Findings<br />
From a National Sample’. Med Care 40, no. 1: 52-59.<br />
Fisher T L, Burnet D L, Huang E S, Chin M H & Cagney K A. 2007. Cultural leverage: Interventions using culture to<br />
narrow racial disparities in health care. Med Care Res Rev 64: 243-282.<br />
Fitzpatrick R. 1991. ‘Surveys of Patient Satisfaction: I Important General Considerations’. BMJ 302: 887-9.<br />
Ford S, Fallowfield L & Lewis S. 1996. ‘<strong>Doctor</strong>-Patient Interactions in Oncology’. Soc Sci Med 42, no. 11: 1511-19.<br />
Fowles, J. Kind E. and Braun B. 2000.‘Consumer Responses to <strong>He</strong>alth Plan Report Cards in Two Markets’. Medical<br />
Care 38, no. 5: 469-81.<br />
Franks P. et al. 2005. ‘Racial Disparities in the Content of Primary Care Office Visits’. J Gen Int Med 20, no. 7: 599-<br />
603.<br />
Geiger HJ. 2001. ‘Racial Stereotyping and Medicine: the Need for Cultural Competence’. CMAJ 164, no. 12: 1699-<br />
700.<br />
Gemson, D. H. et al. 1988. ‘Differences in Physician Prevention Practice for White and Minority Patients’. J<br />
Community <strong>He</strong>alth 13, no. 1: 53-64.<br />
Glover, M. 1997. ‘Kaupapa Māori <strong>He</strong>alth Research: A Developing Discipline’. Hui Whakatipu 1997.<br />
Green CR, Baker TA & Ndao-Brumblay SK. 2004.‘Patient Attitudes Regarding <strong>He</strong>althcare Utilisation and Referral: a<br />
Descriptive Comparison in African- and Caucasian Americans With Chronic Pain’. J Natl Med Assoc 96, no. 1: 31-<br />
42.<br />
Greene, M. Adelman R. Friedmann E. Charon R. 1994. ‘Older Patient Satisfaction With Communication During an<br />
Initial Medical Encounter’. Soc Sci Med 38: 1279-88.<br />
Gross, D. Zyzanski S. Borawski E. Cebul R. Stange K. 1998. ‘Patient Satisfaction With Time Spent With Their<br />
Physician’. J Fam Pract 47: 133-7.<br />
Hall J, Roter D Katz N. 1998. ‘Meta-Analysis of Correlates of Provider Behaviour in Medical Encounters’. Med<br />
Care 26: 657-75.<br />
<strong>He</strong> <strong>Ritenga</strong> <strong>Whakaaro</strong>: Māori experiences of health services | 81
6 References<br />
Hannan EL et al. 1999. ‘Access to Coronary Artery Bypass Surgery by Race/Ethnicity and Gender Among Patients<br />
Who Are Appropraite for Surgery’. Med Care 37, no. 1: 68-77.<br />
Hansson L, Bjorkman T & Berglund I. 1993. ‘What Is Important in Psychiatric Inpatient Care? Quality of Care From<br />
the Patient’s Perspective ‘. Qual Assur <strong>He</strong>alth Care 1993 5, no. 1: 41-7.<br />
Harris R, Tobias M, Jeffreys M, Waldegrave K, Karlsen S & Nazroo J. 2006. ‘Effects of Self-Reported Racial<br />
Discrimination and Deprivation on Māori <strong>He</strong>alth and Inequalities in <strong>New</strong> <strong>Zealand</strong>: Cross-Sectional Study’. The<br />
Lancet 367: 2005-0229.<br />
Harvey G. 2002. ‘A Step into the Light: Developing a Culturally Appropriate Research Process to Study Māori<br />
Rangatahi Perspectives of Leisure in One Setting’. Waikato Journal of Education: 8.<br />
Haviland MG. 2003. ‘Do <strong>He</strong>alth Care Ratings Differ by Race or Ethnicity?’ Jt Comm J Qual Saf 29, no. 3: 134-45.<br />
Hayes JA, Black N, Jenkinson C, Young CD, Rowan KM, Daly K & Ridley S. 2000. ‘Outcome Measures for Adult<br />
Critical Care: A Systematic Review’. <strong>He</strong>alth Technology Assessment 4: 1-110.<br />
<strong>He</strong>alth Waikato. 2001. <strong>He</strong> Whakawhaititanga O Ngā Ratonga Mate Huka Integrated Diabetes Project: A Cultural<br />
Stocktake of <strong>He</strong>alth Waikato Diabetes Service Investigating Māori Preferences for Service Delivery.<br />
<strong>He</strong>althcare Management Associates. 1997 ‘Prescription Presentation Rates in South Auckland’. <strong>He</strong>althcare<br />
Management Associates ProCare IPA.<br />
Holloway R, Matson C & Zismer D. 1989. ‘Patient Satisfaction and Selected Physician Behaviours: Does the Type of<br />
Practice Make a Difference?’ J Am Board Fam Pract 2: 87-92.<br />
Houkamau C. (2000). Identity and socio-historical context: Transformations and change among Māori women. PhD<br />
thesis. The University of Auckland.<br />
Howell, G and Hackwell K. 2003. ‘Why Don’t Māori and Pacific Children Get the Disability Allowance?’ Wellington:<br />
Downtown Community Ministry.<br />
Huygens I with Bluett M, Fiu E, Karanga J, Michie R, Ngatai M & Rawiri T. 1993. ‘Too personal, too sacred’<br />
Whakamaa & tapu. An evaluation of cervical screening delivery to Māori, Pacific Island, Asian and older Pākehā<br />
women in the Bay of Plenty. Auckland: WORKWISE Associates.<br />
Irwin K. 1994. Māori Research Methods and Processes: An Exploration, in Sites No 28, Massey University,<br />
Palmerston North.<br />
Isaacs M & Benjamin M. 1991. Towards a Culturally Competent System of Care, Volume II, Programs Which Utilise<br />
Culturally Competent Principles, Washington, D.C: Georgetown University Child Development Center, CASSP<br />
Technical Assistance Center.<br />
Jackson J, Chamberlain J & Kroenke K. 2001. ‘Predictors of Patient Satisfaction ‘. Soc Sci Med 52: 609-20.<br />
Jansen P. 1998. ‘Improving Consultations With Māori Clients’. NZFamPhys 25, no. 2.<br />
Jenkinson C (Ed). 1997. Assessment and Evaluation of <strong>He</strong>alth and Medical Care. Buckingham: Open University<br />
Press, 1997.<br />
Jenkinson C, Coulter A, Bruster S, Chandola T & Jones P. 2003. ‘Factors Relating to Patients’ Reports About Hospital<br />
Care for Coronary <strong>He</strong>art Disease in England’. J <strong>He</strong>alth Serv Res Policy 8: 83-86.<br />
Jenkinson C, McGee H. 1998. <strong>He</strong>alth Status Measurement: A Brief but Critical Introduction. Oxford: Radcliffe<br />
Medical Press.<br />
Johnson, R. L. Roter D. Powe N. R. Cooper L. A. 2004. ‘Patient Race/Ethnicity and Quality of Patient-Physician<br />
Communication During Medical Visits’. Am J Public <strong>He</strong>alth 94, no. 12: 2084-90.<br />
Johnstone K & Read J. 2000. ‘Psychiatrists’ Recommendations for Improving Bicultural Training and Māori Mental<br />
<strong>He</strong>alth Services: a <strong>New</strong> <strong>Zealand</strong> Survey’. Australian and <strong>New</strong> <strong>Zealand</strong> Journal of Psychiatry 34: 135-45.<br />
82 | <strong>He</strong> <strong>Ritenga</strong> <strong>Whakaaro</strong>: Māori experiences of health services
References 6<br />
Jung HP, Wensing M, Olesen F & Grol R. 2002.‘Comparison of Patients’ and General Practitioners’ Evaluations of<br />
General Practice Care’. Qual Saf <strong>He</strong>alth Care 11, no. 4: 315-19.<br />
Kaiser Family Foundation. 1999. Survey of Race, Ethnicity, and Medical Care: Public Perceptions and Experiences.<br />
Washington DC: <strong>He</strong>nry J Kaiser Family Foundation.<br />
Kenny D. 1995. ‘Determinants of Patient Satisfaction With the Medical Consultation’. Psychol <strong>He</strong>alth 10: 427-37.<br />
Kent Smith C, Polis E and Hadac R. 1981. ‘Characteristics of the Initial Medical Interview Associated With Patient<br />
Satisfaction and Understanding ‘.J Fam Pract 12: 283-8.<br />
Kerse N et al. 2004. ‘Physician-Patient Relationship and Medication Compliance: A Primary Care Investigation’.<br />
Annals of Family Medicine 2, no. 5.<br />
Korsch B, Gozzi E & Francis V. 1968. ‘Gaps in <strong>Doctor</strong>-Patient Communication: 1 <strong>Doctor</strong>-Patient Interaction and<br />
Patient Satisfaction ‘.Pediatrics 42: 855-71.<br />
Krupat E, Bell RA Kravitz RL Thom D Azari R. ‘When Physicians and Patients Think Alike: Patient-Centered Beliefs<br />
and Their Impact on Satisfaction and Trust’. J Fam Pract 50, no. 12 (2001): 1057-62.<br />
Krupat E, Fancey M & Cleary P. 2000. ‘Information and Its Impact on Satisfaction Among Surgical Patients‘. Soc Sci<br />
Med 51: 1817-25.<br />
Kvamme, OJ & Hjortdahl P. 1997. ‘The Good General Practice Norwegian Patients’ Evaluation and Priorities ‘.<br />
Tidsskr Nor Laegeforen 117: 2607-9.<br />
LaFond AK, Brown L & Macintyre K. 2002. Mapping capacity in the health sector: a conceptual framework.<br />
International Journal of <strong>He</strong>alth Planning and Management, 17, 3-22.<br />
Lamont EB & Christakis NA. 2001. ‘Prognostic Disclosure to Patients With Cancer Near the End of Life’. Ann Intern<br />
Med 134, no. 12: 1096-105.<br />
Laugesen M. 2000. Tobacco Statistics 2000, Wellington: Cancer Society of NZ Inc.<br />
LaVeist TA and Nuru-Jeter A. 2002. ‘Is <strong>Doctor</strong>-Patient Race Concordance Associated With Greater Satisfaction With<br />
Care?’ J <strong>He</strong>alth Soc Behav 43, no. 3: 296-306.<br />
LaVeist TA et al. 2002. ‘Physician Referral Patterns and Race Differences in Receipt of Coronary Angiography’.<br />
<strong>He</strong>alth Serv Res 37, no. 4: 949-62.<br />
LaVeist, TA et al. 2003.‘The Association of <strong>Doctor</strong>-Patient Race Concordance With <strong>He</strong>alth Services Utilisation’. J<br />
Public <strong>He</strong>alth Policy 24, no. 3-4: 312-23.<br />
Lee SJ, Back AL Block SD & Stewart SK. 2002. ‘Enhancing Physician-Patient Communication’. Am Soc of<br />
<strong>He</strong>matology.<br />
Leiper D, Elliott A & Hannaford P. 2006. ‘Experiences and Perceptions of People With <strong>He</strong>adache: a Qualitative Study<br />
‘. BMC Fam Pract 7, no. 27.<br />
Lieu et al. 2004. ‘Cultural Competence Policies and Other Predictors of Asthma Care Quality’. PEDIATRICS 114, no.<br />
1: e102-e110.<br />
Lillie-Blanton M et al. 2000.‘Race, Ethnicity, and the <strong>He</strong>alth Care System: Public Perceptions and Experiences’. Med<br />
Care Res Rev. 57, Suppl 1: 218-35.<br />
Lillie-Blanton M, Rushing OE & Ruiz S. 2002. Racial/Ethnic Differences in Cardiac Care:The Weight of the Evidence,<br />
Menlo Park, California: <strong>He</strong>nry J. Kaiser Family Foundation.<br />
Linnell PG. 2005. ‘Customer Satisfaction: Can You Bank on It? ‘ Customer Excel 2: 17-20.<br />
Little, P. Everitt H. Williamson I. Warner G. Moore M. Gould C. Ferrier K. & Payne S. ‘Observational Study of Effect of<br />
Patient Centeredness and Positive Approach on Outcomes of General Practice Consultations’. BMJ 323 (2001): 908-11.<br />
Lynch J & Kanuku G. 1990. Evaluation of the Nelson Pilot Cervical Screening Project. MoH Library 496-2133<br />
<strong>He</strong> <strong>Ritenga</strong> <strong>Whakaaro</strong>: Māori experiences of health services | 83
6 References<br />
Mackenback J P. 2002. Income inequality and population. BMJ, 324:1-2.<br />
Maguire P. 1999.‘Improving Communication With Cancer Patients’. Eur J Cancer 35, no. 10: 1415-22.<br />
Maheux B & Beland F. 1987.‘Changes in Students; Sociopolitical Attitudes During Medical School: Socialization or<br />
Maturation Effect?’ Soc Sci Med 24, no. 7: 619-24.<br />
Marvel MK, Epstein RM, Flowers K & Beckman HB. 1999. ‘Soliciting the Patient’s Agenda: Have We Improved?’<br />
JAMA 281, no. 3: 283-7.<br />
Masi C M, Blackman D J & Peek M E. 2007. Interventions to enhance breast cancer screening, diagnosis, and<br />
treatment among racial and ethnic minority women. Med Care Res Rev 64: 195-242.<br />
Mauri Ora Associates. 2002. ‘Literature Review Development of Competencies for the <strong>New</strong> <strong>Zealand</strong> Cervical<br />
Screening Workforce‘. Auckland: Mauri Ora Associates.<br />
McCreanor T & Nairn R. 2002. ‘Tauiwi General Practitioners’ Explanations of Māori <strong>He</strong>alth: Colonial Relations in<br />
Primary <strong>He</strong>althcare in Aotearoa/<strong>New</strong> <strong>Zealand</strong>’. J <strong>He</strong>alth Psychol 7, no. 5: 509-18.<br />
McFall SL, Solomon TG, Smith DW & Kelley M. 2001. ‘Preventive Services and Satisfaction of Cherokee Nation<br />
Patients’. J Public <strong>He</strong>alth Manag Pract 7, no. 1: 76-83.<br />
McNaughton H, Weatherall M, McPherson K, Taylor W & Harwood M. 2002. ‘The Comparability of Resource<br />
Utilisation for Europeans and Non-European Survivors of Stroke in <strong>New</strong> <strong>Zealand</strong>’. NZMJ 115, no. 1149.<br />
McNaughton, H. Weatherall M. McPherson K. Taylor W. & Harwood M. 2002. ‘The Comparability of Community<br />
Outcomes for European and Non-European Survivors of Stroke in <strong>New</strong> <strong>Zealand</strong> ‘. NZMJ 115, no. 1149: 98-100.<br />
Mechanic D & Meyer S. 2000.‘Concepts of Trust Among Patients With Serious Illness’. Soc Sci Med 51: 657-68.<br />
Middleman AB. 2004. ‘Race/Ethnicity and Gender Disparities in the Utilisation of a School-Based <strong>He</strong>patitis B<br />
Immunisation Initiative. ‘ J Adolesc <strong>He</strong>alth 34, no. 5: 414-9.<br />
Miller, S. 1996. ‘Equality, Morality, and the <strong>He</strong>alth of Democracy’. Philadelphia: Temple University Press.<br />
Minister of <strong>He</strong>alth. 2000. The <strong>New</strong> <strong>Zealand</strong> <strong>He</strong>alth Strategy. Wellington: Ministry of <strong>He</strong>alth.<br />
Ministry of <strong>He</strong>alth and University of Otago. 2006. Decades of Disparity III: Ethnic and Socioeconomic Inequalities in<br />
Mortality, <strong>New</strong> <strong>Zealand</strong> 1981-1999, Wellington: Ministry of <strong>He</strong>alth.<br />
Ministry of <strong>He</strong>alth. 1999. Taking the Pulse: The 1996/97 <strong>New</strong> <strong>Zealand</strong> <strong>He</strong>alth Survey. Wellington: Ministry of<br />
<strong>He</strong>alth.<br />
Ministry of <strong>He</strong>alth. 2001. Tobacco Facts, Wellington: Ministry of <strong>He</strong>alth.<br />
Ministry of <strong>He</strong>alth. 2002. Reducing Inequalities in <strong>He</strong>alth, Wellington: Ministry of <strong>He</strong>alth.<br />
Ministry of <strong>He</strong>alth. 2004b. A Portrait of <strong>He</strong>alth: Key Results of the 2002/03 <strong>New</strong> <strong>Zealand</strong> <strong>He</strong>alth Survey, Wellington:<br />
Ministry of <strong>He</strong>alth.<br />
Ministry of <strong>He</strong>alth. 2005. ‘CBG <strong>He</strong>alth Research Reducing Inequalities Contingency Funding Evaluation’.<br />
URL:http://www.moh.govt.nz. Accessed 1 December 2005.<br />
Ministry of <strong>He</strong>alth. 2005b. <strong>He</strong>alth and Participation: An Active Agenda Advice to the Incoming Minister of <strong>He</strong>alth,<br />
Wellington: Ministry of <strong>He</strong>alth.<br />
Ministry of <strong>He</strong>alth. 2005c. Decades of Disparity II: Socioeconomic mortality trends in <strong>New</strong> <strong>Zealand</strong>, 1981-1999,<br />
Wellington: Ministry of <strong>He</strong>alth.<br />
Ministry of <strong>He</strong>alth. 2006. Tatau Kahukura: Māori <strong>He</strong>alth Chart Book, Public <strong>He</strong>alth Intelligence Monitoring Report<br />
No.5, Wellington: Ministry of <strong>He</strong>alth.<br />
Ministry of <strong>He</strong>alth. 2007. ‘DHB Hospital Benchmark Reports’. Wellington: Ministry of <strong>He</strong>alth. URL:http://www.<br />
moh.govt.nz. Accessed 19 January 2007.<br />
84 | <strong>He</strong> <strong>Ritenga</strong> <strong>Whakaaro</strong>: Māori experiences of health services
References 6<br />
Mukamel, D. B. et al. 2000. ‘Racial Differences in Access to High-Quality Cardiac Surgeons’. Am J Public <strong>He</strong>alth 90,<br />
no. 11: 1774-7.<br />
Murray-Garcia JL, Selby JV, Schmittdiel J, Grumbach K & Quesenberry CP. 2000. ‘Racial and Ethnic Differences in<br />
a Patient Survey: Patients’ Values, Ratings, and Reports Regarding Physician Primary Care Performance in a Large<br />
<strong>He</strong>alth Maintenance Organisation’. Jr Med Care 38, no. 3: 300-10.<br />
Nair G. 2003. Nurturing capacity in developing countries: From consensus to practice. Capacity Enhancement Briefs<br />
No. 1, Washington, D.C.: World Bank.<br />
<strong>New</strong>some PRH & Wright GH. 1999. ‘A Review of Patient Satisfaction: Concepts of Satisfaction’. Br Dental J 186, no.<br />
4: 161-5.<br />
Nicholls W & Jaye C. 2002. ‘Opting Out: Why Patients Change <strong>Doctor</strong>s ‘. NZFP 29, no. 6.<br />
Parchman ML & Burge SK. 2004.‘The Patient-Physician Relationship, Primary Care Attributes, and Preventive<br />
Services’. Family Medicine 36, no. 1: 22-7.<br />
Peek M E, Cargill A & Huang S. 2007. Diabetes health disparities: A systematic review of health care interventions.<br />
Med Care Res Rev 64: 101-156.<br />
Penn NE, Kar S Kramer J Skinner J & Zambrana RE. 1995.‘Ethnic Minorities, <strong>He</strong>alth Care Systems, and Behavior’.<br />
<strong>He</strong>alth Psychology 14, no. 7: 641-6.<br />
Penney L. 2005. Māori and <strong>He</strong>alth Practitioners Talk About <strong>He</strong>art Disease. Draft Summary Report on Phase 1<br />
Findings, Palmerston North: Massey University.<br />
Perkins MRV, Devlin NJ & Hansen P. 2004. The validity and reliability of EQ-5D health state valuations in a survey of<br />
Māori. Quality of Life Research, 13 (1), 271-274.<br />
Persaud, R. 2005. ‘How to Improve Communication With Patients’. BMJ Career Foc: 136-7.<br />
Peterson, Eric D. et al. 1997. ‘Racial Variation in the Use of Coronary-Revasculariszation Procedures’. The <strong>New</strong><br />
England Journal of Medicine: 480-486.<br />
Picker Institute Europe. 2005. ‘National <strong>He</strong>alth Service Patient Survey’. http://www.pickereurope.org/page.<br />
php?id=45 accessed 1 April 2006<br />
Pihama L. 1993. Tungia Te Ururua Kia Tupu Whakaritorito Te Tupu o Te Harakeke: A Critical Analysis of Parents As<br />
First Teachers. Auckland: Department of Education, The University of Auckland.<br />
Pihama L. 2001. Tihei Mauri Ora: Honouring Our Voices: Mana Wāhine As a Kaupapa Māori Theoretical<br />
Framework. Auckland: University of Auckland.<br />
Pillittere D, Bigley M, Hibbard J & Pawlson G. 2003. Exploring Consumer Perspectives On Good Physician Care: A<br />
Summary Of Focus Group Results, <strong>New</strong> York: Commonwealth Fund.<br />
ProCare <strong>He</strong>alth Limited. 1995. ‘Improving the Quality of <strong>He</strong>althcare. A Research Report Designed to Identify How<br />
Best to Improve the Quality of <strong>He</strong>althcare in a Way That Is Beneficial to Patients and to GPs. Unpublished Report<br />
Prepared for David Cashmore: ProCare <strong>He</strong>alth Limited.<br />
Quinn Paton M. 2002. Qualitative research & evaluation methods, 3rd Edition. Thousand Oaks: Sage Publications.<br />
Rameka R. 2006. <strong>He</strong> arakanihi ki te oranga. Report to the <strong>He</strong>alth Research Council of <strong>New</strong> <strong>Zealand</strong> on a Rangahau<br />
Hauora Award. Wellington: Te Röpü Rangahau Hauora a Eru Pömare.<br />
Rao M, Clarke A, Sanderson C & Hammersley R. 2006. ‘Patients’ Own Assessments of Quality of Primary Care<br />
Compared With Objective Records Based Measures of Technical Quality of Care: Cross Sectional Study’. BMJ 333,<br />
no. 19.<br />
Rathore SS et al. 2000. ‘The Effects of Patient Sex and Race on Medical Students’ Ratings of Quality of Life’. Am J<br />
Med 108, no. 7: 561-66.<br />
<strong>He</strong> <strong>Ritenga</strong> <strong>Whakaaro</strong>: Māori experiences of health services | 85
6 References<br />
Ratima MM, Ratima KH, Durie MH & Potaka UK. 1993. Te Runanganui Taura <strong>He</strong>re o Manawatu Incorporated: <strong>He</strong>alth<br />
needs assessment survey. Palmerston North: Te Pumanawa Hauora, Department of Māori Studies, Massey University.<br />
Reid P. 1998 ‘The Impact That Māori Have Made on <strong>He</strong>alth and Society in <strong>New</strong> <strong>Zealand</strong>’. Auckland: Oxford<br />
University Press.<br />
Richardson A, Thomas V N & Richardson A. 2006. “Reduced to nods and smiles”: Experiences of professionals<br />
caring for people with cancer from black and ethnic minority groups. Eur J Oncol Nurs 10:93-101.<br />
Robbins J, Bertakis K, <strong>He</strong>lms J, Azari R, Callahan E & Creten D. 1993. ‘The Influence of Physician Practice<br />
Behaviours on Patient Satisfaction.’ Fam Med 25, no. 17-20.<br />
Roberts CS, Cox CE, Reintgen DS, Baile WF & Givertini M. 1994. ‘Influence of Physician Communication on <strong>New</strong>ly<br />
Diagnosed Breast Cancer Patients’ Psychologic Adjustment and Decision-Making’. Cancer 74, no. 1 supp: 336-41.<br />
Robson, B & Harris R, eds. 2007. Hauora. Māori Standards of <strong>He</strong>alth IV - A study of the years 2000-2005.<br />
Wellington: Te Röpü Rangahau Hauora a Eru Pömare.<br />
Ruakere T. 1998. ‘A Comparative Study of Māori Use of an Iwi General Practice and Mainstream General Practice’.<br />
Te Oru Rangahau, Māori Research and Development Conference. Palmerston North: Massey University.<br />
Sadler L, McCowan L & Stone P. 2002. ‘Associations Between Ethnicity and Obstetric Intervention in <strong>New</strong> <strong>Zealand</strong>’.<br />
NZMJ 115, no. 1147.<br />
Saha S, Arbelaez JJ & Cooper LA. 2003. ‘Patient-Physician Relationships and Racial Disparities in the Quality of<br />
<strong>He</strong>alth Care’. Am J Public <strong>He</strong>alth 93, no. 10: 1713-9.<br />
Schoen C, Osborn R, Huynh P, Doty M, Davis K, Zapert K & Peugh JP. 2004. Primary Care and <strong>He</strong>alth System<br />
Performance: Adults Experiences in Five Countries <strong>He</strong>alth Affairs. <strong>New</strong> York: The Commonwealth Fund.<br />
Schoen, C. Blendon R. Des Roches C. et al. 2002. <strong>New</strong> <strong>Zealand</strong> Adults’ <strong>He</strong>alth Care System Views and Experiences,<br />
2001: Findings From the Commonwealth Fund 2001. International <strong>He</strong>alth Policy Survey. <strong>New</strong> York: The<br />
Commonwealth Fund.<br />
Schouten B C, Meeuwesen L, Tromp F & Harmsen H A M. 2007. Cultural diversity in patient participation: The<br />
influence of patients’ characteristics and doctors’ communicative behaviour. Patient Educ Couns 67:214-223.<br />
Schulman KA et al. 1999. ‘The Effect of Race and Sex on Physicians’ Recommendations for Cardiac Catheterisation’.<br />
NEJM 340, no. 8: 618-26.<br />
Scott KM, Marwick JC, Crampton PR. 2003 Utilization of general practitioner services in <strong>New</strong> <strong>Zealand</strong> and its<br />
relationship with income, ethnicity and government subsidy. <strong>He</strong>alth Serv Manage Res. Feb;16(1):45-55<br />
Scott KM, Sarfati D Tobias MI Haslett SJ. 2000. ‘A Challenge to the Cross Cultural Validity of the SF 36 <strong>He</strong>alth Survey:<br />
Factor Structure in Māori, Pacific and <strong>New</strong> <strong>Zealand</strong> European Ethnic Groups.’ Soc Sci Med 51, no. 11: 1655-64.<br />
Skegg D et al. 2002. ‘Comparison of Cancer Mortality and Incidence in <strong>New</strong> <strong>Zealand</strong> and Australia’. NZMJ 115, no.<br />
1153.<br />
Smedley B D, Stith A Y & Nelson A R, eds. 2002. Unequal treatment: Confronting racial and ethnic disparities in<br />
health care. Committee on Understanding and Eliminating Racial and Ethnic Disparities in <strong>He</strong>alth Care: Board on<br />
<strong>He</strong>alth Sciences Policy, Institute of Medicine. Washington, DC: National Academics Press.<br />
Smiler K. 2006. ‘Māori Deaf: Perceptions of Cultural and Linguistic Identity’. Mauri Ora Symposium. Wellington.<br />
Smith GH. 1990. ‘Research Issues Related to Māori Education’. NZARE Special Interests Conference, University of<br />
Auckland.<br />
Smith LT. 1999. Decolonizing Methodologies: Research in Indigenous Peoples. Dunedin: University of Otago Press.<br />
Solís B & Rodríguez FM. 2002. ‘Listening to Client Voices: Using Focus Groups and Individual Surveyors to Gather<br />
Information’. Third National Conference on Quality <strong>He</strong>alth Care for Culturally Diverse Populations: Advancing<br />
Effective <strong>He</strong>alth Care Through Systems Development, Data, and Measurement, Chicago.<br />
86 | <strong>He</strong> <strong>Ritenga</strong> <strong>Whakaaro</strong>: Māori experiences of health services
References 6<br />
Sporle A, Pearce N & Davis P. 2002. ‘Social Class Mortality Differences in Māori and Non-Māori Men Aged 15-64<br />
During the Last Two Decades’. NZMJ 115, no. 1150.<br />
Staniszewska S. 1999. ‘Patient Expectations and <strong>He</strong>alth Related Quality of Life’. <strong>He</strong>alth Expectations 2: 93-104.<br />
Statistics <strong>New</strong> <strong>Zealand</strong>. 2002. Key Statistics 2002, Census Snapshot: Māori, Statistics <strong>New</strong> <strong>Zealand</strong>, URL: http://<br />
www.stats.govt.nz/NR/rdonlyres/DA0261AA-D7C7-4432-9297-D1B603F87AB7/0/CenMāori.pdf. Accessed on 1<br />
April 2006.<br />
Steele K. 1992. ‘Patients As Experts: Consumer Appraisal of <strong>He</strong>alth Services ‘. Public Money Manage (Oct-Dec):<br />
31-7.<br />
Steinberg AG, Wiggins EA, Barmada CH & Sullivan VJ. 2002. ‘Deaf Women: Experiences and Perceptions of<br />
<strong>He</strong>althcare System Access’. J Womens <strong>He</strong>alth 11, no. 8: 729-41.<br />
Stewart M. 1989. ‘Which Facets of Communication Have Strong Effects on Outcome a Meta-Analysis ‘., 183-96.<br />
<strong>New</strong>bury Park, CA: SAGE.<br />
Stewart MA. 1995. ‘Effective Physician-Patient Communication and <strong>He</strong>alth Outcomes: A Review’. CMAJ 152, no. 9:<br />
1423-33.<br />
Stiles W, Putnam S, Wolf M & James S. 1979. ‘Interaction Exchange Structure and Patient Satisfaction With Medical<br />
Interviews’. Med Care 27: 667-81.<br />
Taira DA, Safran DG, Seto TB, Rogers WH, Inui TS, Montgomery J & Tarlov AR. 2001. ‘Do Patient Assessments of<br />
Primary Care Differ by Patient Ethnicity?’ <strong>He</strong>alth Serv Res 36, no. 6 PT 1: 1059-71.<br />
Taylor S L. 2004. The role of culturally competent communication in reducing ethnic and racial healthcare<br />
disparities. Am J Manag Care, 10:SP1-SP4.<br />
Te Puni Kōkiri. 2000. Progress Towards Closing Social and Economic Gaps Between Māori and Non- Māori: A<br />
Report to the Minister of Māori Affairs, Wellington: Te Puni Kōkiri.<br />
Te Puni Kōkiri. 2002. Survey of the <strong>He</strong>alth of the Māori Language in 2001: A Report to the Minister of Māori<br />
Affairs, Wellington: Te Puni Kōkiri.<br />
The George Washington University Medical Center. 2007. Expecting Success: Excellence in Cardiac Care. Firstyear<br />
achievements signal big improvements in heart care for minority patients. March 2007. Washington DC: The<br />
George Washington University Medical Center. (Accessed April 11, 2008 at: www.expectingsuccess.org)<br />
The Radford Group. 1996. A Survey of Determinants of Patient Satisfaction With GP in Auckland, Radford Group<br />
report to ProCare <strong>He</strong>alth Ltd.<br />
Thompson AGH & Sunol R. 1995. ‘Expectations As Determinants of Patient Satisfaction: Concepts, Theory and<br />
Evidence ‘. International Journal for Quality in <strong>He</strong>alth Care 7, no. 2: 127-41.<br />
Todd KH et al. 1993. ‘Ethnicity As a Risk Factor for Inadequate Emergency Department Analgesia’. JAMA 269:<br />
1537-39.<br />
Treadway J. 1983. ‘Patient Satisfaction and the Content of General Practice Consultations ‘. J R Coll Gen Pract 33:<br />
769-71.<br />
Tukuitonga C & Bindman A. 2002. ‘Ethnic and Gender Differences in the Use of Coronary Artery Revascularisation<br />
Procedures in <strong>New</strong> <strong>Zealand</strong>’. NZMJ 115, no. 1152.<br />
Tulsky JA, Chesney MA & Lo B. 1996. ‘See One, Do One, Teach One? House Staff Experience Discussing Do-Not-<br />
Resuscitate Orders’. Arch Intern Med 156, no. 12: 1285-89.<br />
Vaccarino V et al. 2005. ‘Sex and Reacial Differences in the Management of Acute Myocardial Infarction, 1994<br />
Through 2002’. NEJM 353, no. 7: 671-82.<br />
Van Ryn M & Fu SS. 2003. ‘Paved With Good Intentions: Do Public <strong>He</strong>alth and Human Service Providers Contribute<br />
to Racial/Ethnic Disparities in <strong>He</strong>alth’. Am J Pub <strong>He</strong>alth 93, no. 2: 248-55.<br />
<strong>He</strong> <strong>Ritenga</strong> <strong>Whakaaro</strong>: Māori experiences of health services | 87
6 References<br />
Van Voorhees B W, Walters A E, Prochaska M & Quinn M T. 2007. Reducing health disparities in depressive<br />
disorders outcomes between non-Hispanic Whites and ethnic minorities: A call for pragmatic strategies over the life<br />
course. Med Care Res Rev 64: 157-194.<br />
Van Zanten M, Boulet JR & McKinley DW. 2004. ‘The Influence of Ethnicity on Patient Satisfaction in a Standardized<br />
Patient Assessment’. Academic Medicine 79: S15-S17.<br />
Wartman S, Morlock L, Malitz F & Palm E. 1983. ‘Patient Understanding and Satisfaction As Predictors of<br />
Compliance’. Med Care 21: 886-91.<br />
Wensing M. 1998. ‘A Systematic Review of the Literature on Patient Priorities for General Practice Care. Part 1:<br />
Description of the Research Domain’. Soc Sci Med 47: 1573-88.<br />
Westbrooke I, Baxter J & Hogan J. 2001. ‘Are Māori Underserved for Cardiac Interventions?’ NZMJ 114, no. 1143.<br />
Williams RL et al. 2001. ‘Race and Preventive Services Delivery Among Black Patients and White Patients Seen in<br />
Primary Care’. Med Care 39, no. 11: 1260-1267.<br />
Wilson, E et al. 2004. ‘Medical Student, Physician, and Public Perceptions of <strong>He</strong>alth Care Disparities’. Fam Med 36,<br />
no. 10: 715-21.<br />
Zeithaml VA, Berry LL & Parasuraman A. 1993. ‘The Nature and Determinants of Customer Expectations of Service’.<br />
Journal of the Academy of Marketing Science 21, no. 1: 1-12.<br />
Zgibor JC & Simmons D. 2002. ‘Barriers to Blood Glucose Monitoring in a Multiethnic Community’. Diabetes Care<br />
25, no. 10: 1772-7.<br />
88 | <strong>He</strong> <strong>Ritenga</strong> <strong>Whakaaro</strong>: Māori experiences of health services
Kupu Māori 7<br />
The Advisory Komiti was asked to give advice on appropriate kupu Māori for the project and the reports. A list of<br />
kupu was provided by the Komiti and updated at successive meetings, following discussions:<br />
An appropriate Māori title for the overall project was discussed. Proposed project titles were “People like me: Māori<br />
experiences of health services” or “<strong>He</strong> ritenga whakaaro: Māori experiences of health services”<br />
Kupu Māori for the following were discussed, and conclusions about the preferred terms to describe consumers or<br />
users of services or patients are noted below:<br />
a) kiritaki (source; Taura Whiri), consumer, customer<br />
b) hunga whai wāhi (Modern Usage Māori dictionary), user<br />
c) turoro (Williams, Ngata) patient<br />
d) tangata whai ora (common usage mental health, often abbr; whaiora), patient<br />
e) hunga whara (common usage) people with injuries<br />
Following discussion the following terms/kupu were confirmed:<br />
te hunga whai oranga<br />
turoro<br />
te hunga hauā<br />
hauā me te hauā kore rānei<br />
kaupapa raha<br />
whara<br />
hauā<br />
hunga hauā<br />
hauātanga<br />
kohekohe, kopa, hauā<br />
hauare<br />
matapō, kāpō<br />
turi<br />
wahangu<br />
toti, koki, totitoti<br />
kutiwera<br />
nawe, riwha<br />
consumers of health services<br />
patient<br />
people with disabilities<br />
sub-terms for those with disability and those without<br />
disabilities<br />
health services that are not Kaupapa Māori<br />
injure, injury (a temporary state)<br />
disabled (person) (a permanent state)<br />
disabled people (the group of people with disabilities)<br />
impediment<br />
lame<br />
speech impediment<br />
blind<br />
deaf<br />
silent (unable to speak)<br />
limp<br />
scarred by burns<br />
scar<br />
<strong>He</strong> <strong>Ritenga</strong> <strong>Whakaaro</strong>: Māori experiences of health services | 89
8 Glossary<br />
Aotearoa — <strong>New</strong> <strong>Zealand</strong> (the land of the long white cloud)<br />
atua — supernatural being<br />
hapū — sub-tribe<br />
hara — offence, fault, violation of tapu<br />
hauā pekewhā — quadraplegic<br />
hauāuki — permanently disabled<br />
hauora — health<br />
hinengaro — mind, emotion<br />
hui — meeting<br />
iwi — tribe<br />
kai — food<br />
kaiāwhina — helper, assistant<br />
kāinga — house, cluster of dwellings, village<br />
karakia — incantation, charm, prayer<br />
kanohi kitea — a familiar face<br />
kanohi ki te kanohi — face to face<br />
kaumātua — elder<br />
kaupapa — subject, plan, scheme, proposal<br />
kawa — Māori protocols<br />
koha — donation or contribution<br />
kōhanga reo — Māori language pre-school<br />
kuia — female elder<br />
kura kaupapa — Māori language school<br />
mana — power, influence, prestige, authority<br />
marae — public area in front of a meeting house<br />
mate — sick, dead<br />
mate Māori — illness for which there is no obvious physical cause<br />
mate taua — accident, injury sustained through combat<br />
mirimiri — traditional form of massage<br />
mokopuna — child, grandchild<br />
nakawhiti — fit (able-bodied)<br />
nēhi — nurse<br />
Ngāti Kāpō — the Māori blind group<br />
noa — free from tapu, common, profane<br />
noho whakaiti — modesty (a lowly position of honour)<br />
Pae ārahi/Pou ārahi — ACC Māori cultural advisors<br />
90 | <strong>He</strong> <strong>Ritenga</strong> <strong>Whakaaro</strong>: Māori experiences of health services
Glossary 8<br />
Pākehā — person of European descent<br />
pakeke — adults<br />
pokanga — surgery<br />
rāhui — prohibition order, temporary imposition of tapu<br />
rangatahi — young adults, young person<br />
rata — doctor<br />
reo — language<br />
ritenga — habit, practice, similarity<br />
rohe — district<br />
rongoā — Māori treatments including herbal remedies (rongoā rākau)<br />
takawaenga — an intermediary or go-between<br />
tangata whenua — people of the land, indigenous<br />
tāne — men<br />
taonga — property, anything highly prized<br />
tapu — sacred, off limits<br />
tauiwi — foreign race<br />
Te Kaporeihana Āwhina Hunga Whara — The Accident Compensation Corporation<br />
Te Puni Kōkiri — The Ministry of Māori Development<br />
tikanga — Māori customs and codes of behaviour<br />
tūpāpaku — body (of a deceased person)<br />
wāhine — women<br />
wai — water<br />
wairua — spirit, spiritual<br />
whakaaro — consensus, feelings and opinions<br />
whakamā — ashamed, excessive shyness<br />
whakapapa — genealogy<br />
whakataukī — saying, proverb<br />
whanaungatanga — family relationships or togetherness<br />
whānau — family<br />
whare — house, building<br />
whare tapa whā — four-dimensional Māori perspective of health<br />
whare wānanga — traditional Māori house of learning<br />
For additional information on kupu Māori in relation to health and disability or injury, see <strong>He</strong> pukapuka reo hauora<br />
Māori, David Jansen, Ahuru Press 2005. Available from Mauri Ora Associates.<br />
<strong>He</strong> <strong>Ritenga</strong> <strong>Whakaaro</strong>: Māori experiences of health services | 91
9 Appendices<br />
Appendix A. Literature review methodology . . . . . . . . . . . . . . . . . . . . . . . . . . . . . . . . . . . . . . . . . . . . . . . . . 93<br />
Appendix B. Hui data . . . . . . . . . . . . . . . . . . . . . . . . . . . . . . . . . . . . . . . . . . . . . . . . . . . . . . . . . . . . . . . . . . . 94<br />
Appendix C. Explanatory letter . . . . . . . . . . . . . . . . . . . . . . . . . . . . . . . . . . . . . . . . . . . . . . . . . . . . . . . . . . . . 98<br />
Appendix D. Survey questionnaire . . . . . . . . . . . . . . . . . . . . . . . . . . . . . . . . . . . . . . . . . . . . . . . . . . . . . . . . 101<br />
Appendix E. Survey respondents’ nearest town, city or area . . . . . . . . . . . . . . . . . . . . . . . . . . . . . . . . . . . . 113<br />
Appendix F. Detailed information about analyis of survey questionnaire . . . . . . . . . . . . . . . . . . . . . . . . . . . 114<br />
Appendix G. Questionnaire reliability and validity . . . . . . . . . . . . . . . . . . . . . . . . . . . . . . . . . . . . . . . . . . . . 115<br />
Appendix H. Modelling analysis of overall satisfaction and revisit intention . . . . . . . . . . . . . . . . . . . . . . . . 119<br />
Appendix I. Demographics for Group 1 and Group 2 . . . . . . . . . . . . . . . . . . . . . . . . . . . . . . . . . . . . . . . . . . 128<br />
92 | <strong>He</strong> <strong>Ritenga</strong> <strong>Whakaaro</strong>: Māori experiences of health services
Appendices 9<br />
Appendix A. Literature review methodology<br />
In the first phase of the project, a literature search was performed, seeking information on (Māori) utilisation,<br />
perceptions and experiences of health and disability services, including ACC.<br />
An electronic search of MEDLINE covering the years 1980 to 2004 was undertaken using a range of search terms<br />
relating to patient experiences of care, satisfaction with care, perceptions of care, survey methodology, and<br />
minority health or Māori health. This yielded several hundred articles including reviews and policy documents.<br />
Only English language articles were examined. The abstracts were screened for relevance, and reports that did not<br />
appear to be applicable to the research topic were excluded. The focus of the literature search was to locate key<br />
themes and models related to patient experiences and actual healthcare use, including barriers and enablers of care<br />
and minority health disparities. Articles retained were categorised as to: background, research evidence, survey<br />
instruments, methodology, cross cultural and Māori specific.<br />
In addition to the published literature, utilisation data from researchers, the Ministry of <strong>He</strong>alth and ACC sources<br />
were also reviewed for key trends and patterns. Supplementary information was sought from academic contacts<br />
and acknowledged experts in the field of Māori health.<br />
A further search of all <strong>New</strong> <strong>Zealand</strong> Medical Journal articles from December 2000 to December 2004 was<br />
undertaken for any information related to Māori health and disability matters.<br />
These searches were then updated at the end of 2007.<br />
<strong>He</strong> <strong>Ritenga</strong> <strong>Whakaaro</strong>: Māori experiences of health services | 93
9 Appendices<br />
Appendix B. Hui data<br />
Hui<br />
Information<br />
Hauora/<br />
Whara – Tāne<br />
Logistics Key Issues Discussed Most Important<br />
Needs Identified<br />
7 September 2004<br />
held in Hamilton at<br />
Kirikiriroa Marae<br />
Participants:<br />
Hauora/Whara –<br />
Tāne, 9 people<br />
Facilitators:<br />
Manujon Pemerika,<br />
Catherine Dunkley,<br />
Steve Allen<br />
The transition between traditional Māori culture and<br />
the Pākehā dominant culture<br />
Generational changes, with older Māori being quite<br />
different to younger Māori in the way they deal<br />
with their own health and subsequently the health<br />
system in NZ<br />
Lack of knowledge of the health system and funding<br />
opportunities that are available<br />
Māori culture of collectivism and receiving support<br />
from whānau when ill leads to not visiting doctor as<br />
soon as should<br />
The need for Māori to be more assertive and less<br />
fearful of the health system and the people running<br />
it<br />
Very few Māori doctors which is the preference<br />
Assertiveness will mean Māori get what they are<br />
entitled to as “the system” is not going to ensure it<br />
happens<br />
Older Māori prefer traditional medicine to Pākehā<br />
nurse or doctor<br />
Hauā/ Whara<br />
– Wāhine<br />
16 September 2004<br />
held in Wellington<br />
at Te Awakairangi/<br />
Lower Hutt Hospital<br />
Participants: Hauā/<br />
Whara – Wāhine, 5<br />
people<br />
Facilitators:<br />
Manujon Pemerika,<br />
Catherine Dunkley<br />
The lack of expertise shown by many of the<br />
people working in home assistance, and the issue<br />
of fragmented services – different people doing<br />
different things in the home<br />
The frequently poor interpersonal skills shown by<br />
these same people, and their lack of personal interest<br />
Lack of knowledge among Māori about what<br />
services and assistance is available, but also how<br />
that is changing with younger people being more<br />
knowledgeable and proactive<br />
The need for Māori to be more assertive and<br />
less fearful of the health system and the people<br />
running it. The perception among people who have<br />
experienced the hospital and ACC system that<br />
unless one asks, information will not be forthcoming<br />
Deaf and disabled people feel discriminated against<br />
by the system and people within it<br />
GPs general lack of expertise and interactive skills,<br />
especially with deaf people<br />
ACC’s lack of practical expertise<br />
The bureaucracy at ACC, the length of time it takes<br />
to get resolution<br />
Respect<br />
Good listener<br />
An interpreter<br />
Patience<br />
Ability to contact the<br />
person<br />
Information in the<br />
right format, in the<br />
right places for Māori<br />
to access<br />
94 | <strong>He</strong> <strong>Ritenga</strong> <strong>Whakaaro</strong>: Māori experiences of health services
Appendices 9<br />
Hui<br />
Information<br />
Hauora/<br />
Whara –<br />
Wāhine<br />
Logistics Key Issues Discussed Most Important<br />
Needs Identified<br />
21 September 2004<br />
held in Gisborne at<br />
Ngati Porou Hauora<br />
Participants:<br />
Hauora/Whara –<br />
Wāhine, 9 people<br />
Facilitators:<br />
Manujon Pemerika,<br />
Catherine Dunkley<br />
Note: This group<br />
would not allow<br />
video or audio<br />
recording. Written<br />
notes taken by<br />
Catherine Dunkley<br />
Racial issues and discrimination against Māori and<br />
obese Māori women<br />
Significant barriers to using GPs - time and cost<br />
No flexibility in system around prescriptions – have<br />
to go to doctor to get repeats<br />
Pākehā GPs lack of cultural sensitivity and respect<br />
for Māori<br />
<strong>Doctor</strong>s don’t listen to patients – have preconceived<br />
notions about Māori people<br />
Listen to person<br />
Same doctors all the<br />
time / family doctor<br />
Open all hours<br />
Not rushing you<br />
Not making you wait<br />
(1 hr plus)<br />
Nice to elderly<br />
women / respect<br />
elders<br />
Non judgmental<br />
Disability friendly<br />
Community<br />
knowledge<br />
Cultural knowledge<br />
Free<br />
Hauā/ Whara<br />
– Wāhine and<br />
Tāne<br />
1 October 2004<br />
held in Auckland at<br />
Papakura Marae<br />
Participants: Hauā/<br />
Whara – Wāhine<br />
and Tāne, 8 people<br />
Facilitators:<br />
Manujon Pemerika,<br />
Catherine Dunkley<br />
Difficulty of effective interaction with GPs – their<br />
use of medical terms not easily understood. Also<br />
a tendency to talk down to people, treat them like<br />
children due to their intellectual disabilities<br />
GPs practical skills sometimes lacking, don’t take the<br />
time to talk and understand the patient’s problems,<br />
and as a result prescribing the wrong course of action<br />
Difficulty of effective interaction with hospital staff.<br />
Support needed from whānau or advocates to get<br />
the right treatment<br />
Individual characteristics of literacy and knowledge<br />
Understanding<br />
people with an<br />
intellectual disability<br />
Treat you like an adult<br />
A good bedside<br />
manner, so make you<br />
feel okay and joke<br />
with you<br />
Friendly<br />
Not having to wait too<br />
long<br />
Treat you the same as<br />
others<br />
Use easy words<br />
Be patient with you<br />
For the service to be<br />
free<br />
Explain things to you<br />
Talk to you, not just<br />
the person who is<br />
with you<br />
Ask you the questions<br />
<strong>He</strong> <strong>Ritenga</strong> <strong>Whakaaro</strong>: Māori experiences of health services | 95
9 Appendices<br />
Hui<br />
Information<br />
Rangatahi –<br />
Wāhine and<br />
Tāne<br />
Logistics Key Issues Discussed Most Important<br />
Needs Identified<br />
8 October 2004<br />
held in Christchurch<br />
at Māori Indigenous<br />
<strong>He</strong>alth Institute<br />
Participants:<br />
Rangatahi – Wāhine<br />
and Tāne, 6 people<br />
Facilitators:<br />
Manujon Pemerika,<br />
Catherine Dunkley<br />
Māori culture and the issue of Māori pride and<br />
stubbornness affecting visits to a GP<br />
Costs of visits and prescriptions means people wait<br />
until last minute. This happens with dentist as well<br />
Whānau support an important factor – when living<br />
in area with whānau more willing to go to family<br />
doctor. When moved out of town less familiar and<br />
put off visiting doctor<br />
Hospital staff and their expertise variable, some<br />
good experiences, some poor<br />
Kaumātua will work through illness or use Māori<br />
medicine rather than see a doctor<br />
This group seemed reasonably familiar with ACC<br />
and what they were entitled to<br />
Cost – not too<br />
expensive<br />
Inviting atmosphere<br />
Knowledgeable<br />
Clean environment<br />
Culturally aware<br />
Enough time for<br />
consultation<br />
Hauora/<br />
Whara –<br />
Wāhine<br />
8 October 2004<br />
held in Christchurch<br />
at Māori Indigenous<br />
<strong>He</strong>alth Institute<br />
Participants:<br />
Hauora/Whara –<br />
Wāhine, 8 people<br />
Facilitators:<br />
Manujon Pemerika,<br />
Catherine Dunkley<br />
GP expertise with Māori, their ability to interact,<br />
develop rapport<br />
GPs practical skills, their knowledge about illnesses<br />
beyond the usual problems they encounter<br />
Acceptance rather than assertiveness is the Pākehā<br />
and Māori way<br />
Kaumātua won’t go to doctor until last minute;<br />
frightened of cost and process<br />
Lack of confidence leads to either not going to see a<br />
doctor, or not talking when with a doctor<br />
<strong>Doctor</strong>s need to be more empathetic with patients,<br />
especially elderly who may need more explanations<br />
Māori not in the mindset of going to doctor as soon<br />
as feel ill, would rather wait<br />
Explanation of illness<br />
and treatment<br />
Cost<br />
Proximity, or location<br />
Take the time to<br />
understand the<br />
patient and their<br />
medical history<br />
Hauā/ Whara<br />
– Tāne<br />
29 October 2004<br />
held in Hamilton<br />
at Life Unlimited,<br />
Palmerston St<br />
Participants: Hauā/<br />
Whara – Tāne, 8<br />
people<br />
Facilitators:<br />
Manujon Pemerika,<br />
Steve Allen<br />
The whole issue of rehabilitation, where to get help<br />
and expertise from<br />
Generally negative perceptions of ACC – the<br />
bureaucracy, interaction with staff, cultural<br />
understanding, information flow<br />
Māori people and the general lack of knowledge<br />
about what is available from the health system<br />
Māori shyness and lack of assertiveness being a<br />
barrier to obtaining help<br />
Honesty<br />
Respect<br />
Getting to know me<br />
Trust<br />
Recognition,<br />
manaakitanga, our<br />
kaiawhina<br />
Pamphlets and<br />
information<br />
Culturally sensitive<br />
96 | <strong>He</strong> <strong>Ritenga</strong> <strong>Whakaaro</strong>: Māori experiences of health services
Appendices 9<br />
Hui<br />
Information<br />
Rangatahi –<br />
Wāhine and<br />
Tāne<br />
Logistics Key Issues Discussed Most Important<br />
Needs Identified<br />
22 November 2004<br />
held in Auckland at<br />
James Cook High<br />
School<br />
Participants:<br />
Rangatahi – Wāhine<br />
and Tāne, 9 people<br />
Facilitators:<br />
Manujon Pemerika,<br />
Catherine Dunkley,<br />
Peter Jansen<br />
GP relationships – their interpersonal skills,<br />
understanding of Māori culture<br />
The cost of seeing a GP prohibitive<br />
Alternatives to the health system – traditional Māori<br />
medicine, alternative medicines, self management<br />
Cheapest<br />
Communication<br />
(listening and talking)<br />
Relationship between<br />
doctor and patient<br />
Explanation of what is<br />
wrong<br />
Take time with patient<br />
Treat everyone the<br />
same<br />
Hauora/<br />
Whara – Tāne<br />
24 November 2004<br />
held in Waharoa at<br />
Raungaiti Marae<br />
Participants:<br />
Hauora/Whara –<br />
Tāne, 15 people<br />
Facilitators:<br />
Manujon Pemerika,<br />
Catherine Dunkley,<br />
Peter Jansen<br />
Personal income is a barrier to accessing the health<br />
system<br />
GP interpersonal skills and costs are barriers<br />
Whānau support, generational, cultural barriers to<br />
hospital<br />
Adults will wait on going to doctor for themselves<br />
but will take children immediately when sick<br />
Kaumātua wait until the last minute, don’t want to<br />
spend the money on themselves<br />
Māori relate to each other differently than Pākehā,<br />
and prefer and are more at ease with Māori doctors<br />
and clinics<br />
Wairua<br />
Warm whānau<br />
environment<br />
Cheap/ affordable<br />
Cultural awareness<br />
Good explanation<br />
Ngati Kāpō<br />
12 March 2005 held<br />
in Napier at Te Poho<br />
Marae<br />
Participants: Ngati<br />
Kāpō – 9 people<br />
Facilitators:<br />
Manujon Pemerika,<br />
Steve Allen<br />
Individual pride and stubbornness<br />
Māori not assertive enough, and need to display<br />
some proactivity to help themselves. Need to<br />
change doctors if not happy with him/her<br />
Māori wait and see what is wrong with them, rather<br />
than seeking help. Will wait until the last minute and<br />
this causes additional complications<br />
GP practical skills, need to listen to their patients,<br />
and willing to let patients bring whānau to support<br />
them<br />
Trust in the doctor<br />
Confidence<br />
<strong>Doctor</strong>s listen and<br />
take the time to<br />
understand<br />
Value for money<br />
Culturally sensitive,<br />
sensitive to patient’s<br />
needs<br />
<strong>He</strong> <strong>Ritenga</strong> <strong>Whakaaro</strong>: Māori experiences of health services | 97
9 Appendices<br />
Appendix C. Explanatory letter<br />
Mauri Ora Associates<br />
PO Box xxxxx<br />
xxxxx<br />
Information Sheet<br />
Title: Māori Consumer Use and Experience of <strong>He</strong>alth and Disability and ACC services<br />
Who are we and what are we studying?<br />
We are a team of Māori health researchers investigating Māori use and experiences of health and disability and<br />
ACC services. The research is funded by the Ministry of <strong>He</strong>alth, <strong>He</strong>alth Research Council and ACC. The information<br />
we have is that Māori do not use existing services in the same way as Pākehā, but the reasons why are not clear.<br />
How will we investigate this issue?<br />
In a series of 10 hui with a Māori facilitator in 2004, we gathered information about things that prevent Māori from<br />
using health and disability and ACC services. Using that information we have developed a survey that can tell us<br />
about Māori consumer experiences of care – that is what happened when Māori went to see a doctor or hospital or<br />
other health service or disability service.<br />
A trained telephone interviewer may ring you in the next 4 weeks and ask you to take part in the survey. If you have<br />
a caregiver, you may give them permission to answer of your behalf. We think that the telephone interview will last<br />
for between 15 and 30 minutes.<br />
Taking part is voluntary.<br />
You do not have to take part, and if you choose not to take part this will not affect any future treatment or care. If<br />
you do agree to take part you are free to withdraw from the interview at any time, without having to give a reason.<br />
You do not have to answer all the questions. You must be over 16 years of age to take part in the interview.<br />
What will we do with the information?<br />
The aim of the study is to help in improving services by reporting on Māori experiences.<br />
The results of the study will be published in scientific journals.<br />
Confidentiality.<br />
No information which could personally identify you will be used in any reports on this study. All information will be<br />
held in confidence by the researchers.<br />
If you have a disability or health problem that prevents communication by telephone, you may request a private<br />
interview. You can have your supporters / whānau present in that interview.<br />
We thank you in advance for your time and help in making this study possible. If you have any queries or wish to<br />
know more please phone me or write.<br />
Peter Jansen Tel: xx xxx xxxx<br />
Mauri Ora Associates, Fax: xx xxx xxxx<br />
PO Box xxxxx, Email: xxxxxx@mauriora.co.nz<br />
xxxxx<br />
98 | <strong>He</strong> <strong>Ritenga</strong> <strong>Whakaaro</strong>: Māori experiences of health services
Appendices 9<br />
If you have any queries or concerns regarding your rights as a participant in this study you may wish to contact a<br />
<strong>He</strong>alth and Disability Advocate, telephone:<br />
Northland to Franklin xxxx xxx xxx<br />
Mid and lower North Island xxxx xx xx xx (x xxxx)<br />
South Island except Christchurch xxxx xxx xxx<br />
Christchurch xx xxx xxxx<br />
This study has received ethical approval from the Multi-region Ethics Committee. Reference WAI/03/12/089.<br />
<strong>He</strong> <strong>Ritenga</strong> <strong>Whakaaro</strong>: Māori experiences of health services | 99
9 Appendices<br />
Mauri Ora Associates<br />
PO Box xxxxx<br />
xxxxx<br />
30 Pipiri 2005 Panui whakamārama<br />
Kaupapa: Tā te Hunga Whai Ora Māori whakamahi, wheako hoki i ngā ratonga hauora me ngā ratonga o te<br />
Kaporeihana Hunga Whara (ACC).<br />
Māori Consumer Use and Experience of <strong>He</strong>alth and Disability and ACC services<br />
Ko Wai Mātou?<br />
Ko te kamupene nei Mauri Ora Associates, he ohu rangapū hauora, e mahitahi nei i a Tōmaiora, he ohu rangahau<br />
nō te Whare Wānanga o Tāmakimakaurau. Nā te Manatū Hauora, te Kaunihera Rangahau Hauora me te<br />
Kaporeihana Āwhina i te Hunga Whara te putea.<br />
Ka rangahaua pēheatia?<br />
I roto i ngā hui tekau i whakahaeretia i kohikohitia ētahi take a ārai nei te tangata Māori ki te kuhu i ngā ratonga<br />
hauora. I hangaia mai i kōrero tētahi patapatai hei whakaatu mai he aha tā te Māori whakamahi i te ratonga<br />
hauora, me ngā ratonga o te Kaporeihana Hunga Whara. Me pēnei - i ahatia te Māori ina haere ki te takuta, ki te<br />
hohipera, ki te ratonga hauora ranei.<br />
Ka waea atu tētahi kaiuiui ki a koe i ngā wiki e whā kei te haere mai, me te inoi atu ki a koe kia uru mai ki te<br />
kaupapa pātaitai. Mehemea he kaitiaki tōhou, ka taea e koe te whakaae kia whakautu māhau.<br />
Tō mātou, ka ahua 15 – 30 meneti te roa o te patapatai.<br />
<strong>He</strong> mea tūao te uru mai. Kei a koe te tikanga.<br />
Kei a koe te tikanga kia uru mai, te kore uru mai rānei. E kore rawa e whakararu i te rato i ngā ratonga hauora ki a<br />
koe, ki tō whānau rānei. Mehemea ka whakaae mai koe kia uru mai, ka taea hoki e koe te puta ki waho, ahakoa te<br />
wā, kāore he take, ā ka kore e whakararu a muri ake nei. Ka taea hoki kia noho tahi tētahi whānaunga, tētahi hoa<br />
rānei hei kaitautoko, hei whakamārama hoki i ngā painga me ngā hua o te kaupapa. Ka taea e koe te whakaatu, te<br />
kore whakaatu rānei i ngā pātai. Ka taea hoki e koe te whakakapi i ngā kōrero ahakoa te wā. Kei a koe te tikanga.<br />
Ka ahatia ngā kōrero e kohia?<br />
Ko te whāinga hei hāpai i te hauora o ngāi tāua. Ka whakapaoho atu ngā hua ki ngā pukapuka kaupapa hauora.<br />
<strong>He</strong> mea huna.<br />
Kāore hoki e whākina atu tētahi kōrero e āhei ana te whakamohio atu nāu ngā kōrero. Ka huna katoa ngā<br />
kōrero. Ka mea atu hoki ki ngā kaiwhakauru kia kaua e whāki atu ngā kōrero. <strong>He</strong>oi anō ka taea hoki e koe te tono<br />
mō te kōrero takitahi, te kōrero me tō whānau, tō kaitautoko anake. Kei a koe tēnā.<br />
<strong>He</strong>oi anō he mihi kau ake ki a koe, ki a koutou e āwhina nei i te kaupapa. Mena he pātai āu, he pīrangi noa mō<br />
ētahi atu kōrero, waea mai koa ki ahau:<br />
Peter Jansen Tel: xx xxx xxxx<br />
Mauri Ora Associates, Fax: xx xxx xxxx<br />
PO Box xxxxx, Email: xxxxxx@mauriora.co.nz<br />
xxxxx<br />
This study has received ethical approval from the Multi-region Ethics Committee. Reference WAI/03/12/089.<br />
100 | <strong>He</strong> <strong>Ritenga</strong> <strong>Whakaaro</strong>: Māori experiences of health services
Appendices 9<br />
Appendix D. Survey questionnaire<br />
Introduction<br />
Kia ora, I am calling from Digipoll, on behalf of Mauri Ora Associates about a letter we sent to you recently about a<br />
health survey.<br />
Do you remember this letter?<br />
If Yes: Are you able to speak with me now? We have Māori interviewers available if you would prefer to speak with<br />
them.<br />
If No: We are conducting a survey about the health, disability and ACC system in <strong>New</strong> <strong>Zealand</strong>. We want to speak<br />
to people who have had contact with the health system sometime in the past 6 months. This is with people like your<br />
GP, A&E, a hospital, a specialist or x-rays, physios, occupational health people and so on. It also includes ACC for<br />
injury [or WINZ for health related claims]. The contact could have been for yourself, your children, or another child<br />
or adult you look after. Are you able to speak with me now? We have Māori interviewers available if you would<br />
prefer to speak with one of them.<br />
Will you be responding to this survey about your own experiences or on behalf of someone else that you look<br />
after? Code all mentions<br />
1 Myself<br />
2 A child/youth<br />
3 An adult/spouse I look after<br />
4 Other specify<br />
I’d like to ask you about your own general health. Do you have any health or physical conditions that require<br />
on-going treatment or affect your ability to do everyday things?<br />
1 No<br />
2 Physical – e.g., lost a limb, polio<br />
3 <strong>He</strong>alth condition – e.g., asthma, diabetes<br />
4 Sensory – e.g., sight or hearing disability<br />
5 Mental or intellectual disability<br />
6 Other specify<br />
99 Don’t know/Refused<br />
If answering the survey for someone else from Q2: And for the person you are answering on behalf of, how is their<br />
general health? Same scale as Q3<br />
I’d like to speak to you about your most recent experience with the health system. [If answering on behalf<br />
of someone else instead of ‘you’ and ‘your’ will reword]. Can you tell me if you have had contact with any of<br />
these people or organisations in the past 6 months? Read list. Code all mentions<br />
Contacts<br />
Relevant Service<br />
Standards Section<br />
1 GP/doctor SS1<br />
2 Accident and Emergency or Accident and Medical Centre SS2<br />
3 Hospital SS3<br />
4 Specialist SS1<br />
5<br />
ACC for injury<br />
or WINZ over health related issues<br />
SS4<br />
6<br />
Other services like x-rays, physiotherapy, occupational therapist,<br />
osteopath, home help Specify service mentioned<br />
SS5<br />
<strong>He</strong> <strong>Ritenga</strong> <strong>Whakaaro</strong>: Māori experiences of health services | 101
9 Appendices<br />
For each mentioned: Can you tell me how long ago the contact with [insert contact from Q5] was?<br />
1 This week<br />
2 Within last month<br />
3 Within last 3 months<br />
4 Within last 6 months<br />
5 Longer than 6 months ago<br />
99 Don’t know<br />
If only one contact: Was this visit made for yourself or some other person?<br />
If more than one contact: Were these visits made for yourself or some other person?<br />
Visit 1 Visit 2 Visit 3<br />
1 Myself Myself Myself<br />
2 Child/youth Child/youth Child/youth<br />
3 Adult/spouse I look after Adult/spouse I look after Adult/spouse I look after<br />
4 Other specify Other specify Other specify<br />
Service Standards Section<br />
If more than 3 visits I’d like to ask you about these 3 visits specifically [check quotas, want to get as many non-GP<br />
contacts as possible]. I’ll ask you whether or not certain things happened and for most questions all I need you to<br />
tell me is a “Yes” or “No”. Go to relevant SS Section<br />
SS Section 1: General Practitioners/<strong>Doctor</strong> & Specialists<br />
Firstly, thinking back to how urgently you needed to see the doctor for that last visit – did you need to see the<br />
doctor as soon as possible, the same day, that week, or sometime after that?<br />
Visit 1<br />
1 As soon as possible<br />
2 Same day<br />
3 Same week<br />
4 Later<br />
Were you seen in that timeframe? Yes/No<br />
Did you or someone else make an appointment for the visit? If No, skip to Q18<br />
Was the time given suitable for you?<br />
Were you given a choice of times?<br />
Were you seen on time? If YES skip to Q22 else continue<br />
IF NO to Q14: How long did you wait for your appointment? Record waiting time in minutes<br />
IF No to Q14: Were you told how long you would have to wait?<br />
IF No to Q14: Were you told why you would have to wait? Skip to Q22<br />
If no appointment made in Q11: When you arrived at the clinic, were you given a time for your appointment?<br />
Were you seen on time? IF NO to Q18: How long did you wait for your appointment? Record waiting time in<br />
minutes<br />
IF NO to Q18: Were you told how long you would have to wait?<br />
IF NO to Q18: Were you told why you would have to wait?<br />
102 | <strong>He</strong> <strong>Ritenga</strong> <strong>Whakaaro</strong>: Māori experiences of health services
Appendices 9<br />
Was the receptionist/nurse polite to you?<br />
Were you with anyone else for the appointment?<br />
If YES: How many people were you with? Record number of people<br />
And now the actual meeting with the doctor. And remember, I’m after straight (Yes or No) answers to most<br />
questions<br />
Did the doctor ask you enough questions about what was wrong with you?<br />
Did the doctor spend enough time listening to you?<br />
Did the doctor spend sufficient time with you to find out what was wrong?<br />
Did the doctor give you a simple, clear explanation of what was wrong with you?<br />
Were you given enough privacy while being examined?<br />
Did the doctor prescribe any treatment or drugs or tests or investigations?<br />
If YES to Q30: Did the doctor give you a clear explanation of why the treatment/drugs/tests/investigations were<br />
necessary?<br />
Did the doctor explain about side effects of the treatment?<br />
Did you have confidence and trust in the doctor?<br />
Were you and any other people with you treated with respect?<br />
Did the doctor say your name properly?<br />
Was this your first visit to this doctor?<br />
If No How long have you been a patient of this doctor? Record number of years<br />
Overall, thinking about the whole process of seeing the doctor for that visit, would you say that for you it was a<br />
Good, Average, or Poor experience?<br />
1 Good<br />
2 Average<br />
3 Poor<br />
99 Don’t know/Refused<br />
Was there anything at all about making the appointment or your visit to the doctor you didn’t like, anything at<br />
all? What was it? Get verbatim comment<br />
And was there anything at all about making the appointment or your visit to the doctor you did like, that did<br />
work well? Get verbatim comment<br />
Would you go to this doctor again if you were sick?<br />
Can you tell me the ethnicity of the doctor?<br />
1 <strong>New</strong> <strong>Zealand</strong> European<br />
2 Māori<br />
3 Samoan<br />
4 Cook Island<br />
5 Tongan<br />
6 Niuean<br />
<strong>He</strong> <strong>Ritenga</strong> <strong>Whakaaro</strong>: Māori experiences of health services | 103
9 Appendices<br />
7 Chinese<br />
8 Indian<br />
9 Other<br />
99 Don’t know/Refused<br />
If given a prescription in Q30: You said earlier the doctor gave you a prescription. Did you collect your prescription?<br />
If NO: Why not? Code all that apply<br />
1 Yes, did get prescription<br />
2 No – cost too much<br />
No – will pick up medication if really need to/doctor wrote prescription just in<br />
case<br />
3<br />
4 No – don’t like taking drugs<br />
5 No – condition got better<br />
6 No – thought medicine makes it worse/wouldn’t work<br />
7 No – lack of transport<br />
8 No – can only pick up one month supply at a time<br />
9 Other<br />
99 Don’t know/Refused<br />
Did the doctor refer you to any other health services or people?<br />
If YES: Who to? Code all that apply<br />
1 Emergency referral Hospital<br />
Specialists (SS Section 1)<br />
2 Orthopaedics<br />
3 ENT<br />
4 Cardiology<br />
5 Gynaecology<br />
6 Gastroenterology<br />
7 Urology<br />
8 Ophthalmology<br />
9 Paediatrics<br />
10 Psychiatry<br />
11 Dermatology<br />
12 Neurology<br />
13 Rheumatology<br />
14 Plastic surgery<br />
15 Obstetric<br />
Other services (SS Section 5)<br />
16 Physiotherapist<br />
17 Radiology<br />
18 Nursing<br />
19 Counselling<br />
20 Midwife<br />
21 Dental<br />
22 Audiology<br />
99 Don’t know<br />
And have you been to see this person yet? If YES, but not coded in Q5, enter code in Q5 and ask Q6 and Q7<br />
then return to Q47 If NO, skip to first appropriate SS Section<br />
104 | <strong>He</strong> <strong>Ritenga</strong> <strong>Whakaaro</strong>: Māori experiences of health services
Appendices 9<br />
Is it OK if I ask you a few questions about that visit too?<br />
Check quotas. Go to appropriate section<br />
If no other health system visits to be asked about, skip to attitudes section at Q125<br />
SS Section 2: Accident & Emergency<br />
I’d like to ask some questions about the most recent A&E experience you had. And I’m after mainly Yes/No answers<br />
again here.<br />
But first, I want to know how seriously hurt you or the person you went with was. Would you say the reason for your<br />
visit was Read out<br />
1 Extremely serious<br />
2 Very serious<br />
3 Serious<br />
4 Not that serious<br />
5 Don’t know<br />
Have you been to this A&E before?<br />
Was the receptionist polite to you?<br />
Were you with anyone else for the appointment?<br />
If YES: How many people were you with? Record number<br />
Were you [if more than 1 person - and any other people with you] treated with respect by the receptionist?<br />
Were you told how long you would have to wait before you would be seen by a doctor?<br />
Were you told why you would have to wait?<br />
How many minutes did you wait before you first spoke to a nurse or doctor?<br />
1 less than 5 minutes<br />
2 5-15 minutes<br />
3 15-30 minutes<br />
4 30-60 minutes<br />
5 1-2 hours<br />
6 longer than 2 hours<br />
7 Don’t know<br />
How many minutes did you wait before you were examined by a nurse or doctor? [time periods from Q56]<br />
Overall, from arriving to leaving again, how long were you at the A&E? [periods Q56]<br />
Did you think the order in which you and other patients were seen was fair?<br />
I’ll now ask you about your meeting with the doctor or nurse that you saw.<br />
Did the doctor / nurse introduce him or herself?<br />
Did the doctor / nurse ask you enough questions about what was wrong with you?<br />
Did the doctor / nurse spend sufficient time with you to find out what was wrong?<br />
Did the doctor give you a simple, clear explanation of what was wrong with you?<br />
<strong>He</strong> <strong>Ritenga</strong> <strong>Whakaaro</strong>: Māori experiences of health services | 105
9 Appendices<br />
Were you given enough privacy while being examined?<br />
Did the doctor / nurse, nurse and any other staff talk in front of you as if you weren’t there?<br />
Were you prescribed any treatment or drugs or tests or investigations?<br />
If YES Did the doctor / nurse give you a clear explanation of why the treatment or drugs were necessary?<br />
Were you and any other people with you/family members with you treated with respect?<br />
Was the reason you went to the A&E dealt with to your satisfaction?<br />
Overall, thinking about the whole process of going to the A&E, would you say that for you it was a Good,<br />
Average, or Poor experience?<br />
1 Good<br />
2 Average<br />
3 Poor<br />
99 Don’t know/Refused<br />
Was there anything at all about this visit to the A&E you didn’t like, anything at all? What was it? Get verbatim<br />
comment<br />
And was there anything at all about this visit to the A&E you did like, that did work well? Get verbatim comment<br />
If you had a choice, would you go to this A&E again if you were sick?<br />
If no other health system visits to be asked about, skip to attitudes section at Q125<br />
SS Section 3: Hospital<br />
I’d like to ask some questions about the most recent hospital experience you have had. And I’m after mainly Yes/No<br />
answers again here.<br />
Did the staff you dealt with always introduce themselves?<br />
Did the doctor ask you enough questions about what was wrong with you?<br />
Did the doctor spend sufficient time with you to find out what was wrong?<br />
Did the doctor give you a simple, clear explanation of what was wrong with you?<br />
Were you given enough privacy during your stay in hospital?<br />
Did the doctor, nurse and any other medical staff talk in front of you as if you weren’t there?<br />
Did the doctor prescribe any treatment or drugs?<br />
If YES Did the doctor give you a clear explanation of why the treatment or drugs were necessary?<br />
Did you have confidence and trust in the people who were looking after you?<br />
Did they communicate with you in an open, honest manner?<br />
Did they respect your culture and beliefs? If NO, ask What happened? Record verbatim<br />
Were you and any other people with you/family members with you treated with respect?<br />
Did the doctor tell you what to expect with your illness after you left the hospital?<br />
Overall, thinking about the whole process of going to the hospital, would you say that for you it was a Good,<br />
Average, or Poor experience?<br />
106 | <strong>He</strong> <strong>Ritenga</strong> <strong>Whakaaro</strong>: Māori experiences of health services
Appendices 9<br />
1 Good<br />
2 Average<br />
3 Poor<br />
99 Don’t know/Refused<br />
Was there anything at all about this visit to the hospital you didn’t like, anything at all? What was it? Get<br />
verbatim comment<br />
And was there anything at all about this visit to the hospital you did like, that did work well? Get verbatim<br />
comment<br />
If you had a choice, would you go to this hospital again if you were sick?<br />
If no other health system visits to be asked about, skip to attitudes section at Q125<br />
SS Section 4: Funding Bodies (e.g., ACC)<br />
I’d like to ask some questions about the last contact you had with ACC. And I’m after mainly Yes/No answers again<br />
here.<br />
Was this your first visit to ACC over this particular issue?<br />
If NO: How many other visits have you made for this particular issue? Record number<br />
Were you with anyone else for the appointment?<br />
If YES: How many people were you with? Record number<br />
Were you given enough privacy while being interviewed?<br />
Did the person listen to your views?<br />
Did they recognise you might have been under emotional or financial stress?<br />
Did you have confidence and trust in the person you met with?<br />
Did they communicate with you in an open, honest manner?<br />
Did they respect your culture and beliefs?<br />
Were you and any other people with you treated with respect?<br />
Did they give you all the information you needed about your claim or entitlements?<br />
Did they give you an accurate timeframe as to when your issue would be resolved?<br />
Did you get a simple, clear explanation of what would happen after your visit?<br />
Overall, thinking about the last experience with ACC, would you say that for you it was a Good, Average, or<br />
Poor experience?<br />
1 Good<br />
2 Average<br />
3 Poor<br />
99 Don’t know/Refused<br />
<strong>He</strong> <strong>Ritenga</strong> <strong>Whakaaro</strong>: Māori experiences of health services | 107
9 Appendices<br />
Was there anything at all about this visit to ACC you didn’t like, anything at all? What was it? Get verbatim<br />
comment<br />
And was there anything at all about this visit to ACC you did like, that did work well? Get verbatim comment<br />
If you had a choice, would use ACC again if you needed to?<br />
If no other health system visits to be asked about, skip to attitudes section at Q125<br />
SS Section 5: Other services – e.g., rays, physiotherapy, occupational therapist<br />
I’d like to ask some questions about the last contact you had with [other services]. And I’m after mainly Yes/No<br />
answers again here.<br />
Was this your first visit to [other service] over this particular issue?<br />
If NO: How many other visits have you made for this particular issue? Record number<br />
Were you with anyone else for the appointment?<br />
If YES: How many people were you with? Record number<br />
Were you given enough privacy while being treated?<br />
Did the person listen to your views?<br />
Did you have confidence and trust in the person you met with?<br />
Did they communicate with you in an open, honest manner?<br />
Did they respect your culture and beliefs?<br />
Were you and any other people with you treated with respect?<br />
Did you get a simple, clear explanation of why you needed the treatment?<br />
Did you get a simple, clear explanation of what would happen after your visit?<br />
Overall, thinking about the last experience with [insert other service], would you say that for you it was a<br />
Good, Average, or Poor experience?<br />
1 Good<br />
2 Average<br />
3 Poor<br />
99 Don’t know/Refused<br />
Was there anything at all about this visit to (other service) you didn’t like, anything at all? What was it? Get<br />
verbatim comment<br />
And was there anything at all about this visit to (other service) you did like, that did work well? Get verbatim<br />
comment<br />
If you had a choice, would you use this (other service) again if you needed treatment?<br />
108 | <strong>He</strong> <strong>Ritenga</strong> <strong>Whakaaro</strong>: Māori experiences of health services
Appendices 9<br />
Attitudes<br />
I’d like to ask some questions about your attitudes towards your own health and the health system in NZ/Aotearoa.<br />
I’ll read out some statements people have made, and I want you to tell me whether you agree or disagree with the<br />
statement. I’ll get you to give me an answer using these words: Agree, Disagree, or Neither agree nor disagree<br />
Rotate order<br />
I usually wait until the last minute to go to see a doctor<br />
I am in excellent health<br />
I have to be quite sick before I’ll go to a doctor<br />
It is too expensive to go the doctor every time I feel sick<br />
The cost of seeing a doctor is not good value for money<br />
I expect my family/whānau to look after me when I’m sick rather than going to the doctor<br />
I don’t like taking drugs for my own illnesses<br />
I have a good relationship with my GP<br />
I can trust my GP<br />
The GP I last went to treated me with respect<br />
The GP treats me as well as any other patients he/she has<br />
The doctor does not treat me like an adult<br />
I don’t like to ask the doctor questions<br />
I am too shy to argue with the doctor if I think he/she is wrong<br />
The doctor gave me all the information I needed to get ACC<br />
<strong>Doctor</strong>s don’t really care about their Māori patients<br />
<strong>Doctor</strong>s don’t really listen to their patients<br />
I have some concerns about my health<br />
I would prefer to see a doctor of my own ethnic group<br />
I would rather see a Māori doctor than a Pākehā doctor<br />
I would prefer to see a doctor of my own gender<br />
I get well treated in the hospital<br />
Hospital staff don’t treat me with respect<br />
Hospital should treat Māori differently to Pākehā<br />
Hospital staff don’t recognise Māori culture<br />
I don’t get treated with respect by provider<br />
It is hard to get a straight answer from people in the health system<br />
I get different answers from different people in provider<br />
The people in provider make it difficult for me to get what I want<br />
I would get looked after better if I was to deal with Māori people in provider<br />
Don’t rotate, leave these to the end<br />
Overall I think the health system in NZ is very good<br />
Overall I think the health system in NZ is good value for money<br />
<strong>He</strong> <strong>Ritenga</strong> <strong>Whakaaro</strong>: Māori experiences of health services | 109
9 Appendices<br />
Demographic/Socioeconomic<br />
OK, that is all apart from a few classification questions<br />
Gender<br />
1 Male<br />
2 Female<br />
99 Refused<br />
Can you give me your year of birth<br />
1 Record year<br />
99 Refused<br />
How many people are there living in your household, including yourself?<br />
Which of the following best describes the make-up of your household?<br />
1 Young single person living alone<br />
2 Flatting with others<br />
3 Young couple with no children at home<br />
4 Family with mainly pre-school children<br />
5 Family with mainly school age children<br />
6 Family with mainly adult children living at home<br />
7 Older couple with no children at home<br />
8 Older single person living alone<br />
99 Refused DON’T READ<br />
Which of the following best describes your working status? Just stop me when I read out the right category<br />
1 Employed full time (30 hours or more)<br />
2 Employed part-time (under 30 hours)<br />
3 Full-time student<br />
4 Unemployed/not working<br />
5 Homemaker<br />
6 Retired<br />
99 Refused DON’T READ<br />
How would you best describe your ethnic origin?<br />
1 <strong>New</strong> <strong>Zealand</strong> European<br />
2 Māori<br />
3 Samoan<br />
4 Cook Island<br />
5 Tongan<br />
6 Niuean<br />
7 Chinese<br />
8 Indian<br />
9 Other<br />
99 Refused<br />
110 | <strong>He</strong> <strong>Ritenga</strong> <strong>Whakaaro</strong>: Māori experiences of health services
Appendices 9<br />
Can you tell me your Iwi?<br />
1 Don’t know<br />
9 Other<br />
99 Refused<br />
How well do you speak the Māori language?<br />
1 Very well<br />
2 Well<br />
3 Fairly well<br />
4 Not very well<br />
5 A few words or phrases<br />
6 Not at all<br />
99 Refused<br />
Do you have a Community Services Card (CSC) (also known as the <strong>He</strong>alth Card, Exemption Card or Discount<br />
Card) or a High Use <strong>He</strong>alth Card?<br />
1 None<br />
2 CSC<br />
3 HUHC<br />
4 Both<br />
99 Don’t know/Refused<br />
What is the total gross household income from all sources and all income earners (before tax)…See if they<br />
just answer and code, otherwise start at $80,000 level work backwards - forwards<br />
1 … More than $20,000 per year?<br />
2 (IF MORE THAN $20,000) Is it more than $30,000 a year?<br />
3 (IF MORE THAN $40,000) Is it more than $60,000 a year?<br />
4 (IF MORE THAN $60,000) Is it more than $80,000 a year?<br />
5 (IF MORE THAN $80,000) Is it more than $100,000 a year?<br />
6 (IF MORE THAN $100,000) Is it more than $120,000 a year?<br />
7 (IF MORE THAN $120,000) Is it more than $150,000 a year?<br />
8 (IF MORE THAN $150,000) Is it more than $200,000 a year?<br />
9 (IF MORE THAN $200,000) Is it more than $250,000 a year?<br />
10 Refused DON’T READ<br />
<strong>He</strong> <strong>Ritenga</strong> <strong>Whakaaro</strong>: Māori experiences of health services | 111
9 Appendices<br />
And in which, or near which, town, city or area are you based?<br />
1 Whangarei<br />
2 Auckland<br />
3 Pukekohe<br />
4 Hamilton/Cambridge/Te Awamutu<br />
5 Tokoroa<br />
6 Tauranga<br />
7 Rotorua<br />
8 Taupo<br />
9 Whakatane<br />
10 Other upper North Island<br />
11 Gisborne<br />
12 Napier/Hastings<br />
13 <strong>New</strong> Plymouth<br />
14 Hawera<br />
15 Wanganui<br />
16 Palmerston North<br />
17 Feilding<br />
18 Levin<br />
19 Masterton<br />
20 Kapiti<br />
21 Wellington/ Upper Hutt/ Lower Hutt/ Porirua<br />
22 Other lower North Island<br />
23 Nelson<br />
24 Blenheim<br />
25 Greymouth<br />
26 Christchurch<br />
27 Ashburton<br />
28 Timaru<br />
29 Oamaru<br />
30 Dunedin<br />
31 Queenstown<br />
32 Invercargill<br />
33 Gore<br />
34 Other South Island<br />
35 Rangiora<br />
Do you mind giving me your address please? I’d like your street address and suburb. (This is for classification<br />
purposes with NZ Statistics data)<br />
Address: Record only street number and street (not flat number or A/B/C etc.). Get exact suburb<br />
112 | <strong>He</strong> <strong>Ritenga</strong> <strong>Whakaaro</strong>: Māori experiences of health services
Appendices 9<br />
Appendix E. Survey respondents’ nearest town, city or area<br />
In which, or near which, town, city or area are you based? N %<br />
Hamilton/Cambridge/Te Awamutu 103 15.8<br />
Auckland 99 15.2<br />
Whangarei 69 10.6<br />
Wellington/Upper Hutt/Lower Hutt/Porirua 49 7.5<br />
Gisborne 43 6.6<br />
Whakatane 41 6.3<br />
Napier/Hastings 33 5.1<br />
Rotorua 27 4.1<br />
Tokoroa 25 3.8<br />
Christchurch 22 3.4<br />
Other upper North Island 20 3.1<br />
Tauranga 19 2.9<br />
Other lower North Island 17 2.6<br />
Taupo 12 1.8<br />
Wanganui 11 1.7<br />
<strong>New</strong> Plymouth 10 1.5<br />
Palmerston North 9 1.4<br />
Invercargill 8 1.2<br />
Masterton 6 0.9<br />
Nelson 6 0.9<br />
Blenheim 5 0.8<br />
Pukekohe 4 0.6<br />
Levin 3 0.5<br />
Dunedin 2 0.3<br />
Other South Island 2 0.3<br />
Hawera 1 0.2<br />
Kapiti 1 0.2<br />
Greymouth 1 0.2<br />
Rangiora 1 0.2<br />
Refused 2 0.3<br />
Total 651 100<br />
<strong>He</strong> <strong>Ritenga</strong> <strong>Whakaaro</strong>: Māori experiences of health services | 113
9 Appendices<br />
Appendix F. Detailed information about analysis of survey questionnaire<br />
Compare Column Means (t-tests)<br />
This option produces pair-wise tests of the equality of column means for tables in which at least one category<br />
variable exists in the columns and at least one scale variable exists in the rows. p values of the tests are adjusted<br />
using the Bonferroni method, alpha level of the tests conducted at 0.05.<br />
Compare Column Proportions (z-tests)<br />
This option produces pair-wise tests of the equality of column proportions for tables in which at least one category<br />
variable exists in both the columns and rows. p values of the tests are adjusted using the Bonferroni method, alpha<br />
level of the tests were conducted at 0.05.<br />
Tests of Independence (Chi-square)<br />
This option produces a chi-square test of independence for tables in which at least one category variable exists in<br />
both the rows and columns. Alpha level of the tests conducted at 0.05.<br />
Two Step Cluster Analysis<br />
The Two Step Cluster Analysis procedure is an exploratory tool designed to reveal natural groupings (or clusters)<br />
within a data set that would otherwise not be apparent. The algorithm employed by this procedure has several<br />
desirable features that differentiate it from traditional clustering techniques:<br />
Handling of categorical and continuous variables: By assuming variables to be independent, a joint multinomialnormal<br />
distribution can be placed on categorical and continuous variables.<br />
Automatic selection of number of clusters: By comparing the values of a model-choice criterion across different<br />
clustering solutions, the procedure can automatically determine the optimal number of clusters.<br />
Scalability: By constructing a cluster features (CF) tree that summarises the records, the Two Step algorithm allows<br />
analysis of large data files.<br />
Exploratory Data Analysis<br />
Variance inflation factors were used to measure colinearity and values larger than 5 were considered prohibitive.<br />
Stepwise selection was primarily based on the AIC statistic however; likelihood ratio tests were also carried out on<br />
the AIC-based model and those covariates exhibiting p-values larger than 0.1 were also dropped from the model.<br />
The p-values resulting from these tests are shown in the table for each model.<br />
Binary Models<br />
Models for the binary outcomes were constructed using generalised linear models (GLMs) with a logic link<br />
(Equation 1) and Binomial errors (²i); the GLMs were fitted using Maximum likelihood (ML).<br />
Over Dispersion<br />
Extra-binomial dispersion was not considered for the binary outcomes analysed here. While this can easily be<br />
permitted via estimation of the (dispersion) parameter Á, this parameter is constrained to be (0,1) for binary<br />
outcomes which could only result in more conservative models with, perhaps, more predictors. Further, estimation<br />
of under-dispersion for binary outcome models would mean variable selection could not proceed using likelihood<br />
ratio tests and/or the AIC statistic.<br />
Three Outcome Models: Good/Average/Poor<br />
Proportional odds models were used to fit the three outcome models.<br />
114 | <strong>He</strong> <strong>Ritenga</strong> <strong>Whakaaro</strong>: Māori experiences of health services
Appendices 9<br />
Appendix G. Questionnaire reliability and validity<br />
Service standards measures<br />
In order to test construct validity, we investigated whether each service standard (nominal Yes/No response) was,<br />
as expected, significantly related to the overall visit evaluation question (3-point ordinal scale Good/Average/<br />
Poor). This assumption was tested using Gamma in the SPSS Crosstabs procedure. Overall, results were significant,<br />
indicating strong construct validity of service standards.<br />
For the GP section, all bar one of the service standards were significant at least to the p < .05 level.<br />
For the Specialist section, all bar one of the service standards were significant at least to the p < .05 level. The one<br />
not at this level was significant at the p < .10 level.<br />
For the A&E section, all bar one of the service standards were significant at least to the p < .10 level.<br />
For the Hospital section, all service standards were significant at least to the p < .05 level.<br />
For the Funding bodies section, all bar one service standards were significant at least to the p < .05 level<br />
Tests of reliability – Attitudes Section<br />
This section involved a series of questions about peoples’ own health as well as their attitudes towards health<br />
providers. It was designed to capture attitudes along a series of dimensions as described below:<br />
Current health status<br />
I have some concerns about my health<br />
I am in excellent health<br />
Managing my health<br />
I usually wait until the last minute to go to see a doctor<br />
I have to be quite sick before I’ll go to a doctor<br />
I expect my family/whanau to look after me when I’m sick rather than going to the doctor<br />
I don’t like taking drugs for my own illnesses<br />
Cost<br />
It is too expensive to go the doctor every time I feel sick<br />
The cost of seeing a doctor is not good value for money<br />
Interpersonal relationship with GP/doctor<br />
I have a good relationship with my GP<br />
I can trust my GP<br />
The GP treats me as well as any other patients he/she has<br />
Sense of empowerment<br />
The doctor does not treat me like an adult<br />
I don’t like to ask the doctor questions<br />
I am too shy to argue with the doctor if I think he/she is wrong<br />
<strong>Doctor</strong>s don’t really listen to their patients<br />
Cultural fit<br />
<strong>Doctor</strong>s don’t really care about their Māori patients<br />
<strong>He</strong> <strong>Ritenga</strong> <strong>Whakaaro</strong>: Māori experiences of health services | 115
9 Appendices<br />
I would prefer to see a doctor of my own ethnic group<br />
I would rather see a Māori doctor than a Pakeha doctor<br />
I would prefer to see a doctor of my own gender<br />
I would get looked after better if I was to deal with Māori people in provider<br />
Hospital should treat Māori differently to Pakeha<br />
Hospital staff don’t recognise Māori culture<br />
Dignity and respect<br />
I get well treated in the hospital<br />
Hospital staff don’t treat me with respect<br />
I don’t get treated with respect by provider<br />
The GP I last went to treated me with respect<br />
Knowledge of the health system<br />
It is hard to get a straight answer from people in the health system<br />
I get different answers from different people in provider<br />
The people in provider make it difficult for me to get what I want<br />
The doctor gave me all the information I needed get ACC<br />
Overall health system<br />
Overall I think the health system in NZ is very good<br />
Overall I think the health system in NZ is good value for money<br />
Responses were gathered using a 3 point Agree/Disagree/Neither Agree nor Disagree scale. Coefficient alphas<br />
obtained for these scales ranged from .534 to .747 which are considered acceptable according to George and<br />
Mallery (2003) who provide the following rules of thumb: > 0.9: Excellent, 0.9 - 0.8: Good, 0.8 - 0.7: Acceptable,<br />
0.7 - 0.6: Questionable, 0.6 - 0.5: Poor, and < 0.5 – Unacceptable.<br />
Coefficient Alphas By <strong>He</strong>alth Dimension<br />
Current health status . . . . . . . . . . .(.669)<br />
Managing my health . . . . . . . . . . . .(.532)<br />
Cost . . . . . . . . . . . . . . . . . . .(.556)<br />
Interpersonal relationship with GP/doctor. . .(.609)<br />
Sense of empowerment . . . . . . . . . .(.534)<br />
Cultural fit . . . . . . . . . . . . . . . .(.745)<br />
Dignity and respect . . . . . . . . . . . .(.548)<br />
Knowledge of the health system . . . . . . .(.575)<br />
Overall health system . . . . . . . . . . .(.742)<br />
The table below shows the results of an exploratory factor analysis used to group the questions according to the<br />
survey responses (Some items were reverse coded if the other items in the scale were worded oppositely e.g. I<br />
(don’t) get well treated in the hospital). A total of 9 factors were extracted, explaining 55% of the total variance.<br />
The items generally loaded together as per the hypothesised list above. Cronbach’s coefficient alpha is shown for<br />
each factor, and ranges from .281 to .757. As the table shows, the extracted dimensions fall into the questionableacceptable<br />
range of coefficient alpha.<br />
116 | <strong>He</strong> <strong>Ritenga</strong> <strong>Whakaaro</strong>: Māori experiences of health services
Appendices 9<br />
Dimensions, Individual Questions and Coefficient Alpha ()<br />
Factor<br />
loadings<br />
Cultural fit (.737)<br />
Q144 I would rather see a Māori doctor than a Pakeha doctor .742<br />
Q143 I would prefer to see a doctor of my own ethnic group .717<br />
Q154 I would get looked after better if I was to deal with Māori people in my health system<br />
provider<br />
.712<br />
Q148 Hospital should treat Māori differently to Pakeha .619<br />
Q149 Hospital staff don’t recognise Māori culture .476<br />
Dignity and respect /Knowledge of the health system (.757)<br />
Q147 Hospital staff don’t treat me with respect .667<br />
Q150 I don’t get treated with respect by provider .613<br />
Q146 I (don’t) get well treated in the hospital .541<br />
Q151 It is hard to get a straight answer from people in the health system .532<br />
Q153 The people in my health system provider make it difficult for me to get what I want .522<br />
Q140 <strong>Doctor</strong>s don’t really care about their Māori patients .453<br />
Q152 I get different answers from different people in my health system provider .413<br />
Interpersonal relationship with GP/doctor (.634)<br />
Q133 I can trust my GP .748<br />
Q132 I have a good relationship with my GP .722<br />
Q134 The GP I last went to treated me with respect .595<br />
Q141 <strong>Doctor</strong>s (do) really listen to their patients .441<br />
Cost (.505)<br />
Q128 It is too expensive to go the doctor every time I feel sick .616<br />
Q129 The cost of seeing a doctor is not good value for money .616<br />
Q145 I would prefer to see a doctor of my own gender .446<br />
Q130 I expect my family/whanau to look after me when I’m sick rather than going to the doctor .427<br />
Overall health system (.742)<br />
Q155 Overall I think the health system in NZ is very good .787<br />
<strong>He</strong> <strong>Ritenga</strong> <strong>Whakaaro</strong>: Māori experiences of health services | 117
9 Appendices<br />
Dimensions, Individual Questions and Coefficient Alpha ()<br />
Factor<br />
loadings<br />
Q156 Overall I think the health system in NZ is good value for money .785<br />
Managing my health (.505)<br />
Q125 I usually wait until the last minute to go to see a doctor .756<br />
Q127 I have to be quite sick before Ill go to a doctor .744<br />
Q131 I don’t like taking drugs for my own illnesses .501<br />
Sense of empowerment (.549)<br />
Q137 I don’t like to ask the doctor questions .784<br />
Q138 I am too shy to argue with the doctor if I think he/she is wrong .743<br />
Q136 The doctor does not treat me like an adult .434<br />
Current health status (.669)<br />
Q126 I am in excellent health .850<br />
Q142 I (don’t) have some concerns about my health .847<br />
Knowledge of the health system (.281)<br />
Q135 The GP treats me as well as any other patients he/she has .587<br />
Q139 The doctor gave me all the information I needed to get ACC .524<br />
Extraction Method: Principal Component Analysis. Rotation Method: Varimax with Kaiser Normalization. A Rotation<br />
converged in 22 iterations.<br />
118 | <strong>He</strong> <strong>Ritenga</strong> <strong>Whakaaro</strong>: Māori experiences of health services
Appendices 9<br />
Appendix H. Modelling analysis of overall satisfaction and revisit intention<br />
Diagnostics for binary outcome Binomial GLMs are limited, however models with binary predictor variables (and<br />
factor variables with more than 2 levels) are reasonably simplistic. For these analyses, partial regression plots and<br />
the cooks distance measure was used to identify high influence points. To help assess the three outcome models<br />
(i.e. with response 1=”Good”, 2=”Average” and 3=”Poor”) a table of observed versus predicted outcomes was<br />
constructed for each. For each model, the percentage of correctly classified outcomes, based on the model, is<br />
obtained and compared with the observed data.<br />
Table 29. GPs: Intention to revisit<br />
Question Estimate Lower CI Upper CI Odds p-value<br />
(Intercept) -7.7446 -10.7671848 4.7219514 2309 5.12e-07<br />
Q25 1.9628 0.1422415 3.7833625 7.119 0.0346<br />
Q26 1.7127 -0.2329933 3.6583028 5.543 0.0845<br />
Q33 2.6442 0.9591800 4.3293117 14.073 0.0021<br />
Q36 -1.7034 -3.1384722 0.2682984 5.493 0.0200<br />
Note. Parameter estimates and their upper and lower 95% confidence intervals (on the logit scale). The<br />
(multiplicative) effects of saying ‘no’ to a GP revisit when answering “no” to each of the questions. The p-values for<br />
each term are based on likelihood ratio tests.<br />
With the specified model, there is evidence that a revisit appears less likely if the respondents answered “no” to:<br />
Q25 Did the doctor ask you enough questions about what was wrong with you?<br />
Q33 Did you have confidence and trust in the doctor?<br />
This indicates that communication-related aspects are strongly associated with intention to revisit (and may<br />
therefore be a suitable indicator of experiences of care and good patient-provider rapport).<br />
There is weak evidence that a revisit appears less likely if the respondents answered “no” to:<br />
Q26 Did the doctor spend enough time listening to you?<br />
A revisit appears more likely if the respondents answered “no” to:<br />
Q36 Was this your first visit to this doctor?<br />
In other words, people who have seen the same doctor before are more likely to visit him or her again.<br />
<strong>He</strong> <strong>Ritenga</strong> <strong>Whakaaro</strong>: Māori experiences of health services | 119
9 Appendices<br />
Table 30. GPs: Overall visit rating<br />
Question Estimate Lower CI Upper CI p-value<br />
Q10 1.5750119 0.52599832 2.624025 3.366406e-03<br />
Q26 2.4361128 1.06653723 3.805688 5.307880e-04<br />
Q28 1.0549342 0.01472776 2.095141 4.686147e-02<br />
Q32 0.7677958 0.04906621 1.486525 3.635701e-02<br />
Q33 1.4426033 -0.09897715 2.984184 6.653759e-02<br />
Q34 1.8395923 -0.22427072 3.903455 8.045990e-02<br />
Q35 1.2709523 0.32354060 2.218364 8.709869e-02<br />
1|2 13.2641 9.99076914 16.537398 2.569633e-14<br />
2|3 17.1612 13.00103090 21.321290 9.643283e-15<br />
Note. Parameter estimates and their upper and lower 95% confidence intervals (on the logit scale). The<br />
(multiplicative) effects of saying ‘no’ to a GP revisit when answering ‘no’ to each of the questions. The final two<br />
parameters relate to the multinomial intercept parameter. The p-values for each term are based on likelihood ratio<br />
tests.<br />
Under the specified model, there is evidence that a good rating (rather than a poor rating) is less likely if the<br />
respondents answered “no” to:<br />
Q26 Did the doctor spend enough time listening to you?<br />
Q10 Were you seen in that timeframe? (How urgently you needed to see the doctor)<br />
Q28 Did the doctor give you a simple, clear explanation of what was wrong with you?<br />
Q32 Did the doctor explain about side effects of the treatment?<br />
There are large differences when respondents answered “no” to Q26 Did the doctor spend enough time listening to<br />
you (see Table 31 below). This re-emphasises the desire among patients to feel that their doctor listens to them and<br />
(in that manner) shows concern for them.<br />
Table 31. GPs: Overall rating vs. time spent listening<br />
Good Average Poor<br />
Yes 0.946701762 0.052156611 0.001141627<br />
No 0.60848967 0.037861671 0.01289362<br />
There is weak evidence that a good rating (rather than a poor rating) is less likely if the respondents answered “no”<br />
to:<br />
Q33 Did you have confidence and trust in the doctor?<br />
Q34 Were you and any other people with you treated with respect?<br />
Q35 Did the doctor say your name properly?<br />
The model appears to perform relatively well – correctly classifying 88.2% of the values. There is slight overprediction<br />
of “Good” scores and under-prediction of “Average” scores.<br />
120 | <strong>He</strong> <strong>Ritenga</strong> <strong>Whakaaro</strong>: Māori experiences of health services
Appendices 9<br />
Table 32. GPs: Observed vs. predicted ratings<br />
Observed Good Average Poor Predicted Total<br />
Predicted Good 284 30 1 315<br />
Average 2 13 4 19<br />
Poor 0 3 3 6<br />
Observed Total 286 46 8 340<br />
Note. Model-based classifications. 300/340 (88.2%) were correctly classified.<br />
Table 33. Specialists: Intention to revisit<br />
Question Estimate Lower CI Upper CI Odds p-value<br />
(Intercept) -8.1274 -11.0571483 -5.197574 3385 5.42e-08<br />
Q26 1.6780 0.2818457 3.074140 5.354 0.01849<br />
Q28 1.3845 -0.0708206 2.839844 3.993 0.06224<br />
Q35 1.7911 0.4363195 3.145814 5.995 0.00956<br />
Note. Parameter estimates and their upper and lower 95% confidence intervals (on the logit scale). The<br />
(multiplicative) effects of saying ‘no’ to a specialist revisit when answering “no” to each of the questions. The<br />
p-values for each term are based on likelihood ratio tests.<br />
With the specified model, there is evidence that a revisit appears less likely if the respondents answered “no” to:<br />
Q26 Did the doctor spend enough time listening to you?<br />
Q35 Did the doctor say your name properly?<br />
As with GP’s, specialists were evaluated on how well patients felt they demonstrated respect (through proper<br />
pronunciation of names) and had good communication skills (including listening).<br />
There is weak evidence that a revisit appears less likely if the respondents answered “no” to:<br />
Q28 Did the doctor give you a simple, clear explanation of what was wrong with you?<br />
<strong>He</strong> <strong>Ritenga</strong> <strong>Whakaaro</strong>: Māori experiences of health services | 121
9 Appendices<br />
Table 34. Specialists: Overall visit rating<br />
Question Estimate Lower CI Upper CI p-value<br />
Q10 1.33090 -0.32823632 2.990047 1.121308e-01<br />
Q25 2.03519 0.51007571 3.560305 8.437935e-03<br />
Q28 1.36181 -0.07561849 2.799257 6.080638e-02<br />
Q34 2.67900 -0.26821479 5.626231 7.197321e-02<br />
Q35 1.25795 -0.11380581 2.629720 6.950415e-02<br />
1|2 10.6307 6.51007181 14.751398 5.123957e-07<br />
2|3 13.0227 8.29175102 17.753655 9.081518e-08<br />
Note. Parameter estimates and their upper and lower 95% confidence intervals (on the logit scale). The<br />
(multiplicative) effects of saying ‘no’ to a specialist revisit when answering “no” to each of the questions. The final<br />
two parameters relate to the multinomial intercept parameter. The p-values for each term are based on likelihood<br />
ratio tests.<br />
With the specified model, there is strong evidence that a good rating (rather than a poor rating) is less likely if the<br />
respondents answered “no” to:<br />
Q25 Did the doctor ask you enough questions about what was wrong with you?<br />
There is weak evidence that a good rating (rather than a poor rating) is less likely if the respondents answered “no”<br />
to<br />
Q10 Were you seen in that timeframe? (How urgently you needed to see the doctor)<br />
Q28 Did the doctor give you a simple, clear explanation of what was wrong with you?<br />
Q35 Did the doctor say your name properly?<br />
The model appears to perform relatively well – correctly classifying 79% of the values. There is some overprediction<br />
of ‘Good’ scores and under-prediction of “Average” scores.<br />
Table 35. Specialists: Observed vs. predicted<br />
Observed Good Average Poor Predicted Total<br />
Predicted Good 74 15 2 91<br />
Average 0 2 2 4<br />
Poor 1 1 3 5<br />
Observed Total 75 18 7 100<br />
Observed Good Average Poor Predicted Total<br />
Predicted Good 74 15 2 91<br />
Average 0 2 2 4<br />
Poor 1 1 3 5<br />
Observed Total 75 18 7 100<br />
Note. Model-based classifications. 79/100 (79%) were correctly classified.<br />
122 | <strong>He</strong> <strong>Ritenga</strong> <strong>Whakaaro</strong>: Māori experiences of health services
Appendices 9<br />
Table 36. A&E: Intention to revisit<br />
Question Estimate Lower CI Upper CI Odds p-value<br />
(Intercept) -7.3878 -12.23388962 -2.5416343 1616 0.002809<br />
Q49 1.4280 -0.10548663 2.9615832 4.171 0.067979<br />
Q51 -2.0601 -4.47819909 0.3580158 7.847 0.094963<br />
Q59 3.1635 1.49139273 4.8355738 23.653 0.000209<br />
Q69 1.7849 -0.09568095 3.6654177 5.959 0.062851<br />
Note. Parameter estimates and their upper and lower 95% confidence intervals (on the logit scale). The<br />
(multiplicative) effects of saying ‘no’ to revisit the A&E when answering ‘no’ to each of the questions. The p-values<br />
for each term are based on likelihood ratio tests.<br />
With the specified model, there is very strong evidence a revisit appears less likely if the respondents answered<br />
“no” to:<br />
Q59 Did you think the order in which you and other patients were seen was fair?<br />
Perceptions of poor treatment, as indicated by unfairness in assigning priority, influence Māori patients not to return<br />
to the A&E.<br />
There is weak evidence a revisit appears less likely if the respondents answered “no” to:<br />
Q49 Have you been to this A&E before?<br />
Q69 Was the reason you went to the A&E dealt with to your satisfaction?<br />
There is weak evidence a revisit appears more likely if the respondents answered “no” to:<br />
Q51 Were you with anyone else for the appointment?<br />
Table 37. A&E: Overall visit rating<br />
Question Estimate Lower CI Upper CI p-value<br />
as.factor(Q57)2 -0.2662626 -2.0894248 1.556899 7.723745e-01<br />
as.factor(Q57)3 0.8995558 -0.6911336 2.490245 2.642171e-01<br />
as.factor(Q57)4 1.1108281 -0.6063278 2.827984 2.020270e-01<br />
as.factor(Q57)5 4.3442132 0.8932379 7.795189 1.419744e-02<br />
as.factor(Q57)6 0.2654433 -1.8838241 2.414711 8.067345e-01<br />
Q59 2.8061657 1.0120353 4.600296 2.526328e-03<br />
Q60 2.2936197 0.7219652 3.865274 4.698521e-03<br />
Q62 2.4481540 0.6007472 4.295561 9.968824e-03<br />
Q64 2.9883913 0.2619201 5.714863 3.205706e-02<br />
Q69 1.8754365 0.2601985 3.490674 2.336656e-02<br />
1|2 14.6873 9.5465310 19.828066 1.662812e-07<br />
2|3 17.7789 11.7771088 23.780599 6.720310e-08<br />
Note. Q57 is statistically significant within the model. Parameter estimates and their upper and lower 95%<br />
confidence intervals (on the logit scale). The (multiplicative) effects of saying “no” to revisit the A&E when<br />
answering “no” to each of the questions. The final two parameters relate to the multinomial intercept parameter.<br />
<strong>He</strong> <strong>Ritenga</strong> <strong>Whakaaro</strong>: Māori experiences of health services | 123
9 Appendices<br />
The p-values for each term are based on likelihood ratio tests. Note. the effect of Q57 on the response (Q73) are<br />
compared to a baseline level = 1.<br />
With the specified model, there is evidence that a good rating (rather than a poor rating) is less likely if the<br />
respondents answered “no” to:<br />
Q59 Did you think the order in which you and other patients were seen was fair?<br />
Q60 Did the doctor / nurse introduce him or herself?<br />
Q62 Did the doctor / nurse spend sufficient time with you to find out what was wrong?<br />
Q64 Were you given enough privacy while being examined?<br />
Q69 Was the reason you went to the A&E dealt with to your satisfaction?<br />
The model appears to perform relatively well – correctly classifying 78.4% of the values.<br />
Table 38. A&E: Observed vs. predicted<br />
Observed Good Average Poor Predicted Total<br />
Predicted Good 62 10 0 72<br />
Average 4 9 5 18<br />
Poor 0 3 9 12<br />
Observed Total 66 22 14 102<br />
Note. Model-based classifications. 80/102 (78.4%) were correctly classified.<br />
Table 39. Hospital Intention to revisit<br />
Question Estimate Lower CI Upper CI Odds p-value<br />
(Intercept) -3.5492 -6.4491441 -0.6492684 34.786 0.01645<br />
Q74 1.5971 0.5618886 2.6322193 4.938 0.00250<br />
Q78 1.7378 0.5531925 2.9225052 5.685 0.00404<br />
Q79 -1.6328 -2.7206695 -0.5449450 5.118 0.00326<br />
Note. Parameter estimates and their upper and lower 95% confidence intervals (on the logit scale). The<br />
(multiplicative) effects of saying “no” to a hospital revisit when answering “no” to each of the questions. The<br />
p-values for each term are based on likelihood ratio tests.<br />
With the specified model, there is strong evidence that a revisit appears less likely if the respondents answered “no”<br />
to:<br />
Q74 Did the staff you dealt with always introduce themselves?<br />
Q78 Were you given enough privacy during your stay in hospital?<br />
There is strong evidence that a revisit appears more likely if the respondents answered “no” to:<br />
Q79 Did the doctor, nurse and any other medical staff talk in front of you as if you weren’t there?<br />
It is important to Māori patients that they are treated with respect during their hospital stay, as indicated by the<br />
courtesy of direct conversations, proper introductions and appropriate privacy.<br />
124 | <strong>He</strong> <strong>Ritenga</strong> <strong>Whakaaro</strong>: Māori experiences of health services
Appendices 9<br />
Table 40. Hospital: Overall visit rating<br />
Question Estimate Lower CI Upper CI p-value<br />
Q75 1.541884 0.1484806 2.9352876 3.031333e-02<br />
Q78 2.611963 1.2865513 3.9373738 1.450048e-04<br />
Q79 1.091863 2.0010354 -0.1826910 1.888789e-02<br />
Q85 2.632466 1.2482066 4.0167264 2.407012e-04<br />
Q86 1.387828 0.4433635 2.3322926 4.226361e-03<br />
1|2 7.9719 4.5556703 11.3880697 8.165772e-06<br />
2|3 11.8041 7.6812835 15.9268675 6.877881e-08<br />
Note. Parameter estimates and their upper and lower 95% confidence intervals (on the logit scale). The<br />
(multiplicative) effects of saying “no” to a hospital revisit when answering “no” to each of the questions. The final<br />
two parameters relate to the multinomial intercept parameter. The p-values for each term are based on likelihood<br />
ratio tests.<br />
With the specified model, there is evidence that a good rating (rather than a poor rating) is less likely if the<br />
respondents answered “no” to:<br />
Q75 Did the doctor ask you enough questions about what was wrong with you?<br />
Q78 Were you given enough privacy during your stay in hospital?<br />
Q79 Did the doctor, nurse and any other medical staff talk in front of you as if you weren’t there?<br />
Q85 Were you and any other people with you/family members with you treated with respect?<br />
Q86 Did the doctor tell you what to expect with your illness after you left the hospital?<br />
The model appeared to perform relatively well – correctly classifying 77.6% of the values. There is slight overprediction<br />
of “Good” scores and under-prediction of “Average” scores.<br />
Table 41. Hospital: Observed vs. predicted<br />
Observed Good Average Poor Predicted Total<br />
Predicted Good 105 22 0 127<br />
Average 7 15 5 27<br />
Poor 0 4 12 16<br />
Observed Total 112 41 17 170<br />
Note. Model-based classifications. 132/170 (77.6%) were correctly classified.<br />
Table 42. Funding Bodies: Intention to revisit<br />
Question Estimate Lower CI Upper CI Odds p-value<br />
(Intercept) -7.455 -11.701289 -3.208151 1728 0.00058<br />
Q96 3.871 1.383436 6.358966 48 0.00229<br />
Note. The logistic and ordered multinomial models used to examine the data for funding bodies were based on a<br />
relatively small sample size (n =44). The parameters estimates are likely to be unstable, and it is likely that the model<br />
is overly parsimonious.<br />
Note. Parameter estimates and their upper and lower 95% confidence intervals (on the logit scale). The<br />
<strong>He</strong> <strong>Ritenga</strong> <strong>Whakaaro</strong>: Māori experiences of health services | 125
9 Appendices<br />
(multiplicative) effects of saying “no” to a revisit when answering “no” to each of the questions. The p-values for<br />
each term are based on likelihood ratio tests.]<br />
With the specified model, there is strong evidence that a revisit appears less likely if the respondents answered “no”<br />
to:<br />
Q96 Did the person listen to your views?<br />
Table 43. Funding Bodies: Overall visit rating<br />
Question Estimate Lower CI Upper CI p-value<br />
Q91 -2.127280 -3.88059852 -0.3739605 0.018692412<br />
Q102 2.392787 0.64097655 4.1445972 0.008698881<br />
Q104 1.736705 0.13994786 3.3334628 0.033800739<br />
1|2 2.9068 -0.02764062 5.8411662 0.052091172<br />
2|3 4.8336 1.52239257 8.1447261 0.005312575<br />
Note. Parameter estimates and their upper and lower 95% confidence intervals (on the logit scale). The (multiplicative)<br />
effects of saying “no” to a revisit when answering “no” to each of the questions. The final two parameters relate to the<br />
multinomial intercept parameter. The p-values for each term are based on likelihood ratio tests.<br />
With the specified model, there is evidence that a good rating (rather than a poor rating) is less likely if the<br />
respondents answered “no” to<br />
Q102 Did they give you all the information you needed about your claim or entitlements?<br />
Q104 Did you get a simple, clear explanation of what would happen after your visit?<br />
If consumers felt they weren’t listened to (and respected) by funding body staff or if the visit was unhelpful (no<br />
information about what was needed or what to expect), they reported no intention of returning to the funding<br />
body; bad experiences are understandably off-putting.<br />
A good rating (rather than a poor rating) is more likely if the respondents answered “no” to<br />
Q91 Was this your first visit to ACC over this particular issue?<br />
The model appeared to perform relatively well – correctly classifying 81.8% of the values.<br />
Table 44. Funding Bodies: Observed vs. predicted<br />
Observed Good Average Poor Predicted Total<br />
Predicted Good 26 5 0 31<br />
Average 0 4 2 6<br />
Poor 0 1 6 7<br />
Observed Total 26 10 8 44<br />
Note. Model-based classifications. 36/44 (81.8%) were correctly classified.<br />
126 | <strong>He</strong> <strong>Ritenga</strong> <strong>Whakaaro</strong>: Māori experiences of health services
Appendices 9<br />
Table 45. Other Services: Intention to revisit<br />
Question Estimate Lower CI Upper CI Odds p-value<br />
(Intercept) -9.219 -12.337943 -6.09986 1008 6.91e-09<br />
Q115 5.505 3.098388 7.912275 246 7.36e-06<br />
Note. Parameter estimates and their upper and lower 95% confidence intervals (on the logit scale). The<br />
(multiplicative) effects of saying “no” to revisit other services when answering “no” to each of the questions. The<br />
p-values for each term are based on likelihood ratio tests.<br />
With the specified model there is strong evidence that a revisit appears less likely if the respondents answered “no” to:<br />
Q115 Did you have confidence and trust in the person you met with?<br />
As was seen with the other providers, establishing a good rapport, with confidence and trust, was important to<br />
Māori consumers of Other Services.<br />
Table 46. Other Services: Overall visit rating<br />
Question Estimate Lower CI Upper CI p-value<br />
Q115 4.108094 1.0998288 7.116359 7.884604e-03<br />
Q116 3.355021 -0.2210426 6.931084 6.566398e-02<br />
Q119 2.843917 1.4083200 4.279514 1.505445e-04<br />
1|2 13.1474 8.0184897 18.276345 1.540588e-06<br />
2|3 16.9524 9.6828714 24.221920 1.036210e-05<br />
Note. Parameter estimates and their upper and lower 95% confidence intervals (on the logit scale). The<br />
(multiplicative) effects of saying “no” to revisit other services when answering “no” to each of the questions.<br />
The final two parameters relate to the multinomial intercept parameter. The p-values for each term are based on<br />
likelihood ratio tests.<br />
With the specified model, there is evidence that a good rating (rather than a poor rating) is less likely if the<br />
respondents answered “no” to<br />
Q115 Did you have confidence and trust in the person you met with?<br />
Q119 Did you get a simple, clear explanation of why you needed the treatment?<br />
The model appeared to perform relatively well – correctly classifying 85.5% of the values. There is slight underprediction<br />
of “Average” scores.<br />
Table 47. Other Services: Observed vs. predicted<br />
Observed Good Average Poor Predicted Total<br />
Predicted Good 99 11 0 110<br />
Average 2 1 1 4<br />
Poor 3 0 0 3<br />
Observed Total 104 12 1 117<br />
Note. Model-based classifications. 100/117 (85.5%) were correctly classified.<br />
References<br />
George, D., & Mallery, P. (2003). SPSS for Windows step by step: A simple guide and reference. 11.0 update (4th<br />
ed.). Boston: Allyn & Bacon.<br />
<strong>He</strong> <strong>Ritenga</strong> <strong>Whakaaro</strong>: Māori experiences of health services | 127
9 Appendices<br />
Appendix I. Demographics for Group 1 and Group 2<br />
Demographically, Group 2 is younger than Group 1 (average age: 39 vs. 47 (t-test results: t=6.284, p
Appendices 9<br />
Table 49. Attitude group Māori language ability<br />
How well do you speak<br />
the Māori language?<br />
Attitude clusters<br />
Group 1 Group 2<br />
Very well 16% 11%<br />
Well 6% 8%<br />
Fairly well 16% 20%<br />
Not very well 26% 21%<br />
A few words or phrases 24% 23%<br />
Not at all 12% 17%<br />
Total 100% 100%<br />
There are no differences between the groups with respect to income or health card use.<br />
Table 50. Attitude group demographics<br />
Do you have a<br />
Community Services<br />
Card (CSC) or High Use<br />
<strong>He</strong>alth Card (HUHC)<br />
Attitude clusters<br />
Group 1 Group 2<br />
None 54% 46%<br />
CSC only 40% 49%<br />
HUHC only 2% 2%<br />
Both 4% 2%<br />
Total 100% 100%<br />
Combined household<br />
income before tax<br />
Under $21,000 19% 21%<br />
$21,000 - $33, 000 17% 16%<br />
$33,000 - $52,000 22% 19%<br />
$52,000 - $77,000 17% 20%<br />
$77,000 and over 17% 15%<br />
Don’t Know/Refused 8% 8%<br />
Total 100% 100%<br />
<strong>He</strong> <strong>Ritenga</strong> <strong>Whakaaro</strong>: Māori experiences of health services | 129
9 Appendices<br />
Figure 7. <strong>He</strong>alth card comparison<br />
<br />
<br />
<br />
<br />
<br />
<br />
<br />
<br />
<br />
<br />
<br />
<br />
<br />
<br />
<br />
<br />
<br />
<br />
<br />
<br />
Figure 8. Income comparison<br />
<br />
<br />
<br />
<br />
<br />
<br />
<br />
<br />
<br />
<br />
<br />
<br />
<br />
<br />
<br />
130 | <strong>He</strong> <strong>Ritenga</strong> <strong>Whakaaro</strong>: Māori experiences of health services
<strong>He</strong> <strong>Ritenga</strong> <strong>Whakaaro</strong>: Māori experiences of health services | 131
132 | <strong>He</strong> <strong>Ritenga</strong> <strong>Whakaaro</strong>: Māori experiences of health services
www.mauriora.co.nz<br />
Level 1, 7 Anzac Street, Takapuna<br />
Ph (09) 486 7148 Fax (09) 486 7150