Veolia Environnement (Buy, FV EUR13) Roadshow - Bryan, Garnier ...
Veolia Environnement (Buy, FV EUR13) Roadshow - Bryan, Garnier ...
Veolia Environnement (Buy, FV EUR13) Roadshow - Bryan, Garnier ...

Create successful ePaper yourself
Turn your PDF publications into a flip-book with our unique Google optimized e-Paper software.
INDEPENDENT RESEARCH<br />
UPDATE<br />
6th March 2013<br />
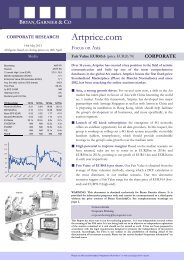
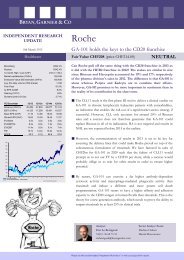
<strong>Veolia</strong> <strong>Environnement</strong><br />
<strong>Roadshow</strong> feedback – Speeding up recovery<br />
Utilities Fair Value <strong>EUR13</strong> (price EUR10.42) BUY<br />
Bloomberg<br />
Reuters<br />
VIE FP<br />
VIE.PA<br />
12-month High / Low (EUR) 12.8 / 7.4<br />
Market capitalisation (EURm) 5,438<br />
Enterprise Value (BG estimates EURm) 15,437<br />
Avg. 6m daily volume ('000 shares) 3,967<br />
Free Float 76.8%<br />
3y EPS CAGR 37.4%<br />
Gearing (12/12) 124%<br />
Dividend yield (12/13e) 6.72%<br />
YE December 12/12 12/13e 12/14e 12/15e<br />
Revenue (EURm) 29,439 23,708 24,298 24,851<br />
EBIT (EURm) 1,194 999.05 1,093 1,271<br />
Basic EPS (EUR) 0.78 0.57 0.72 0.93<br />
Diluted EPS (EUR) 0.33 0.48 0.63 0.84<br />
EV/Sales 0.6x 0.6x 0.6x 0.6x<br />
EV/EBITDA 6.7x 6.6x 6.4x 6.0x<br />
EV/EBIT 15.3x 15.5x 14.6x 12.7x<br />
P/E 32.0x 21.8x 16.6x 12.3x<br />
ROCE 5.1 5.4 5.7 6.6<br />
120<br />
110<br />
100<br />
90<br />
80<br />
70<br />
6/3/13<br />
60<br />
M A M J J A S O N D J F<br />
VEOLIA ENVIRONNEMENT<br />
STOXX EUROPE 600 E - PRICE INDEX<br />
Source: Thomson Reuters Datastream<br />
We held a roadshow for <strong>Veolia</strong>’s management team in Paris on<br />
28 February. Our positive opinion remains intact. We continue to see<br />
<strong>Veolia</strong> as an attractive self-help restructuring story: (i) the target of 3.0x<br />
Adj. Net debt/(Op. CF+OFAs) could be reached a year ahead of<br />
schedule (at YE13); (ii) the upgrade of the cost-savings programme is<br />
likely to be significant; (iii) recurring EPSs are set to grow by 37% p.a.<br />
on average between 2012 and 2015; and (iv) FCF has reached an<br />
inflection point and should cover dividends as of 2014.<br />
• Cost cutting ahead of schedule: One of the main takeaways, according<br />
to us, is the relative confidence expressed by the management team<br />
regarding its ability to cut costs. We believe the size of the cost savings<br />
programme upgrade could positively surprise. In our last note (Feb. 20), we<br />
wrote <strong>Veolia</strong> had room for extra savings to the magnitude of EUR200m.<br />
We still firmly believe this. We estimate that EUR50m of extra savings<br />
would add ~EUR1.0+ of valuation per share.<br />
• Satisfying deleveraging: Net debt is guided at EUR8-9bn at YE13 and<br />
EUR6-7bn when adjusted for loans to JVs. Note that ND should converge<br />
towards adj. ND as loans to JVs are gradually paid back over time.<br />
Management targets ~3.0x of Adj. ND/(Op. CF+OFA) by YE14; on our<br />
new estimates, we believe this could be achieved as early as YE13 (BGe<br />
3.0x). Only a few questions were about debt reduction and the deleveraging<br />
programme, suggesting the debt level is no longer a major source for<br />
concern for most investors.<br />
• Return to positive FCF: <strong>Veolia</strong> achieved EUR89m of FCF before<br />
dividend and disposals in 2012. This should also apply in 2013 according to<br />
the management. By 2015, the company targets at least EUR350-400m of<br />
FCF before dividend and disposals (BGe EUR500m), hence fully covering<br />
the EUR0.7 DPS. Generating sustainable positive FCF is, in our opinion, a<br />
key element for the stock to rerate.<br />
• Earnings trajectory well oriented: While there is no official guidance for<br />
2013-15, the company implicitly guides to a net result roughly on par with<br />
the dividend in 2014 and a potential return to historic pay-out levels in<br />
2015. Our understanding is that EPS could be close to EUR0.70 in 2014<br />
and close to EUR1.0 in 2015 vs. BGe EUR0.63 and EUR0.84.<br />
• Adjusting our estimates for new perimeter: We adjusted our estimates<br />
for the new perimeter (new IFRS rules + disposals). This explains why we<br />
stand ~23% below EBITDA consensus. Our operational assumptions<br />
remain unchanged (notably 0% GDP growth for 2013-16).<br />
Analyst:<br />
Julien Desmaretz<br />
33(0) 1 56 68 75 92<br />
jdesmaretz@bryangarnier.com<br />
r<br />
r
<strong>Veolia</strong> <strong>Environnement</strong><br />
Company description<br />
Former subsidiary of Vivendi<br />
Universal, <strong>Veolia</strong> Environment is the<br />
leading company in the environmental<br />
services sector. The group operates in<br />
water (35% of sales), waste (27%),<br />
energy services (22%) and<br />
transportation (16%). Amongst the<br />
major shareholders are: Caisse des<br />
Dépôts (9.1%), Dassault familly<br />
(5.6%) and EDF (3.7%).<br />
Income Statement (EURm) 2010 2011 2012 2013e 2014e 2015e 2016e<br />
Revenues 34,787 29,647 29,439 23,708 24,298 24,851 25,471<br />
Change (%) 0.7% -14.8% -0.7% -19.5% 2.5% 2.3% 2.5%<br />
Adjusted EBITDA 3,654 3,152 2,723 2,027 2,159 2,362 2,448<br />
Adjusted EBIT 2,056 1,701 1,194 999 1,093 1,271 1,312<br />
Change (%) 6.4% -17.3% -29.8% -16.3% 9.4% 16.3% 3.2%<br />
o/w JVs net result 0.0 0.0 0.0 122 141 172 184<br />
Financial results (907) (805) (822) (535) (513) (530) (540)<br />
Pre-Tax profits 1,213 213 273 464 580 741 772<br />
Exceptionals (23.6) (2.4) 386 0.0 0.0 0.0 0.0<br />
Tax 336 539 159 120 154 199 206<br />
Profits from associates 18.5 12.3 30.0 20.0 20.0 20.0 20.0<br />
Minority interests 291 173 136 119 121 124 127<br />
Net profit 581 (490) 394 296 375 488 509<br />
Adjusted net profit 579 290 165 249 328 441 462<br />
Change (%) 7.7% -49.9% -43.1% 51.0% 31.7% 34.4% 4.9%<br />
Cash flow Statement (EURm)<br />
Operating cash flows 3,742 3,353 3,085 2,199 2,350 2,584 2,682<br />
Change in working capital (83.0) 40.7 (103) 53.4 (5.5) (5.2) (5.8)<br />
Income tax paid 368 368 336 120 154 199 206<br />
Capex, net 1,879 2,089 2,128 1,700 1,700 1,700 1,700<br />
Financial investments, net (61.3) (952) (2,556) (975) (275) (275) (275)<br />
Dividends 736 547 547 555 565 565 565<br />
Other 651 772 (715) (2,015) 641 610 639<br />
Net debt 15,218 14,730 11,283 8,522 8,952 9,162 9,310<br />
Adjusted net debt (ex-loans to JVs) NM NM NM 6,522 6,952 7,162 7,310<br />
Free cash flow 1,152 483 555 151 326 515 607<br />
Balance Sheet (EURm)<br />
Tangible fixed assets 9,707 8,488 6,838 7,388 7,881 8,318 8,698<br />
Intangibles assets 16,133 14,881 13,085 12,085 11,785 11,485 11,185<br />
Cash & equivalents 5,407 5,724 5,548 6,730 6,139 4,474 5,734<br />
current assets 14,204 12,968 12,516 10,312 10,539 10,752 10,990<br />
Other assets 6,061 8,345 6,625 6,650 6,803 6,908 7,033<br />
Total assets 51,511 50,406 44,612 43,165 43,147 41,937 43,640<br />
L & ST Debt 21,110 21,089 17,002 15,423 15,262 13,807 15,215<br />
Others liabilities 19,506 19,481 18,485 16,227 16,459 16,677 16,921<br />
Shareholders' funds 10,895 9,835 9,126 11,515 11,426 11,452 11,503<br />
Total balance sheet 51,511 50,406 44,612 43,165 43,147 41,937 43,640<br />
Capital employed 18,638 17,483 14,142 13,745 13,933 14,064 14,139<br />
Financial Ratios<br />
Operating margin 5.91 5.74 4.05 4.21 4.50 5.11 5.15<br />
Tax rate 27.72 254 58.31 35.00 35.00 35.00 35.00<br />
Net margin 1.66 0.98 0.56 1.05 1.35 1.77 1.82<br />
ROE (after tax) 7.84 -6.48 0.11 3.54 3.95 5.15 5.36<br />
ROCE (after tax) 7.69 6.20 5.11 5.40 5.75 6.63 6.82<br />
Gearing 140 150 124 74.00 78.35 80.00 80.94<br />
Pay out ratio 101 121 215 147 111 82.90 79.04<br />
Number of shares, diluted (000) 481,200 501,644 506,700 522,087 522,087 522,087 522,087<br />
Per Share data (EUR)<br />
EPS 1.21 (0.98) 0.78 0.57 0.72 0.93 0.98<br />
Restated EPS 1.20 0.58 0.33 0.48 0.63 0.84 0.89<br />
% change 5.6% -52.0% -43.7% 46.5% 31.7% 34.4% 4.9%<br />
BVPS 22.64 19.61 18.01 22.06 21.89 21.94 22.03<br />
Operating cash flows 7.78 6.68 6.09 4.21 4.50 4.95 5.14<br />
FCF 2.39 0.96 1.10 0.29 0.63 0.99 1.16<br />
Net dividend 1.21 0.70 0.70 0.70 0.70 0.70 0.70<br />
Source: Company Data; <strong>Bryan</strong>, <strong>Garnier</strong> & Co ests.<br />
2
<strong>Veolia</strong> <strong>Environnement</strong><br />
Confident of exceeding cost<br />
cutting targets...<br />
New targets to be presented<br />
on May 3 rd<br />
Cost cutting<br />
One of the main takeaways of our roadshow with <strong>Veolia</strong>, according to us, is the relative confidence<br />
expressed by the management team regarding its ability to cut costs. With EUR100m of gross savings<br />
(EUR20m net) initially targeted in 2012 as part of its Convergence 1 plan, <strong>Veolia</strong> ended the year well<br />
above targets with EUR142m of gross savings (i.e. EUR60m net). We note this over-performance<br />
(EUR42m) was achieved with costs of implementation in line with initial projections (EUR82m<br />
achieved vs. EUR80m budgeted). This implies that the benefits of the implemented measures were<br />
42% higher than anticipations. Hence, while the plan may “only” be in line with the plan, positive<br />
impacts are much higher than expected.<br />
While the current target is to reduce costs by EUR470m (net impact on EBIT) by 2015, management<br />
fixed an appointment with investors on 3 rd May in order to present an increased cost-cutting<br />
programme. We believe that by then <strong>Veolia</strong> will have been able to show further good progress on the<br />
current plan with a meaningful impact on Q1 2013 numbers. The guidance of EUR170m of net<br />
savings in 2013 was reiterated.<br />
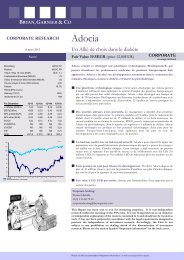
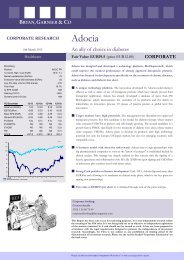
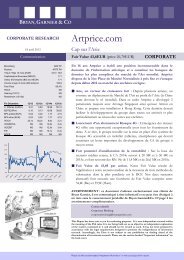
Fig. 1: Cost-cutting implementation (phase 1) Fig. 2: Net savings impact on EBIT<br />
150<br />
500<br />
100<br />
400<br />
300<br />
50<br />
200<br />
0<br />
100<br />
0<br />
-50<br />
-100<br />
Mar-12 Jun-12 Sep-12 Dec-12 2012 target<br />
Gross cost savings Implementation costs Net savings<br />
-100<br />
Phase 1 Phase 2 Phase 1 Phase 2 Phase 1 Phase 2 Phase 1 Phase 2<br />
2012 2013 2014 2015<br />
Gross savings Costs Net savings Total net savings<br />
Source: Company data<br />
Source: Company data; <strong>Bryan</strong>, <strong>Garnier</strong> & Co ests<br />
Improving the overall<br />
performance of <strong>Veolia</strong><br />
Newly-appointed COO François Bertreau presented his ambitions for <strong>Veolia</strong>. His aim is to improve<br />
<strong>Veolia</strong>’s overall performance. This includes: (i) the marketing performance, thanks to the clear<br />
determination of what it wants to sell and to whom and the appointment of key account managers; (ii)<br />
the operational performance, by setting up division-by-division benchmarks; and (iii) the geographic<br />
mutualisation.<br />
Of the many credible examples that were provided, we list the following:<br />
• Geographic mutualisation of support functions: Bertreau said that the geographic<br />
mutualisation (on a country-to-country basis) could help <strong>Veolia</strong> to reduce significantly its cost<br />
base in the short- to medium-term. The initial target provided at the December 2011 capital<br />
market day only includes EUR80m of contribution from this side. A Chief Administrative<br />
Officer will be appointed in order to keep an eye on these related activities.<br />
• Purchases: While <strong>Veolia</strong> has EUR14.0bn of purchases per year, only 20% are centralised. The<br />
COO thinks there is a lack of discipline in this segment. Systematically resorting to wholesalers<br />
and centralising purchases on a country-to-country level should help the company to make<br />
substantial savings. Of the EUR14bn of purchases per year, <strong>Veolia</strong> believes EUR9.0bn is<br />
3
<strong>Veolia</strong> <strong>Environnement</strong><br />
addressable. We think this could be reduced by at least 5.0%. This would mean EUR450m of<br />
gross savings for the group. According to the management team, this new plan was tested in<br />
Poland where purchases were reduced by 8%. Even if we believe it is far too early and<br />
optimistic to extrapolate this to the whole group, this would equate to EUR720m of savings on<br />
a group basis.<br />
A profound cultural change<br />
EUR200m room for<br />
manoeuvre in our view<br />
One of the main difficulties in <strong>Veolia</strong>’s restructuring story is the implementation of a significant<br />
cultural change. Ensuring all managers are committed to delivering is not an easy task. However,<br />
management says 70% of the bonus of the top 400 managers is based on clear quantitative targets<br />
(50% EBIT and 50% cash-flow generation).<br />
We have long supported <strong>Veolia</strong>’s current cost-cutting programme, believing official targets were<br />
relatively conservative and cautious. In our last research note (cf. February 20 th – “’New <strong>Veolia</strong>’ emerging<br />
with improved risk-profile”), we wrote that we believed <strong>Veolia</strong> had at least EUR200m of room for<br />
manoeuvre. We still firmly believe this. As <strong>Veolia</strong> did not want to increase its cost-savings targets at<br />
the FY12 results, we believe this translates the relative significant size of the upgrade. Otherwise, we<br />
do not believe management would have raised market expectations if this is set to be a limited<br />
increase. This should also help to make credible the future target as the management team will have<br />
had time to back it up.<br />
The table below shows the sensitivity of our 2015 EPS estimates to different assumptions for<br />
achieved cost-cutting targets, all else being equal.<br />
Fig. 3:<br />
BG 2015e EPS sensitivity to cost savings<br />
Achieved savings [Eurm] 350 400 450 470 500 550 600 650 700 750 800<br />
2015 EPS ests. [EUR] 0.69 0.76 0.82 0.84 0.88 0.94 1.01 1.07 1.13 1.19 1.26<br />
vs. BGe -17.8% -10.4% -3.0% 0.0% 4.4% 11.8% 19.3% 26.7% 34.1% 41.5% 48.9%<br />
2015e PER 14.9 13.7 12.6 12.3 11.7 11.0 10.3 9.7 9.1 8.7 8.2<br />
Fair value @ 15x 2015e EPS 10.4 11.4 12.3 12.7 13.2 14.2 15.1 16.0 17.0 17.9 18.9<br />
Source: Company Data; <strong>Bryan</strong>, <strong>Garnier</strong> & Co ests.<br />
High debt no longer a<br />
concern<br />
Disposals, deleveraging and new IFRS rules<br />
Apart from investors’ questions aiming at a better understanding the new IFRS rules, we noticed that<br />
few were directed to the debt reduction and deleveraging programme, implying this no longer a major<br />
concern for most French investors.<br />
4
<strong>Veolia</strong> <strong>Environnement</strong><br />
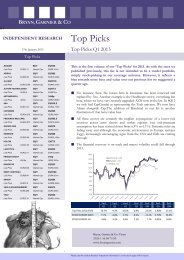
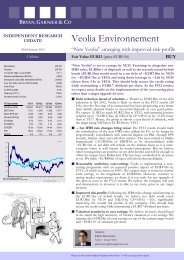
17<br />
15<br />
13<br />
11<br />
9<br />
7<br />
5<br />
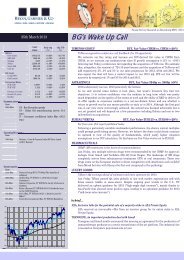
2008-2013e deleveraging<br />
Source: Company data; <strong>Bryan</strong>, <strong>Garnier</strong> &<br />
Co.ests.<br />
Deleveraging<br />
In 2012, <strong>Veolia</strong> sold EUR3.7bn of assets. This represents 74% of the EUR5.0bn programme covering<br />
2012 and 2013. 68% of the proceeds contributed to the debt reduction. As a result, net debt decreased<br />
EUR3.4bn to EUR11.3bn at YE12 from (EUR14.7bn at YE11). The net debt positively benefited<br />
from the deconsolidation of EUR1.4bn of debt linked to the Berlin water contract (BWB) following<br />
the change of the shareholders’ structure in Q4 2012. As a consequence, leverage reached 3.26x at<br />
YE12 down from 3.88x at YE11.<br />
The company still expects to exit from 40 countries between 2011 and 2013 and operate in<br />
40 countries only at YE13 (down from 48 at YE12). This is being done by selling profitable assets and<br />
exiting from unprofitable countries (Morocco, Egypt and Italy...).<br />
New IFRS rules<br />
New IFRS rules (JVs no longer proportionally consolidated) have strong implications for <strong>Veolia</strong>’s<br />
financial statements. In 2012, the JVs contributed EUR6.3bn of sales, EUR801m of EBITDA,<br />
EUR394m of EBIT and EUR49m of net income. They also represented EUR866m of gross capex.<br />
These numbers include BWB for the first 10 months of 2012 (BGe ~EUR120m) but also the<br />
EUR82m one-off charge related to Dalkia in Italy (through Dalkia International). As a consequence,<br />
EUR2.3bn of net debt is removed from <strong>Veolia</strong>’s balance sheet (including EUR1.4bn for BWB).<br />
Despite removing the related EBITDA, ~EUR2.0bn of net debt remains on <strong>Veolia</strong>’s balance sheet<br />
are they are inter-company loans. In the table below we present our estimates of 2012 pro forma<br />
factoring in new IFRS rules.<br />
Fig. 4:<br />
2012 key metrics pro forma<br />
Sales EBITDA D&A EBIT<br />
Water 10,005 802 381 445<br />
Waste 7,960 917 564 300<br />
Energy 4,911 284 109 187<br />
Others 243 (113) 19 (165)<br />
Total 23,118 1,889 1,073 767<br />
Source: Company Data; <strong>Bryan</strong>, <strong>Garnier</strong> & Co ests.<br />
Factoring in these impacts, <strong>Veolia</strong> translated its initial target in order to comply with the new IFRS<br />
rules. Hence, net debt is now guided to EUR8-9bn by YE13. <strong>Veolia</strong> also introduced an adjusted net<br />
debt metric excluding the EUR2.0bn of loans to JVs. Hence, <strong>Veolia</strong> expects to reach EUR6-7bn of<br />
adjusted net debt by YE13. It is important to understand that net debt will convergence towards the<br />
adjusted net debt in the future, as loans to JVs will be repaid. So, we believe there is an economic<br />
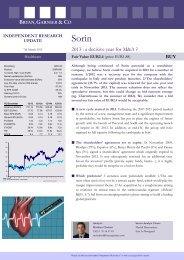
reason why <strong>Veolia</strong> has introduced this “adjusted net debt” concept. The adjusted ND/(Op. CF +<br />
OFA) is targeted at 3.0x by YE14. Barring a strong macro impact on EBITDA, we believe this target<br />
could be achieved as soon as 2013. Indeed, on our estimates, <strong>Veolia</strong>’s leverage will reach 2.99x at<br />
YE13, down from an estimated 3.06x in 2012 (BGe).<br />
5
<strong>Veolia</strong> <strong>Environnement</strong><br />
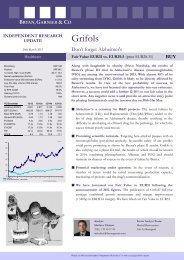
Fig. 5:<br />
Leverage could be one year ahead of schedule<br />
8,000<br />
7,000<br />
6,000<br />
5,000<br />
4,000<br />
3,000<br />
2,000<br />
2012 2013e 2014e 2015e 2016e<br />
3.10<br />
3.05<br />
3.00<br />
2.95<br />
2.90<br />
2.85<br />
2.80<br />
Adj. Net debt<br />
Adj. ND/(Op. CF+OFA)<br />
Source: Company Data; <strong>Bryan</strong>, <strong>Garnier</strong> & Co ests.<br />
Credit rating<br />
The question mark is whether these changes will affect credit ratings. Management said that following<br />
first informal contacts rating agencies have not said that this changes everything. While <strong>Veolia</strong>’s rating<br />
at Moody’s benefits from a leeway there is more pressure on the S&P side, where <strong>Veolia</strong> struggles to<br />
meet the FFO/ND ratio of 20%. Next reviews are not planned before May.<br />
BWB, Dalkia International and VTD<br />
<strong>Veolia</strong> deconsolidated EUR1.4bn of net debt from the Berlin water contract and EUR140m of<br />
EBITDA. However, it has retained its 25% stake, while Berlin’s regional government owns the<br />
remaining 75%. If <strong>Veolia</strong> does not manage to keep the operation of the Berlin water network, we<br />
understand the group will seek to divest its stake to Berlin’s regional government. The value would be<br />
close to EUR600-650m and is not part of the asset disposal programme.<br />
The exit trajectory from VTD has been clearly defined co-jointly with the CDC, the financial arm of<br />
the French government. CDC and <strong>Veolia</strong> will convert EUR520m and EUR280m of debt into equity,<br />
respectively. Once done, <strong>Veolia</strong>’s net debt will have a EUR500m exposure to VTD. Simultaneously to<br />
this recapitalisation, financial debt is expected to be raised. Moreover, proceeds from disposals at<br />
VTD’s level (assets in Central and Eastern Europe as well as in Asia...) will serve to repay <strong>Veolia</strong>. The<br />
EUR500m exposure is included in the 2013 EUR1bn divestment target. At a later stage, probably in<br />
2014, <strong>Veolia</strong> will seek to sell its remaining 40% stake in VTD; this should be a two-step exit.<br />
The management team clarified its positioning vis-à-vis Dalkia International (DKI). This subsidiary<br />
amounts to EUR370m of EBITDA at 100%. The 2012 performance of DKI was very satisfying, with<br />
11% EBITDA growth (excluding the EUR82m charge in Italy) which was improved by the changes<br />
in scope. <strong>Veolia</strong> is seeking a way out of the EUR1.7bn debt consolidated in its balance sheet related to<br />
DKI while the EUR300m of EBITDA is removed. However, any rational solutions tend to be<br />
avoided by one of the party. While <strong>Veolia</strong> does not want to divest from this strongly growing JV (25%<br />
EDF/75% Dalkia leading EDF and <strong>Veolia</strong> to own 50% each of DKI), the group will keep seeking by<br />
all means to at least keep the control of DKI and at best take full ownership.<br />
6
<strong>Veolia</strong> <strong>Environnement</strong><br />
Cash management<br />
2012 was also the occasion for the group to proactively manage its debt in order to not increase its<br />
cash level despite the significant disposals. Net of new issuance, <strong>Veolia</strong> bought back EUR1.7bn and<br />
USD0.56m for a one-off cost of EUR47m in 2012. As a result, the repayment schedule is relatively<br />
smooth with no important peak. The company is likely to continue managing quite proactively its<br />
debts in 2013. An important condition is that the NPV of such moves must remain positive.<br />
Hybrid bonds<br />
Management clarified the rationale of the issuance of a EUR1.5bn (EUR1.0bn at 4.5% and GBP0.4m<br />
at 4.875%) at the start of 2013 although <strong>Veolia</strong> has a relatively strong liquidity position. The aim of<br />
the group was to benefit from attractive rates and spreads in order to: (i) increase its room for<br />
manoeuvre vis-à-vis rating agencies during the execution of the restructuring programme; (ii) be<br />
prompt to react if it has the opportunity to buy-back partners (if earnings accretive). While this will be<br />
treated as 100% equity under IFRS rules, and 50% equity by rating agencies (until it is repaid for<br />
Moody’s and until April 2018 for S&P). According to the CFO, this has no vocation to remain long<br />
on the balance-sheet and it is highly likely to be paid back when callable (April 2018).<br />
7
<strong>Veolia</strong> <strong>Environnement</strong><br />
EUR1.4bn of net capex p.a.<br />
down from EUR2.1bn<br />
Capex, FCF generation and dividends<br />
Capex targets<br />
New IFRS rules were also the occasion for the group to reset its capex guidance as of 2013. At the<br />
2011 capital markets day, <strong>Veolia</strong> guided for gross capex of EUR2.5bn per year as well as disposals of<br />
EUR0.4m per annum. The new target is now gross capex of EUR1.7bn and net capex of EUR1.4bn<br />
p.a. The difference comes from new IFRs rules (EUR500m less), the deconsolidation of Berlin (BGe<br />
EUR150m of capex p.a.) and capex reduction as announced last summer.<br />
New gross capex target represents ~7% of sales. The company intends to keep a bit of leeway here as<br />
it wants to be able to have the opportunity to buy-out partners in JVs, either for synergies (if earnings<br />
accretive; for instance in Proactiva or Northern Europe) or accelerating the exit from this asset.<br />
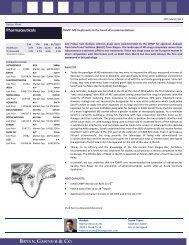
2012 quarterly performance<br />
3,500<br />
103<br />
371<br />
-2,023<br />
3,000<br />
2,748<br />
2,500<br />
2,000<br />
1,500<br />
-1,110<br />
1,000<br />
FCF<br />
Adding new capex guidance to cost savings should allow <strong>Veolia</strong> to continue to improve its FCF<br />
profile. <strong>Veolia</strong> achieved EUR89m of FCF before dividend and disposals in 2012 and this should also<br />
apply in 2013 according to the management. The company targets EUR350-400m of FCF before<br />
dividend and disposals by 2015. This will be enough to pay the dividend of EUR0.7 per share, which<br />
represents EUR365m p.a. if fully paid in cash.<br />
500<br />
0<br />
Op. CF OFA Working<br />
cap.<br />
Source: Company data<br />
89<br />
Capex Others FCF<br />
Generating sustainable positive FCF is, in our opinion, a key element for the stock to be rerated.<br />
Investors had long been pessimistic about the ability of the group to contain its debt and/or pay the<br />
dividend. The return to positive FCF before dividend in 2012 and the target of positive FCF for 2013<br />
as well should help make credible both: (i) the positive impact of cost-cutting measures; and (more<br />
importantly to us) (ii) the sustainability of the EUR0.7 dividend.<br />
Fig. 6:<br />
FCF trajectory over 2013-16e [EURm]<br />
800<br />
600<br />
400<br />
200<br />
0<br />
-200<br />
-400<br />
2013 2014 2015 2016<br />
FCF before didivends<br />
FCF after didivends<br />
Source: Company Data; <strong>Bryan</strong>, <strong>Garnier</strong> & Co ests.<br />
Dividend secured as long as<br />
earnings’ trajectory improves<br />
Dividend<br />
Management has extended the EUR0.7 dividend per share for at least an extra year (up to 2014).<br />
From a cash management point of view, there is no issue here. We believe <strong>Veolia</strong>’s dividend policy is<br />
based upon the development of underlying earnings. As long as the group is on track to achieve its<br />
restructuring, the EUR0.7 DPS will be guaranteed. While there is no official guidance for 2013-15, the<br />
company implicitly guides for a net result roughly on par with the dividend in 2014 and a potential<br />
8
<strong>Veolia</strong> <strong>Environnement</strong><br />
return to historic pay-out levels in 2015. Our understanding is that EPS could be close to EUR0.70 in<br />
2014 and close to EUR1.0 in 2015. This compares to new BG estimates of EUR0.68 and EUR0.95<br />
(before impact from hybrid bonds).<br />
5 growth pillars<br />
Investments in China are<br />
now paying off; FCF>0 in<br />
2012<br />
Growth pillars<br />
Most of the growth capex will be oriented towards the attractive growing markets. While today only<br />
30% of revenues come from these regions, <strong>Veolia</strong> intends to bring this to 50% by 5 years from now.<br />
The five growth pillars are: (i) Water in Eastern and Central; (ii) Energy services in Eastern and<br />
Central Europe; (iii) Water in China; (iv) Waste in UK; and (v) Hazardous waste. These growth<br />
platforms should add EUR400m of EBITDA between 2011 and 2015. In 2012, they contributed<br />
EUR68m to EBITDA.<br />
China is a good example. For instance, <strong>Veolia</strong> already successfully grew Water EBITDA in China by<br />
18% p.a. between 1999 and 2012. For the first time, <strong>Veolia</strong> achieved FCF breakeven in China in 2011.<br />
And in 2012, positive FCF stood at ~EUR30m. China has reached the end of a long capex cycle. The<br />
P&L of the Chinese activities are set to improve meaningfully.<br />
Hazardous waste is an emerging growth platform and was not included in the 2011 CMD. The two<br />
drivers of this division will be: (i) the dismantling of nuclear plants, a market value of EUR200bn over<br />
20 years according to management and EUR30bn in France only; and (ii) water treatment for the oil,<br />
gas and mining businesses.<br />
Price pressure easing<br />
All players are suffering<br />
2012 quarterly performance<br />
6%<br />
4%<br />
2%<br />
0%<br />
-2%<br />
-4%<br />
-6%<br />
1Q12 2Q12 3Q12 4Q12<br />
Reported growth s [y/y %] Organic growth [y/y %]<br />
Source: Company data<br />
French water trends<br />
Price pressure<br />
The French water market represents 10% of <strong>Veolia</strong>’s revenues and 13% of EBITDA. The group has<br />
not seen degradation in trading conditions recently. It continues to expect a EUR50m p.a. negative<br />
impact from contract renegotiations in 2012-15. According to the company, current price pressure is<br />
less intense than in the past.<br />
Management said that all players are evenly impacted by the trend. However, it thinks <strong>Veolia</strong> is the<br />
first group to have renegotiated large contracts while peers have only recently started (2011 for Saur<br />
and 2012 for Suez <strong>Environnement</strong>). Suez’s contract portfolio is most exposed to sewage businesses,<br />
where the price pressure is somewhat lower than the drinking water segment. This makes the negative<br />
impact less clear than for <strong>Veolia</strong>. Moreover, management believes it will be able to recover 50% of the<br />
profits lost from contract renegotiations endured between 2010 and 2015.<br />
Waste business trends<br />
In 2012, <strong>Veolia</strong> achieved a stable activity in the Waste division. Despite tough volume conditions,<br />
<strong>Veolia</strong> managed to grow organically by +3.0% in Q4 2012, vs. a decline in the three other quarters.<br />
This was helped by market share gains in hazardous waste volumes in France. Overall treated volumes<br />
were flat in 2012 vs. -1% at end-September 2012. In Q4 2012, waste volumes of <strong>Veolia</strong> benefitted<br />
from a deadweight effect, particularly in Australia and in incineration in France.<br />
Whereas it is too early to get a precise indication of the business trends from the beginning of 2013,<br />
the CEO indicated that volumes were in line with Q4, with volumes tending to be declining. There<br />
seems to be no inflection point yet. Remember that for 2013 Q1 will be tough basis of comparison,<br />
which will ease in Q2 and be standard in H2.<br />
9
<strong>Veolia</strong> <strong>Environnement</strong><br />
The figures below show the recent recyclates prices. For 2013, we retain the average price year-todate.<br />
If prices were to remain at current levels, this would imply a relatively neutral price effect in<br />
2013.<br />
Fig. 7: Paper prices 1.04 [EUR/t] Fig. 8: Ferrous metal prices E40 [EUR/t]<br />
120<br />
250%<br />
350<br />
60%<br />
100<br />
200%<br />
300<br />
40%<br />
80<br />
60<br />
40<br />
20<br />
-<br />
2005 2006 2007 2008 2009 2010 2011 2012 2013<br />
150%<br />
100%<br />
50%<br />
0%<br />
-50%<br />
-100%<br />
250<br />
200<br />
150<br />
100<br />
50<br />
0<br />
1997<br />
1998<br />
1999<br />
2000<br />
2001<br />
2002<br />
2003<br />
2004<br />
2005<br />
2006<br />
2007<br />
2008<br />
2009<br />
2010<br />
2011<br />
2012<br />
2013<br />
20%<br />
0%<br />
-20%<br />
-40%<br />
-60%<br />
Price [LHS]<br />
y/y % [RHS]<br />
Price [LHS]<br />
y/y % [RHS]<br />
Source: Revipap<br />
Source: <strong>Bryan</strong>, <strong>Garnier</strong> & Co ests<br />
Fig. 9: Aluminium prices [USD/t] Fig. 10: PET prices [EUR/t]<br />
3,000<br />
40%<br />
1,600<br />
30%<br />
2,500<br />
2,000<br />
1,500<br />
1,000<br />
500<br />
-<br />
1994<br />
1995<br />
1996<br />
1997<br />
1998<br />
1999<br />
2000<br />
2001<br />
2002<br />
2003<br />
2004<br />
2005<br />
2006<br />
2007<br />
2008<br />
2009<br />
2010<br />
2011<br />
2012<br />
2013<br />
30%<br />
20%<br />
10%<br />
0%<br />
-10%<br />
-20%<br />
-30%<br />
-40%<br />
1,400<br />
1,200<br />
1,000<br />
800<br />
600<br />
400<br />
200<br />
-<br />
2009 2010 2011 2012 2013<br />
25%<br />
20%<br />
15%<br />
10%<br />
5%<br />
0%<br />
-5%<br />
-10%<br />
Price [LHS]<br />
y/y % [RHS]<br />
Price [LHS]<br />
y/y % [RHS]<br />
Source: Datastream<br />
Source: Datastream<br />
10
<strong>Veolia</strong> <strong>Environnement</strong><br />
Factoring in new IFRS rules<br />
Changes in estimates<br />
We updated our estimates to reflect the new IFRS rules. This leads us to removing ~EUR6.3bn of<br />
sales and ~EUR800m of EBITDA. This explains why we stand ~23% below EBITDA consensus.<br />
The impact on EPS is broadly neutral. Excluding the impact of the hybrid bonds, our 2013 EPS goes<br />
from EUR0.55 to EUR0.57 and our 2014 EPS is increased to EUR0.72 from EUR0.68. Factoring in<br />
the hybrid bonds (EUR70m charge before taxes) brings our 2013 and 2014 EPS to EUR0.48 and<br />
EUR0.63 respectively. EUR0.63 EPS in 2014 compares to a dividend per share of EUR0.7 and the<br />
implicit guidance of an EPS on par with the dividend by then.<br />
~37% EPS CAGR between<br />
2012 and 2015<br />
Despite modelling a tough macro environment (no GDP growth by 2016), we expect <strong>Veolia</strong> to<br />
increase its EPS by 37% per annum on average between 2012 and 2015. Hence, we continue to see<br />
<strong>Veolia</strong> as an attractive self-help story.<br />
The tables below detail our estimates for <strong>Veolia</strong> between 2013 and 2016..<br />
Fig. 11: Estimates changes summary – BG. vs. consensus<br />
2013e<br />
2014e<br />
Revenue EBITDA EPS Revenue EBITDA EPS<br />
New Old New Old New Old New Old New Old New Old<br />
BG 23,708 28,594 2,027 2,707 0.48 0.55 24,298 29,533 2,159 2,921 0.63 0.68<br />
Cons (IBES) 27,835 2,650 0.57 28,344 2,774 0.76<br />
BGe vs. cons -14.8% -23.5 -0.48% -14.3% -22.2% -17.3%<br />
Source: Company Data; <strong>Bryan</strong>, <strong>Garnier</strong> & Co ests.<br />
Fig. 12: Revenues breakdown by division [EURm]<br />
2008 2009 2010 2011 2012 2013e 2014e 2015e 2016e 2013-16<br />
CAGR<br />
Water 12,558 12,556 12,128 12,617 12,078 10,098 10,299 10,448 10,646 1.8%<br />
y/y % 14.9% 0.0% -3.4% 4.0% -4.3% -16.4% 2.0% 1.4% 1.9%<br />
Waste 10,144 9,056 9,312 9,740 9,083 7,942 8,054 8,168 8,282 1.4%<br />
y/y % 10.1% -10.7% 2.8% 4.6% -6.7% -12.6% 1.4% 1.4% 1.4%<br />
Energy 7,449 7,079 7,582 7,290 7,665 5,425 5,696 5,981 6,280 5.0%<br />
y/y % 8.0% -5.0% 7.1% -3.9% 5.1% -29.2% 5.0% 5.0% 5.0%<br />
Transport 6,054 5,860 5,765 - - - - - - n/a<br />
y/y % 8.3% -3.2% -1.6% - - - - - -<br />
Others - - - - 613 243 249 255 261 2.5%<br />
y/y % - - - - - -60.4% 2.5% 2.5% 2.5%<br />
Total 36,205 34,551 34,787 29,647 29,439 23,708 24,298 24,851 25,471 2.4%<br />
y/y % 11.0% -4.6% 0.7% -14.8% -0.7% -19.5% 2.5% 2.3% 2.5%<br />
Source: Company Data; <strong>Bryan</strong>, <strong>Garnier</strong> & Co ests.<br />
11
<strong>Veolia</strong> <strong>Environnement</strong><br />
Fig. 13: EBITDA breakdown by division [EURm]<br />
2008 2009 2010 2011 2012 2013e 2014e 2015e 2016e 2013-16<br />
CAGR<br />
Water 1,821 1,801 1,479 1,462 1,172 858 877 928 953 3.6%<br />
y/y % -1.1% -17.9% -1.1% -19.8% -26.8% 2.2% 5.8% 2.7%<br />
% of sales 14.5% 14.3% 12.2% 11.6% 9.7% 8.5% 8.5% 8.9% 9.0%<br />
Waste 1,362 1,194 1,297 1,197 1,048 918 975 1,066 1,103 6.3%<br />
y/y % -12.3% 8.6% -7.7% -12.5% -12.4% 6.2% 9.3% 3.5%<br />
% of sales 13.4% 13.2% 13.9% 12.3% 11.5% 11.6% 12.1% 13.0% 13.3%<br />
Energy 755 737 690 598 544 339 376 437 460 10.7%<br />
y/y % -2.4% -6.4% -13.4% -8.9% -37.7% 10.8% 16.3% 5.3%<br />
% of sales 10.1% 10.4% 9.1% 8.2% 7.1% 6.3% 6.6% 7.3% 7.3%<br />
Transport 292 312 329 0 0 0 0 0 0 n/a<br />
y/y % 6.7% 5.7% 0.0% 0.0% 0.0% 0.0% 0.0% 0.0%<br />
% of sales 4.8% 5.3% 5.7% 0.0% 0.0% 0.0% 0.0% 0.0% 0.0%<br />
Holding/Others (94) (105) (141) (105) (42) (89) (69) (69) (69) -7.9%<br />
y/y % 12.0% 34.5% -25.5% -60.0% 110.8% -22.0% 0.0% 0.0%<br />
Total EBITDA 4,137 3,939 3,654 3,152 2,723 2,027 2,159 2,362 2,448 6.5%<br />
y/y % -4.8% -7.2% -13.7% -13.6% -25.6% 6.5% 9.4% 3.6%<br />
% of sales 11.4% 11.4% 10.5% 10.6% 9.4% 8.5% 8.9% 9.5% 9.6%<br />
Source: Company Data; <strong>Bryan</strong>, <strong>Garnier</strong> & Co ests.<br />
12
<strong>Veolia</strong> <strong>Environnement</strong><br />
Fig. 14: EBIT breakdown by division [EURm]<br />
2008 2009 2010 2011 2012 2013e 2014e 2015e 2016e 2013-16 CAGR<br />
Water 1,196 1,164 1,020 972 674 452 451 483 488 2.5%<br />
y/y % -5.5% -2.7% -12.4% -4.7% -30.7% -32.9% -0.2% 6.9% 1.0%<br />
% of sales 9.5% 9.3% 8.4% 7.7% 5.6% 4.5% 4.4% 4.6% 4.6%<br />
Waste 641 360 609 508 356 320 348 409 417 9.2%<br />
y/y % -20.3% -43.8% 69.3% -16.6% -29.9% -10.2% 8.7% 17.6% 1.9%<br />
% of sales 6.3% 4.0% 6.5% 5.2% 3.9% 4.0% 4.3% 5.0% 5.0%<br />
Energy 425 416 460 386 299 236 267 323 341 13.2%<br />
y/y % 9.4% -2.0% 10.5% -16.1% -22.7% -21.1% 13.4% 21.1% 5.6%<br />
% of sales 5.7% 5.9% 6.1% 5.3% 3.9% 4.3% 4.7% 5.4% 5.4%<br />
Transport 130 158 146 - - - - - - n/a<br />
y/y % 12.6% 22.1% -7.9% - - - - - -<br />
% of sales 2.1% 2.7% 2.5% - - - - - -<br />
Holding/Others (108) (166) (179) (166) (135) (131) (114) (116) (118) -3.5%<br />
y/y % 4.4% 54.4% 7.6% -7.6% -18.6% -2.7% -13.2% 1.8% 1.8%<br />
Total 2,283 1,932 2,056 1,701 1,194 877 953 1,099 1,128 8.7%<br />
y/y % -7.5% -15.4% 6.4% -17.3% -29.8% -26.5% 8.6% 15.4% 2.6%<br />
% of sales 6.3% 5.6% 5.9% 5.7% 4.1% 3.7% 3.9% 4.4% 4.4%<br />
+ Joint Ventures - - - - - 122 141 172 184 14.7%<br />
EBIT + JVs 2,283 1,932 2,056 1,701 1,194 999 1,093 1,271 1,312 9.5%<br />
y/y % -7.5% -15.4% 6.4% -17.3% -29.8% -16.3% 9.4% 16.3% 3.2%<br />
% of sales 6.3% 5.6% 5.9% 5.7% 4.1% 4.2% 4.5% 5.1% 5.2%<br />
Source: Company Data; <strong>Bryan</strong>, <strong>Garnier</strong> & Co ests.<br />
13
<strong>Veolia</strong> <strong>Environnement</strong><br />
Price Chart and Rating History<br />
<strong>Veolia</strong> <strong>Environnement</strong><br />
28<br />
5/3/13<br />
26<br />
24<br />
22<br />
20<br />
18<br />
16<br />
14<br />
12<br />
10<br />
8<br />
6<br />
2010 2011 2012<br />
VEOLIA ENVIRONNEMENT<br />
Source: Thomson Reuters Datastream<br />
Ratings<br />
Date Ratings Price<br />
10-03-11 BUY EUR11.07<br />
Target Price<br />
Date<br />
Target price<br />
14-01-13 <strong>EUR13</strong><br />
04-09-12 EUR12.9<br />
23-11-11 EUR14.3<br />
03-10-11 EUR15<br />
14
<strong>Veolia</strong> <strong>Environnement</strong><br />
BUY<br />
NEUTRAL<br />
SELL<br />
<strong>Bryan</strong> <strong>Garnier</strong> stock rating system<br />
For the purposes of this Report, the <strong>Bryan</strong> <strong>Garnier</strong> stock rating system is defined as follows:<br />
Stock rating<br />
Positive opinion for a stock where we expect a favourable performance in absolute terms over a period of 6 months from the publication of a<br />
recommendation. This opinion is based not only on the <strong>FV</strong> (the potential upside based on valuation), but also takes into account a number of<br />
elements including a SWOT analysis, positive momentum, technical aspects and the sector backdrop. Every subsequent published update on the stock<br />
will feature an introduction outlining the key reasons behind the opinion.<br />
Opinion recommending not to trade in a stock short-term, neither as a BUYER or a SELLER, due to a specific set of factors. This view is intended to<br />
be temporary. It may reflect different situations, but in particular those where a fair value shows no significant potential or where an upcoming binary<br />
event constitutes a high-risk that is difficult to quantify. Every subsequent published update on the stock will feature an introduction outlining the key<br />
reasons behind the opinion.<br />
Negative opinion for a stock where we expect an unfavourable performance in absolute terms over a period of 6 months from the publication of a<br />
recommendation. This opinion is based not only on the <strong>FV</strong> (the potential downside based on valuation), but also takes into account a number of<br />
elements including a SWOT analysis, positive momentum, technical aspects and the sector backdrop. Every subsequent published update on the stock<br />
will feature an introduction outlining the key reasons behind the opinion.<br />
Distribution of stock ratings<br />
BUY ratings 51.4% NEUTRAL ratings 27.5% SELL ratings 21.1%<br />
1 <strong>Bryan</strong> <strong>Garnier</strong> shareholding<br />
in Issuer<br />
2 Issuer shareholding in <strong>Bryan</strong><br />
<strong>Garnier</strong><br />
Research Disclosure Legend<br />
<strong>Bryan</strong> <strong>Garnier</strong> & Co Limited or another company in its group (together, the “<strong>Bryan</strong> <strong>Garnier</strong> Group”) has a<br />
shareholding that, individually or combined, exceeds 5% of the paid up and issued share capital of a company<br />
that is the subject of this Report (the “Issuer”).<br />
The Issuer has a shareholding that exceeds 5% of the paid up and issued share capital of one or more members<br />
of the <strong>Bryan</strong> <strong>Garnier</strong> Group.<br />
3 Financial interest A member of the <strong>Bryan</strong> <strong>Garnier</strong> Group holds one or more financial interests in relation to the Issuer which are<br />
significant in relation to this report<br />
4 Market maker or liquidity<br />
provider<br />
A member of the <strong>Bryan</strong> <strong>Garnier</strong> Group is a market maker or liquidity provider in the securities of the Issuer or<br />
in any related derivatives.<br />
5 Lead/co-lead manager In the past twelve months, a member of the <strong>Bryan</strong> <strong>Garnier</strong> Group has been lead manager or co-lead manager<br />
of one or more publicly disclosed offers of securities of the Issuer or in any related derivatives.<br />
6 Investment banking<br />
agreement<br />
A member of the <strong>Bryan</strong> <strong>Garnier</strong> Group is or has in the past twelve months been party to an agreement with the<br />
Issuer relating to the provision of investment banking services, or has in that period received payment or been<br />
promised payment in respect of such services.<br />
7 Research agreement A member of the <strong>Bryan</strong> <strong>Garnier</strong> Group is party to an agreement with the Issuer relating to the production of<br />
this Report.<br />
8 Analyst receipt or purchase<br />
of shares in Issuer<br />
The investment analyst or another person involved in the preparation of this Report has received or purchased<br />
shares of the Issuer prior to a public offering of those shares.<br />
9 Remuneration of analyst The remuneration of the investment analyst or other persons involved in the preparation of this Report is tied<br />
to investment banking transactions performed by the <strong>Bryan</strong> <strong>Garnier</strong> Group.<br />
10 Corporate finance client In the past twelve months a member of the <strong>Bryan</strong> <strong>Garnier</strong> Group has been remunerated for providing<br />
corporate finance services to the issuer or may expect to receive or intend to seek remuneration for corporate<br />
finance services from the Issuer in the next six months.<br />
11 Analyst has short position The investment analyst or another person involved in the preparation of this Report has a short position in the<br />
securities or derivatives of the Issuer.<br />
12 Analyst has long position The investment analyst or another person involved in the preparation of this Report has a long position in the<br />
securities or derivatives of the Issuer.<br />
13 <strong>Bryan</strong> <strong>Garnier</strong> executive is<br />
an officer<br />
A partner, director, officer, employee or agent of the <strong>Bryan</strong> <strong>Garnier</strong> Group, or a member of such person’s<br />
household, is a partner, director, officer or an employee of, or adviser to, the Issuer or one of its parents or<br />
subsidiaries. The name of such person or persons is disclosed above.<br />
14 Analyst disclosure The analyst hereby certifies that neither the views expressed in the research, nor the timing of the publication of<br />
the research has been influenced by any knowledge of clients positions and that the views expressed in the<br />
report accurately reflect his/her personal views about the investment and issuer to which the report relates and<br />
that no part of his/her remuneration was, is or will be, directly or indirectly, related to the specific<br />
recommendations or views expressed in the report.<br />
15 Other disclosures Other specific disclosures: Report sent to Issuer to verify factual accuracy (with the recommendation/rating,<br />
price target/spread and summary of conclusions removed).<br />
A copy of the <strong>Bryan</strong> <strong>Garnier</strong> & Co Limited conflicts policy in relation to the production of research is available at www.bryangarnier.com<br />
No<br />
No<br />
No<br />
No<br />
No<br />
No<br />
No<br />
No<br />
No<br />
No<br />
No<br />
No<br />
No<br />
Yes<br />
No<br />
15
London<br />
Paris<br />
New York<br />
26 Avenue des Champs Elysées 750 Lexington Avenue<br />
75008 Paris<br />
New York, NY 10022<br />
Tel: +33 (0) 1 56 68 75 00<br />
Tel: +1 (0) 212 337 7000<br />
Fax: +33 (0) 1 56 68 75 01 Fax: +1 (0) 212 337 7002<br />
Regulated by the<br />
FINRA and SIPC member<br />
Financial Services Authority (FSA) and<br />
l’Autorité des Marchés Financiers<br />
(AMF)<br />
Geneva<br />
rue de Grenus 7<br />
CP 2113<br />
Genève 1, CH 1211<br />
Tel +4122 731 3263<br />
Fax+4122731 3243<br />
Regulated by the<br />
Swiss Federal Banking<br />
Commission<br />
New Delhi<br />
The Imperial Hotel<br />
Janpath<br />
New Delhi 110 001<br />
Tel +91 11 4132 6062<br />
+91 98 1111 5119<br />
Fax +91 11 2621 9062<br />
Dowgate Hill House<br />
14-16 Dow Gate Hill<br />
London EC4R 2SU<br />
Tel: +44 (0) 207 332 2500<br />
Fax: +44 (0) 207 332 2559<br />
Authorised and regulated by<br />
the Financial Services<br />
Authority (FSA)<br />
Important information<br />
This independent investment research report (the “Report”) was prepared by <strong>Bryan</strong> <strong>Garnier</strong> & Co Limited and is being distributed only to clients of <strong>Bryan</strong> <strong>Garnier</strong> & Co Limited<br />
(the “Firm”). <strong>Bryan</strong> <strong>Garnier</strong> & Co Limited is authorised and regulated by the Financial Services Authority (the “FSA”) and is a member of the London Stock Exchange.<br />
This Report is provided for information purposes only and does not constitute an offer, or a solicitation of an offer, to buy or sell relevant securities, including securities mentioned<br />
in this Report and options, warrants or rights to or interests in any such securities. This Report is for general circulation to clients of the Firm and as such is not, and should not be<br />
construed as, investment advice or a personal recommendation. No account is taken of the investment objectives, financial situation or particular needs of any person.<br />
The information and opinions contained in this Report have been compiled from and are based upon generally available information which the Firm believes to be reliable but the<br />
accuracy of which cannot be guaranteed. All components and estimates given are statements of the Firm, or an associated company’s, opinion only and no express representation<br />
or warranty is given or should be implied from such statements. All opinions expressed in this Report are subject to change without notice. To the fullest extent permitted by law<br />
neither the Firm nor any associated company accept any liability whatsoever for any direct or consequential loss arising from the use of this Report. Information may be available to<br />
the Firm and/or associated companies which are not reflected in this Report. The Firm or an associated company may have a consulting relationship with a company which is the<br />
subject of this Report.<br />
This Report may not be reproduced, distributed or published by you for any purpose except with the Firms’ prior written permission. The Firm reserves all rights in relation to this<br />
Report.<br />
Past performance information contained in this Report is not an indication of future performance. The information in this report has not been audited or verified by an<br />
independent party and should not be seen as an indication of returns which might be received by investors. Similarly, where projections, forecasts, targeted or illustrative returns or<br />
related statements or expressions of opinion are given (“Forward Looking Information”) they should not be regarded as a guarantee, prediction or definitive statement of fact or<br />
probability. Actual events and circumstances are difficult or impossible to predict and will differ from assumptions. A number of factors, in addition to the risk factors stated in this<br />
Report, could cause actual results to differ materially from those in any Forward Looking Information.<br />
Disclosures specific to clients in the United Kingdom<br />
This Report has not been approved by <strong>Bryan</strong> <strong>Garnier</strong> & Co Limited for the purposes of section 21 of the Financial Services and Markets Act 2000 because it is being distributed in<br />
the United Kingdom only to persons who have been classified by <strong>Bryan</strong> <strong>Garnier</strong> & Co Limited as professional clients or eligible counterparties. Any recipient who is not such a<br />
person should return the Report to <strong>Bryan</strong> <strong>Garnier</strong> & Co Limited immediately and should not rely on it for any purposes whatsoever.<br />
Notice to US investors<br />
This research report (the “Report”) was prepared by <strong>Bryan</strong> <strong>Garnier</strong> & Co. Ltd. for information purposes only. The Report is intended for distribution in the United States to<br />
“Major US Institutional Investors” as defined in SEC Rule 15a-6 and may not be furnished to any other person in the United States. Each Major US Institutional Investor which<br />
receives a copy of this Report by its acceptance hereof represents and agrees that it shall not distribute or provide this Report to any other person. Any US person that desires to<br />
effect transactions in any security discussed in this Report should call or write to our US affiliated broker, <strong>Bryan</strong> <strong>Garnier</strong> Securities, LLC. 750 Lexington Avenue, New York NY<br />
10022. Telephone: 1-212-337-7000.<br />
This Report is based on information obtained from sources that <strong>Bryan</strong> <strong>Garnier</strong> & Co. Ltd. believes to be reliable and, to the best of its knowledge, contains no misleading, untrue or<br />
false statements but which it has not independently verified. Neither <strong>Bryan</strong> <strong>Garnier</strong> & Co. Ltd. and/or <strong>Bryan</strong> <strong>Garnier</strong> Securities LLC make no guarantee, representation or<br />
warranty as to its accuracy or completeness. Expressions of opinion herein are subject to change without notice. This Report is not an offer to buy or sell any security.<br />
<strong>Bryan</strong> <strong>Garnier</strong> Securities, LLC and/or its affiliate, <strong>Bryan</strong> <strong>Garnier</strong> & Co. Ltd. may own more than 1% of the securities of the company(ies) which is (are) the subject matter of this<br />
Report, may act as a market maker in the securities of the company(ies) discussed herein, may manage or co-manage a public offering of securities for the subject company(ies), may<br />
sell such securities to or buy them from customers on a principal basis and may also perform or seek to perform investment banking services for the company(ies).<br />
<strong>Bryan</strong> <strong>Garnier</strong> Securities, LLC and/or <strong>Bryan</strong> <strong>Garnier</strong> & Co. Ltd. are unaware of any actual, material conflict of interest of the research analyst who prepared this Report and are also<br />
not aware that the research analyst knew or had reason to know of any actual, material conflict of interest at the time this Report is distributed or made available.