BG's Wake Up Call - Bryan, Garnier & Co
BG's Wake Up Call - Bryan, Garnier & Co
BG's Wake Up Call - Bryan, Garnier & Co

Create successful ePaper yourself
Turn your PDF publications into a flip-book with our unique Google optimized e-Paper software.
25th March 2013<br />
BG’s <strong>Wake</strong> <strong>Up</strong> <strong>Call</strong><br />
Please find our Research on Bloomberg BRYG )<br />
Last<br />
close<br />
Daily chg<br />
(%)<br />
Chg YTD<br />
(%)<br />
Indices<br />
Dow Jones 14512.03 +0.63% +10.74%<br />
S&P 500 1556.89 +0.72% +9.16%<br />
Nasdaq 3245 +0.70% +7.47%<br />
Nikkei 12546.46 +1.69% +18.69%<br />
Stoxx 600 294.038 -0.15% +5.14%<br />
CAC 40 3770.29 -0.12% +3.55%<br />
Oil /Gold<br />
Crude WTI 93.39 +1.46% +1.64%<br />
Gold (once) 1608.38 -0.35% -3.25%<br />
Currencies/Rates<br />
EUR/USD 1.2997 +0.55% -1.42%<br />
EUR/CHF 1.222 -0.02% +1.26%<br />
German 10 years 1.372 0.00 +5.62%<br />
French 10 years 2.013 +0.29% +1.15%<br />
Euribor 0.215 +1.90% +14.97%<br />
Economic releases :<br />
Date<br />
25th-Mar US - Ben Bernanke speaks<br />
US - Dallas fed manufacturing survey (3.4<br />
exp.)<br />
IT - <strong>Co</strong>nsumer confidence Index Mar. (85.5<br />
exp.)<br />
<strong>Up</strong>coming BG events :<br />
Date<br />
18th-Apr<br />
Recent reports :<br />
Date<br />
21st-Mar<br />
20th-Mar<br />
8th-Mar<br />
8th-Mar<br />
7th-Mar<br />
6th-Mar<br />
300<br />
290<br />
280<br />
270<br />
260<br />
Nuclear - <strong>Co</strong>sts & Financial risks (BG Paris Lunch<br />
with B. Dessus)<br />
Pennon Group (BUY, FV 800p) The benefits of<br />
inflation!<br />
Grifols (Buy, FV EUR31 vs. 29.5) Don't forget<br />
Alzheimer's<br />
Adocia (<strong>Co</strong>rporate, FV EUR19.5) An ally of choice in<br />
diabetes<br />
Roche (Neutral, FV CHF208) GA-101 holds the keys<br />
to the CD20 franchise<br />
Sorin (Buy, FV EUR2.4) 2013 : a decisive year for<br />
M&A ?<br />
Veolia Environnement (Buy, FV EUR13) Roadshow<br />
25/3/13<br />
TEMENOS GROUP BUY, Fair Value CHF26 vs. CHF24 (+20%)<br />
TriNovus acquisition conference call feedback: the US opportunity<br />
We reiterate our Buy rating and increase our DCF-derived fair value to CHF26 from<br />
CHF24, as we increase our medium-term sales lfl growth assumption (+11% vs. +10%)<br />
following last Friday’s conference call regarding the acquisition of TriNovus. We estimate<br />
that, altogether, the renewal of T24 10-year licences and the acquisition of TriNovus will<br />
add respectively 2%, 3% and 5% to our sales projections for 2013, 2014 and 2015. We<br />
also expect the deal will have a neutral impact to our 2013 adj. EPS est. but will be<br />
accretive by respectively 1% and 3% for 2014 and 2015.<br />
ASTRAZENECA BUY, Fair Value 3540p vs. 3400p (+9%)<br />
2018 substantially too low, 2013 potentially the bottom<br />
As we said several times before it took place, last week’s Investors Day had two<br />
objectives: 1) to restore confidence over the medium to long term which was pretty<br />
much dependent on the quality of the teams at work and the ability of R&D to deliver; 2)<br />
to offer upside to consensus numbers in a not-too-distant future and see whether a<br />
return to growth was by any means possible as early as in 2014. Although the first goal<br />
was in our view more convincingly achieved, the second was deemed achievable but is<br />
not yet granted and will depend on a few parameters including Brilinta and one or two<br />
tailored bolt-on acquisitions.<br />
BUREAU VERITAS BUY, Fair Value EUR125 vs. EUR100 (+29%)<br />
Far from over (full report published today<br />
Following a particularly enviable stockmarket performance, the share's current multiples<br />
could prompt profit-taking moves. However, we believe the share could clearly continue<br />
its uptrend in view of the quality of fundamentals, which justify higher valuation<br />
assumptions in our DCF calculation. On this basis our Fair Value works out to EUR125.<br />
PHARMACEUTICALS<br />
CHMP: MS treatments in the heart of recommendations<br />
Last Friday, two multiple sclerosis drugs were recommended by the CHMP for approval:<br />
Aubagio from Sanofi and Tecfidera (BG-12) from Biogen. The landscape of MS drugs<br />
completely moves from subcutaneous treatments (IFN) to oral treatments. These two<br />
drugs come on the European market in direct competition with interferons such as Rebif<br />
from Merck but also with Gilenya the first oral compound in this pathology.<br />
LUXURY GOODS<br />
Tiffany’s Q4 earnings ahead of estimates and more optimism for 2013<br />
Last Friday Tiffany posted Q4 sales globally in line with market expectations and with<br />
Xmas season (stable at same-store). Despite ongoing poor trends in the U.S., TIF<br />
delivered an upbeat guidance for 2013 (“high-single digit increase”), mainly thanks to<br />
Asia-Pacific that showed some positive signs, leading to an optimistic guidance for 2013<br />
(“mid-teens sales increase”).<br />
In brief...<br />
AXA, Exclusive talks for the potential sale of a majority stake in AXA Private Equity<br />
AXA received an irrevocable offer from an investor group for its entire stake in AXA<br />
Private Equity.<br />
TRANSGENE, An important production deal with Sanofi<br />
Transgene and Sanofi jointly announced this morning an agreement for the production of<br />
immunotherapy products on a newly-created state of the art platform. The industrial site<br />
is located on Genzyme’s polyclonals site in Lyon<br />
250<br />
240<br />
230<br />
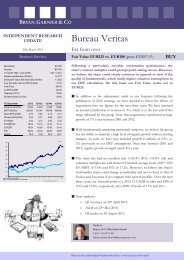
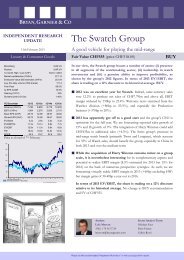
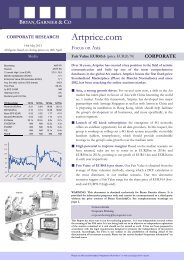
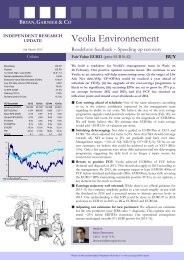
M A M J J A S O N D J F M<br />
STOXX EUROPE 600 E - PRICE INDEX
BG’s <strong>Wake</strong> <strong>Up</strong> <strong>Call</strong><br />
Back to front page<br />
IT Software & Services<br />
Temenos Group<br />
TriNovus acquisition conference call feedback: the US opportunity<br />
Price CHF21.70 Fair Value CHF26 vs. CHF24 (+20%) BUY<br />
Bloomberg<br />
TEMN SW<br />
Reuters<br />
TEMN.SW<br />
12-month High / Low (CHF) 21.7 / 10.3<br />
Market Cap (CHF) 1,562<br />
Ev (BG Estimates) (CHF) 1,629<br />
Avg. 6m daily volume (000) 342.5<br />
3y EPS CAGR 30.5%<br />
We reiterate our Buy rating and increase our DCF-derived fair value to CHF26 from CHF24, as we<br />
increase our medium-term sales lfl growth assumption (+11% vs. +10%) following last Friday’s<br />
conference call regarding the acquisition of TriNovus. We estimate that, altogether, the renewal<br />
of T24 10-year licences and the acquisition of TriNovus will add respectively 2%, 3% and 5% to our<br />
sales projections for 2013, 2014 and 2015. We also expect the deal will have a neutral impact to<br />
our 2013 adj. EPS est. but will be accretive by respectively 1% and 3% for 2014 and 2015.<br />
1 M 3 M 6 M 31/12/12<br />
Absolute perf. 8.8% 35.6% 47.1% 35.6%<br />
Softw.& <strong>Co</strong>mp. 2.7% 5.3% 10.6% 5.1%<br />
SVS<br />
DJ Stoxx 600 1.9% 4.7% 6.6% 5.1%<br />
YEnd Dec. (US$m) 2012 2013e 2014e 2015e<br />
Sales 450.2 477.3 522.2 589.0<br />
% change 6.0% 9.4% 12.8%<br />
EBITDA 131 155 180 212<br />
EBIT 48.1 87.9 110.2 139.5<br />
% change 82.7% 25.3% 26.6%<br />
Net income 62.4 94.7 113.4 138.8<br />
% change 51.7% 19.7% 22.4%<br />
2012 2013e 2014e 2015e<br />
Operating margin 21.5 25.2 26.9 28.8<br />
Net margin 5.4 13.6 16.1 18.6<br />
ROE 6.2 15.0 17.3 18.4<br />
ROCE 17.1 20.9 24.8 30.7<br />
Gearing 25.0 16.5 0.6 -20.7<br />
(US$) 2012 2013e 2014e 2015e<br />
EPS 0.79 1.19 1.43 1.75<br />
% change - 51.7% 19.7% 22.4%<br />
P/E 29.3x 19.3x 16.2x 13.2x<br />
FCF yield (%) 1.9% 4.3% 5.7% 7.3%<br />
Dividends (US$) 0.3 0.4 0.5 0.6<br />
Div yield (%) 1.3% 1.7% 2.2% 2.6%<br />
EV/Sales 3.9x 3.6x 3.2x 2.6x<br />
EV/EBITDA 13.4x 11.2x 9.2x 7.3x<br />
EV/EBIT 18.1x 14.4x 11.8x 9.1x<br />
ANALYSIS<br />
• No excessive acquisition price. Temenos expects TriNovus to contribute USD8m to 2013 sales.<br />
TriNovus’s revenue structure is typical of SaaS vendors, i.e. 70-80% in SaaS and 20-30% in<br />
Services. Customers pay for 5-year subscriptions and TriNovus’s USD17m contracted revenues<br />
are due within the next 3-3.5 years. Temenos will pay 1.5x contracted revenues, i.e. c.USD26m,<br />
which represents c.2.6x 2013 est. annualised 2013 revenue, which we estimate at c.USD10m.<br />
Such a multiple is way below the average of listed SaaS vendors (Salesforce.com’s EV/sales<br />
multiple is above 8x).<br />
• Technical integration under way. Temenos has already started the process of integrating its<br />
T24 platform with TriNovus’s services, of which the most important is Tri<strong>Co</strong>mply, which helps<br />
compliance officers to keep abreast of the latest regulatory requirements. What is helping<br />
Temenos to make such integration pretty easy - it is planned to be achieved some time in 2013<br />
- is the fact the pre-packaged US functionality (model bank) already exists as it had been<br />
developed in cooperation with Metavante (purchased by FIS since) between 2007 and 2009.<br />
• How to get to c.USD30-60m sales by 2016? While TriNovus is expected to account for 2% of<br />
sales, Temenos anticipates it would account for 5-10% in under 3 years, i.e. an est. USD30-60m.<br />
This is expected to be achieved through cross-selling between TriNovus’s installed base (800<br />
banks of all sizes, of which 75-80% are based in the Southern part of the US) and Temenoss’<br />
products (T24, BI, Private Wealth, Payments) on a SaaS or hosted mode, and, if the customer<br />
asks for, on premise. This will require some investments in sales and marketing, which should<br />
not prevent TriNovus from increasing margins and reach Temenos’s levels in under 3 years.<br />
Such cross-selling is deemed to significantly increase the average selling price (which is very<br />
low) thanks to Temenos’s products.<br />
• Opportunity to benefit from the consolidation of the US market. The US <strong>Co</strong>re banking<br />
solutions market is dominated by FIS, Fiserv and Jack Henry Associates, who primarily through<br />
their solutions provide transaction processing services with outdated technologies (including<br />
“batch” processing) and multiple inflexible core systems. Given that changing customer<br />
behaviour and new regulations are serious challenges for US banks, there is a chance Temenos<br />
may be successful in dislodging incumbents in some cases as it could be a serious alternative to<br />
them.<br />
VALUATION<br />
• Our new DCF-derived fair value of CHF26 (vs. CHF24) is based on medium-term lfl revenue<br />
growth rate of 11% (vs. 10%) and a medium-term adj. EBIT margin of 29% (vs. 30%).<br />
• Temenos’ shares are trading at est. 14.4x 2013 and 11.8x 2014 EV/EBIT multiples.<br />
• Net debt on 31 st December 2012 was USD96.7m (net gearing: 25%).<br />
NEXT CATALYSTS<br />
• Q1 13 results on 23 rd April before markets open.<br />
• TCF 2013 user conference on 14 th -16 th May in Abu Dhabi (UAE).<br />
Analyst :<br />
Gregory Ramirez<br />
33(0) 1 56 68 75 91<br />
gramirez@bryangarnier.com<br />
25 March 2013 2
BG’s <strong>Wake</strong> <strong>Up</strong> <strong>Call</strong><br />
Back to front page<br />
Healthcare<br />
AstraZeneca<br />
2018 substantially too low, 2013 potentially the bottom<br />
Price 3,236p Fair Value 3540p vs. 3400p (+9%) BUY<br />
Bloomberg<br />
AZN LN<br />
Reuters<br />
AZN.L<br />
12-month High / Low (p) 3,236 / 2,591<br />
Market Cap (GBP) 40,390<br />
Ev (BG Estimates) (GBP) 39,855<br />
Avg. 6m daily volume (000) 2,318<br />
3y EPS CAGR -4.6%<br />
1 M 3 M 6 M 31/12/12<br />
Absolute perf. 9.6% 10.1% 10.0% 11.2%<br />
Healthcare 3.9% 9.5% 10.2% 10.2%<br />
DJ Stoxx 600 1.9% 4.7% 6.6% 5.1%<br />
YEnd Dec. (USDm) 2012 2013e 2014e 2015e<br />
Sales 27,973 26,447 26,693 26,988<br />
% change -5.5% 0.9% 1.1%<br />
EBITDA 10,666 7,791 9,631 9,989<br />
EBIT 8,148 5,141 6,981 7,339<br />
% change -36.9% 35.8% 5.1%<br />
Net income 8,662 6,679 6,992 7,260<br />
% change -22.9% 4.7% 3.8%<br />
2012 2013e 2014e 2015e<br />
Operating margin 29.1 19.4 26.2 27.2<br />
Net margin 22.3 13.6 19.0 20.1<br />
ROE 26.4 15.1 20.8 21.2<br />
ROCE 21.0 13.1 17.8 26.0<br />
Gearing 10.9 0.0 -7.2 -21.1<br />
(USD) 2012 2013e 2014e 2015e<br />
EPS 6.87 5.34 5.70 5.96<br />
% change - -22.2% 6.8% 4.5%<br />
P/E 7.2x 9.2x 8.6x 8.3x<br />
FCF yield (%) 1.9% 9.9% 10.3% 12.1%<br />
Dividends (USD) 2.8 2.8 2.8 2.8<br />
Div yield (%) 5.7% 5.7% 5.7% 5.7%<br />
EV/Sales 2.3x 2.3x 2.2x 2.0x<br />
EV/EBITDA 5.9x 7.8x 6.1x 5.5x<br />
EV/EBIT 7.8x 11.8x 8.4x 7.5x<br />
As we said several times before it took place, last week’s Investors Day had two objectives: 1) to<br />
restore confidence over the medium to long term which was pretty much dependent on the<br />
quality of the teams at work and the ability of R&D to deliver; 2) to offer upside to consensus<br />
numbers in a not-too-distant future and see whether a return to growth was by any means<br />
possible as early as in 2014. Although the first goal was in our view more convincingly achieved,<br />
the second was deemed achievable but is not yet granted and will depend on a few parameters<br />
including Brilinta and one or two tailored bolt-on acquisitions.<br />
ANALYSIS<br />
• What AstraZeneca was very good at during this Investors Day was to convince that something<br />
had already happened within the company that makes it more likely to succeed in the future<br />
compared to its poor track-record, notably in R&D. We met many people that either joined the<br />
company over the last 3 years or are reviving under the new management which includes not<br />
only Pascal Soriot who is the architect we heard a lot of positives about but also other key<br />
leaders like Briggs Morrison (Head of Development and Chief Medical Officer) or previous<br />
MedImmune people. We found the team both enthusiastic and very knowledgeable.<br />
• The various presentations about R&D left us convinced that AstraZeneca has now adjusted and<br />
adapted to the requirements of the science and regulations of the various agencies around the<br />
world. We found many similarities with what was wrong at Sanofi when Chris Viehbacher joined:<br />
complexity, bureaucracy, inability to kill and to select projects, lack of openness to the external<br />
world, mistrust in biology and sequencing, etc … A lot has been turned in the right direction over<br />
the last 2 years and the first fruit should be ready to be picked in the next 2 years. In the oncology<br />
and respiratory fields, AstraZeneca showed very interesting new data which should give rise to<br />
assets which are currently not meaningfully or not at all valued by the Street. On the first hand,<br />
moxetumomab (hairy cell leukaemia), selumetinib (lung cancer) and olaparib (ovarian cancer)<br />
could all start phase III in 2013 and some to go filing with phase II data. On the other hand,<br />
benralizumab (anti-IL5) and tralokinumab (anti-IL13) are fast followers behind GSK and Roche<br />
respectively whereas AZD2115 and AZD5423 could be respectively first MABA and first SGRM to<br />
market.<br />
• At this stage, there is a dilemma with a company like AstraZeneca, i.e. a pure play where R&D is<br />
facing an upturn which is likely to translate into a re-rating. We are not capturing well the<br />
potential growth ahead because only phase III assets are included into our models. We thus<br />
decided to at least add compounds in late phase III whose proof of concept had previously been<br />
made by competitors: this is true for selumetinib (although not in mutated kras lung cancer,<br />
hence with a POS of only 20%), for benralizumab (POS of 40% vs 50% for mepolizumab at GSK),<br />
for tralokinumab (POS of 20%, equal to Roche’s lebrikizumab) and we are re-introducing<br />
olaparib (only in ovarian cancer) whose data will be presented at ASCO but sound very good<br />
already with a potential filing based on phase II in Europe.<br />
• All those ignored or undervalued assets in R&D form the base of management’s confidence to<br />
“substantially beat the 2018 consensus” of USD21.5bn in revenues. We were around that level<br />
too, mainly because we gave no value to assets prior to phase III.<br />
• Now the second origin for a better-than-expected performance relies on the growth platforms,<br />
o/w Brilinta and emerging markets will play a more significant role. This is where AstraZeneca<br />
has to accelerate to capture more available growth. We are very comfortable with our<br />
assumptions about Brilinta and above consensus numbers although a bit aggressive for 2013. In<br />
emerging markets, we are likely to be too shy but it is always more difficult to reflect<br />
performance as the reporting of sales is product-oriented rather geography-driven. However,<br />
with new manufacturing capacities coming on-stream in India, in China and in Russia, with<br />
increasing support, new products being approved and launched in key segments like COPD,<br />
diabetes and thrombosis, we are not fully appreciating the opportunity of emerging markets for<br />
AstraZeneca. The same is true for Japan where Nexium, Symbicort COPD and Brilinta are huge<br />
opportunities. Just a word on diabetes to say that the excitement is maximum with Forxiga at<br />
AstraZeneca and so this drug will to be carefully monitored. The drug which should be re-filed<br />
in the US by mid-2013 could be approved by year-end. We have a USD600m contribution in<br />
2020 (as a reminder this is a 50% share of gross profits as a consequence of the agreement with<br />
BMS).<br />
• And so in the end, what does that mean for AstraZeneca in 2014 and 2015? When asked<br />
whether there could be a chance for 2013 to be the bottom year, CFO Simon Lowth answered<br />
positively. But it is far from certain. First, AstraZeneca has to make sure it will be able to regain<br />
25 March 2013 3
BG’s <strong>Wake</strong> <strong>Up</strong> <strong>Call</strong><br />
Back to front page<br />
momentum in emerging markets, even more importantly to successfully re-launch Brilinta in<br />
the US. Second, P&L top and bottom lines could not behave in parallel as new cost-cutting<br />
initiatives will deliver significant savings in 2014 and 2015 (USD450m and USD650m<br />
respectively in the two years). Third, in order to be more comfortable with an objective of<br />
stability or growth for the top-line in 2014, AstraZeneca would need one or two business<br />
development initiatives themselves able to translate into immediate extra growth.<br />
VALUATION<br />
• In conclusion, AstraZeneca has set the scenario for the upcoming years. Not all will change in<br />
the short term but we identify different elements that can surprise positively. So, from now on,<br />
either we wait and see and act on facts or we confirm that AstraZeneca is starting on its new<br />
journey and that it is worth jumping on the train sooner rather than later.<br />
• We made various changes to our model, not all positive. We factored in the new restructuring<br />
programmes both in R&D and in SG&A. We included new R&D assets as illustrated above,<br />
although with low POS as of yet. All in all, our new FV stands at 3,540 p which represents a 9%<br />
upside to the current share price without any change to our valuation metrics. Hence we could<br />
have argued that AstraZeneca could deserve a lower specific risk premium (currently 75bp on<br />
top of the equity risk premium) or that a 1% long-term growth rate is too low but we did not<br />
want anything to be seen as artificial. Moreover it is our belief that the re-rating will be gradual<br />
and that part of it will only happen once the company starts delivering on promises. So our<br />
WACC remains at 8.29% i.e. the highest in our universe. Our BUY rating is maintained.<br />
NEXT CATALYSTS<br />
• Q2-2013: phase II data for benralizumab (asthma) and phase III start, phase II data for<br />
tralokinumab (asthma), presentation of phase II data for olaparib in BCRAm ovarian cancer and<br />
selumetinib in KRASm lung cancer at ASCO, phase III start for moxetumomab in hairy cell<br />
leukemia (orphan designation);<br />
• H2-2013: tralokinumab (asthma) phase III start, brodalumab (psoriasis) phase III start, olaparib<br />
filing in Europe in BCRAm ovarian cancer<br />
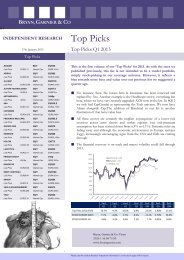
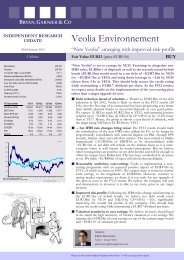
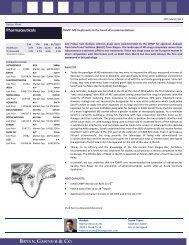
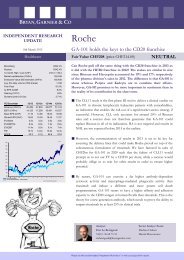
Two selected charts from AstraZeneca’s pack of slides (Investor Day, March 2013)<br />
Click here to download document<br />
Analyst :<br />
Eric Le Berrigaud<br />
33(0) 1 56 68 75 33<br />
eleberrigaud@bryangarnier.com<br />
Sector Team :<br />
Mathieu Chabert<br />
Martial Descoutures<br />
25 March 2013 4
BG’s <strong>Wake</strong> <strong>Up</strong> <strong>Call</strong><br />
Back to front page<br />
Business Services<br />
Bureau Veritas<br />
Far from over (full report published today<br />
Price EUR97.15 Fair Value EUR125 vs. EUR100 (+29%) BUY<br />
Bloomberg<br />
BVI FP<br />
Reuters<br />
BVI.PA<br />
12-month High / Low (EUR) 100.1 / 64.2<br />
Market Cap (EURm) 10,731<br />
Ev (BG Estimates) (EURm) 11,923<br />
Avg. 6m daily volume (000) 141.5<br />
3y EPS CAGR 12.8%<br />
1 M 3 M 6 M 31/12/12<br />
Absolute perf. 0.5% 14.8% 25.4% 14.8%<br />
Industry 1.9% 4.7% 6.6% 5.1%<br />
DJ Stoxx 600 1.9% 4.7% 6.6% 5.1%<br />
YEnd Dec. (EURm) 2012 2013e 2014e 2015e<br />
Sales 3,903 4,343 4,685 5,084<br />
% change 11.3% 7.9% 8.5%<br />
EBITDA 661 790 871 976<br />
EBIT 639.2 718.4 794.8 885.7<br />
% change 12.4% 10.6% 11.4%<br />
Net income 402.6 459.8 513.1 576.8<br />
% change 14.2% 11.6% 12.4%<br />
2012 2013e 2014e 2015e<br />
Operating margin 16.4 16.5 17.0 17.4<br />
Net margin 10.3 10.6 11.0 11.3<br />
ROE 35.2 33.4 32.0 30.3<br />
ROCE 19.8 19.9 20.3 20.7<br />
Gearing 100.0 84.9 71.5 56.9<br />
(EUR) 2012 2013e 2014e 2015e<br />
EPS 3.65 4.17 4.66 5.23<br />
% change - 14.3% 11.6% 12.4%<br />
P/E 26.6x 23.3x 20.9x 18.6x<br />
FCF yield (%) 3.3% 4.1% 4.5% 5.1%<br />
Dividends (EUR) 1.8 1.9 2.1 2.4<br />
Div yield (%) 1.9% 1.9% 2.2% 2.4%<br />
EV/Sales 3.0x 2.7x 2.5x 2.3x<br />
EV/EBITDA 18.0x 15.1x 13.7x 12.1x<br />
EV/EBIT 18.6x 16.6x 15.0x 13.4x<br />
Following a particularly enviable stockmarket performance, the share's current multiples could<br />
prompt profit-taking moves. However, we believe the share could clearly continue its uptrend in<br />
view of the quality of fundamentals, which justify higher valuation assumptions in our DCF<br />
calculation. On this basis our Fair Value works out to EUR125.<br />
ANALYSIS<br />
• In addition to the adjustments made to our forecasts following the publication of 2012<br />
earnings, we have decided to factor the effects of acquisitions into our figures for the next<br />
three years. We have assumed an annual contribution to revenue of 3%, which is at the lowend<br />
of the range indicated by the group. Note that acquisitions contributed average growth of<br />
7% a year between 2001 and 2012.<br />
• With fundamentals remaining particularly attractive, we believe the group has the ability to<br />
maintain a high level of organic growth without denting margins. As such, we have now<br />
included growth to infinity of 2.5% vs. 2% previously in our DCF assumptions. Note that<br />
between 2001 and 2012, organic growth averaged nearly 8% a year.<br />
VALUATION<br />
• The share has had an excellent ride (+50.4% 2012 +14.8% ytd) and valuation multiples are well<br />
ahead of historical average levels (2007/2013 EV/EBIT of 13.4x and P/E of 17.2x). However, we<br />
believe the share's stockmarket status could change considerably and move closer to that of<br />
Essilor and Luxottica if we compare their growth profiles. Over the next three years, our<br />
forecasts point to a 2012-15 CAGR in sales and EPS of 9.2% and 12.8%, respectively, after 2006-<br />
12 levels of 13% and 16%.<br />
NEXT CATALYSTS<br />
• Q1 revenues on 30 th April 2013;<br />
• AGM on 22 nd May 2013;<br />
• HI results on 28 August 2013.<br />
Click here to download document<br />
Analyst :<br />
Bruno de La Rochebrochard<br />
33(0) 1 56 68 75 88<br />
bdelarochebrochard@bryangarnier.com<br />
25 March 2013 5
BG’s <strong>Wake</strong> <strong>Up</strong> <strong>Call</strong><br />
Back to front page<br />
Sector View<br />
Pharmaceuticals<br />
CHMP: MS treatments in the heart of recommendations<br />
1 M 3 M 6 M 31/12/12<br />
Healthcare 3.9% 9.5% 10.2% 10.2%<br />
DJ Stoxx 600 1.9% 4.7% 6.6% 5.1%<br />
*Stoxx Sector Indices<br />
<strong>Co</strong>mpanies covered<br />
ASTRAZENECA BUY 3400p<br />
Last Price 3236p Market Cap. GBP40,390m<br />
BAYER BUY EUR75<br />
Last Price EUR78.34 Market Cap. EUR64,783m<br />
GLAXOSMITHKLINE NEUTRAL 1580p<br />
Last Price 1524p Market Cap. GBP74,807m<br />
IPSEN BUY EUR29<br />
Last Price EUR27.755 Market Cap. EUR2,338m<br />
MERCK KGaA NEUTRAL EUR100<br />
Last Price EUR115 Market Cap. EUR25,002m<br />
NOVARTIS BUY CHF70<br />
Last Price CHF66.45 Market Cap. CHF179,826<br />
NOVO NORDISK NEUTRAL DKK920<br />
Last Price DKK927.5 Market Cap. DKK419,706<br />
ROCHE HOLDING NEUTRAL CHF208<br />
Last Price CHF217.5 Market Cap. CHF152,807<br />
SANOFI BUY EUR80<br />
Last Price EUR77.5 Market Cap. EUR102,792<br />
SHIRE PLC BUY 2250p<br />
Last Price 1978p Market Cap. GBP11,020m<br />
UCB<br />
Under<br />
U.R.<br />
Last Price EUR49.38<br />
review<br />
Market Cap. EUR9,057m<br />
Last Friday, two multiple sclerosis drugs were recommended by the CHMP for approval: Aubagio<br />
from Sanofi and Tecfidera (BG-12) from Biogen. The landscape of MS drugs completely moves<br />
from subcutaneous treatments (IFN) to oral treatments. These two drugs come on the European<br />
market in direct competition with interferons such as Rebif from Merck but also with Gilenya the<br />
first oral compound in this pathology.<br />
ANALYSIS<br />
• Today the paradigm of MS treatments has two aims: to improve the efficacy, measured in<br />
terms of decrease in relapses and time to disability; and specifically to bring some additional<br />
convenience for the patient with less infusion to no infusion at all with the oral route gaining<br />
ground. Since last Friday, two new treatments have received green light to enter the market,<br />
namely Aubagio from Sanofi and Tecfidera (formerly BG12) from Biogen.<br />
• As a reminder, Aubagio was launched in the US at the end of 2012 where the first indicators<br />
were “very encouraging” with 80% of MS specialists having prescribed the drug to patients with<br />
the majority of them switching from <strong>Co</strong>paxone or Avonex whereas 20% were treatment-naïve.<br />
However Aubagio has not received the designation for a new active substance which could<br />
make Sanofi unable to apply the price expected on its drug and limit the patent protection<br />
previously expected. So far we have EUR538m peak sales for Aubagio in 2020. Sanofi thinks<br />
that the concept of a more fragmented MS market offers a greater number of therapeutic<br />
options. As a reminder Sanofi is currently building a strong MS franchise with two consecutive<br />
launches lined up for Aubagio and then Lemtrada. The group should be able to position the two<br />
products at either end of the value chain, i.e. with Aubagio being used to treat mild to<br />
moderate forms of the disease, as a substitute for interferons, and Lemtrada used to treat<br />
more severe or advanced forms. Besides during the AAN congress, Sanofi underlined that more<br />
than 80% of patients did not receive further treatment with Lemtrada in the first year of the<br />
extension of CARE MS study. Even if Lemtrada is infused intravenously, the drug presents the<br />
advantage of being only administered on 5 consecutive days and the second course given on 3<br />
consecutive days 12 months later. We expect the approval of Lemtrada in Q2 in Europe and for<br />
the end of this year in the US.<br />
• Thanks to its efficacy and the knowledge of the MS market from Biogen-Idec, Tecfidera,<br />
recommended as a first-line oral treatment for adults, could become a serious competitor in<br />
this landscape. The PDUFA date of BG12 in the US is expected on March 28th after a first threemonth<br />
delay.<br />
• In parallel, we can underline that the CHMP also recommended the extension of indication for<br />
Xarelto from Bayer for the prevention of atherothrombotic events after an Acute <strong>Co</strong>ronary<br />
Syndrome.<br />
NEXT CATALYSTS<br />
• (new) CHMP decision on April 22-25 th<br />
• PDUFA date of BG 12 on 28 th March<br />
• Approval of Lemtrada in Europe in Q2 2013 and in the US in H2.<br />
Click here to download<br />
Analyst :<br />
Martial Descoutures<br />
33(0) 1 56 68 75 18<br />
mdescoutures@bryangarnier.com<br />
Sector Team :<br />
Mathieu Chabert<br />
Eric Le Berrigaud<br />
25 March 2013 6
BG’s <strong>Wake</strong> <strong>Up</strong> <strong>Call</strong><br />
Back to front page<br />
Sector View<br />
Luxury Goods Tiffany’s Q4 earnings ahead of estimates and more optimism for 2013<br />
1 M 3 M 6 M 31/12/12<br />
Pers & H/H Gds 3.1% 6.5% 12.2% 6.8%<br />
DJ Stoxx 600 1.9% 4.7% 6.6% 5.1%<br />
*Stoxx Sector Indices<br />
<strong>Co</strong>mpanies covered<br />
CHRISTIAN DIOR BUY EUR145<br />
Last Price EUR127,75 Market Cap. EUR23,216m<br />
HERMES Intl NEUTRAL EUR200<br />
Last Price EUR262,5498 Market Cap. EUR27,717m<br />
LVMH<br />
9<br />
BUY EUR160<br />
Last Price EUR130,85 Market Cap. EUR66,429m<br />
PPR NEUTRAL EUR166<br />
Last Price EUR171,95 Market Cap. EUR21,686m<br />
PRADA BUY HKD82<br />
Last Price EUR77,3 Market Cap. EUR197,797<br />
RICHEMONT BUY CHF82<br />
Last Price CHF73,15 Market Cap. CHF38,184m<br />
SALVATORE FERRAGAMO NEUTRAL EUR20<br />
Last Price EUR21,72 Market Cap. EUR3,658m<br />
THE SWATCH GROUP BUY CHF555<br />
Last Price CHF533 Market Cap. CHF27,974m<br />
TOD'S GROUP SELL EUR80<br />
Last Price EUR110,2 Market Cap. EUR3,373m<br />
Last Friday Tiffany posted Q4 sales globally in line with market expectations and with Xmas season<br />
(stable at same-store). Despite ongoing poor trends in the U.S., TIF delivered an upbeat guidance<br />
for 2013 (“high-single digit increase”), mainly thanks to Asia-Pacific that showed some positive<br />
signs, leading to an optimistic guidance for 2013 (“mid-teens sales increase”).<br />
ANALYSIS<br />
• Q4 12 sales (ending January 31, 2013) came in at EUR1.2bn, a touch below consensus of<br />
EUR1.25bn, up 5% at constant FX but SSSG remained stable. <strong>Co</strong>mparable-store growth<br />
showed no improvement compared to the holiday season (November & December), as its<br />
domestic market (US: 52% of sales) still weighed on its quarterly performance.<br />
• US activity (52% of sales) remained sluggish with comparable-store sales down 2% in Q4. This<br />
performance was explained by disappointing sales figures at the NYC flagship store (-3% samestore),<br />
which are hit by: (i) lingering pressure in the entry-level-priced silver segment,<br />
consequence of the trade-up strategy carried-out by Tiffany and (ii) less European tourists<br />
travelling to the U.S. because of the crisis in Europe.<br />
• Good trends in Asia-Pacific (21% of sales) despite the negative calendar effect. Indeed,<br />
compared to last year when the Chinese New Year happened on January 23, the later CNY this<br />
year (February 23) did not fuelled activity in Q4 12. Despite this negative calendar shift, Tiffany<br />
posted a 6% same-store growth and witnessed positive signs in Greater China. In our view, the<br />
jewelry segment is less exposed to the current “gift-giving market” slowdown compared to the<br />
watch segment.<br />
• Soft activity in Europe (12% of sales): stable same-store sales in Q4. Whilst the trends<br />
remained surprisingly good until Q3, the last quarter was soft, notably in the U.K. Indeed the<br />
U.K. luxury group Mulberry released a profit warning last Friday because of a disappointing<br />
trading and lower spending by tourists in London. This confirms our cautious stance on Europe<br />
ahead of the Q1 13 publications.<br />
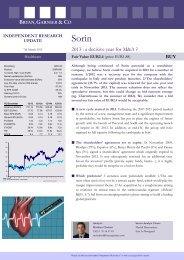
Quarterly comparable same store growth:<br />
% Q1 12 Q2 12 Q3 12 Nov-Dec 12 Q4 12<br />
Americas 0 -5 1 -2 -2<br />
Asia-Pacific 10 -5 -4 7 6<br />
Japan 12 8 5 1 2<br />
Europe 0 2 8 Stable Stable<br />
Total worldwide 4 1 1 Stable Stable<br />
Source: Tiffany<br />
• Tiffany delivered an upbeat 2013 outlook. Although Tiffany predicted a soft Q1 13 coming off a<br />
disappointing Q4 12, the group is more optimistic for 2013 and forecasts 6-8% reported sales<br />
growth (consensus: +6%e) and a high-single digit increase at constant FX, fuelled by a mid-teens<br />
sales growth in Asia-Pacific (vs. +8% in 2012). The EPS guidance is expected to be in the range of<br />
$3.43-$3.53 (consensus: $3.46), implying a 6-9% increase.<br />
READ-ACROSS TO OUR COMPANIES<br />
• Read-across to other Luxury groups is unmeaningful. Tiffany is not a pure luxury player<br />
compared to our luxury sample coverage, as its product offer varies from the high-end to the<br />
very low-end segment. However we can highlight two interesting things from Tiffany’s<br />
publication: (i) Start of the year is soft in Europe: beyond challenging comps in Q1, some luxury<br />
groups have also noticed a soft activity since tourists are less present in Europe (negative FX<br />
evolution and price hikes) and domestic customers are badly hit by the crisis; (ii) Rebound<br />
expected in Asia-Pacific: Tiffany is more optimistic about Greater China, Burberry, Hugo Boss<br />
and Swatch have also been upbeat about China in recent weeks.<br />
NEXT CATALYSTS<br />
• Tiffany will report its Q1 13 earnings on May 28 th , 2013.<br />
Analyst :<br />
Cédric Rossi<br />
33(0) 1 70 36 57 25<br />
crossi@bryangarnier.com<br />
<strong>Co</strong>nsumer Analyst Team :<br />
Loïc Morvan<br />
Peter Farren<br />
25 March 2013 7
BG’s <strong>Wake</strong> <strong>Up</strong> <strong>Call</strong><br />
Back to front page<br />
Insurance<br />
AXA<br />
Exclusive talks for the potential sale of a majority stake in AXA Private Equity<br />
Price EUR13.97 Fair Value EUR16.5 (+18%) BUY<br />
ANALYSIS<br />
Bloomberg<br />
Reuters<br />
CS FP<br />
AXAF.PA<br />
12-month High / Low (EUR) 14.6 / 8.8<br />
Market Cap (EURm) 33,357<br />
Avg. 6m daily volume (000) 6,961<br />
1 M 3 M 6 M 31/12/12<br />
Absolute perf. 2.6% 4.5% 12.0% 4.6%<br />
Insurance 3.8% 4.5% 12.3% 5.1%<br />
DJ Stoxx 600 1.9% 4.7% 6.6% 5.1%<br />
2011 2012e 2013e 2014e<br />
P/E 9.1x 7.4x 7.1x 6.8x<br />
Div yield (%) 4.9% 5.4% 5.6% 5.9%<br />
• AXA received an irrevocable offer from an investor group for its entire stake in AXA Private<br />
Equity. The acquiring investors would be composed of AXA Private Equity’s senior<br />
management, a group of institutions and French family offices. AXA should become a minority<br />
shareholder (vs. 95.8% currently). <strong>Up</strong>on the completion of the proposed transaction, AXA<br />
Private Equity’s voting share capital would be held as follows: AXA Private Equity’s<br />
management and employees 40%, external investors 33.1%, and AXA Group 26.9%.<br />
• AXA should continue to invest in private equity through AXA Private Equity funds. The expected<br />
total commitment is EUR4.8bn between 2014 and 2018. At end-2012, AXA Group had 1.4% of<br />
its General Account assets invested in private equity through AXA Private Equity.<br />
• The transaction would value AXA Private Equity at EUR510m for 100%, i.e. EUR488m for AXA<br />
Group’s share, which should be divided into an upfront payment of EUR348m and a deferred<br />
consideration of up to EUR140m, to be paid in instalments subject to achieving certain targets<br />
and meeting certain conditions. Closing is expected in Q3 2013.<br />
• Estimated impacts on AXA Group expected at the closing date: EUR0.2bn exceptional capital<br />
gain, which will be accounted for in net income, and EUR0.2bn cash expected to be remitted to<br />
the Group, net of reinvestment.<br />
-> The transaction has been expected for a long time (discussions started in September 2011) and is<br />
no breakthrough for the company.<br />
VALUATION<br />
• Based on our current 2013 estimates, our SOTP valuation is EUR16.5.<br />
NEXT CATALYSTS<br />
• AGM on 30th April 2013. Q1 2013 sales on 7th May 2013.<br />
Olivier Pauchaut, opauchaut@bryangarnier.com<br />
Healthcare<br />
Transgene<br />
An important production deal with Sanofi<br />
Price EUR8.16 Fair Value EUR21 (+157%) CORPORATE<br />
Bloomberg<br />
TNG.FP<br />
Reuters<br />
TRNG PA<br />
12-month High / Low (EUR) 11.2 / 6.8<br />
Market Cap (EURm) 260<br />
Avg. 6m daily volume (000) 34.60<br />
1 M 3 M 6 M 31/12/12<br />
Absolute perf. -6.2% 1.6% -5.7% 1.0%<br />
Healthcare 3.9% 9.5% 10.2% 10.2%<br />
DJ Stoxx 600 1.9% 4.7% 6.6% 5.1%<br />
2010 2011e 2012e 2013e<br />
P/E NS NS 6.2x 25.9x<br />
Div yield (%) NM NM NM NM<br />
ANALYSIS<br />
• Transgene and Sanofi jointly announced this morning an agreement for the production of<br />
immunotherapy products on a newly-created state of the art platform. The industrial site is<br />
located on Genzyme’s polyclonals site in Lyon.<br />
• Sanofi will therefore act as Transgene’s <strong>Co</strong>ntract Manufacturing Organisation (CMO) to<br />
manufacture clinical and commercial batches of products such as MVA therapeutic vaccines.<br />
Transgene will be a preferred customer of the platform for 15 years. As a reminder, Transgene<br />
expects to file a BLA (Biological Licence Application) for its first product TG 4010 in 2016.<br />
• An equally shared investment of EUR10m will be made by Transgene and Sanofi. We see this<br />
agreement as pivotal for Transgene’s future manufacturing capabilities. While the first strategic<br />
option would have been to build a manufacturing plant, it could have been an expensive cost<br />
for Transgene (we estimate EUR40-50m). Also, today’s agreement is non exclusive and<br />
therefore in case of the exercise of the option by Novartis for TG 4010, the Swiss pharma could<br />
also decide to produce the drug in house.<br />
VALUATION<br />
• This agreement does not imply any change in our fair value. Nevertheless, we see it as positive<br />
for Transgene mid to long term perspectives.<br />
NEXT CATALYSTS<br />
• EASL in April : strategic update on TG4040<br />
• Pexa-Vec (JX594) : first interim data for Traverse mid 2013<br />
• TG 4010 : Q4 phase IIb results<br />
Click here to download<br />
Mathieu Chabert, mchabert@bryangarnier.com<br />
25 March 2013 8
BG’s <strong>Wake</strong> <strong>Up</strong> <strong>Call</strong><br />
Back to front page<br />
25 March 2013 9
25 March 2013<br />
BG’s <strong>Wake</strong> <strong>Up</strong> <strong>Call</strong><br />
<strong>Bryan</strong> <strong>Garnier</strong> stock rating system<br />
For the purposes of this Report, the <strong>Bryan</strong> <strong>Garnier</strong> stock rating system is defined as follows:<br />
Stock rating<br />
Positive opinion for a stock where we expect a favourable performance in absolute terms over a period of 6 months from the publication of a<br />
BUY<br />
recommendation. This opinion is based not only on the FV (the potential upside based on valuation), but also takes into account a number of<br />
elements including a SWOT analysis, positive momentum, technical aspects and the sector backdrop. Every subsequent published update on the stock<br />
will feature an introduction outlining the key reasons behind the opinion.<br />
Opinion recommending not to trade in a stock short-term, neither as a BUYER or a SELLER, due to a specific set of factors. This view is intended to<br />
NEUTRAL<br />
be temporary. It may reflect different situations, but in particular those where a fair value shows no significant potential or where an upcoming binary<br />
event constitutes a high-risk that is difficult to quantify. Every subsequent published update on the stock will feature an introduction outlining the key<br />
reasons behind the opinion.<br />
Negative opinion for a stock where we expect an unfavourable performance in absolute terms over a period of 6 months from the publication of a<br />
SELL<br />
recommendation. This opinion is based not only on the FV (the potential downside based on valuation), but also takes into account a number of<br />
elements including a SWOT analysis, positive momentum, technical aspects and the sector backdrop. Every subsequent published update on the stock<br />
will feature an introduction outlining the key reasons behind the opinion.<br />
Distribution of stock ratings<br />
BUY ratings 51.4% NEUTRAL ratings 27.5% SELL ratings 21.1%<br />
<strong>Bryan</strong> <strong>Garnier</strong> Research Team<br />
HealthcareTeam Eric Le Berrigaud 33 (0) 1 56 68 75 33 eleberrigaud@bryangarnier.com<br />
Mathieu Chabert 33 (0) 1 70 36 57 45 mchabert@bryangarnier.com<br />
Martial Descoutures 33 (0) 1 56 68 75 18 mdescoutures@bryangarnier.com<br />
<strong>Co</strong>nsumer Goods Peter Farren 33 (0) 1 56 68 75 72 pfarren@bryangarnier.com<br />
Loïc Morvan 33 (0) 1 70 36 57 24 lmorvan@bryangarnier.com<br />
Cedric Rossi 33 (0) 1 70 36 57 25 crossi@bryangarnier.com<br />
IT Services Gregory Ramirez 33 (0) 1 56 68 75 91 gramirez@bryangarnier.com<br />
Insurance Olivier Pauchaut 33 (0) 1 56 68 75 49 opauchaut@bryangarnier.com<br />
Hotels/Business Services Bruno de la Rochebrochard 33 (0) 1 56 68 75 88 bdelarochebrochard@bryangarnier.com<br />
Utilities/Renewables Julien Desmaretz 33 (0) 1 56 68 75 92 jdesmaretz@bryangarnier.com<br />
<strong>Co</strong>nstruction & <strong>Co</strong>ncessions Sven Edelfelt 33 (0) 1 70 36 57 17 sedelfelt@bryangarnier.com<br />
A copy of the <strong>Bryan</strong> <strong>Garnier</strong> & <strong>Co</strong> Limited conflicts policy in relation to the production of research is available at www.bryangarnier.com
London<br />
Paris<br />
Dowgate Hill House<br />
26 Avenue des Champs Elysées<br />
14-16 Dow Gate Hill<br />
75008 Paris<br />
London EC4R 2SU<br />
Tel: +33 (0) 1 56 68 75 00<br />
Tel: +44 (0) 207 332 2500 Fax: +33 (0) 1 56 68 75 01<br />
Fax: +44 (0) 207 332 2559 Regulated by the Financial Services<br />
Authorised and regulated by Authority (FSA) and l’Autorité des<br />
the Financial Services Authority Marchés Financiers (AMF)<br />
(FSA)<br />
New York<br />
750 Lexington Avenue<br />
New York, NY 10022<br />
Tel: +1 (0) 212 337 7000<br />
Fax: +1 (0) 212 337 7002<br />
FINRA and SIPC member<br />
Geneva<br />
rue de Grenus 7<br />
CP 2113<br />
Genève 1, CH 1211<br />
Tel +4122 731 3263<br />
Fax+4122731 3243<br />
Regulated by the<br />
Swiss Federal Banking<br />
<strong>Co</strong>mmission<br />
New Delhi<br />
The Imperial Hotel<br />
Janpath<br />
New Delhi 110 001<br />
Tel +91 11 4132 6062<br />
+91 98 1111 5119<br />
Fax +91 11 2621 9062<br />
Disclaimer:<br />
This Report may not be reproduced, distributed or published by you for any purpose except with the Firms' prior written permission. The Firm reserves all rights in relation to this<br />
Report.<br />
Past performance information contained in this Report is not an indication of future performance. The information in this report has not been audited or verified by an independent<br />
party and should not be seen as an indication of returns which might be received by investors. Similarly, where projections, forecasts, targeted or illustrative returns or related<br />
statements or expressions of opinion are given ("Forward Looking Information") they should not be regarded as a guarantee, prediction or definitive statement of fact or probability.<br />
Actual events and circumstances are difficult or impossible to predict and will differ from assumptions. A number of factors, in addition to the risk factors stated in this Report, could<br />
cause actual results to differ materially from those in any Forward Looking Information.<br />
Important information - this report may contain "Independent " and "<strong>Co</strong>rporate/Non-independent" research reports.<br />
Independent investment research reports:<br />
This report is prepared by <strong>Bryan</strong> <strong>Garnier</strong> & <strong>Co</strong> Limited and distributed only to clients of <strong>Bryan</strong> <strong>Garnier</strong> & <strong>Co</strong> Limited (the "Firm"). <strong>Bryan</strong> <strong>Garnier</strong> & <strong>Co</strong> Limited is authorised and regulated<br />
by the Financial Services Authority (the "FSA") and is a member of the London Stock Exchange.<br />
This Report is provided for information purposes only and does not constitute an offer, or a solicitation of an offer, to buy or sell relevant securities, including securities mentioned in<br />
this Report and options, warrants or rights to or interests in any such securities. This Report is for general circulation to clients of the Firm and as such is not, and should not be<br />
construed as, investment advice or a personal recommendation. No account is taken of the investment objectives, financial situation or particular needs of any person. The information<br />
and opinions contained in this Report have been compiled from and are based upon generally available information which the Firm believes to be reliable but the accuracy of which<br />
cannot be guaranteed. All components and estimates given are statements of the Firm, or an associated company's, opinion only and no express representation or warranty is given or<br />
should be implied from such statements. All opinions expressed in this Rep! ort are subject to change without notice. To the fullest extent permitted by law neither the Firm nor any<br />
associated company accept any liability whatsoever for any direct or consequential loss arising from the use of this Report. Information may be available to the Firm and/or associated<br />
companies which are not reflected in this Report. The Firm or an associated company may have a consulting relationship with a company which is the subject of this Report.<br />
<strong>Co</strong>rporate or Non-Independent investment research reports:<br />
This non-independent research report (the "Report") was prepared by <strong>Bryan</strong> <strong>Garnier</strong> & <strong>Co</strong> Limited and is being distributed only to clients of <strong>Bryan</strong> <strong>Garnier</strong> & <strong>Co</strong> Limited (the "Firm").<br />
<strong>Bryan</strong> <strong>Garnier</strong> & <strong>Co</strong> Limited is authorised and regulated by the Financial Services Authority (the "FSA") and is a member of the London Stock Exchange.<br />
This Report has been sent to you for marketing purposes. It is non-independent research within the meaning of the FSA rules. It is not being held out as an objective or independent<br />
explanation of the matters contained in it and should not be treated as such. It has not been prepared in accordance with the legal requirements designed to promote the<br />
independence of investment research. Accordingly, the Firm is not subject to any prohibition on dealing ahead of the dissemination of investment research.<br />
This Report focuses on emerging European growth companies. The contents of this Report as well as the other research documents on emerging growth stocks do not contain the<br />
Firms' usual stock ratings. The intrinsic value analysis is presented to provide a framework for stock valuation and discussion, and represents an estimated value on the date of<br />
publishing, which may be subject to change without notice.<br />
The Firms' rationale for not having ratings on the stock includes the fact that such stock may have limited market capitalisation and liquidity and while the Firms may express an opinion<br />
on the near-term movement of the stock, what action investors should take depends on many factors, including liquidity/risk tolerance, holdings timeframe and investment philosophy.<br />
Emerging companies evolve rapidly with a continuous flow of information that can significantly impact the company and in the Firm's opinion this cannot be reflected by a periodic<br />
rating. Additionally, the Firms may have an advisory relationship with the company which is the subject of the Report, including for the production of sponsored research, and may<br />
expect to receive or intend to seek compensation for investment banking services from that company in the six months following the date of this Report.<br />
To the fullest extent permitted by law, the Firms do not accept any liability whatsoever for any direct or consequential loss arising from any use of the information contained in this<br />
Report. Information may be available to the Firm which is not reflected in this Report. This Report is provided for information purposes only and does not constitute an offer or<br />
solicitation to buy or sell any of the securities discussed in it. The Report is for general circulation to clients of the Firm and as such is not, and should not be construed as, investment<br />
advice or a personal recommendation. No account is taken of the investment objectives, financial situation or particular needs of any person.<br />
Disclosures specific to clients in the United Kingdom<br />
This Report has not been approved by <strong>Bryan</strong> <strong>Garnier</strong> & <strong>Co</strong> Limited for the purposes of section 21 of the Financial Services and Markets Act 2000 because it is being distributed in the<br />
United Kingdom only to persons who have been classified by <strong>Bryan</strong> <strong>Garnier</strong> & <strong>Co</strong> Limited as professional clients or eligible counterparties. Any recipient who is not such a person should<br />
return the Report to <strong>Bryan</strong> <strong>Garnier</strong> & <strong>Co</strong> Limited immediately and should not rely on it for any purposes whatsoever.<br />
Notice to US investors<br />
This research report (the "Report") was prepared by <strong>Bryan</strong> <strong>Garnier</strong> & <strong>Co</strong>. Ltd. for information purposes only. The Report is intended for distribution in the United States to "Major US<br />
Institutional Investors" as defined in SEC Rule 15a-6 and may not be furnished to any other person in the United States. Each Major US Institutional Investor which receives a copy of<br />
this Report by its acceptance hereof represents and agrees that it shall not distribute or provide this Report to any other person. Any US person that desires to effect transactions in any<br />
security discussed in this Report should call or write to our US affiliated broker, <strong>Bryan</strong> <strong>Garnier</strong> Securities, LLC. 750 Lexington Avenue, New York NY 10022. Telephone: 1-212-337-7000.<br />
This Report is based on information obtained from sources that <strong>Bryan</strong> <strong>Garnier</strong> & <strong>Co</strong>. Ltd. believes to be reliable and, to the best of its knowledge, contains no misleading, untrue or false<br />
statements but which it has not independently verified. Neither <strong>Bryan</strong> <strong>Garnier</strong> & <strong>Co</strong>. Ltd. and/or <strong>Bryan</strong> <strong>Garnier</strong> Securities LLC make no guarantee, representation or warranty as to its<br />
accuracy or completeness. Expressions of opinion herein are subject to change without notice. This Report is not an offer to buy or sell any security.<br />
<strong>Bryan</strong> <strong>Garnier</strong> Securities, LLC and/or its affiliate, <strong>Bryan</strong> <strong>Garnier</strong> & <strong>Co</strong>. Ltd. may own more than 1% of the securities of the company(ies) which is (are) the subject matter of this Report,<br />
may act as a market maker in the securities of the company(ies) discussed herein, may manage or co-manage a public offering of securities for the subject company(ies), may sell such<br />
securities to or buy them from customers on a principal basis and may also perform or seek to perform investment banking services for the company(ies).<br />
<strong>Bryan</strong> <strong>Garnier</strong> Securities, LLC and/or <strong>Bryan</strong> <strong>Garnier</strong> & <strong>Co</strong>. Ltd. are unaware of any actual, material conflict of interest of the research analyst who prepared this Report and are also not<br />
aware that the research analyst knew or had reason to know of any actual, material conflict of interest at the time this Report is distributed or made available..