Download PDF-File - OpenTrack
Download PDF-File - OpenTrack
Download PDF-File - OpenTrack

You also want an ePaper? Increase the reach of your titles
YUMPU automatically turns print PDFs into web optimized ePapers that Google loves.
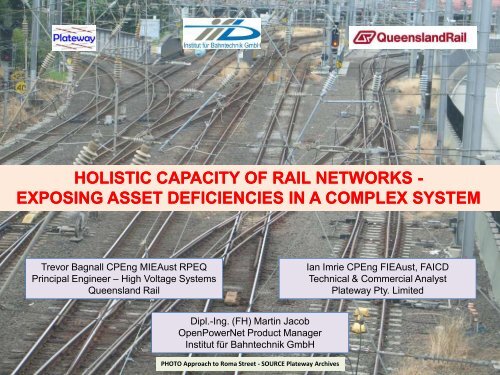
HOLISTIC CAPACITY OF RAIL NETWORKS -<br />
EXPOSING ASSET DEFICIENCIES IN A COMPLEX SYSTEM<br />
Trevor Bagnall CPEng MIEAust RPEQ<br />
Principal Engineer – High Voltage Systems<br />
Queensland Rail<br />
Ian Imrie CPEng FIEAust, FAICD<br />
Technical & Commercial Analyst<br />
Plateway Pty. Limited<br />
Dipl.-Ing. (FH) Martin Jacob<br />
OpenPowerNet Product Manager<br />
Institut für Bahntechnik GmbH<br />
PHOTO Approach to Roma Street - SOURCE Plateway Archives<br />
1
PHOTO Approach to Roma Street - SOURCE Plateway Archives<br />
2
Holistic – can be defined as:<br />
‘Emphasising the importance of the<br />
whole and the interdependence of its<br />
parts’.<br />
PHOTO Approach to Roma Street - SOURCE Plateway Archives<br />
3
Capacity – can be defined as:<br />
‘The practical limit of a rail network to<br />
function at defined limits of operational<br />
performance’.<br />
PHOTO Approach to Roma Street - SOURCE Plateway Archives<br />
4
All Australasian Railways are under<br />
stakeholder pressure to<br />
improve services<br />
PHOTO Approach to Roma Street - SOURCE Plateway Archives<br />
5
Improved services<br />
may be provided by revised timings<br />
and/or increased frequency<br />
PHOTO Approach to Roma Street - SOURCE Plateway Archives<br />
6
Improved services<br />
can be provided by new lines to growth<br />
areas<br />
PHOTO Approach to Roma Street - SOURCE Plateway Archives<br />
7
Improved services<br />
can be provided by new trains with<br />
enhanced performance & customer<br />
features<br />
PHOTO Approach to Roma Street - SOURCE Plateway Archives<br />
8
PHOTO Approach to Roma Street - SOURCE Plateway Archives<br />
9
Can the existing infrastructure support<br />
an increased service frequency?<br />
PHOTO: Murarrie Curve – SOURCE: Queensland Rail Trevor Bagnall<br />
10
Can the existing infrastructure support<br />
additional traffic from new lines?<br />
PHOTO: Murarrie Curve – SOURCE: Queensland Rail Trevor Bagnall<br />
11
Can the existing infrastructure support<br />
the enhanced performance of new<br />
trains?<br />
PHOTO: Murarrie Curve – SOURCE: Queensland Rail Trevor Bagnall<br />
12
PHOTO Approach to Roma Street - SOURCE Plateway Archives<br />
13
PHOTO Approach to Roma Street - SOURCE Plateway Archives<br />
14
PHOTO Approach to Roma Street - SOURCE Plateway Archives<br />
15
PHOTO Approach to Roma Street - SOURCE Plateway Archives<br />
16
PHOTO Approach to Roma Street - SOURCE Plateway Archives<br />
17
PHOTO Approach to Roma Street - SOURCE Plateway Archives<br />
18
PHOTO Approach to Roma Street - SOURCE Plateway Archives<br />
19
PHOTO: Murarrie Curve – SOURCE: Queensland Rail Trevor Bagnall<br />
20
DIAGRAM: SEQ EXISTING<br />
TRANSLINK RAIL<br />
NETWORK<br />
SOURCE: TRANSLINK<br />
21
DIAGRAM: SEQ EXISTING<br />
TRANSLINK RAIL<br />
NETWORK<br />
SOURCE: TRANSLINK<br />
2010/2011 ANNUAL<br />
REPORT<br />
22
DIAGRAM: SEQ EXISTING<br />
TRANSLINK RAIL<br />
NETWORK<br />
SOURCE: TRANSLINK<br />
2011/2012 ANNUAL<br />
REPORT<br />
23
DIAGRAM: SEQ EXISTING<br />
TRANSLINK RAIL<br />
NETWORK<br />
SOURCE: TRANSLINK<br />
2011/2012 ANNUAL<br />
REPORT<br />
24
DIAGRAM: SEQ EXISTING<br />
TRANSLINK RAIL<br />
NETWORK<br />
SOURCE: TRANSLINK<br />
2011/2012 ANNUAL<br />
REPORT<br />
25
DIAGRAM: SEQ EXISTING<br />
TRANSLINK RAIL<br />
NETWORK<br />
SOURCE: TRANSLINK<br />
2011/2012 ANNUAL<br />
REPORT<br />
26
DIAGRAM: SEQ EXISTING<br />
TRANSLINK RAIL<br />
NETWORK<br />
SOURCE: TRANSLINK<br />
2010/2011 ANNUAL<br />
REPORT<br />
27
DIAGRAM: SEQ 2031<br />
INDICATIVE RAIL<br />
NETWORK<br />
SOURCE: CONNECTING<br />
SEQ 2031<br />
28
DIAGRAM: SEQ 2031<br />
INDICATIVE RAIL<br />
NETWORK<br />
SOURCE: CONNECTING<br />
SEQ 2031<br />
29
DIAGRAM: SEQ 2031<br />
INDICATIVE RAIL<br />
NETWORK<br />
SOURCE: CONNECTING<br />
SEQ 2031<br />
30
PHOTO Roma Street, Southern Main Junction - SOURCE Plateway Archives<br />
31
PHOTO Roma Street, Southern Main Junction - SOURCE Plateway Archives<br />
32
PHOTO Roma Street, Southern Main Junction - SOURCE Plateway Archives<br />
33
PHOTO Roma Street, Southern Main Junction - SOURCE Plateway Archives<br />
34
PHOTO Roma Street, Southern Main Junction - SOURCE Plateway Archives<br />
35
PHOTO Roma Street, Southern Main Junction - SOURCE Plateway Archives<br />
36
PHOTO Roma Street, Southern Main Junction - SOURCE Plateway Archives<br />
37
PHOTO Roma Street, Southern Main Junction - SOURCE Plateway Archives<br />
38
PHOTO Roma Street, Southern Main Junction - SOURCE Plateway Archives<br />
39
PHOTO Roma Street, Southern Main Junction - SOURCE Plateway Archives<br />
40
PHOTO Roma Street, Southern Main Junction - SOURCE Plateway Archives<br />
41
PHOTO Roma Street, Southern Main Junction - SOURCE Plateway Archives<br />
42
PHOTO: Roma Street, Western approach adjacent to Feeder Station- SOURCE: Plateway Archives<br />
43
PHOTO: Roma Street, Western approach adjacent to Feeder Station- SOURCE: Plateway Archives<br />
44
DIAGRAM: SEQ EXISTING<br />
TRANSLINK RAIL<br />
NETWORK<br />
SOURCE: TRANSLINK<br />
2010/2011 ANNUAL<br />
REPORT<br />
• 32.3kms from<br />
branch datum at<br />
Park Road<br />
• Double track Park<br />
Road to Manly<br />
• Single track Manly<br />
to Cleveland<br />
45
SOURCE: QUEENSLAND RAIL, Trevor Bagnall<br />
46
DIAGRAM:<br />
EXTRACT FROM<br />
SEQ RAIL<br />
NETWORK<br />
ELECTRICAL<br />
SECTIONING<br />
DIAGRAM<br />
SOURCE:<br />
QUEENSLAND RAIL<br />
LJFS – T5<br />
47
DIAGRAM:<br />
EXTRACT FROM<br />
SEQ RAIL<br />
NETWORK<br />
ELECTRICAL<br />
SECTIONING<br />
DIAGRAM<br />
SOURCE:<br />
QUEENSLAND RAIL<br />
LJFS – T6<br />
48
DIAGRAM:<br />
EXTRACT FROM<br />
SEQ RAIL<br />
NETWORK<br />
ELECTRICAL<br />
SECTIONING<br />
DIAGRAM<br />
SOURCE:<br />
QUEENSLAND RAIL<br />
LJFS – T6<br />
South Coast<br />
Line section<br />
normally<br />
supplied<br />
from Lytton<br />
Junction FS<br />
was supplied<br />
from Roma<br />
Street FS<br />
during POC<br />
test<br />
49
DIAGRAM: SEQ EXISTING<br />
TRANSLINK RAIL<br />
NETWORK<br />
SOURCE: TRANSLINK<br />
2010/2011 ANNUAL<br />
REPORT<br />
50
Source: Queensland Rail – RTOA Screen Shot<br />
51
Source: Queensland Rail – RTOA Screen Shot<br />
52
Photo Source: Queensland Rail – Network Picture Archive<br />
53
Photo Source: Queensland Rail – Network Picture Archive<br />
54
Photo Source: Queensland Rail – Network Picture Archive<br />
55
Photo Source: Queensland Rail – Network Picture Archive<br />
56
Benchmark Summary<br />
Operate instrumented test trains from Park<br />
Road to Cleveland & return (approx. 3 return<br />
trips with the first trip for calibration purposes)<br />
Maximum variation between actual and<br />
simulated train run times to be less than 2<br />
minutes<br />
The simulated energy for each single train run<br />
would have a variation of less than 8% of that<br />
measured at Lytton Junction Feeder Station<br />
busbars.<br />
Result<br />
Photo Source: Queensland Rail – Network Picture Archive<br />
57
Benchmark Summary<br />
Operate instrumented test trains from Park<br />
Road to Cleveland & return (approx. 3 return<br />
trips with the first trip for calibration purposes)<br />
Maximum variation between actual and<br />
simulated train run times to be less than 2<br />
minutes<br />
The simulated energy for each single train run<br />
would have a variation of less than 8% of that<br />
measured at Lytton Junction Feeder Station<br />
busbars.<br />
Result<br />
Photo Source: Queensland Rail – Network Picture Archive<br />
58
Benchmark Summary<br />
Operate instrumented test trains from Park<br />
Road to Cleveland & return (approx. 3 return<br />
trips with the first trip for calibration purposes)<br />
Maximum variation between actual and<br />
simulated train run times to be less than 2<br />
minutes<br />
The simulated energy for each single train run<br />
would have a variation of less than 8% of that<br />
measured at Lytton Junction Feeder Station<br />
busbars.<br />
Result<br />
Photo Source: Queensland Rail – Network Picture Archive<br />
59
Benchmark Summary<br />
5 days of morning peak (6am to 10am) on the<br />
Cleveland Line<br />
Train Graph used for comparison between<br />
actual and simulated train running for each of<br />
the 5 days.<br />
The simulated energy for each day will have a<br />
variation of less than 10% of that measured at<br />
Lytton Junction Feeder Station busbars.<br />
Result<br />
Photo Source: Queensland Rail – Network Picture Archive<br />
60
Benchmark Summary<br />
5 days of morning peak (6am to 10am) on the<br />
Cleveland Line<br />
Train Graph used for comparison between<br />
actual and simulated train running for each of<br />
the 5 days.<br />
The simulated energy for each day will have a<br />
variation of less than 10% of that measured at<br />
Lytton Junction Feeder Station busbars.<br />
Result<br />
Photo Source: Queensland Rail – Network Picture Archive<br />
61
Benchmark Summary<br />
5 days of morning peak (6am to 10am) on the<br />
Cleveland Line<br />
Train Graph used for comparison between<br />
actual and simulated train running for each of<br />
the 5 days.<br />
The simulated energy for each day will have a<br />
variation of less than 10% of that measured at<br />
Lytton Junction Feeder Station busbars.<br />
Result<br />
Photo Source: Queensland Rail – Network Picture Archive<br />
62
Photo Source: Queensland Rail – Network Picture Archive<br />
63
RAIL<br />
NETWORK<br />
SIMULATION<br />
64
<strong>OpenTrack</strong> administers input data in three modules:<br />
rolling stock, infrastructure and timetable.<br />
Users enter input information into these modules.<br />
65
The simulation is<br />
carried out with the<br />
user defined input<br />
data. Predefined<br />
trains move on a<br />
defined track layout<br />
to the conditions set<br />
by the timetable<br />
data and the<br />
signalling system.<br />
66
The simulation is<br />
carried out with the<br />
user defined input<br />
data. Predefined<br />
trains move on a<br />
defined track layout<br />
to the conditions set<br />
by the timetable<br />
data and the<br />
signalling system.<br />
<strong>OpenTrack</strong> uses a<br />
mixed discrete/<br />
continuous<br />
simulation process.<br />
The simulation<br />
process calculates<br />
both the continuous<br />
numerical solution<br />
of the differential<br />
motion equations<br />
for the vehicles<br />
(trains) and the<br />
discrete processes<br />
of signal status and<br />
delay distributions.<br />
67
A wide variety of output data is developed in the<br />
simulation process. <strong>OpenTrack</strong> allows the<br />
user to present this data in many different formats<br />
and subsets including, time-space diagrams, tables<br />
and graphical elements (pictures).<br />
68
OPENPOWERNET<br />
RAIL ELECTRICAL<br />
NETWORK<br />
SIMULATION<br />
69
Photo Source: Plateway Archives<br />
75
Photo Source: Plateway Archives<br />
76
All single train runs were<br />
carried out with SMU 260<br />
Class rolling stock in 2 x 3 Car<br />
configurations<br />
The SMU 260 class was chosen<br />
because of the onboard<br />
instrumentation and data<br />
logging capability.<br />
77
Photo Source: Plateway Archives<br />
78
Photo Source: Plateway Archives<br />
79
Photo Source: Plateway Archives<br />
80
• The section graphed is from Park Road to Hemmant<br />
• The X axis is time as hh:mm:ss<br />
• The Y axis is speed in km/h<br />
• The brown trace is the simulated speed from <strong>OpenTrack</strong><br />
• The aqua trace is the speed taken from the train data logger<br />
82
• The Blue trace is the Power from the train data logger<br />
• The Red trace is the Power requested by Open Track<br />
• The X axis is time as hh:mm:ss<br />
• The Y axis is power in kW – negative power is braking<br />
83
• The Blue trace is the Power from the train data logger<br />
• The Brown trace is the Mechanical Power (for Traction)<br />
delivered by OpenPowerNet<br />
• The X axis is time as hh:mm:ss<br />
• The Y axis is power in kW – negative power is braking<br />
84
• The Blue trace is the Power from the train data logger<br />
• The Purple trace is the Electrical Power (Traction + ‘Hotel’)<br />
delivered by OpenPowerNet<br />
• The X axis is time as hh:mm:ss<br />
• The Y axis is power in kW – negative power is braking<br />
85
• The Blue trace is the line voltage from the train data logger<br />
• The Orange trace is the line voltage simulated by<br />
OpenPowerNet<br />
• The X axis is time as hh:mm:ss<br />
• The Y axis is line voltage in 10*kV<br />
86
Benchmark Summary<br />
Operate instrumented test trains from<br />
Park Road to Cleveland & return<br />
(approx. 3 return trips with the first trip<br />
for calibration purposes)<br />
Maximum variation between actual<br />
and simulated train run times to be less<br />
than 2 minutes<br />
The simulated energy for each single<br />
train run would have a variation of less<br />
than 8% of that measured at Lytton<br />
Junction Feeder Station busbars.<br />
Result<br />
H816 – All stations PKR to CNV (wet)<br />
H017 – All stations CNV to MNY then<br />
express to PKR (wet)<br />
H818 – Express PKR to MNY then all<br />
stations to CNV (dry)<br />
H019 – All stations CNV to PKR (dry)<br />
H816 – 23s maximum deviation<br />
H017 – 22s maximum variation<br />
H818 – 14s maximum variation<br />
H019 – 17s maximum variation<br />
H816 – 3.9% variation<br />
H017 – Not available<br />
H818 – 0.1% variation<br />
H019 – 4.5% variation<br />
Photo Source: Queensland Rail – Network Picture Archive<br />
87
Benchmark Summary<br />
Operate instrumented test trains from<br />
Park Road to Cleveland & return<br />
(approx. 3 return trips with the first trip<br />
for calibration purposes)<br />
Result<br />
H816 – All stations PKR to CNV (wet)<br />
H017 – All stations CNV to MNY then<br />
express to PKR (wet)<br />
H818 – Express PKR to MNY then all<br />
stations to CNV (dry)<br />
H019 – All stations CNV to PKR (dry)<br />
All measured energy readings for the single train runs were taken from the train<br />
instrumentation as the instrumentation at Lytton Junction Feeder Station could<br />
not discriminate between consumed and regenerated (during braking) energy.<br />
Maximum The Data variation Logger between readings for actual Run H017 H816 were – not 23s available maximum due deviation to problems<br />
and simulated associated train with run transferring times to be the less energy H017 readings – 22s maximum from the train variation computer<br />
than 2 minutes<br />
H818 – 14s maximum variation<br />
H019 – 17s maximum variation<br />
The simulated energy for each single<br />
train run would have a variation of less<br />
than 8% of that measured at Lytton<br />
Junction Feeder Station busbars.<br />
H816 – 3.9% variation<br />
H017 – Not available<br />
H818 – 0.1% variation<br />
H019 – 4.5% variation<br />
Photo Source: Queensland Rail – Network Picture Archive<br />
88
Benchmark Summary<br />
Operate instrumented test trains from<br />
Park Road to Cleveland & return<br />
(approx. 3 return trips with the first trip<br />
for calibration purposes)<br />
Maximum variation between actual<br />
and simulated train run times to be less<br />
than 2 minutes<br />
The simulated energy for each single<br />
train run would have a variation of less<br />
than 8% of that measured at Lytton<br />
Junction Feeder Station busbars.<br />
Result<br />
H816 – All stations PKR to CNV (wet)<br />
H017 – All stations CNV to MNY then<br />
express to PKR (wet)<br />
H818 – Express PKR to MNY then all<br />
stations to CNV (dry)<br />
H019 – All stations CNV to PKR (dry)<br />
H816 – 23s maximum deviation<br />
H017 – 22s maximum variation<br />
H818 – 14s maximum variation<br />
H019 – 17s maximum variation<br />
H816 – 3.9% variation<br />
H017 – Not available<br />
H818 – 0.1% variation<br />
H019 – 4.5% variation<br />
Photo Source: Queensland Rail – Network Picture Archive<br />
89
Photo Source: Queensland Rail – Network Picture Archive<br />
90
Photo Source: Queensland Rail – Network Picture Archive<br />
91
Photo Source: Queensland Rail – Network Picture Archive<br />
92
Photo Source: Queensland Rail – Network Picture Archive<br />
93
Photo Source: Queensland Rail – Network Picture Archive<br />
94
Photo Source: Queensland Rail – Network Picture Archive<br />
95
Photo Source: Queensland Rail – Network Picture Archive<br />
96
Photo Source: Queensland Rail – Network Picture Archive<br />
97
Photo Source: Queensland Rail – Network Picture Archive<br />
98
Photo Source: Queensland Rail – Network Picture Archive<br />
99
Monday Tuesday Wednesday Thursday Friday<br />
EMU 6M 1 4 2 4 2<br />
EMU 8M 15 17 11 18 15<br />
EMU 6M + 8M 6 1 8 7 0<br />
EMU Subtotal 22 22 21 29 17<br />
Dynamic Brake % 52% 52% 50% 69% 40%<br />
SMU/IMU 20 20 21 13 25<br />
Regenerative<br />
Brake %<br />
48% 48% 50% 31% 60%<br />
Total 42 42 42 42 42<br />
100
Photo Source: Queensland Rail – Network Picture Archive<br />
101
Photo Source: Queensland Rail – Network Picture Archive<br />
102
Photo Source: Queensland Rail – Network Picture Archive<br />
103
Photo Source: Queensland Rail – Network Picture Archive<br />
104
Photo Source: Queensland Rail – Network Picture Archive<br />
105
Photo Source: Queensland Rail – Network Picture Archive<br />
106
Photo Source: Queensland Rail – Network Picture Archive<br />
107
Photo Source: Queensland Rail – Network Picture Archive<br />
108
Photo Source: Queensland Rail – Network Picture Archive<br />
109
Photo Source: Queensland Rail – Network Picture Archive<br />
110
111
Solid Lines simulated operations,<br />
Dashed lines actual operations<br />
from RTOA system<br />
112
PHOTO: Lytton Junction Feeder Station SOURCE: QUEENSLAND RAIL, Trevor Bagnall<br />
113
Double Track Section<br />
Maximum Voltage at train panto<br />
L<br />
J<br />
F<br />
S<br />
Minimum Voltage at train panto<br />
114
UP<br />
TRACK<br />
Time Period Load Curve for<br />
Transformer LJFS – T5<br />
TRANSFORMER<br />
DOWN<br />
TRACK<br />
115
Time Period Load Curve for<br />
Transformer LJFS – T6<br />
UP<br />
TRACK<br />
DOWN<br />
TRACK<br />
TRANSFORMER<br />
116
Time Period Load Curve for<br />
Transformer LJFS – T6<br />
117
Time Period Load Curve for<br />
Transformer LJFS – T6<br />
118
Time Period Load Curve for<br />
Transformer LJFS – T6<br />
119
Time Period Load Curve for<br />
Transformer LJFS – T6<br />
The current at each of the 14,400 seconds of the<br />
simulation is considered and the maximum current<br />
during that time (ca 750 amperes) is plotted for T6<br />
120
Time Period Load Curve for<br />
Transformer LJFS – T6<br />
The arrow indicates, on the<br />
exponential scale, 3,600 seconds or<br />
one hour of operation, during the<br />
peak period. The current is shown<br />
as c.a. 270 amperes<br />
121
Time Period Load Curve for<br />
Transformer LJFS – T6<br />
The 270 amperes is the maximum<br />
average of the currents taken for<br />
one hour during the morning peak<br />
122
The 1st hour is from second 1 to<br />
second 3,601. The 2 nd hour is from<br />
second 2 to second 3,602 etc. until<br />
we reach second 14,400. For each<br />
hour the average current is<br />
calculated and the maximum of<br />
these averaged currents is plotted<br />
on the curve at 3,600 seconds.<br />
Time Period Load Curve for<br />
Transformer LJFS – T6<br />
123
Photo Source: Queensland Rail – Network Picture Archive<br />
124
125
CVN<br />
WPY<br />
TNS<br />
MNY<br />
WNM<br />
LDM<br />
MJE<br />
MGS<br />
CRO<br />
SINGLE TRACK WITH sS PASSING LOOPS<br />
sS<br />
DOUBLE TRACK<br />
ORO<br />
BDE<br />
LOT<br />
WNC<br />
WNH<br />
HMM<br />
CNQ<br />
NPK<br />
BRD<br />
126
CVN<br />
WPY<br />
TNS<br />
MNY<br />
WNM<br />
LDM<br />
MJE<br />
MGS<br />
CRO<br />
LJFS – T6<br />
sS<br />
sS<br />
LJFS – T5<br />
ORO<br />
BDE<br />
LOT<br />
WNC<br />
WNH<br />
HMM<br />
CNQ<br />
NPK<br />
BRD<br />
127
CVN<br />
WPY<br />
TNS<br />
MNY<br />
WNM<br />
LDM<br />
MJE<br />
MGS<br />
CRO<br />
Trains accelerating at Cleveland, Birkdale & Lota<br />
ORO<br />
BDE<br />
LOT<br />
WNC<br />
WNH<br />
HMM<br />
CNQ<br />
NPK<br />
BRD<br />
128
CVN<br />
WPY<br />
TNS<br />
MNY<br />
WNM<br />
LDM<br />
MJE<br />
MGS<br />
CRO<br />
Train 1M03 2 x 3 Car 8<br />
Motor EMU<br />
ORO<br />
BDE<br />
LOT<br />
WNC<br />
WNH<br />
HMM<br />
CNQ<br />
NPK<br />
BRD<br />
129
CVN<br />
WPY<br />
TNS<br />
MNY<br />
WNM<br />
LDM<br />
MJE<br />
MGS<br />
CRO<br />
Train 1M03 2 x 3 Car 8<br />
Motor EMU<br />
Train 1816 1 x 3 Car 8 Motor<br />
+ 1 x 3 Car 6 Motor EMU<br />
ORO<br />
BDE<br />
LOT<br />
WNC<br />
WNH<br />
HMM<br />
CNQ<br />
NPK<br />
BRD<br />
130
CVN<br />
WPY<br />
TNS<br />
MNY<br />
WNM<br />
LDM<br />
MJE<br />
MGS<br />
CRO<br />
Train 1M03 2 x 3 Car 8<br />
Motor EMU<br />
Train 1A15 2 x 3 Car 8<br />
Motor SMU<br />
Train 1816 1 x 3 Car 8 Motor<br />
+ 1 x 3 Car 6 Motor EMU<br />
ORO<br />
BDE<br />
LOT<br />
WNC<br />
WNH<br />
HMM<br />
CNQ<br />
NPK<br />
BRD<br />
131
Velocity in kms per hour<br />
23160<br />
23162<br />
23164<br />
23166<br />
23168<br />
23170<br />
23172<br />
23174<br />
23176<br />
23178<br />
23180<br />
23182<br />
23184<br />
23186<br />
23188<br />
23190<br />
23192<br />
23194<br />
23196<br />
23198<br />
23200<br />
23202<br />
23204<br />
23206<br />
23208<br />
23210<br />
23212<br />
23214<br />
23216<br />
23218<br />
23220<br />
90.000<br />
Train Velocity against Simulation Time in Seconds<br />
80.000<br />
70.000<br />
60.000<br />
Acceleration<br />
from Birkdale<br />
50.000<br />
40.000<br />
30.000<br />
Acceleration from<br />
Cleveland P2<br />
1M03 kph<br />
1816 kph<br />
1A15 kph<br />
20.000<br />
10.000<br />
Acceleration<br />
from Lota<br />
0.000<br />
Simulation Time in Seconds from 06:26:00 to 06:27:00<br />
132
UP RW<br />
UP DN<br />
CATENARY (MW)<br />
CONTACT (CW)<br />
DN RW<br />
UP<br />
LR RR<br />
DN<br />
LR RR<br />
UP = Direction Park Road to Cleveland<br />
RW = Return Wire<br />
LR = Left Rail<br />
DN = Direction Cleveland to Park Road<br />
RR = Right Rail<br />
133
134
135
136
Photo Source: Queensland Rail – Network Picture Archive<br />
137
Benchmark Summary<br />
5 days of morning peak (6am to 10am)<br />
on the Cleveland Line<br />
Train Graph used for comparison<br />
between actual and simulated train<br />
running for each of the 5 days.<br />
The simulated energy for each day will<br />
have a variation of less than 10% of that<br />
measured at Lytton Junction Feeder<br />
Station busbars.<br />
Result<br />
Co – simulation between <strong>OpenTrack</strong> and<br />
OpenPowerNet conducted for each of<br />
the 5 days of morning peak operations.<br />
Outputs tabled to Queensland Rail<br />
Train graphs produced for each of the 5<br />
days showing the simulated against<br />
actual operations for the morning peak.<br />
Graphs handed to Queensland Rail and<br />
compared with actual operations (RTOA)<br />
The simulated results were handed to<br />
Queensland Rail<br />
Photo Source: Queensland Rail – Network Picture Archive<br />
138
16000 kWh<br />
14000 kWh<br />
12000 kWh<br />
QueenslandRail Proof of Concept<br />
energy consumption at Lytton Junction Feeding Station<br />
30.01.2012 - 03.02.2012 6am-10am Cleveland to Park Road<br />
15147 kWh<br />
13998 kWh<br />
13300 kWh 13228 kWh<br />
12892 kWh<br />
12874 kWh<br />
12500 kWh 12396 kWh<br />
13415 kWh<br />
12508 kWh 12645 kWh<br />
11457 kWh<br />
10000 kWh<br />
8000 kWh<br />
6000 kWh<br />
Measurement<br />
Simulation 90%<br />
& 80% single line<br />
4000 kWh<br />
2000 kWh<br />
0 kWh<br />
Monday Tuesday Wednesday Thursday Friday 5 day average<br />
139
140
Benchmark Summary<br />
5 days of morning peak (6am to 10am)<br />
on the Cleveland Line<br />
Train Graph used for comparison<br />
between actual and simulated train<br />
running for each of the 5 days.<br />
The simulated energy for each day will<br />
have a variation of less than 10% of that<br />
measured at Lytton Junction Feeder<br />
Station busbars.<br />
Result<br />
Co – simulation between <strong>OpenTrack</strong> and<br />
OpenPowerNet conducted for each of<br />
the 5 days of morning peak operations.<br />
Outputs tabled to Queensland Rail<br />
Train graphs produced for each of the 5<br />
days showing the simulated against<br />
actual operations for the morning peak.<br />
Graphs handed to Queensland Rail and<br />
compared with actual operations (RTOA)<br />
The simulated results were handed to<br />
Queensland Rail<br />
Photo Source: Queensland Rail – Network Picture Archive<br />
141
Photo Source: Queensland Rail – Network Picture Archive<br />
142
Photo Source: Queensland Rail – Network Picture Archive<br />
143
144
145
PHOTO: Murarrie Curve – SOURCE: Queensland Rail Trevor Bagnall<br />
146