FVCA Yearbook 2006 - Suomen pääomasijoitusyhdistys ry
FVCA Yearbook 2006 - Suomen pääomasijoitusyhdistys ry
FVCA Yearbook 2006 - Suomen pääomasijoitusyhdistys ry

Create successful ePaper yourself
Turn your PDF publications into a flip-book with our unique Google optimized e-Paper software.
ACTIVE PORTFOLIO<br />
Biotechnology<br />
Electronics<br />
Energy<br />
Internet –technology<br />
Chemicals & Materials<br />
Transportation<br />
Consumer<br />
Retail<br />
Other (e.g. production)<br />
Medical<br />
Instruments / Devices<br />
Pharmaceuticals<br />
Healthcare<br />
Services<br />
Manufacturing (other)<br />
Financial Services<br />
Construction<br />
Telecommunication<br />
Industrial Products & Services<br />
Industrial Automation<br />
Computer<br />
Hardware<br />
Software<br />
Services<br />
Semiconductors<br />
Communications<br />
Other<br />
Total<br />
Total<br />
Portfolio<br />
M€<br />
43<br />
182<br />
18<br />
45<br />
86<br />
50<br />
139<br />
36<br />
103<br />
251<br />
46<br />
106<br />
99<br />
132<br />
238<br />
21<br />
25<br />
20<br />
191<br />
15<br />
206<br />
4<br />
157<br />
23<br />
22<br />
61<br />
98<br />
1821<br />
Total<br />
Portfolio<br />
%<br />
1,8<br />
7,5<br />
0,7<br />
1,9<br />
3,6<br />
2,1<br />
5,8<br />
1,5<br />
4,3<br />
10,4<br />
1,9<br />
4,4<br />
4,1<br />
5,5<br />
9,8<br />
0,9<br />
1,0<br />
0,8<br />
7,9<br />
0,6<br />
8,5<br />
0,2<br />
6,5<br />
1,0<br />
0,9<br />
2,5<br />
4,1<br />
100%<br />
Total<br />
Portfolio<br />
Number*<br />
24<br />
54<br />
7<br />
28<br />
19<br />
11<br />
49<br />
20<br />
29<br />
81<br />
35<br />
21<br />
25<br />
45<br />
57<br />
5<br />
15<br />
16<br />
106<br />
13<br />
153<br />
6<br />
125<br />
16<br />
6<br />
22<br />
40<br />
745<br />
Total<br />
Portfolio<br />
%<br />
3,2<br />
7,2<br />
0,9<br />
3,8<br />
2,6<br />
1,5<br />
6,6<br />
2,7<br />
3,9<br />
10,9<br />
4,7<br />
2,8<br />
3,4<br />
6,0<br />
7,7<br />
0,7<br />
2,0<br />
2,1<br />
14,2<br />
1,7<br />
20,5<br />
0,8<br />
16,8<br />
2,1<br />
0,8<br />
3,0<br />
5,4<br />
100%<br />
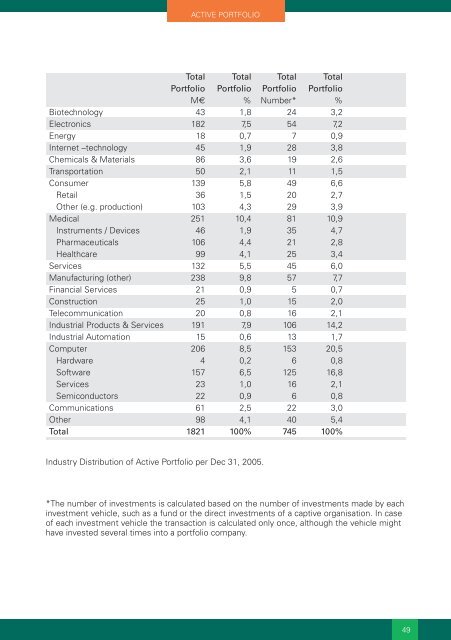
Indust<strong>ry</strong> Distribution of Active Portfolio per Dec 31, 2005.<br />
*The number of investments is calculated based on the number of investments made by each<br />
investment vehicle, such as a fund or the direct investments of a captive organisation. In case<br />
of each investment vehicle the transaction is calculated only once, although the vehicle might<br />
have invested several times into a portfolio company.<br />
49