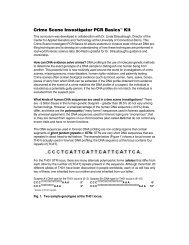
LAB 1 â Biology Lab Skills
LAB 1 â Biology Lab Skills
LAB 1 â Biology Lab Skills

You also want an ePaper? Increase the reach of your titles
YUMPU automatically turns print PDFs into web optimized ePapers that Google loves.
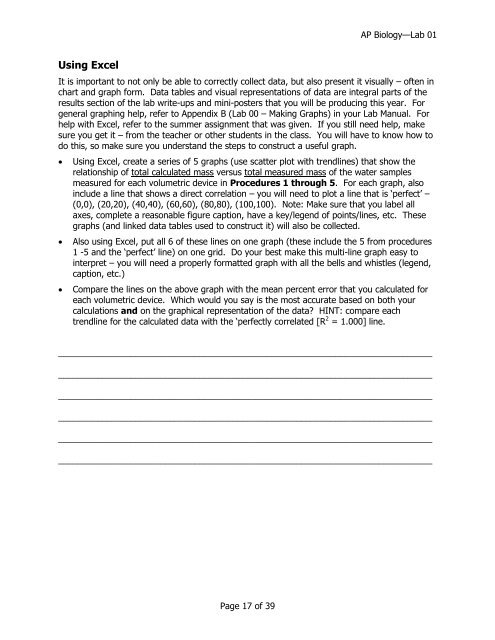
AP <strong>Biology</strong>—<strong>Lab</strong> 01<br />
Using Excel<br />
It is important to not only be able to correctly collect data, but also present it visually – often in<br />
chart and graph form. Data tables and visual representations of data are integral parts of the<br />
results section of the lab write-ups and mini-posters that you will be producing this year. For<br />
general graphing help, refer to Appendix B (<strong>Lab</strong> 00 – Making Graphs) in your <strong>Lab</strong> Manual. For<br />
help with Excel, refer to the summer assignment that was given. If you still need help, make<br />
sure you get it – from the teacher or other students in the class. You will have to know how to<br />
do this, so make sure you understand the steps to construct a useful graph.<br />
<br />
<br />
<br />
Using Excel, create a series of 5 graphs (use scatter plot with trendlines) that show the<br />
relationship of total calculated mass versus total measured mass of the water samples<br />
measured for each volumetric device in Procedures 1 through 5. For each graph, also<br />
include a line that shows a direct correlation – you will need to plot a line that is ‗perfect‘ –<br />
(0,0), (20,20), (40,40), (60,60), (80,80), (100,100). Note: Make sure that you label all<br />
axes, complete a reasonable figure caption, have a key/legend of points/lines, etc. These<br />
graphs (and linked data tables used to construct it) will also be collected.<br />
Also using Excel, put all 6 of these lines on one graph (these include the 5 from procedures<br />
1 -5 and the ‗perfect‘ line) on one grid. Do your best make this multi-line graph easy to<br />
interpret – you will need a properly formatted graph with all the bells and whistles (legend,<br />
caption, etc.)<br />
Compare the lines on the above graph with the mean percent error that you calculated for<br />
each volumetric device. Which would you say is the most accurate based on both your<br />
calculations and on the graphical representation of the data? HINT: compare each<br />
trendline for the calculated data with the ‗perfectly correlated [R 2 = 1.000] line.<br />
_____________________________________________________________________________<br />
_____________________________________________________________________________<br />
_____________________________________________________________________________<br />
_____________________________________________________________________________<br />
_____________________________________________________________________________<br />
_____________________________________________________________________________<br />
Page 17 of 39