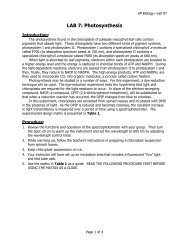
LAB 1 â Biology Lab Skills
LAB 1 â Biology Lab Skills
LAB 1 â Biology Lab Skills

You also want an ePaper? Increase the reach of your titles
YUMPU automatically turns print PDFs into web optimized ePapers that Google loves.
AP <strong>Biology</strong>—<strong>Lab</strong> 01<br />
Using a Standard Curve to Determine an Unknown<br />
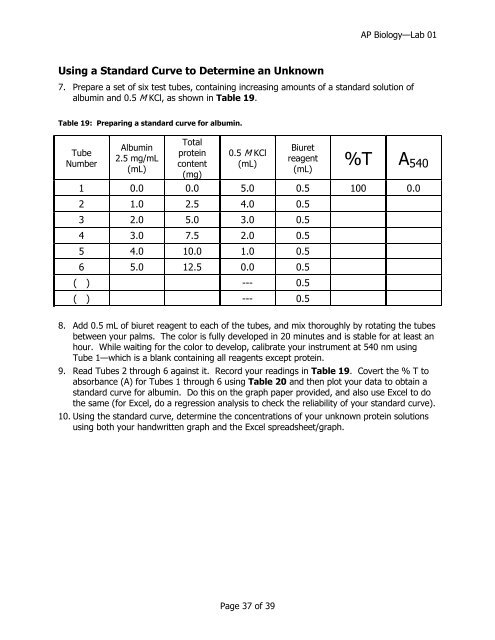
7. Prepare a set of six test tubes, containing increasing amounts of a standard solution of<br />
albumin and 0.5 M KCl, as shown in Table 19.<br />
Table 19: Preparing a standard curve for albumin.<br />
Tube<br />
Number<br />
Albumin<br />
2.5 mg/mL<br />
(mL)<br />
Total<br />
protein<br />
content<br />
(mg)<br />
0.5 M KCl<br />
(mL)<br />
Biuret<br />
reagent<br />
(mL)<br />
%T A 540<br />
1 0.0 0.0 5.0 0.5 100 0.0<br />
2 1.0 2.5 4.0 0.5<br />
3 2.0 5.0 3.0 0.5<br />
4 3.0 7.5 2.0 0.5<br />
5 4.0 10.0 1.0 0.5<br />
6 5.0 12.5 0.0 0.5<br />
( ) --- 0.5<br />
( ) --- 0.5<br />
8. Add 0.5 mL of biuret reagent to each of the tubes, and mix thoroughly by rotating the tubes<br />
between your palms. The color is fully developed in 20 minutes and is stable for at least an<br />
hour. While waiting for the color to develop, calibrate your instrument at 540 nm using<br />
Tube 1—which is a blank containing all reagents except protein.<br />
9. Read Tubes 2 through 6 against it. Record your readings in Table 19. Covert the % T to<br />
absorbance (A) for Tubes 1 through 6 using Table 20 and then plot your data to obtain a<br />
standard curve for albumin. Do this on the graph paper provided, and also use Excel to do<br />
the same (for Excel, do a regression analysis to check the reliability of your standard curve).<br />
10. Using the standard curve, determine the concentrations of your unknown protein solutions<br />
using both your handwritten graph and the Excel spreadsheet/graph.<br />
Page 37 of 39