Lightweight Concrete for High Strength - Expanded Shale & Clay
Lightweight Concrete for High Strength - Expanded Shale & Clay
Lightweight Concrete for High Strength - Expanded Shale & Clay

You also want an ePaper? Increase the reach of your titles
YUMPU automatically turns print PDFs into web optimized ePapers that Google loves.
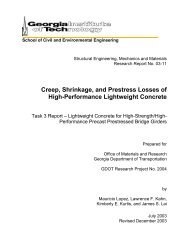
School of Civil and Environmental Engineering<br />
Structural Engineering, Mechanics and Materials<br />
Research Report No. 04-1<br />
<strong>Lightweight</strong> <strong>Concrete</strong> <strong>for</strong> <strong>High</strong> <strong>Strength</strong>/<br />
<strong>High</strong> Per<strong>for</strong>mance Precast Prestressed<br />
Bridge Girders<br />
Final Report<br />
Prepared <strong>for</strong><br />
Office of Materials and Research<br />
Georgia Department of Transportation<br />
GDOT Research Project No. 2004<br />
Lawrence F. Kahn, Kimberly E. Kurtis, James S. Lai, Karl F. Meyer,<br />
Mauricio Lopez, and Brandon Buchberg<br />
by<br />
January 2004
Contract Research<br />
Task Order No. 97-22<br />
GDOT Research Project No. 2004<br />
Final Report:<br />
<strong>Lightweight</strong> <strong>Concrete</strong> <strong>for</strong> <strong>High</strong> <strong>Strength</strong>/<strong>High</strong> Per<strong>for</strong>mance<br />
Precast Prestressed Bridge Girders<br />
Prepared <strong>for</strong><br />
Office of Materials and Research<br />
Georgia Department of Transportation<br />
by<br />
Lawrence F. Kahn, Kimberly E. Kurtis, James S. Lai,<br />
Karl F. Meyer, Mauricio Lopez, and Brandon Buchberg<br />
January 2004<br />
(Revised November 2004)<br />
The contents of this report reflect the views of the authors who are responsible <strong>for</strong> the facts and<br />
accuracy of the data presented herein. The contents do not necessarily reflect the official views<br />
or policies of the Georgia Department of Transportation. This report does not constitute a<br />
standard, specification or regulation.
ACKNOWLEDGMENTS<br />
The research presented in this paper was sponsored by the Georgia Department of<br />
Transportation under Georgia DOT Task Order No. 97-22, Research Project No. 2004.<br />
During the course of this research project, the research team at Georgia Tech received valuable<br />
support and guidance from Georgia DOT professionals including Mr. Paul Liles, Mr. Myron<br />
Banks, Mr. Rick Deaver, Ms. Supriya Kamatkar, and Ms. Lyn Clements. Their support and<br />
guidance are greatly acknowledged.<br />
The opinions and conclusions expressed herein are those of the authors and do not<br />
represent the opinions, conclusions, policies, standards or specifications of the Georgia<br />
Department of Transportation or of the other sponsoring and cooperating organizations.<br />
For the laboratory phases of the research, Lafarge Cement, Boral Materials Technologies,<br />
and Grace Construction Products donated cement, flyash, and concrete admixtures, respectively.<br />
Carolina Stalite Company donated all expanded slate lightweight aggregate. Tindall Corporation<br />
constructed all prestressed girders.<br />
Georgia Tech students aided in concrete specimen and girder construction; they included<br />
Adam Slapkus, Maria Wilmhof, and Natalie Hodges. Messrs. Charles Freeman and Ken<br />
Harmon of the Carolina Stalite Company provided valuable advice. Also providing assistance<br />
were Mr. Joe Wolfe from Grace Construction Products, and Messrs. Corey Greika and Mark<br />
Zirbel of Tindall Corporation. The assistance and support from these individuals and<br />
organizations is greatly appreciated.<br />
ii
EXECUTIVE SUMMARY<br />
The purpose of the research was to determine if lightweight aggregate, high strength/high<br />
per<strong>for</strong>mance concrete is applicable <strong>for</strong> construction of precast prestressed bridge girders. The<br />
research found not only that expanded slate lightweight aggregate is applicable <strong>for</strong> bridge girder<br />
construction but also that the material demonstrated advantages. The latter include (1) reduced<br />
weight of less than 120 lb/ft 3 leading to the ability to construct girders with over a 150 ft. span<br />
which would have a girder plus transit vehicle weight less than 150,000 pounds, (2) design<br />
compressive strengths up to 10,000 psi, and (3) creep de<strong>for</strong>mations and prestress losses less than<br />
found with normal weight, normal strength concrete. Tests of AASHTO Type II composite<br />
girders made with the high per<strong>for</strong>mance lightweight concrete (HPLC) showed that the flexural<br />
and shear strengths, the transfer and development lengths, and prestress losses can be<br />
conservatively predicted using the current AASHTO Standard Specifications <strong>for</strong> <strong>High</strong>way<br />
Bridges (1996).<br />
The research was divided into analytical, materials, and structural girder test phases.<br />
Bridges with normal weight, 3,500 psi, composite decks 8-in. thick and with HPLC girders<br />
spaced 7 ft. on centers were analyzed. The span length of a girder is only increased between 2 to<br />
4 percent when the material is changed from normal weight to lightweight concrete where the<br />
unit weight is less than 125 lb/ft 3 . Yet, the gross vehicle weight (girder plus transit truck) is<br />
reduced by about 30,000 lbs. <strong>for</strong> girder lengths greater than 130 ft. Bulb-Tee sections 65-in., 72-<br />
in., and 74-in. deep made with HPLC with strengths of 12,000 psi, 10,000 psi and 8,000 psi,<br />
respectively, have spans between 150 and 155 ft. and gross vehicle weights less than 150,000<br />
lbs.<br />
The materials investigation batched over 80 mixes in the laboratory and at a precast<br />
concrete plant to develop HPLC with design strengths of 8,000, 10,000 and 12,000 psi. Based<br />
on 56-day compressive strength, a strength ceiling of 11,600 psi was found when using ½-in.<br />
expanded slate aggregate and normal weight natural sand. There<strong>for</strong>e, a 12,000 psi design<br />
strength mix was not attainable. HPLC can be produced repeatedly at precast concrete plants so<br />
long as good quality control procedures such as maintaining a saturated condition of the<br />
lightweight aggregate are maintained.<br />
iii
A statistical evaluation based on field studies concluded that the mean strength of HPLC<br />
should be 600 psi greater than the required design strength. The elastic moduli of the specimens<br />
ranged from 2,980 ksi to 4,680 ksi, and Equation S.1 was developed to predict the moduli of<br />
expanded slate HPLC.<br />
' wc<br />
E<br />
c<br />
= 44,000 fc<br />
(S.1)<br />
145<br />
The rupture modulus ranged from 545 psi to 1,283 psi, conservatively predicted as<br />
7.5λ<br />
fc<br />
' , where the λ can be taken as 0.85 <strong>for</strong> sand-lightweight concrete. The HPLC developed<br />
in this project was found to possess a low to negligible chloride permeability classification<br />
according to ASTM 1202. The low chloride permeability is believed to be the result of<br />
incorporating silica fume into the mix designs. The average coefficient of thermal expansion<br />
value (CTE) was 5.3 x 10 -6 , approximately the same as high strength, normal weight concrete.<br />
The long-term creep and shrinkage studies showed that the creep of HPLC was less than<br />
that of normal weight high per<strong>for</strong>mance concrete while the shrinkage was somewhat greater. The<br />
620-day creep of 8,000-psi HPLC was about 1,650 µε and 2,000 µε when loaded to 40% and<br />
60% of initial strength, respectively. On the other hand, the 620-day creep of 10,000-psi HPLC<br />
was approximately 1,160 µε and 1,500 µε when loaded to 40% and 60% of initial strength. The<br />
620-day shrinkage was approximately 820 µε <strong>for</strong> the 8,000-psi HPLC mix and 610 µε <strong>for</strong> the<br />
10,000-psi HPLC mix. Considering creep and shrinkage per<strong>for</strong>mance, the Shams and Kahn<br />
(2000) model was the best model <strong>for</strong> predicting long-term strains of HPLC made with locally<br />
available materials in Georgia.<br />
The AASHTO-LRFD (1998) refined method <strong>for</strong> estimating prestress losses was<br />
conservative when compared to measured long-term losses found in six AASHTO Type II<br />
precast, prestressed girders made with HPLC. The AASHTO-LRFD lump sum method was<br />
conservative <strong>for</strong> estimating prestress losses on the 10,000-psi girders made with HPLC. Overall,<br />
the AASHTO-LRFD refined method may be used conservatively <strong>for</strong> predicting prestress losses<br />
in girders made of high per<strong>for</strong>mance lightweight concrete.<br />
Overall, expanded slate HPLC is applicable <strong>for</strong> construction of precast bridge girders<br />
with design strengths up to 10,000 psi.<br />
iv
TABLE OF CONTENTS<br />
Acknowledgments<br />
ii<br />
Executive Summary<br />
iii<br />
Notation<br />
vi<br />
Chapter 1 - Introduction 1-1<br />
1.1 – Purpose and Objectives 1-1<br />
1.2 – Scope 1-1<br />
1.3 –<strong>High</strong> Per<strong>for</strong>mance <strong>Lightweight</strong> <strong>Concrete</strong> 1-1<br />
1.4 – Report Organization 1-2<br />
1.5 – Background 1-2<br />
Chapter 2 – Analytical Investigation 2-1<br />
2.1 – General 2-1<br />
2.2 – Scope 2-1<br />
2.3 – Parametric Study 2-2<br />
2.4 – Analysis Results and Discussion 2-3<br />
Chapter 3 – Mix Designs, Field Evaluation, and Short-term Properties 3-1<br />
3.1 – Preliminary Laboratory Investigation 3-1<br />
3.2 – Laboratory Investigation – Short-term Properties 3-4<br />
3.3 – Field Investigation 3-7<br />
Chapter 4 – Creep and Shrinkage of <strong>High</strong> Per<strong>for</strong>mance <strong>Lightweight</strong> <strong>Concrete</strong> 4-1<br />
4.1 – Introduction 4-1<br />
4.2 – Experimental Program and Results 4-1<br />
4.3 – Creep and Shrinkage Test Results vs. Model Estimates 4-4<br />
4.4 – Conclusions Regarding Creep and Shrinkage 4-8<br />
Chapter 5 – Behavior of AASHTO Type II HPLC Girders 5-1<br />
5.1 – Introduction 5-1<br />
5.2 – Girder Design 5-2<br />
5.3 – Instrumentation 5-7<br />
5.4 – Girder Construction 5-8<br />
5.5 – Material Properties 5-10<br />
v
5.6 – Transfer Length 5-13<br />
5.7 – Girders Tests and Results 5-15<br />
5.8 – Cracking Results 5-18<br />
5.9 – Shear Behavior 5-19<br />
5.10 – Development Length of 0.6-in. Strand in HPLC 5-24<br />
Chapter 6 – Prestress Losses in HPLC 6-1<br />
6.1 – Introduction 6-1<br />
6.2 – Strain Measurements and Comparison to Predicted Losses 6-1<br />
6.3 – Conclusions Regarding Prestress Losses 6-4<br />
Chapter 7 – Conclusions and Recommendations 7-1<br />
7.1 – Analytical Investigation 7-1<br />
7.2 – HPLC Mixes and Properties 7-1<br />
7.3 – Transfer Length 7-2<br />
7.4 – Flexural Behavior 7-2<br />
7.5 – Shear Behavior 7-2<br />
7.6 – Development Length 7-3<br />
7.7 – Long-term Per<strong>for</strong>mance of HPLC 7-3<br />
7.8 – Recommendations 7-4<br />
Appendices<br />
A - Background A-1<br />
B – Creep and Shrinkage B-1<br />
C – Girder Construction and Testing C-1<br />
D – Prestress Losses in HPLC D-1<br />
References<br />
References-1<br />
vi
NOTATION<br />
Report<br />
ACI<br />
318-<br />
99<br />
AASHTO<br />
Standard<br />
Description<br />
a -- -- Shear span, distance from support to point load on girder<br />
A c -- --<br />
Cross sectional area of composite girder (combined area of<br />
girder and deck)<br />
A nc -- -- Cross sectional area of girder<br />
AASHTO -- --<br />
American Association of State <strong>High</strong>way and Transportation<br />
Officials<br />
A ps A ps A s * Cross sectional area of prestressing strand<br />
A pse -- --<br />
Effective area of prestressed rein<strong>for</strong>cement adjusted inside the<br />
transfer or development length regions<br />
A v A v A v Area of shear (stirrup) rein<strong>for</strong>cement<br />
BCL -- --<br />
Distance from bottom of girder to center line of bottom row of<br />
prestressing strands<br />
CM -- -- Cementitious Materials<br />
CSS -- -- <strong>Concrete</strong> Surface Strain<br />
DAQ -- -- Data Acquisition<br />
d b d b D Diameter of prestressing strand<br />
DEMEC -- -- Detachable Mechanical Strain Gage<br />
d p d p d<br />
Distance from compression fiber to centroid of prestressed<br />
rein<strong>for</strong>cement<br />
E c E c E c Modulus of elasticity of concrete based on 6 x 12 cylinder<br />
E ci -- --<br />
Modulus of elasticity of concrete based on 6 x 12 cylinder at<br />
strand release<br />
Elastic modulus of prestressing steel (ksi)<br />
E ps<br />
f c ’ f c ’ f c ’ <strong>Concrete</strong> compressive strength at specified time<br />
f ci ' f ci ' f ci ' <strong>Concrete</strong> compressive strength at strand release<br />
f d f d<br />
Tensile stress at the extreme tensile fiber due to the dead load of<br />
the girder and slab<br />
f cds<br />
stress in concrete at the cgs due to all superimposed dead loads<br />
(ksi)<br />
f r f r f r Modulus of rupture of concrete<br />
f pc f pc f pc<br />
Resultant compressive stress at the centroid of the composite<br />
section or at the junction of the web and flange when the<br />
centroid lies within the flange due to both prestress and moments<br />
resisted by the precast member acting alone.<br />
Compressive stress at the extreme tensile fiber due to effective<br />
f pe f pe<br />
prestressing <strong>for</strong>ce<br />
f ps f ps f su *<br />
Stress in prestressed rein<strong>for</strong>cement at nominal strength of<br />
member<br />
vii
Report<br />
ACI<br />
318-<br />
99<br />
AASHTO<br />
Standard<br />
Description<br />
f pt -- -- Stress in prestressing strand just prior to strand release<br />
f pu f pu f s ’ Specified tensile strength of prestressed rein<strong>for</strong>cement<br />
f se f se f se Effective prestressing stress after losses<br />
f si -- -- Stress in prestressing strand just after strand release<br />
f su<br />
Stress in prestressed rein<strong>for</strong>cement at nominal strength of<br />
member<br />
f y f y f sy Specified yield strength of non-prestressed rein<strong>for</strong>cement<br />
h h h<br />
Overall depth of the composite girder;<br />
Also used as relative humidity <strong>for</strong> shrinkage calculations<br />
I c -- -- Moment of inertia of composite girder (girder and deck)<br />
I nc -- -- Moment of inertia of girder<br />
l d l d --<br />
l fb -- --<br />
Development length of prestressing strand (In AASHTO<br />
Standard, l d refers to non-prestressed rein<strong>for</strong>cement development<br />
length)<br />
Flexural bond length. Additional length over which the strand<br />
should be bonded so the stress f ps may develop in the strand at<br />
the nominal strength of the member.<br />
l t -- -- Transfer length of prestressing strand<br />
LOLAX -- -- Low relaxation loss prestressing strand<br />
M DL -- -- Moment due to Dead Load<br />
n n -- Modular Ratio<br />
s s s Spacing of shear rein<strong>for</strong>cement<br />
S Beam or specimen surface area (in 2 )<br />
S top-nc -- -- Top section modulus <strong>for</strong> non-composite girder<br />
S bot-nc -- -- Bottom section modulus of non-composite girder<br />
S top-c -- -- Top section modulus <strong>for</strong> composite girder<br />
S bot-c -- -- Bottom section modulus <strong>for</strong> composite girder<br />
t<br />
age of concrete (days) <strong>for</strong> creep and shrinkage calculations<br />
t’<br />
age of concrete at loading (days) <strong>for</strong> creep and shrinkage<br />
calculations<br />
TCL -- --<br />
Distance from top of girder to center line of top row of<br />
prestressing strands<br />
W/CM -- -- Water to Cementitious Materials Ratio<br />
w c w c w c Unit weight of concrete<br />
V Beam or specimen volume (in 3 )<br />
V c V c V c Nominal shear strength provided by concrete<br />
V ci V ci V ci<br />
Nominal shear strength provided by concrete when diagonal<br />
cracking results from combined shear and moment<br />
V cw V cw V cw<br />
Nominal shear strength provided by concrete when diagonal<br />
cracking results from excessive principal tensile stress in the<br />
web<br />
viii
Report<br />
ACI<br />
318-<br />
99<br />
AASHTO<br />
Standard<br />
Description<br />
V d V d V d Shear <strong>for</strong>ce from dead load of girder plus deck slab<br />
V s V s V s Nominal strength provided by shear rein<strong>for</strong>cing steel<br />
V p V p V p Vertical component of the effective prestressing <strong>for</strong>ce<br />
VWSG -- -- Vibrating Wire Strain Gage<br />
α<br />
Shrinkage constant depending on member shape and size<br />
ε sh<br />
Shrinkage strain<br />
γ<br />
Creep coefficient parameters (ACI-209)<br />
λ λ λ Correction factor of unit weight of concrete, taken as 0.85<br />
Γ<br />
Stress-to-strength ratio at loading <strong>for</strong> creep calculations<br />
Creep coefficient at age “t” loaded at t′<br />
ø t<br />
ø u<br />
ψ<br />
Ultimate creep coefficient<br />
Creep constant depending on member shape and size<br />
ix
Chapter 1. Introduction<br />
1.1 Purpose and Objectives<br />
The purpose of the research was to determine if lightweight aggregate, high strength<br />
concrete is applicable <strong>for</strong> construction of precast prestressed bridge girders. Specific objectives<br />
were as follows: (1) analytically determine if a high strength/high per<strong>for</strong>mance lightweight<br />
concrete (HPLC) could be used to effectively increase the span length of bridge structures and to<br />
provide a span of 150 ft. with a girder plus truck weight less than 150,000 lbs.; (2) to develop<br />
HPLC mixes with design strengths of 8,000 psi, 10,000 psi, and 12,000 psi; (3) determine the<br />
short and long term properties of selected HPLC mixes; (4) verify that the HPLC mixes could be<br />
produced at precast concrete plants; and (5) determine if precast prestressed girders made with<br />
HPLC behave in con<strong>for</strong>mance with AASHTO design specifications.<br />
1.2 Scope<br />
The scope of the research was limited to using expanded slate lightweight aggregate; all<br />
lightweight aggregate was obtained from Carolina Stalite Company. Only six AASHTO Type II<br />
girders were tested, three made from an 8,000 psi design mix and three from a 10,000 psi design<br />
mix.<br />
1.3 <strong>High</strong> Per<strong>for</strong>mance <strong>Lightweight</strong> <strong>Concrete</strong><br />
The Federal <strong>High</strong>way Administration (FHWA) definition of high per<strong>for</strong>mance concrete<br />
(HPC) can be seen in Table 1.1 (Goodspeed et al. 1996). In general, lightweight concrete (LWC)<br />
is concrete that possesses a unit weight of less than 120 pcf (Murillo et al. 1994). In this report,<br />
all controlled density concrete with a unit weight less than 125 pcf and design strengths greater<br />
than 6,000 psi is termed <strong>High</strong>-Per<strong>for</strong>mance <strong>Lightweight</strong> <strong>Concrete</strong> (HPLC) and applies to<br />
concrete with lightweight fine and coarse aggregate and to concrete with natural sand and<br />
lightweight coarse aggregate.<br />
1-1
Table 1.1 Characteristics <strong>for</strong> Per<strong>for</strong>mance of <strong>High</strong> Per<strong>for</strong>mance <strong>Concrete</strong> Grades<br />
(Goodspeed et al. 1996)<br />
Per<strong>for</strong>mance Standard<br />
FHWA Grade<br />
characteristic Test<br />
Method<br />
1 2 3 4<br />
Compressive<br />
strength)<br />
Modulus of<br />
elasticity<br />
Chloride<br />
Penetraion<br />
(coulombs)<br />
Creep<br />
microstrain/<br />
pressure unit<br />
Shrinkage<br />
(microstrain)<br />
AASHTO<br />
T 2 ASTM<br />
C39<br />
41 < x < 55 Mpa<br />
(6000 < x <<br />
8000 psi)<br />
ASTM 469 28 < x < 40 Gpa<br />
(4000 < x <<br />
6000 ksi)<br />
AASHTO<br />
T 277<br />
ASTM C<br />
1202<br />
ASTM C<br />
512<br />
ASTM C<br />
157<br />
55 < x < 69 Mpa<br />
(8000 < x <<br />
10000 psi)<br />
40 < x < 50 Gpa<br />
(6000 < x < 7500<br />
ksi)<br />
69 < x < 97 Mpa<br />
(10000 < x <<br />
14000 psi)<br />
3000 > x > 2000 2000 > x > 800 800 > x<br />
75 > x > 60 /<br />
Mpa (0.52 ><br />
x > 0.41 / psi)<br />
60 > x > 45 / Mpa<br />
(0.41 > x > 0.31 /<br />
psi)<br />
50 < x Gpa<br />
(7500 ksi < x)<br />
45 > x > 30 / Mpa<br />
(0.31 > x > 0.21 /<br />
psi)<br />
800 > x > 600 600 > x > 400 400 > x<br />
97 MPa <<br />
x<br />
(14000 <<br />
x)<br />
30 MPa ><br />
x (0.21<br />
/ psi > x)<br />
1.4 Report Organization<br />
This report summarizes the complete research project. The analytical investigation is<br />
summarized in Chapter 2. Mix designs, short term properties and the field evaluation are<br />
presented in Chapter 3. Long term creep and shrinkage per<strong>for</strong>mance are summarized in Chapter<br />
4. The behavior of the six AASHTO Type II girders is discussed in Chapter 5. Prestress loss is<br />
given in Chapter 6. Conclusions and recommendations <strong>for</strong> use of HPLC are presented in<br />
Chapter 7.<br />
1.5 Background<br />
Previous task reports give detailed background studies of high per<strong>for</strong>mance and<br />
lightweight concrete research. Buchberg and Kahn (2002) presents details of lightweight<br />
concrete and high per<strong>for</strong>mance concrete mix designs and of the short term properties of HPLC.<br />
1-2
Long term properties including pretress losses are given by Lopez et al. (2003). Meyer et al.<br />
(2002) presents the behavior of prestressed girders made of lightweight concrete, high<br />
per<strong>for</strong>mance concrete and of HPLC.<br />
Appendix A gives a detailed background of research conducted on high per<strong>for</strong>mance<br />
lightweight concrete mixes and properties.<br />
1-3
Chapter 2. Analytical Investigation<br />
2.1 General<br />
The potential advantages of using high-strength, high-per<strong>for</strong>mance concretes (HPC) <strong>for</strong><br />
precast prestressed bridge girders may be lost if those girders are too heavy to be transported.<br />
The advantages presented by Kahn and Saber (2000) include spans up to 40% longer than when<br />
normal strength (6 ksi, 41.4 MPa) concrete is used, wider girder spacing and greater durability.<br />
A gauge of the transportation problem is the necessity to obtain hauling permits or “super<br />
permits.” When the gross vehicle weight (GVW, weight of girder plus tractor-trailer rig)<br />
exceeds 150-kips (68,200 kg), a “super permit” is required. This permit requires the hauler to<br />
obey certain additional restrictions that may include stopping be<strong>for</strong>e every bridge, proceeding<br />
over the bridge at a speed less than 5 mph (8 kmph) and that a police escort lead and follow the<br />
truck. Further, the state department of transportation must carefully review the route and<br />
evaluate the load capacity of each bridge. There may be no acceptable route. The slow rate of<br />
bridge crossing can significantly disrupt traffic.<br />
The purpose of this phase of the research was to investigate analytically if high-strength<br />
lightweight concrete (HSLWC) could be used to build pretensioned bridge girders with a length<br />
of 150-ft. (45.7 m) and girder spacing of 7-ft. (2.13 m) whose GVW did not exceed 150-kips<br />
(68,181 kg). Standard AASHTO (American Association of State <strong>High</strong>way and Transportation<br />
Officials) and AASHTO-PCI (Precast/Prestressed <strong>Concrete</strong> Institute) sections are considered.<br />
The range of girder strengths was 8, 10 and 12 ksi (55.2, 69 and 82.8 MPa). The strength of the<br />
7-in. (178 mm) thick composite deck was 3,500 psi (24 MPa).<br />
2.2 Scope<br />
The scope of this study was limited to analytically investigating AASHTO Type II-V and<br />
AASHTO-PCI Bulb-Tee 54, 63 and 72 sections (Standard and Modified). For reference<br />
purposes, AASHTO-PCI Bulb-Tees will be listed as “Standard Bulb-Tees”. A Modified<br />
AASHTO-PCI Bulb-Tee will be listed as a “Modified Bulb-Tee.” The Modified Bulb-Tee<br />
sections consisted of a Standard Bulb-Tee with one additional row of 12 strands added to the<br />
2-1
ottom flange. Prestressing strands were 0.6-in. (15 mm) diameter, 270 ksi (1862 MPa) low<br />
relaxation strands spaced at 2-in. (51 mm) centers.<br />
All girder designs in this research were based on the 16 th Edition of the AASHTO Bridge<br />
Design Specifications (1996) and used Georgia’s bridge design program PCPSBM1R with<br />
modifications to enable the use of HPLC.<br />
2.3 Parametric Study<br />
A parametric study investigated the relation between concrete compressive strength, unit<br />
weight of the concrete, girder size and span length. One of the most important properties was the<br />
modulus of elasticity of the HPLC. In order to more accurately predict modulus values, a new<br />
equation was developed (Equation 2-1), similar in <strong>for</strong>m to the Morales equation (Morales, 1982),<br />
but based on a “best fit” analysis of the experimental data from the thirteen expanded slate<br />
mixes.<br />
0.9<br />
( 33,000⋅ fc<br />
' + 4,000,000) ⋅(<br />
wc<br />
/ 242)<br />
(2-1)<br />
The Georgia DOT bridge design program PCPSBM1R was modified to use lightweight<br />
concrete with λ factor of 0.75 and 0.85 <strong>for</strong> all-lightweight and <strong>for</strong> sand-lightweight concrete and<br />
to have densities less than 135 pcf. It was assumed that the concrete strength at release was 75%<br />
of the design strength. Design strengths of 8,000, 10,000 and 12,000 psi were used. Girder<br />
spacing was 7 ft, and the composite deck was taken as 7-in. thick with a strength of 3,500 psi.<br />
Unit weight given in Table 2-1 were used.<br />
Table 2.1 Slate high-strength lightweight concrete unit weight values.<br />
<strong>Concrete</strong> <strong>Strength</strong>, f c ’<br />
psi (MPa)<br />
Low Unit Weight<br />
pcf (kg/m 3 )<br />
Average Unit Weight<br />
pcf (kg/m 3 )<br />
<strong>High</strong> Unit Weight<br />
pcf (kg/m 3 )<br />
8,000 (55.2) 113 (1810) 119 (1906) 126 (2019)<br />
10,000 (69) 117 (1874) 124 (1986) 131 (2099)<br />
12,000 (82.8) 122 (1954) 128 (2051) 135 (2163)<br />
2-2
2.4 Analysis Results and Discussion<br />
Figures.2.1 and 2.2 present the composite girder maximum simple-span length versus the<br />
girder’s concrete compressive strength <strong>for</strong> AASHTO Type II through V sections and Bulb-Tee<br />
54, 63 and 72 sections. Normal weight concrete (solid symbols) and lightweight concrete results<br />
are given. The unit weights lightweight are the “low” and “high” values to provide the range of<br />
results.<br />
Girder lengths using 8 ksi (55.2 MPa) HPLC could be extended by up to about 4 percent<br />
(7-ft. (2.13 m) <strong>for</strong> 140-ft. (42.7 m) girders) as shown in Figure 2.1. The most significant length<br />
increases resulted from the use of the lightest concrete unit weight. The increase in length <strong>for</strong><br />
Type II and III sections was less than <strong>for</strong> Type IV and V sections implying the use of HPLC<br />
provided the most significant benefit <strong>for</strong> girders with lengths over approximately 105 feet (32<br />
m). Figure 2.2 shows trends similar to those <strong>for</strong> Bulb-Tee sections.<br />
HSLWC girder maximum live load deflections resulting from HS 20-44 loading<br />
increased between 15 and 22 percent on average when compared to girders of normal weight<br />
concrete. The lighter concrete unit weights experienced the greatest deflections; however,<br />
deflections were at most 85 percent of the AASHTO maximum allowable L/800 requirement<br />
(L=span length) compared to 57 percent <strong>for</strong> normal weight.<br />
The collective results of GVW, maximum girder length, and section type are shown in<br />
Figure 2.3. Since it was seen that AASHTO Type II and III girders showed little benefit from<br />
HSLWC, they were not included in graph. Within Figure 2.3, there are three data points <strong>for</strong> each<br />
section listed. The three points correspond with the three strengths of concrete. In each case, the<br />
leftmost of the three points represents 8 ksi (55.2 MPa). The center point represents 10 ksi (69<br />
MPa), and the rightmost point represents 12 ksi (88.2 MPa). The average unit weight given in<br />
Table 2.1 was used <strong>for</strong> the lightweight (L) sections while a constant 150 lb/ft 3 (unit weight was<br />
used <strong>for</strong> the normal weight (N) sections.<br />
The most important finding is that it was possible to reach the target span of 150-ft. (45.7<br />
m) without exceeding the 150-kip (68,181 kg) GVW limit through the use of HSLWC. There<br />
are three HSLWC girders that satisfy the requirement: Modified BT-63 (12 ksi), BT-72 (10 ksi)<br />
and Modified BT-72 (8 ksi).<br />
2-3
12500<br />
12000<br />
<strong>Concrete</strong> <strong>Strength</strong>, fc' (psi)<br />
11500<br />
11000<br />
10500<br />
10000<br />
9500<br />
9000<br />
8500<br />
8000<br />
7500<br />
60 70 80 90 100 110 120 130 140 150 160<br />
Girder Length (feet)<br />
NWC Type V LWC Type V (Low) LWC Type V (<strong>High</strong>)<br />
NWC Type IV LWC Type IV (Low) LWC Type IV (<strong>High</strong>)<br />
NWC Type III LWC Type III (Low) LWC Type III (<strong>High</strong>)<br />
NWC Type II LWC Type II (Low) LWC Type II (<strong>High</strong>)<br />
Figure 2.1 Maximum girder length vs. concrete strength <strong>for</strong> AASHTO girders using<br />
normal weight concrete (NWC) and low to high density lightweight concrete (LWC).<br />
<strong>Concrete</strong> <strong>Strength</strong>, fc' (psi)<br />
12500<br />
12000<br />
11500<br />
11000<br />
10500<br />
10000<br />
9500<br />
9000<br />
8500<br />
8000<br />
7500<br />
105 115 125 135 145 155<br />
Girder Length (feet)<br />
NWC BT-54 LWC BT-54 (Low) LWC BT-54 (<strong>High</strong>)<br />
NWC BT-63 LWC BT-63 (Low) LWC BT-63 (<strong>High</strong>)<br />
NWC BT-72 LWC BT-72 (Low) LWC BT-72 (<strong>High</strong>)<br />
Figure 2.2 Maximum girder length vs. concrete strength <strong>for</strong> Standard Bulb-Tee girders using<br />
normal weight concrete (NWC) and low to high density lightweight concrete (LWC).<br />
2-4
GVW (kips)<br />
240<br />
230<br />
220<br />
210<br />
200<br />
190<br />
180<br />
170<br />
160<br />
150<br />
140<br />
130<br />
120<br />
110<br />
100<br />
90<br />
SUPERLOAD PERMIT<br />
REQUIRED<br />
100 110 120 130 140 150 160 170<br />
Girder Length (ft)<br />
(f c ' = 8, 10 and 12 ksi)<br />
Type IV (N) Type IV (L) Type V (N) Type V (L)<br />
BT-54 (N) BT-54 (L) BT-54M (N) BT-54M (L)<br />
BT-63 (N) BT-63 (L) BT-63M (N) BT-63M (L)<br />
BT-72 (N) BT-72 (L) BT-72M (N) BT-72M (L)<br />
Figure 2.3 Gross Vehicle Weight (GVW) vs. maximum girder length.<br />
Based on the parameters of this study, AASHTO Type IV and V sections are less<br />
efficient than similar height Bulb-Tee sections, both Standard and Modified. If the<br />
AASHTO Type IV and V sections are removed from the chart, there are noticeable trendlines<br />
<strong>for</strong> the remaining normal weight and lightweight Bulb-Tee girders.<br />
The primary conclusions from the analytic study are as follows: (1) Use of HPLC has the<br />
potential to increase the length of simple span AASHTO sections up to four percent and<br />
Bulb-Tee sections up to three percent; (2) <strong>for</strong> spans between 125-ft. (38.1 m) and 155-ft.<br />
(47.2 m), use of lightweight concrete can reduce the gross vehicle weight to less than 150-<br />
kips so that a superload permit is not required <strong>for</strong> transport of long span girders; and (3)<br />
Bulb-Tee (Standard or Modified) sections provide longer spans at less weight <strong>for</strong> girders<br />
over 105-ft. (32 m) in length when compared to AASHTO sections.<br />
2-5
Chapter 3. Mix Designs, Field Evaluation, and Short-term Properties<br />
3.1 Preliminary Laboratory Investigation<br />
The purpose of the preliminary laboratory study (Task 2) was to develop the most promising<br />
mixes to satisfy the 8,000 psi, 10,000 psi, and 12,000 psi strength requirements. Over 75<br />
preliminary mixes were batched, and over 700 4-in. diameter x 8-in. long (4x8) cylinders were<br />
tested. To develop the preliminary mixes, a base mix given in Table 4.1 was used initially and<br />
then modified.<br />
Table 3.1 Base Mix Components Provided by Carolina Stalite Company<br />
Material Quantity (lbs) Specific Gravity<br />
Sand 1221 2.63<br />
1/2” Stalite 950 1.52<br />
Cement 500 3.15<br />
Silica Fume 35 2.2<br />
Class “C” flyash 200 2.25<br />
Water 266.6 1<br />
Admixtures*<br />
air-entrainer Daravair 1000<br />
water-reducer WRDA 35<br />
------<br />
high range water reducer<br />
ADVA Flow<br />
Target Air Content 4 % ------<br />
*Admixtures dosed in accordance with manufacturer specification<br />
Mixes were varied by modifying one parameter at a time: maximum size aggregate, cement<br />
paste ratio, coarse-to-fine aggregate ratio, pozzolan contents, and water/cementitious materials<br />
ratio. Mixes were compared using concrete strength. All cylinders were first cured <strong>for</strong> 24 hours<br />
in an insulated box to mimic curing conditions in a precast girder. Thereafter, the cylinders were<br />
cured in a fog room at 70 o F until time of testing.<br />
To study aggregate size, 3 different size aggregates, 3/8-in., 1/2-in., and 3/4-in., were<br />
substituted into the base mix. Figure 3.1 shows the strength data <strong>for</strong> 1 day and 28 day strength<br />
tests. Further mixes using normal weight granite aggregate as a replacement <strong>for</strong> the lightweight<br />
aggregate showed that there was a strength ceiling of about 11,500 psi <strong>for</strong> HPLC.<br />
3-1
Compressive <strong>Strength</strong> (psi)<br />
11,500<br />
11,000<br />
10,500<br />
10,000<br />
9,500<br />
9,000<br />
8,500<br />
8,000<br />
3/8-in. 1/2-in. 3/4-in.<br />
0 5 10 15 20 25 30<br />
Time (days)<br />
Figure 3.1 <strong>Concrete</strong> <strong>Strength</strong> Compared <strong>for</strong> Different Size Aggregates<br />
Parameters like cement paste ratios were varied to give relations like that shown in Figure<br />
3.2 where the optimum cement paste ratio of 0.39 is selected.<br />
Compressive <strong>Strength</strong> (psi)<br />
10,600<br />
10,100<br />
9,600<br />
9,100<br />
8,600<br />
8,100<br />
7,600<br />
7,100<br />
6,600<br />
1 Day <strong>Strength</strong><br />
28 Day <strong>Strength</strong><br />
0.32 0.34 0.36 0.38 0.4<br />
Cement-Paste Ratio<br />
Figure 3.2 1 Day <strong>Strength</strong> and 28 Day <strong>Strength</strong> Results <strong>for</strong> 1/2-in. Aggregate at Varying Cement<br />
Paste Ratios<br />
3-2
Variation of coarse-to-fine aggregate ratio (Figure 3.3) and silica fume content (Figure 3.4) gave<br />
optimum results of 1.5 and 10% respectively.<br />
12,000<br />
Compressive <strong>Strength</strong> (psi)<br />
11,000<br />
10,000<br />
9,000<br />
8,000<br />
7,000<br />
1 Day <strong>Strength</strong><br />
6,000<br />
28 Day <strong>Strength</strong><br />
0.9 1.1 1.3 1.5 1.7 1.9<br />
Coarse-to-Fine Ratio<br />
Figure 3.3 1 Day <strong>Strength</strong> and 28 Day <strong>Strength</strong> Results <strong>for</strong> 1/2-in. Aggregate at Varying Coarseto-Fine<br />
Ratios<br />
11,000<br />
Compressive <strong>Strength</strong> (psi)<br />
10,500<br />
10,000<br />
9,500<br />
9,000<br />
8,500<br />
8,000<br />
1 Day <strong>Strength</strong><br />
28 Day <strong>Strength</strong><br />
2 4 6 8 10 12 14<br />
Silica Fume Percentage by Weight<br />
Figure 3.4 1 Day and 28 Day <strong>Strength</strong>s with Varying Silica Fume Contents<br />
3-3
Table 3.2 shows the mixes that were selected <strong>for</strong> further investigation based on the trends<br />
discovered in the preliminary mixing phase. It was believed that these mixes would per<strong>for</strong>m to<br />
meet strength requirements.<br />
The 1/2-in. Stalite aggregate was chosen over the 3/8-in. size aggregate <strong>for</strong> two reasons.<br />
First, the 1/2-in. size aggregate is $0.0276 / lb. while the 3/8-in. size aggregate is $0.03 / lb. In<br />
the example of mix A, the 1/2-in. size aggregate concrete has a cost savings advantage of $2.27<br />
per cubic yard over its 3/8-in. counterpart.<br />
Table 3.2 Designed Mixes <strong>for</strong> Property Testing<br />
Designed <strong>Lightweight</strong> Aggregate Mixes (SSD condition)<br />
Materials<br />
Mix A Mix B Mix C<br />
8,000 psi 10,000 psi 12,000 psi<br />
design mix design mix design mix<br />
BB concrete sand (lbs) 1,022 1,030 1,030<br />
1/2-in. aggregate (lbs) 947 955 955<br />
Class "F" flyash (lbs) 142 146 150<br />
Force 10000 silica fume (lbs) 19 49 100<br />
Type III cement (lbs) 783 765 740<br />
WRDA 35 (oz per 100 wt) 6 6 6<br />
ADVA Flow (oz per 100 wt) 6.06 6.71 13.8<br />
Daravair 1000 (oz per 100 wt) 1 1 1<br />
Water (lbs) 267.8 249.6 227.3<br />
water/cementitious ratio 0.284 0.26 0.23<br />
cement paste ratio 0.39 0.39 0.39<br />
coarse/fine ratio 1.5 1.5 1.5<br />
3.2 Laboratory Investigation – Short-term Properties<br />
Further laboratory investigation determined compressive strength, modulus of elasticity,<br />
modulus of rupture, coefficient of thermal expansion, and chloride permeability. For each data<br />
value listed, at least three cylinder or prism tests were per<strong>for</strong>med. Both accelerated curing<br />
(ACC) using the insulated box, and ASTM curing were conducted. The base mixes given in<br />
Table 3.2 were varied slightly to achieve improved workability and strength.<br />
3-4
3.2.1 Compressive <strong>Strength</strong><br />
Figure 3.5 illustrates the strength gain of ACC versus ASTM cured 4x8 cylinders. The<br />
6x12 cylinders were stronger than the 4x8 cylinders at ages of 16 hrs. and 1 day, while the 4x8<br />
cylinders were stronger at the 56 days of age. The 4x8 cylinders had an average compressive<br />
strength 4 % higher than the 6x12 cylinders. At 56 days, ASTM 4x8 cylinders were 5 % higher<br />
than the ASTM 6x12 cylinders, and the ACC 4x8 cylinders were 2 % higher than the ACC 6x12<br />
cylinders.<br />
12,000<br />
11,000<br />
Compressive <strong>Strength</strong> (psi)<br />
10,000<br />
9,000<br />
8,000<br />
7,000<br />
6,000<br />
Mix A accelerated cure<br />
Mix A ASTM cure<br />
Mix B accelerated cure<br />
Mix B ASTM cure<br />
Mix C accelerated cure<br />
Mix C ASTM cure<br />
0 10 20 30 40 50 60<br />
Time (days)<br />
Figure 3.5 Average Compressive <strong>Strength</strong>s <strong>for</strong> Mix A, Mix B, and Mix C<br />
3.2.2 Modulus of Elasticity & Modulus of Rupture<br />
Modulus of elasticity was measured using 6x12 inch cylinders, and the results are given<br />
in Table 3.3. Modulus of rupture tests used a 4x4x14-inch prism under four point bending, and<br />
the results are given in Table 3.4<br />
3-5
Table 3.3 Mean Modulus of Elasticity (psi) and Poisson Ratio Results <strong>for</strong> Mixes A, B, and C<br />
ACC<br />
ASTM<br />
Mix<br />
Time<br />
(days)<br />
16 hrs. 1 56 56<br />
A Elasticity 3,530,000 3,670,000 4,020,000 4,390,000<br />
A Poisson 0.1738 0.1869 0.1851 0.1942<br />
B Elasticity 4,080,000 4,330,000<br />
B Poisson 0.1817 0.1876<br />
C Elasticity 4,080,000 4,250,000 4,240,000 4,330,000<br />
C Poisson 0.1827 0.1881 0.1848 0.1895<br />
Test Age<br />
(days)<br />
Table 3.4 Modulus of Rupture Values (psi) <strong>for</strong> Mixes A, B, and C<br />
Mix A Mix B Mix C<br />
ACC ASTM ACC ASTM ACC ASTM<br />
1 649 761 670 678 645 678<br />
56 1,077 1,030 1,164 1,006 926 918<br />
3.2.3 Coefficient of Thermal Expansion<br />
The CTE was tested at 56 days of age. For Mix A, 8,000 psi mix, the CTE was 5.34 x 10 -<br />
6 / o F. For Mix C, 10,000 psi mix, the CTE was 5.28 x 10 -6 / o F. These values agreed with values<br />
in a paper by Daly (2000). In the paper, Daly lists CTE values <strong>for</strong> lightweight concrete ranging<br />
from 4.44 x 10 -6 / o F to 7.22 x 10 -6 / o F. Values <strong>for</strong> high-strength normal weight concrete ranged<br />
from 5.1 x 10 -6 / o F to 5.5 x 10 -6 / o F in a paper by Shams and Kahn (2000).<br />
3.2.4 Chloride Permeability<br />
Chloride permeability was determined using 4x8 cylinders, ASTM C 1202 (AASHTO<br />
T277). The results are shown in Table 3.5; they show that all mixes had a very low permeability.<br />
3-6
Table 3.5 Chloride Permeability -- Charge Passed Through Laboratory 56 Day ACC Specimens<br />
Mix<br />
Mix A<br />
Mix B<br />
Mix C<br />
Specimen<br />
Prooveit read<br />
charge passed <strong>for</strong><br />
4-in. specimen<br />
(coulombs)<br />
Corrected charge<br />
passed <strong>for</strong> 3.75-<br />
in. specimen<br />
(coulombs)<br />
Chloride<br />
Permeability<br />
determined by<br />
ASTM C 1202-97<br />
Table 1<br />
1 717 630 Very Low<br />
2 703 618 Very Low<br />
3 703 618 Very Low<br />
4 701 616 Very Low<br />
Mean 706 621 Very Low<br />
1 418 367 Very Low<br />
2 395 347 Very Low<br />
3 641 563 Very Low<br />
4 262 230 Very Low<br />
Mean 429 377 Very Low<br />
1 389 342 Very Low<br />
2 121 106 Very Low<br />
3 119 105 Very Low<br />
Mean 210 184 Very Low<br />
3.3 Field Investigation<br />
Field specimens were made on two separate occasions. In the first field mixing session,<br />
specimens were made from Mix A, Mix B, and Mix C in order to examine field batching and<br />
quality control procedures and to place all comparative cylinders and beams from a single batch.<br />
The specimens made <strong>for</strong> testing included 4x8 cylinders <strong>for</strong> compressive strength, 6x12 cylinders<br />
<strong>for</strong> modulus of elasticity, 4x4x14 prismatic beams <strong>for</strong> modulus of rupture, 4x8 cylinders <strong>for</strong><br />
chloride permeability, and 12-in. x 20-in. x 36-in. (HxWxL) blocks <strong>for</strong> cored-cylinder strength<br />
tests. In the second session of field mixing, section 6.3, Type II AASHTO girders were made<br />
(Task 5). The concrete property specimens included 4x8 cylinders, 6x12 cylinders, and 4x4x14<br />
prismatic beams, 4x8 cylinders <strong>for</strong> chloride permeability, and 4x15 cylinders <strong>for</strong> shrinkage,<br />
creep, and coefficient of thermal expansion.<br />
3-7
The girders and specimens in session 2 were made using Mix A and Mix C only.<br />
The following nomenclature is used to identify mixes:<br />
• For Session 1 field mixing, Mix A, Mix B, and Mix C are used exactly as they were in<br />
laboratory mixing.<br />
• For Session 2 field mixing, G1 refers to Mix A and G2 refers to Mix C. These numbers<br />
will be followed by a "1" or "2" indicating the type of beam that was poured on the day<br />
the specimens were made. The number "1" corresponds to the 39 ft. girders, and the<br />
number "2" corresponds to the 43 ft. girders. For example, a designation of G2-1 refers<br />
to the Session 2 field Mix C specimens made in conjunction with the 39 ft. girders. A<br />
designation of G1-2 refers to the Session 2 field Mix A specimens made in conjunction<br />
with the 43 ft. girders.<br />
• The curing designation of "ACC" and "ASTM" are used again to specify curing.<br />
3.3.1 Compressive <strong>Strength</strong><br />
Figure 3.6 shows that in all cases the field mixes gave higher strengths than the<br />
laboratory mixes. It was concluded that the larger mixer provided more energy and better<br />
mixing than the laboratory mixer. Table 3.6 shows that the statistical study per<strong>for</strong>med using 30<br />
4x8 and 30 6x12 cylinders indicates that the G2 met the strength requirements <strong>for</strong> a specified<br />
10,000 psi by 1 % of the required average strength. The statistical study per<strong>for</strong>med on the 6x12<br />
cylinders indicated that the average compressive strength of the 6x12 cylinders was below the<br />
required average compressive strength by 2 %. In addition the 4x8 cylinders turned out to have a<br />
2 % higher average compressive strength than the 6x12 cylinders.<br />
Table 3.6 Requirements (psi) <strong>for</strong> G2 Mix Based on Statistical Study<br />
4X8<br />
6X12<br />
Mix Mean Req'd Mean<br />
Standard<br />
Standard<br />
Mean Req'd Mean<br />
Deviation<br />
Deviation<br />
G2 10,628 10,533 443 10,462 10,635 474<br />
3-8
12,000<br />
11,500<br />
11,000<br />
Compressive <strong>Strength</strong> (psi<br />
10,500<br />
10,000<br />
9,500<br />
9,000<br />
8,500<br />
8,000<br />
7,500<br />
7,000<br />
Mix A Field<br />
Mix A Laboratory<br />
Mix B Field<br />
Mix B Laboratory<br />
Mix C Field<br />
Mix C Laboratory<br />
0 10 20 30 40 50 60<br />
Time (days)<br />
Figure 3.6 Average <strong>Strength</strong> <strong>for</strong> Mix A, Mix B, and Mix C ACC 4x8 Cylinders <strong>for</strong> Field Mixing<br />
and Laboratory Mixing<br />
3.3.2 Modulus of Elasticity<br />
The 16 additional modulus of elasticity 6x12 inch cylinders provided improved data <strong>for</strong><br />
developing a better relation <strong>for</strong> predicting E of expanded slate HPLC as given below.<br />
0.9<br />
E c = ((33,000 f ' − 9000)( w /100) + 100,000)(117.75/ w )<br />
That proposed equation is shown in Figure 3.7.<br />
c<br />
c<br />
c<br />
3-9
4.40E+06<br />
4.20E+06<br />
4.00E+06<br />
Elastic Modulus (psi)<br />
3.80E+06<br />
3.60E+06<br />
3.40E+06<br />
3.20E+06<br />
3.00E+06<br />
Experimental<br />
Linear (Morales)<br />
Linear (ACI)<br />
Linear (Meyer and Kahn)<br />
Linear (Proposed)<br />
Linear (Best Fit)<br />
6,000 6,500 7,000 7,500 8,000 8,500 9,000 9,500 10,000 10,500 11,000<br />
Compressive <strong>Strength</strong> (psi)<br />
Figure 3.7 Predicted Modulus Equation Comparison <strong>for</strong> 8 ksi Mixes <strong>for</strong> Laboratory, Session 1<br />
and Session 2 Mixes (Mix A and G1) Based on Compressive <strong>Strength</strong><br />
3.3.3 Modulus of Rupture<br />
The modulus of rupture of laboratory and field specimens were compared to standard relations in<br />
Figure 3.8. Figure 3.8 indicates that a coefficient of 12 should be used based on a "best fit"<br />
analysis. Using λ = 0.85, the equation<br />
f<br />
r<br />
= .5λ<br />
f ' ,<br />
6<br />
c<br />
provides conservative rupture modulus values in 95 percent of the rupture modulus tests.<br />
3-10
1,400<br />
1,300<br />
1,200<br />
1,100<br />
Experimental<br />
Linear (ACI, 7.5*SQRT(fc')*lambda, lambda = 0.85)<br />
Linear (6.5*SQRT(fc')*lambda, lambda = 0.85)<br />
Linear (7.5*Sqrt(fc')*lambda, lambda = 0.75)<br />
Linear (10*sqrt(fc')*lambda, lambda = 0.85)<br />
Linear (Best Fit)<br />
Modulus Rupture (psi)<br />
1,000<br />
900<br />
800<br />
700<br />
600<br />
500<br />
400<br />
6,000 7,000 8,000 9,000 10,000 11,000 12,000<br />
Cylinder <strong>Strength</strong> (psi)<br />
Figure 3.8 Predicted Rupture Modulus Equation Comparison <strong>for</strong> All Mixes (Mix A, Mix B, Mix<br />
C, G1, and G2) <strong>for</strong> Laboratory, Session 1 and Session 2 Mixes Based on Compressive <strong>Strength</strong><br />
3.3.4 Field Investigation Conclusion<br />
The field investigation showed that HPCL with both 8,000 psi and 10,000 psi design<br />
strengths could be produced at precast concrete plants. The field mixes exceeded the strengths of<br />
laboratory mixes.<br />
It was further concluded that a design strength mix of 12,000 psi could not be produced.<br />
A maximum strength of about 11,600 psi was found.<br />
3-11
Chapter 4. Creep and Shrinkage of <strong>High</strong> Per<strong>for</strong>mance <strong>Lightweight</strong> <strong>Concrete</strong><br />
4.1 Introduction<br />
Laboratory and field mixes of an 8,000 psi and a 10,000 psi design strengths were<br />
subjected to creep and shrinkage over a period of 620 days. This chapter discusses those tests<br />
and compares the findings to analytical predictions. A description of creep and its factors is<br />
presented in Appendix B.<br />
Creep is typically reduced in HPC, but creep is typically greater in lightweight concrete.<br />
These competing effects make creep in HPLC difficult to predict. Moreover, some observations<br />
and recommendations presented in the literature are not consistent. For instance, Berra and<br />
Ferrada (1990) concluded that specific creep in HPLC is twice that of normal weight concrete of<br />
the same strength. On the other hand, Malhotra (1990) gave values of creep of fly ash HPLC in<br />
the range 460 to 510 µε. These values are fairly close to those obtained by Penttala and<br />
Rautamen (1990) <strong>for</strong> HPC, and they are significantly lower than the values between 878 and<br />
1,026 µε reported <strong>for</strong> HPC by Huo et al. (2001).<br />
As occurs with creep of HPLC, there are only a few articles regarding shrinkage of<br />
HPLC. Also, the authors usually do not report autogenous and drying shrinkage separately, but<br />
as overall shrinkage. Berra and Ferrada (1990) found that compared with HPC, HPLC had a<br />
lower shrinkage rate, but a higher ultimate value. According the authors, the lower rate was<br />
caused by the presence of water in the aggregate which delays drying. Holm and Bremner<br />
(1994) also observed that the HSLC mix lagged behind at early ages, but one-year shrinkage was<br />
approximately 14% higher than the HPC counterpart. Holm and Bremner (1994) measured a<br />
higher shrinkage when they incorporated fly ash to the high strength lightweight concrete mix.<br />
Malhotra’s (1990) results, on the other hand, showed that fly ash particles in the HPLC helped to<br />
reduce shrinkage after one year. Other authors also concluded the beneficial effect, less drying<br />
shrinkage when using saturated lightweight aggregate.<br />
4.2 Experimental Program and Results<br />
Two HPLC mixes were suggested at the end of Task 2: (1) 8,000-psi compressive<br />
strength (8L made in the laboratory and 8F made in the field); and (2) 10,000-psi compressive<br />
4-1
strength (10L made in the laboratory and 10F made in the field). The mix proportions are<br />
presented in Table 4.1.<br />
Table 4.1. Actual mixes used in the laboratory specimens (8L and 10L) and used to cast the<br />
girders tested in Task 5 (8F and 10F)<br />
Component Type 8L 8F 10L 10F<br />
cement, Type III (lb/yd 3 ) 783 780 740 737<br />
Fly ash, class F (lb/yd 3 ) 142 141 150 149<br />
Silica Fume, (lb/yd 3 ) 19 19 100 100<br />
Natural sand (lb/yd 3 ) 1022 1018 1030 1025<br />
3/8" <strong>Lightweight</strong> aggregate (lb/yd 3 ) 947 944 955 956<br />
Water (lb/yd 3 ) 268 284 227 260<br />
AEA, Daravair 1000 (fl oz/yd 3 ) 7.8 7.8 7.4 5.5<br />
Water reducer, WRDA 35 (fl oz/yd 3 ) 47 46.8 44.4 44.2<br />
HRWR, Adva 100 (fl oz/yd 3 ) 47.5 53.4 102 95.8<br />
Specimens used <strong>for</strong> testing mechanical properties were cured in two different ways:<br />
ASTM C-39 (fog room and 73 o F) and accelerated curing that simulates the condition within a<br />
precast prestressed member. Compressive strength <strong>for</strong> laboratory mixes was measured using 4 x<br />
8-in. cylinders at 16, 20 and 24 hours, and then at, 7, 28, and 56 days. For field mixes strength<br />
was measured at 1, 7, 28, 56, and more than 100 days after casting. The average compressive<br />
strength of 8,000-psi and 10,000-psi HPLC (including laboratory and field mixes) is presented in<br />
Figure 4.1. All creep and shrinkage specimens were accelerated cured.<br />
Eight creep specimens were cast from each laboratory mix (8L and 10L) and four<br />
specimens from each field mix. They were loaded at different ages (16 and 24 hours) and at<br />
different stress-to-initial strength ratios (0.4 to 0.6). All creep and shrinkage cylinders were 4x15<br />
inches. Specimens were kept at a constant 50% relative humidity and at 70 o F. There was no<br />
statistical difference in creep results between field and laboratory mixes <strong>for</strong> both the 8,000 psi<br />
and 10,000 psi mixes. Specific creep is the creep strain divided by the applied stress, while creep<br />
coefficient is the creep strain divided by the initial elastic strain which is proportional to applied<br />
stress.<br />
It was also found that there was no significant difference between the creep coefficient<br />
and specific creep <strong>for</strong> specimens loaded at 16 hours and at 24 hours and that the stress level<br />
made no significant difference. There<strong>for</strong>e, all results are combined in Figure 4.2.<br />
4-2
12000<br />
Compressive <strong>Strength</strong> (psi)<br />
10000<br />
8000<br />
6000<br />
4000<br />
2000<br />
8,000-psi Accelerated Cure<br />
8,000-psi ASTM Cure<br />
10,000-psi Accelerated Cure<br />
10,000-psi ASTM Cure<br />
0<br />
0 14 28 42 56 70 84 98 112 126 140 154<br />
Age (days)<br />
Figure 4.1. Compressive strength vs. time of 8,000-psi and 10,000-psi HPLC creep and<br />
shrinkage mixes <strong>for</strong> accelerated and ASTM curing methods.<br />
1.8<br />
1.6<br />
Creep Coefficient<br />
1.4<br />
1.2<br />
1.0<br />
0.8<br />
0.6<br />
8,000-psi HPLC<br />
10,000-psi HPLC<br />
0.4<br />
0.2<br />
0.0<br />
0.01<br />
0.10 1.00 10.0 100 1000<br />
Time (days)<br />
Figure 4.2. Average creep coefficient of 8,000-psi and 10,000-psi HPLC in logarithmic time<br />
scale.<br />
4-3
The 50% and 90% of the 620-day creep coefficient were reached after 16 and 250 days<br />
regardless the type of HPLC.<br />
Figure 4.3 presents the average shrinkage obtained from 8,000-psi and 10,000-psi mixes<br />
in logarithmic time scale. The 620-day shrinkage was 818 and 610 µε <strong>for</strong> 8,000-psi and 10,000-<br />
psi HPLC, respectively. At very early ages (less than one day), shrinkage of the 10,000-psi mix<br />
was considerably greater than that of the 8,000-psi mix. After one day, the shrinkage rate of the<br />
10,000-psi mix slowed down, and measured shrinkage was much lower than <strong>for</strong> the 8,000-psi<br />
HPLC. The 50% and 90% of the 620-day shrinkage was reached after 27 and 170 days <strong>for</strong> 8,000-<br />
psi HPLC and after 55 and 170 days <strong>for</strong> 10,000-psi mix.<br />
800<br />
Shrinkage (µε)<br />
700<br />
600<br />
500<br />
400<br />
300<br />
8,000-psi HPLC<br />
10,000-psi HPLC<br />
FHWA HPC Grade 2 Upper Limit<br />
FHWA HPC Grade 3 Upper Limit<br />
200<br />
100<br />
0<br />
0.01 0.10 1.00 10.0 100 1000<br />
Time (days)<br />
Figure 4.3. Average shrinkage of 8,000-psi and 10,000-psi HPLC in logarithmic time scale.<br />
4.3 Creep and Shrinkage Test Results vs. Model Estimates<br />
The best shrinkage estimate was given by AASHTO-LRFD and Shams and Kahn’s<br />
model, <strong>for</strong> 8,000-psi and 10,000-psi HPLC, respectively. Those models underestimated<br />
shrinkage by only 5% and 4%, respectively. Creep coefficient of 8,000-psi HPLC was best<br />
predicted by AASHTO-LRFD model <strong>for</strong> normal strength concrete with an underestimate of 8%<br />
4-4
while creep coefficient of 10,000-psi HPLC <strong>for</strong> was best predicted by Shams and Kahn <strong>for</strong> high<br />
per<strong>for</strong>mance concrete with 6% overestimate. The AASHTO-LRFD and Shams and Kahn’s<br />
models were used to estimate the 8,000-psi and 10,000-psi ultimate strains, by modifying each<br />
model to yield the same shrinkage and creep coefficient as those measured. The AASHTO-<br />
LRFD model was developed <strong>for</strong> normal strength concrete and was applicable <strong>for</strong> the 8,000 psi<br />
design strength. The Shams and Kahn’s model was developed <strong>for</strong> high strength/high<br />
per<strong>for</strong>mance normal strength concrete and was applied to the 10,000 psi design strength mixes.<br />
700<br />
600<br />
8,000-psi Measured<br />
Shams<br />
&Kahn<br />
AASHTO<br />
LRFD<br />
ACI-209<br />
Gardner<br />
Lockman<br />
500<br />
Sakata 2001<br />
AFREM<br />
Shrinkage (µε)<br />
400<br />
300<br />
200<br />
Bažant<br />
Panula<br />
Bažant<br />
Baweja<br />
CEB-FIP<br />
100<br />
Sakata 93<br />
0<br />
0.01 0.10 1.00 10.0 100 1000 10000<br />
Time under Drying (days)<br />
Figure 4.4a. Comparison between measured shrinkage of 8,000 psi HPLC and estimated from<br />
models <strong>for</strong> normal and high strength concrete.<br />
4-5
700<br />
600<br />
10,000-psi Measured<br />
Shams<br />
&Kahn<br />
AASHTO<br />
LRFD<br />
ACI-209<br />
Gardner<br />
Lockman<br />
500<br />
Sakata 2001<br />
Bažant<br />
Baweja<br />
Shrinkage (µε)<br />
400<br />
300<br />
AFREM<br />
200<br />
100<br />
Bažant<br />
Panula<br />
Sakata 93<br />
CEB-FIP<br />
0<br />
0.01 0.10 1.00 10.0 100 1000 10000<br />
Time under Drying (days)<br />
Figure 4.4b. Comparison between measured shrinkage of 10,000 psi HPLC and estimated from<br />
models <strong>for</strong> normal and high strength concrete.<br />
Based on the modified relationships, the ultimate shrinkage would be 795 and 625 µε <strong>for</strong> 8,000-<br />
psi and 10,000-psi HPLC, respectively. In addition, the ultimate creep coefficient would be<br />
1.925 and 1.431 <strong>for</strong> 8,000-psi and 10,000-psi HPLC, respectively.<br />
Figure 4.4 shows the various models <strong>for</strong> predicting shrinkage, while Figures 4.5 and 4.6<br />
show the creep models <strong>for</strong> normal strength concrete and <strong>for</strong> high strength concrete, respectively.<br />
The models are presented in Appendix B.<br />
4-6
a<br />
3.0<br />
2.5<br />
Gardner<br />
Lockman<br />
Bažant<br />
Baweja<br />
CEB-FIP<br />
Sakata 93<br />
ACI-209<br />
Creep Coefficient<br />
2.0<br />
1.5<br />
1.0<br />
Bažant<br />
Panula<br />
AASHTO<br />
LRFD<br />
0.5<br />
8,000-psi Measured<br />
b<br />
0.0<br />
0.01 0.10 1.00 10.0 100 1000 10000<br />
Time under Load (days)<br />
Bažant<br />
3.0<br />
Gardner<br />
Baweja<br />
Lockman<br />
CEB-FIP<br />
2.5<br />
Sakata 93<br />
ACI-209<br />
Creep Coefficient<br />
2.0<br />
1.5<br />
1.0<br />
Bažant<br />
Panula<br />
AASHTO<br />
LRFD<br />
0.5<br />
10,000-psi Measured<br />
0.0<br />
0.01 0.10 1.00 10.0 100 1000 10000<br />
Time under Load (days)<br />
Figure 4.5. Comparison between measured creep coefficient and estimated from models <strong>for</strong><br />
normal strength concrete: (a) 8,000-psi HPLC, (b) 10,000-psi HPLC.<br />
4-7
a<br />
Creep Coefficient<br />
3.0<br />
2.5<br />
2.0<br />
1.5<br />
1.0<br />
0.5<br />
8,000-psi Measured<br />
BP<br />
MOD-HSC<br />
CEB-FIP<br />
MOD-HSC<br />
Sakata<br />
2001<br />
Shams &<br />
Kahn<br />
AFREM<br />
0.0<br />
0.01 0.10 1.00 10.0 100 1000 10000<br />
Time under Load (days)<br />
b<br />
3.0<br />
10,000-psi Measured<br />
Creep Coefficient<br />
2.5<br />
2.0<br />
1.5<br />
1.0<br />
0.5<br />
0.0<br />
BP<br />
CEB-FIP<br />
MOD-HSC<br />
MOD-HSC<br />
Shams &<br />
Kahn<br />
Sakata<br />
2001<br />
AFREM<br />
0.01 0.10 1.00 10.0 100 1000 10000<br />
Time under Load (days)<br />
Figure 4.6. Comparison between measured creep coefficient and estimated from models <strong>for</strong> high<br />
strength concrete: (a) 8,000-psi HPLC, (b) 10,000-psi HPLC.<br />
4-8
The two models that better estimate creep of HPLC, utilized the maturity of concrete at<br />
loading rather than age. Age of loading is an important factor in determining creep. For precast<br />
prestressed concrete members, the age of application of load can be as low as 16 hours, so creep<br />
becomes very dependant of concrete mechanical properties at the moment of loading. HPC<br />
usually includes high contents of cementitious materials which generate a high heat of hydration.<br />
This heat of hydration is responsible <strong>for</strong> raising concrete temperature to levels as high as 145 o F;<br />
this heat accelerates the hydration process. This self feeding reaction increases concrete<br />
mechanical properties above the expected values. Hence, maturity leads to more accurate<br />
estimate of concrete per<strong>for</strong>mance. The Shams and Kahn and AASHTO-LRFD models were able<br />
to better estimate creep because 8,000-psi and 10,000-psi HPLC had a maturity at 24 hours<br />
equivalent to 147 and 158 hours (6.1 and 6.6 days).<br />
The AASHTO-LRFD model gave the best shrinkage estimate <strong>for</strong> the 8.000 psi HPLC<br />
while the Shams and Kahn’s gave the best shrinkage estimate <strong>for</strong> the 10,000 psi HPLC.<br />
4.4 Conclusions Regarding Creep and Shrinkage<br />
HPLC (10,000-psi HPLC) had a specific creep similar to that of an HPC of the same<br />
grade, but with less cement paste content, and it had significantly less creep than an HPC of the<br />
same grade and similar cement paste content. The shrinkage of the HPLC was about 20%<br />
greater than the HPC after 620 days. There<strong>for</strong>e, the HPLC had less creep yet somewhat more<br />
shrinkage than comparable HPC.<br />
Altogether, the creep of HPLC is much less than that of normal weight, normal strength<br />
concrete, and the shrinkage of HPLC is somewhat less than that of normal weight, normal<br />
strength concrete.<br />
4-9
Chapter 5. Behavior of AASHTO Type II HPLC Girders<br />
5.1 Introduction<br />
The following objectives were established to serve as guidelines to prioritize and focus<br />
the experimental design and procedure.<br />
1. To determine the transfer length, l t , <strong>for</strong> 0.6-inch diameter prestressing strand used with<br />
slate HPLC.<br />
2. To determine the development length, l d , <strong>for</strong> 0.6-inch diameter prestressing strand used<br />
with slate HPLC.<br />
3. To verify current code equations <strong>for</strong> l t and l d as appropriate <strong>for</strong> use with slate HPLC and<br />
suggest better equations if necessary.<br />
4. To determine the effect of shear rein<strong>for</strong>cement spacing on strand slip, development<br />
length, and shear capacity of pretensioned slate HPLC girders.<br />
5. To determine the shear strength, V c , of prestressed slate HPLC.<br />
6. To verify current code equations <strong>for</strong> shear strength of slate HPLC.<br />
7. To verify the current code-specified reduction factor, λ, <strong>for</strong> slate lightweight concrete as<br />
related to concrete tensile strength, and, suggest a more appropriate factor if necessary.<br />
In order to achieve the seven experimental objectives, the following variables were<br />
altered in order to observe the results.<br />
<strong>Concrete</strong> Compressive <strong>Strength</strong>, f c ’. <strong>Concrete</strong> design strengths of 8,000 and 10,000 psi were<br />
used <strong>for</strong> girder construction – Mixes 8F (termed G1) and 10F (termed G2) from Chapter 4.<br />
Shear Span to Depth Ratio, a/d. The “a” distance was varied from approximately 63 to 100<br />
percent of the current code-specified l d value.<br />
Yield <strong>Strength</strong> of Shear Rein<strong>for</strong>cement Steel, f y . Only Grade 60 # 4 bar stirrups were used.<br />
Values of f y of 60 ksi (414 MPa) and the actual f y value were used to determine whether an upper<br />
limit was appropriate <strong>for</strong> use with HPLC.<br />
Spacing of Shear Rein<strong>for</strong>cement Steel, “s.” The “s” distance was varied to determine the<br />
impact of A v /s (stirrup area-to-spacing ratios)on l d , strand slip, and shear strength.<br />
Span Length of Tested Section, L 1 . In order to achieve three tests per girder, the span length<br />
was varied to focus on specific sections of the girder <strong>for</strong> each test.<br />
5-1
5.2 Girder Design<br />
Three each Series G1 girders and three each Series G2 girders were designed with<br />
concrete design strengths, f c ’, of 8,000 psi and 10,000 psi, respectively. Based on previous<br />
experiences, it was assumed the girder lengths would be in the range of 35-45 feet. Final design<br />
lengths were revised to accommodate the tests as needed. Three tests were planned <strong>for</strong> each of<br />
the six girders indicating 18 total tests. Since two concrete strengths were being investigated,<br />
there were 9 different test configurations that were per<strong>for</strong>med on each series of girders. The<br />
prestressed girder design spreadsheet was used to iteratively design the tests to fit on the girders.<br />
The resulting tests were detailed in Table 5.1. The a/d ratio listed under “Point Load Placement<br />
Criteria” is the shear span to depth ratio where “d” is the total height of the composite girder.<br />
Test<br />
Configuration<br />
Stirrup<br />
Density<br />
Table 5.1 – Girder Test Configurations<br />
Point Load<br />
Placement<br />
Criteria<br />
Shear<br />
Span<br />
“a”<br />
(inches)<br />
Distance<br />
“L 1 ”<br />
Distance<br />
“L 2 ”<br />
Distance<br />
“L”<br />
(inches) (inches) (inches)<br />
1 Single l d 90 456 0 456<br />
2 Double 0.70*l d 61 316 0 456<br />
3 Double 0.85*l d 75 456 0 456<br />
4 Single 0.95*l d 85 504 0 504<br />
5 Single 0.70*l d 61 321 0 456<br />
6 Single 0.85*l d 75 369 0 504<br />
7 Minimum a/d=2.28 82 185 140 456<br />
8 Minimum a/d=2.67 96 210 135 456<br />
9 Minimum a/d=3.33 120 244 135 504<br />
d = 47.5 inches<br />
The dimension “a” was the shear span. The dimension L 1 was the distance from the left<br />
support to the right support. The dimension L 2 was the distance from the left COB (cent of<br />
bearing) to the left support. The COB was the point at a distance of 6 inches in from each girderend<br />
that was assumed to be the girder’s support point <strong>for</strong> curing. L 2 was used to signify a<br />
cantilever on the left girder-end. The dimension L was the distance from the left COB to the<br />
right COB. The dimensions “a,” L 1 , L 2 and L are shown in Figure 5.1.<br />
Figures 5.2 through 5.4 show the final designs of the six girders.<br />
5-2
Portion of Girder Damaged During Test # 1<br />
Test # 1 on Composite Girder<br />
Portion of Girder Damaged During Test # 2<br />
Test # 2 on Composite Girder<br />
a<br />
Center<br />
Of<br />
Bearing<br />
Center<br />
Of<br />
Bearing<br />
6 in.<br />
L 2<br />
L 1<br />
L<br />
6 in.<br />
Test # 3 on Composite Girder<br />
Figure 5.1 Concept of Girder Testing Sequence<br />
5-3
2” End Cover (Typ both ends)<br />
4 Spaces @ 2” (Typ both ends)<br />
5 each # 3 “doghouse” bars spaced at 12” (Typ both ends)<br />
18’ – 9”<br />
33 spaces<br />
(7” max spacing)<br />
8’ – 0”<br />
4 spaces<br />
(24” max spacing)<br />
10’ – 7”<br />
37 spaces<br />
(3-1/2” max spacing)<br />
5-4<br />
Figure 5.2 Girder Layout A<br />
Stirrup Detail<br />
7”<br />
# 4<br />
43-3/4”<br />
39’ – 0”<br />
AASHTO Type II<br />
f c ' = 8,000 psi (10,000 psi) (75% of f c ’ at Release)<br />
Strand = 0.6” 270 ksi LOLAX pulled to 75% of f pu<br />
Strand Spacing = 2”<br />
Distance From Bottom to 1 st Row of Strands = 3.0”<br />
Distance From Bottom to TOP Row of Strands = 33.5”<br />
Stirrup (# 4 Bars) Spacing Shown Above<br />
Total Stirrups = 186 (2 at each location)<br />
Total Doghouse Bars = 10<br />
Beam top surface to be intentionally roughened (raked)<br />
8-1/2”<br />
5-4
2” End Cover (Typ both ends)<br />
4 Spaces @ 2” (Typ both ends)<br />
5 each # 3 “doghouse” bars spaced at 12” (Typ both ends)<br />
10’ – 11”<br />
38 spaces<br />
(3.5 ” max spacing)<br />
9’ – 6”<br />
17 spaces<br />
(7” max spacing)<br />
8’ – 0”<br />
4 spaces<br />
(24” max spacing)<br />
(24” max<br />
8’ – 11”<br />
16 spaces<br />
(7” max spacing)<br />
5-5<br />
Figure 5.3 Girder Layout B<br />
Stirrup Detail<br />
# 4<br />
7”<br />
43-3/4”<br />
39’ – 0”<br />
AASHTO Type II<br />
f c ' = 8,000 psi (10,000 psi) (75% of f c ’ at Release)<br />
Strand = 0.6” 270 ksi LOLAX pulled to 75% of f pu<br />
Strand Spacing = 2”<br />
Distance From Bottom to 1 st Row of Strands = 3.0”<br />
Distance From Bottom to TOP Row of Strands = 33.5”<br />
Stirrup (# 4 Bars) Spacing Shown Above<br />
Total Stirrups = 186 (2 at each location)<br />
Total Doghouse Bars = 10<br />
Beam top surface to be intentionally roughened (raked)<br />
8-1/2”<br />
5-5
2” End Cover (Typ both ends)<br />
4 Spaces @ 2” (Typ both ends)<br />
5 each # 3 “doghouse” bars spaced at 12” (Typ both ends)<br />
21’ – 3”<br />
37 spaces<br />
(7” max spacing)<br />
10’ – 0”<br />
5 spaces<br />
(24” max spacing)<br />
10’ – 1”<br />
18 spaces<br />
(7” max spacing)<br />
5-6<br />
Figure 5.4 Girder Layout C<br />
Stirrup Detail<br />
7<br />
# 4<br />
43-3/4”<br />
43’ –<br />
AASHTO Type II<br />
f c ' = 8,000 psi (10,000 psi) (75% of f c ’ at Release)<br />
Strand = 0.6” 270 ksi LOLAX pulled to 75% of f pu<br />
Strand Spacing = 2”<br />
Distance From Bottom to 1 st Row of Strands = 3.0”<br />
Distance From Bottom to TOP Row of Strands = 33.5”<br />
Stirrup (# 4 Bars) Spacing Shown Above<br />
Total Stirrups = 138 (2 at each location)<br />
Total Doghouse Bars = 10<br />
Beam top surface to be intentionally roughened (raked)<br />
8-1/2”<br />
5-6
5.3 Instrumentation<br />
The surface of each girder was instrumented with DEMEC gage points located at 2-in. on<br />
centers <strong>for</strong> a distance of 48-inches at each end and on each side. Further, a 24-in length of DEMEC<br />
points was located at the midspan. The points were at the levels of both the top and bottom layer of<br />
prestressing strands.<br />
Vibrating wire strain gages (VWSG) with 6-in gage length were installed at midspan<br />
at the level of the bottom strands (Figure 5.5). Type K thermocouples were placed adjacent to the<br />
VWSG. Deflection at midspan was measured using a piano wire stretched between a mounting post<br />
at one end and a pulley at the other as shown in Figure 5.6. A 10-pound weight was attached to the<br />
wire to keep it taut. At midspan, a metal ruler and mirror were affixed to the girder with epoxy. The<br />
ruler enabled deflection measurement, and the mirror prevented error due to parallax.<br />
Figure 5.5 VWSG and Thermocouple Prior to <strong>Concrete</strong> Placement<br />
5-7
Figure 5.6 Use of Taut Wire <strong>for</strong> Deflection Measurement at Midspan<br />
The <strong>for</strong>ce in each prestressing strand was measured using load cells on each strand at the<br />
anchor.<br />
5.4 Girder Construction<br />
The six girders were constructed at Tindall Corporation precast plant in Jonesboro, Georgia<br />
using plant personnel and standard precast plant procedures. The authors together with Georgia Tech<br />
students installed and measured all instrumentation and fabricated all material test specimens. The<br />
girders were constructed in three identical sequences. During each sequence, two girders were<br />
constructed. During the first sequence, girders G1A and G1B were constructed. During the second<br />
sequence, girders G2A and G2B were constructed. During the third and final sequence, girders G1C<br />
and G2C were constructed.<br />
Prestressing strands 0.6-in diameter were stressed; non-prestressed rein<strong>for</strong>cement was placed<br />
(Figure 5.7), <strong>for</strong>ms were erected, and the HPLC was batched and then placed using Tuckerbilt transit<br />
trucks. The mixes used are shown in Table 5.2.<br />
5-8
Figure 5.7 Installation of stirrups near girder end<br />
Table 5.2 Mix Designs <strong>for</strong> Girder Placements (2 cubic yard mix)<br />
Girder # G1A, G1B G2A, G2B G1C G2C<br />
Date of Placement 9 July 01 12 July 01 17 July 17 July 01<br />
<strong>Lightweight</strong> Aggregate (lbs) 1977 1958 1947 1995<br />
Normal Weight Sand (lbs) 2195 2173 2155 2165<br />
Class F Fly Ash (lbs) 284 300 284 300<br />
Silica Fume (lbs) 38 200 38 200<br />
Type III Portland Cement (lbs) 1570 1480 1570 1480<br />
WRDA 35 (LRWR) (fl oz) 114 119 114 119<br />
Daravair 1000 (AEA) (fl oz) 24 20 24 20<br />
ADVA Flow (HRWR) (fl oz) 95 258 95 258<br />
Water (gal) 39.5 36.7 44.8 33.1<br />
The girders were moved from the Tindall plant to the Structural Engineering Laboratory at<br />
Georgia Tech about 4 weeks after construction. Two weeks thereafter, a composite deck slab was<br />
cast atop each girder using a nominal 3,500 psi bridge deck concrete mix. The <strong>for</strong>mwork of the deck<br />
is shown in Figure 5.8.<br />
5-9
Figure 5.8 Formwork in Place with Temperature and Shrinkage Steel Installed <strong>for</strong> Deck Placement<br />
5.5 Material Properties<br />
Girder concrete properties are given in Table 5.3 below. <strong>Strength</strong> and modulus values are<br />
averages of 12 cylinder tests. Deck concrete had a strengths at the time of testing as given in Table<br />
5.4. The stress strain curves <strong>for</strong> rein<strong>for</strong>cing bars are shown in Figure 5.9. The 0.6-inch diameter<br />
low relaxation prestressing strand had a cross sectional area of 0.2183 in 2 , a yield stress of 259.6 ksi<br />
at 0.01 strain, a modulus of elasticity of 29,000 ksi, an ultimate stress of 283.2 ksi at an ultimate<br />
strain of 0.065 in/in.<br />
5-10
Table 5.3 Girder concrete properties<br />
Test<br />
#<br />
G1A-E<br />
G1A-W<br />
G1A-C<br />
G1B-E<br />
G1B-W<br />
G1B-C<br />
Range<br />
G1C-E<br />
G1C-W<br />
G1C-C<br />
Range<br />
G2A-E<br />
G2A-W<br />
G2A-C<br />
G2B-E<br />
G2B-W<br />
G2B-C<br />
Range<br />
G2C-E<br />
G2C-W<br />
G2C-C<br />
Range<br />
f ci '<br />
24-hour<br />
Curebox<br />
(psi)<br />
f c '<br />
56-day<br />
Curebox<br />
&<br />
ASTM<br />
(psi)<br />
f c '<br />
Time of<br />
Test<br />
Curebox<br />
&<br />
ASTM<br />
(psi)<br />
E ci<br />
24-hour<br />
Curebox<br />
(psi)<br />
E c<br />
56-day<br />
Curebox &<br />
ASTM<br />
(psi)<br />
E c<br />
Time<br />
of Test<br />
Estimated<br />
(psi)<br />
f r<br />
56-day<br />
Curebox<br />
& ASTM<br />
(psi)<br />
7,465 8,417 9,580 3.47E+06 3.57E+06 3.72E+06 1,010<br />
6,753-<br />
8,689<br />
7,750-<br />
9,084<br />
8,702-<br />
10,640<br />
3.39E+06 -<br />
3.52E+06<br />
3.25E+06<br />
-3.90E+06<br />
NA 861-<br />
1,101<br />
6,315 ** 8,911 3.00E+06 ** 3.69E+06 796<br />
5,444-<br />
7,666 **<br />
8,001-<br />
9,450<br />
2.98E+06-<br />
3.03E+06 **<br />
NA<br />
729-908<br />
9,640 10,334 10,975 3.55E+06 4.02E+06 3.88E+06 1,204<br />
8,459-<br />
10,307<br />
10,250-<br />
10,420<br />
10,499-<br />
11,455<br />
3.11E+06-<br />
3.79E+06<br />
3.87E+06-<br />
4.18E+06<br />
NA 1,024-<br />
1,352<br />
8,261 ** 10,523 3.91E+06 ** 4.08E+06 905<br />
7,737-<br />
8,738 **<br />
9,900-<br />
11,485<br />
3.87E+06-<br />
3.96E+06 **<br />
NA 744-<br />
1,086<br />
** Not measured<br />
5-11
Table 5.4 Deck concrete properties at time of testing<br />
Test<br />
#<br />
G1A-East<br />
G1A-West<br />
G1A-Center<br />
G1B-East<br />
G1B-West<br />
G1B-Center<br />
G1C-East<br />
G1C-West<br />
G1C-Center<br />
f c '<br />
Time of Test<br />
ASTM 79<br />
(psi)<br />
E c<br />
Time of Test<br />
ASTM 79<br />
(psi)<br />
5,384 3.35E+06<br />
Range 4,848-5,929 3.24E+06-3.45E+06<br />
G2A-East<br />
G2B-East 5278 3.45E+06<br />
G2C-West<br />
Range 5,047-5,560 3.28E+06-3.55E+06<br />
G2A-West<br />
G2A-Center<br />
G2B-West<br />
G2B-Center<br />
5440 3.36E+06<br />
G2C-East<br />
G2C-Center<br />
Range 4,975-6,109 3.32E+06-3.42E+06<br />
5-12
120<br />
100<br />
80<br />
Stress (ksi)<br />
60<br />
40<br />
20<br />
0<br />
0.00 0.02 0.04 0.06 0.08 0.10 0.12 0.14 0.16<br />
Strain (in/in)<br />
Specimen 2 Specimen 3 Specimen 4<br />
Figure 5.9 Stress-strain curves <strong>for</strong> #4 rein<strong>for</strong>cing bars<br />
5.6 Transfer Length<br />
Transfer length was measured at each end of each girder. The strain values were smoothed to<br />
give results shown in Figures 5.10 and 5.11. The transfer length results are given in Table 5.5. The<br />
average transfer length <strong>for</strong> the G1 girders was 21.9 inches and <strong>for</strong> the G2 girders was 15.6 inches.<br />
These values are all less than 50 times the strand diameter which is normally assumed as the transfer<br />
length.<br />
5-13
Strain (microstrains)<br />
1400<br />
1200<br />
1000<br />
800<br />
600<br />
400<br />
200<br />
0<br />
0 5 10 15 20 25 30 35 40 45<br />
Distance from End of Beam (in)<br />
Release 1 Day 3 Days 7 Days 14 Days<br />
Figure 5.10 Smoothed surface strain plot <strong>for</strong> East End of Girder G1C<br />
1400<br />
1200<br />
Transfer Length = 28"<br />
95% AMS<br />
Strain (microstrains)<br />
1000<br />
800<br />
600<br />
400<br />
200<br />
Initial Linear<br />
Trend<br />
Averaged, Smoothed<br />
Strain Profile<br />
Constant Strain Plateau<br />
0<br />
0 10 20 30 40 50<br />
Distance from Girder End (in)<br />
Smoothed 14-Day CSS 95% AMS Initial Linear Trend<br />
Figure 5.11 Transfer Length Determined Using 95 Percent AMS Method <strong>for</strong> G1C-East<br />
5-14
Table 5.5 –Transfer Length Results (inches)<br />
G1A G1B G1C G2A G2B G2C<br />
East West East West East West East West East West East West<br />
19.5 18.75 25.00 18.75 28.00 21.50 17.50 13.25 13.00 13.00 19.00 18.00<br />
FREE FREE FREE<br />
5.7 Girder Tests and Results<br />
Each girder was loaded monotonically until failure at a load of approximately 400 kips.<br />
Loading proceeded in increments of approximately 30 kips or in deflection increments of about<br />
0.25 inches. After each load or deflection increment, concrete surface strain (CSS) readings,<br />
deflection readings, crack spacings, and VWSG readings were recorded. Readings were also<br />
taken at special occurrences such as first flexural or shear crack observation or initial strand slip.<br />
Table 5.6 provides an overview of experimental results listing failure types, ultimate strain<br />
values and moments at cracking and ultimate conditions. The failure types were classified using<br />
the definitions below:<br />
FL - The girder failed by “BOTH” crushing of the deck and yielding of the strands.<br />
SH - The girder failed purely in shear. It did not meet the criteria <strong>for</strong> a flexural failure.<br />
SH/FL - The girder failed predominantly in shear, but still yielded the strands and crushed the<br />
deck. The two failure states occurred almost simultaneously.<br />
SH-SL - The girder underwent a shear failure initiated by the strands slipping.<br />
FL/SH-SL or SH-SL/FL - The girder underwent both failure modes with one occurring more<br />
predominantly than the other. Both failures would result in yielding of the strands and crushing<br />
of the deck.<br />
Although there are five failure types listed in Table 5.6, the failures fell into two major<br />
categories; flexural failures and shear failures.<br />
5.7.1 Flexural Failures<br />
Figure 5.12 shows a photo of girder test G1-B West, a typical flexural failure. The<br />
vertical lines indicate the location of shear rein<strong>for</strong>cement. Flexural failures were ductile in<br />
nature. A typical flexural failure showed flexural cracks extending from the bottom of the girder<br />
up into the deck and evenly spaced shear cracks less than 0.02 inches in width between the<br />
5-15
support and point of load application. Spalling of concrete from the top surface was evidence of<br />
crushing in the deck. Figure 5.13 shows a typical load deflection curve.<br />
In all cases of flexural failure, the AASHTO rectangular stress block technique<br />
conservatively predicted the ultimate moment. The average ratio of experimental to predicted<br />
moment strength was 1.08 <strong>for</strong> both the G1 and G2 girders.<br />
Test<br />
#<br />
Table 5.6 Overview of Experimental Results<br />
Failure<br />
Type<br />
Crushing<br />
Status<br />
of<br />
Deck<br />
Cracking<br />
Moment<br />
M cr<br />
Ultimate<br />
Moment<br />
M ult<br />
Max<br />
Deck<br />
Strain<br />
ε cu<br />
(in/in)<br />
Max<br />
Strand<br />
Strain<br />
ε ps<br />
(in/in)<br />
(ft-kips) (ft-kips)<br />
G1A-E FL/SH-SL Crushed 1224 1836 0.0038 0.0158<br />
G1A-W FL Crushed 1109 1844 0.0042 0.0168<br />
G1A-C SH Not Crushed 1064 1671 0.0029 0.0086<br />
G1B-E SH-SL Not Crushed 1133 1578 0.0033 0.0078<br />
G1B-W FL Crushed 1109 1840 0.0032 0.0190<br />
G1B-C SH/FL Crushed 1188 1774 0.0039 0.0107<br />
G1C-E SH-SL/FL Crushed 1155 1796 0.0032 0.0113<br />
G1C-W FL Crushed 1145 1828 0.0036 0.0140<br />
G1C-C FL Crushed 1142 1898 0.0049 0.0146<br />
G2A-E FL Crushed 1220 1855 0.0036 0.0190<br />
G2A-W FL Crushed 1176 1855 0.0072 0.0204<br />
G2A-C SH Crushed 1124 1657 0.0086 0.0084<br />
G2B-E FL Crushed 1110 1799 0.0082 0.0155<br />
G2B-W FL Crushed 1124 1840 0.0064 0.0199<br />
G2B-C SH/FL Crushed 1210 1869 0.0035 0.0122<br />
G2C-E FL Crushed 1079 1870 0.0045 0.0228<br />
G2C-W FL Crushed 1094 1793 0.0049 0.0198<br />
G2C-C FL Crushed 1219 1885 0.0089 0.0215<br />
G1 Avg 1141 1785 0.0037 0.0132<br />
G2 Avg 1151 1824 0.0062 0.0177<br />
5-16
Figure 5.12 Typical flexural failure, Girder G1B-West<br />
400<br />
350<br />
300<br />
Load (kips)<br />
250<br />
200<br />
150<br />
100<br />
50<br />
0<br />
0.0 0.5 1.0 1.5 2.0<br />
Deflection (inches)<br />
Experimental<br />
Theoretical<br />
Figure 5.13. Load-deflection curve, girder G1B-West<br />
5.7.2 Shear Failures<br />
Within the category of shear failures were included girder tests that failed purely in shear<br />
and those that underwent a shear failure initiated by strand slip. In general, the resulting<br />
moment-curvature and load-displacement curves were similar. Girder test G2A-Center seen in<br />
Figure 5.14 involved a center span where the shear rein<strong>for</strong>cement was spaced at 24 inches. The<br />
5-17
objective of this test was to examine the shear strength of concrete. The shear crack running<br />
from bottom to top occurred very suddenly and violently and was indicative of a pure shear<br />
failure. Girders undergoing shear failures precipitated by strand slip showed different failure<br />
modes.<br />
Figure 5.14 Girder Test G2A-Center Showing Pure Shear Failure<br />
5.8 Cracking Results<br />
Table 5.7 provides an overview of the predicted and experimental cracking moment <strong>for</strong><br />
each girder test. The experimental cracking moment was determined by examining the<br />
experimental load vs. deflection plot identifying the point at which a slope change occurred. In<br />
every case, the cracking load indicated on the load vs. deflection plot matched the load recorded<br />
where visible flexural cracking first occurred.<br />
Based on the use of equation 5.1, the predicted cracking moment <strong>for</strong> the G2 series girders<br />
was 10.8 percent greater than <strong>for</strong> G1 girders.<br />
f<br />
cr − Pr ed<br />
= 7.5λ<br />
f<br />
'<br />
c<br />
(5.1)<br />
where λ is the correction factor of unit weight of concrete, taken as 0.85.<br />
5-18
Since G2 girders had a higher concrete compressive strength than G1 girders, this was<br />
logical. Experimentally, the G1 and G2 series average cracking moments were about identical.<br />
It is important to note that the predicted cracking moments appeared to become less conservative<br />
as compressive strength increased.<br />
Test<br />
#<br />
Table 5.7 Cracking Moment Results<br />
Predicted<br />
M cr<br />
(ft-kips)<br />
Experimental<br />
M cr<br />
(ft-kips)<br />
Percent<br />
Difference<br />
G1A-East 1052 1224 16.4%<br />
G1A-West 1005 1109 10.4%<br />
G1A-Center 1065 1064 -0.2%<br />
G1B-East 1019 1133 11.2%<br />
G1B-West 1004 1109 10.4%<br />
G1B-Center 1029 1188 15.5%<br />
G1C-East 999 1155 15.6%<br />
G1C-West 971 1145 17.9%<br />
G1C-Center 1035 1142 10.4%<br />
G2A-East 1165 1220 4.7%<br />
G2A-West 1136 1176 3.5%<br />
G2A-Center 1189 1124 -5.5%<br />
G2B-East 1177 1110 -5.6%<br />
G2B-West 1133 1124 -0.9%<br />
G2B-Center 1200 1210 0.8%<br />
G2C-East 1059 1079 1.9%<br />
G2C-West 1025 1094 6.8%<br />
G2C-Center 1082 1219 12.6%<br />
G1 Average 1020 1141 12.0%<br />
G2 Average 1130 1151 2.0%<br />
G1 Std Dev 5.4%<br />
G2 Std Dev 5.8%<br />
5.9 Shear Behavior<br />
The flexure shear strength was calculated using AASHTO equation (5.2):<br />
V<br />
ci<br />
'<br />
fc<br />
'<br />
= 0.6λ<br />
b d + V<br />
1000<br />
d<br />
ViM<br />
+<br />
M<br />
where V d is the shear <strong>for</strong>ce from dead load of girder plus deck slab.<br />
cr<br />
max<br />
'<br />
fc<br />
'<br />
≥ 1.7λ<br />
b d<br />
1000<br />
(5.2)<br />
5-19
The value b’ was taken as the minimum web thickness of the girder which was 6 inches <strong>for</strong> an<br />
AASHTO Type II. The code specifies that d, the distance from the topmost compression fiber to<br />
the centroid of the prestressing strands need not be less than 0.8*h where h is the total depth of<br />
the composite girder. The value of d normally exceeded the minimum 0.8*h. V i and M max were<br />
the maximum moment and shear at the section in question. The lightweight concrete factor, λ,<br />
having a value of 0.85 was included in the equation based on the use of HSLC. The concrete<br />
strength f c ’ was listed in psi. Calculation of the cracking moment was accomplished with<br />
AASHTO equation (5.3):<br />
M<br />
cr<br />
'<br />
I fc<br />
= (6λ<br />
+ f<br />
Y 1000<br />
where f pe is the compressive stress at the extreme tensile fiber due to effective prestressing <strong>for</strong>ce<br />
and f d if the tensile stress at the extreme tensile fiber due to the dead load of the girder and slab.<br />
t<br />
pe<br />
−<br />
f<br />
d<br />
)<br />
(5.3)<br />
The composite section properties were used in calculating M cr . The concrete strength, f c ’, was<br />
based on cylinder tests at the time of girder testing.<br />
The web shear strength was calculated using AASHTO (1996) equation (5.4):<br />
'<br />
fc<br />
V<br />
cw<br />
= (3.5λ<br />
+ 0.3 f<br />
pc)<br />
b'<br />
d + V<br />
1000<br />
where f pc is the average compressive stress in the concrete due to effective prestressing <strong>for</strong>ce and<br />
V p is the vertical component of the effective prestressing <strong>for</strong>ce.<br />
p<br />
(5.4)<br />
ACI 11.4.2.2 provides an alternate technique <strong>for</strong> calculating V cw that was investigated in<br />
this evaluation. The ACI Code states that V cw shall be computed as the shear <strong>for</strong>ce<br />
corresponding to dead load plus live load that results in a principal tension stress of 4λ(f c ’) 1/2 at<br />
the centroidal axis of the member. In composite members, the principal tensile stress is<br />
computed using the cross section that resists live load. Lin and Burns (1981) addressed this<br />
alternate technique and provided the following equations which come directly from the<br />
application of Mohr’s circle:<br />
5-20
V<br />
"<br />
pc<br />
cw− Pr ed<br />
= ft<br />
−Pr<br />
ed<br />
1 +<br />
"<br />
ft<br />
−Pr<br />
ed<br />
f<br />
bd<br />
p<br />
(5.5)<br />
The predicted diagonal tensile strength, f’’ t-Pred was calculated using equation 5.6:<br />
f<br />
"<br />
t−<br />
Pr ed<br />
= 4λ<br />
f<br />
'<br />
c<br />
(5.6)<br />
5.9.1 Initial Shear Cracking<br />
Table 5.8 provides an overview of initial shear cracking. The predicted values were<br />
calculated at the midpoint of the shear span. The experimental value was the applied shear at<br />
which cracking was first recorded visually or electronically.<br />
Examination of Table 5.8 showed that the AASHTO (1996) Standard method of<br />
calculating concrete shear strength was conservative overall. In the case of girder tests G1C-<br />
Center and G2C-Center, the prediction was less than 3 percent unconservative. The AASHTO<br />
LRFD (1998) technique provided predictions of concrete strength that far underestimated their<br />
capacity. The ACI alternate approach provided the closest prediction <strong>for</strong> V c where the cracking<br />
shear was equated to the shear strength provided by the concrete. Overall, the predicted V c<br />
values were within about 6 percent of experimental values <strong>for</strong> both the G1 and G2 girder tests.<br />
Girder tests G1C-Center and G2C-Center showed the greatest difference from the ACI alternate<br />
predicted values, about 18 percent unconservative overall. Both the tests involved the minimum<br />
stirrup spacing of 24 inches.<br />
5.9.2 Ultimate Shear Capacity<br />
Table 5.9 provides an overview of predicted ultimate shear capacity calculated by the<br />
AASHTO Standard method and the AASHTO LRFD method with the strength reduction factor,<br />
φ s , of 1 and compares them to the experimental maximum shear values. Using the AASHTO<br />
Standard method, the stirrup yield strength was capped at 60 ksi as required by the code, and the<br />
results also recorded. Since the value of f y was 62 ksi, there was an insignificant difference in<br />
predicted values.<br />
5-21
Table 5.9 lists the results of all tests; Table 5.10 lists only the tests that exhibited a shear,<br />
shear-slip or shear-flexure failure. Both tables show the AASHTO Standard technique produced<br />
conservative results overall. Limiting the yield strength to 60 ksi caused the prediction to be<br />
slightly more conservative. The AASHTO LRFD technique produced more conservative results<br />
overall because the girders with 24-inch spacing were predicted to carry much less shear. The<br />
AASHTO LRFD penalized those girders with a very low concrete strength relative to the<br />
AASHTO Standard procedure.<br />
Test<br />
#<br />
V c-EXP<br />
Exp.<br />
Table 5.8 Overview of Initial Cracking Shears<br />
V cw<br />
AASHTO<br />
Standard<br />
(kips)<br />
V cw<br />
ACI<br />
Alternate<br />
(kips)<br />
V c<br />
AASHTO<br />
LRFD<br />
(kips)<br />
Percent<br />
Diff.<br />
Exp. vs.<br />
Standard<br />
Percent<br />
Diff.<br />
Exp. vs.<br />
ACI Alt<br />
Percent<br />
Diff.<br />
Exp. vs.<br />
LRFD<br />
(kips)<br />
G1A-E * 145.0 104.1 124.0 24.7 39.4% 16.9% 488%<br />
G1A-W 120.0 107.1 127.5 26.3 12.1% -5.9% 356%<br />
G1A-C * 134.0 98.5 118.0 23.5 36.1% 13.6% 470%<br />
G1B-E * 140.0 105.5 125.5 24.7 32.7% 11.6% 466%<br />
G1B-W 141.2 103.9 123.6 24.3 35.9% 14.2% 482%<br />
G1B-C * 136.1 98.9 118.4 25.0 37.6% 14.9% 445%<br />
G1C-E * 123.5 101.5 120.7 23.6 21.7% 2.3% 423%<br />
G1C-W 134.2 104.0 123.3 23.6 29.0% 8.8% 468%<br />
G1C-C 94.0 96.7 115.8 24.6 -2.8% -18.8% 282%<br />
G2A-E 178.6 114.4 135.7 26.0 56.1% 31.6% 588%<br />
G2A-W 157.3 118.1 139.5 28.8 33.2% 12.8% 447%<br />
G2A-C * 140.0 109.4 130.6 25.0 27.9% 7.2% 460%<br />
G2B-E 163.1 114.6 136.1 25.2 42.3% 19.8% 549%<br />
G2B-W 148.0 117.4 138.7 25.8 26.1% 6.7% 473%<br />
G2B-C * 120.4 110.5 131.9 25.2 9.0% -8.7% 377%<br />
G2C-E 143.4 112.0 133.0 25.6 28.1% 7.8% 461%<br />
G2C-W 122.4 113.4 134.2 27.1 8.0% -8.8% 352%<br />
G2C-C 107.0 107.3 128.1 31.3 -0.2% -16.5% 241%<br />
G1 Avg 129.8 102.2 121.9 24.5 26.8% 6.4% 431%<br />
G2 Avg 142.2 113.0 134.2 26.7 25.6% 5.8% 439%<br />
G1 Std Dev 14.1% 11.9% 68.9%<br />
G2 Std Dev 17.8% 15.2% 104.1%<br />
* Girder failed in shear at ultimate as primary or secondary failure mode<br />
5-22
Test<br />
#<br />
Table 5.9 Predicted vs. Experimental V u Values<br />
AASHTO<br />
Standard<br />
f y = 62 ksi<br />
V u<br />
(kips)<br />
AASHTO<br />
Standard<br />
f y = 60 ksi<br />
V u<br />
(kips)<br />
AASHTO<br />
LRFD<br />
f y = 62 ksi<br />
V u<br />
(kips)<br />
Exp.<br />
V u<br />
Percent<br />
Diff.<br />
Exp<br />
vs<br />
Std 62<br />
Percent<br />
Diff.<br />
Exp<br />
vs<br />
Std 60<br />
Percent<br />
Diff.<br />
Exp<br />
vs<br />
LRFD<br />
(kips)<br />
G1A-East * 379.7 370.8 473.5 362.8 -4.5% -2.2% -23.4%<br />
G1A-West * 244.9 240.4 312.8 248.9 1.6% 3.5% -20.4%<br />
G1A-Center 138.7 137.4 103.8 258.0 86.0% 87.8% 148.5%<br />
G1B-East 243.3 238.9 241.1 312.2 28.3% 30.7% 29.5%<br />
G1B-West * 376.0 367.2 363.5 296.3 -21.2% -19.3% -18.5%<br />
G1B-Center 138.6 137.3 104.3 234.1 68.9% 70.5% 124.5%<br />
G1C-East 238.4 234.0 255.5 289.2 21.3% 23.6% 13.2%<br />
G1C-West * 241.4 237.0 255.6 260.3 7.8% 9.8% 1.8%<br />
G1C-Center * 137.1 135.8 105.5 202.2 47.5% 48.9% 91.6%<br />
G2A-East * 388.3 379.4 365.4 366.5 -5.6% -3.4% 0.3%<br />
G2A-West * 255.4 251.0 223.8 249.7 -2.3% -0.5% 11.6%<br />
G2A-Center 149.5 148.2 82.3 255.9 71.2% 72.7% 211.0%<br />
G2B-East * 252.5 248.0 215.8 355.4 40.8% 43.3% 64.7%<br />
G2B-West * 391.3 382.4 432.0 296.3 -24.3% -22.5% -31.4%<br />
G2B-Center 150.9 149.6 102.7 246.3 63.2% 64.6% 139.9%<br />
G2C-East * 249.8 245.3 268.9 301.0 20.5% 22.7% 11.9%<br />
G2C-West * 249.9 245.5 254.2 255.2 2.1% 4.0% 0.4%<br />
G2C-Center * 147.6 144.1 89.2 200.3 35.7% 39.0% 124.7%<br />
G1 Average 26.2% 28.1% 38.5%<br />
G2 Average 22.4% 24.4% 59.2%<br />
* Tests which exhibited a flexural failure as the primary failure mode<br />
5-23
Table 5.10 Predicted vs. Experimental V u Values <strong>for</strong> Tests Failing in Shear<br />
Test<br />
#<br />
AASHTO<br />
Standard<br />
f y = 62 ksi<br />
V u<br />
(kips)<br />
AASHTO<br />
Standard<br />
f y = 60 ksi<br />
V u<br />
(kips)<br />
AASHTO<br />
LRFD<br />
f y = 62 ksi<br />
V u<br />
(kips)<br />
Exp.<br />
V u<br />
Percent<br />
Diff.<br />
Exp<br />
vs<br />
Std 62<br />
Percent<br />
Diff.<br />
Exp<br />
vs<br />
Std 60<br />
Percent<br />
Diff.<br />
Exp<br />
vs<br />
LRFD<br />
(kips)<br />
G1A-Center 138.7 137.4 103.8 258.0 86.0% 87.8% 148.5%<br />
G1B-East 243.3 238.9 241.1 312.2 28.3% 30.7% 29.5%<br />
G1B-Center 138.6 137.3 104.3 234.1 68.9% 70.5% 124.5%<br />
G1C-East 238.4 234.0 255.5 289.2 21.3% 23.6% 13.2%<br />
G2A-Center 149.5 148.2 82.3 255.9 71.2% 72.7% 211.0%<br />
G2B-Center 150.9 149.6 102.7 246.3 63.2% 64.6% 139.9%<br />
G1 Average 51.1% 53.2% 78.9%<br />
G2 Average 67.2% 68.7% 175.5%<br />
G1 Std Dev 31.3% 31.0% 67.5%<br />
G2 Std Dev 5.7% 5.7% 50.3%<br />
The current AASHTO Standard specification provides a conservative prediction of<br />
concrete and ultimate shear capacity when shear steel capacity is capped at a yield strength of 60<br />
ksi. The alternate design procedure listed in ACI-318 Section 11.4.2.2 <strong>for</strong> predicting shear<br />
strength produced some unconservative predictions <strong>for</strong> concrete compressive strengths over<br />
10,000 psi. The method <strong>for</strong> predicting interface shear strength is conservative <strong>for</strong> HSLC.<br />
The current AASHTO LRFD specification provides a conservative prediction of ultimate<br />
strength.<br />
5.10 Development Length of 0.6-in. Strand in HPLC<br />
Table 5.11 presents the development length test results. An evaluation of current code<br />
provisions using the twelve slate HPLC girder development length tests in this study and eight<br />
normal weight HPC girder tests from Dill (2000) showed the current AASHTO (1996) and ACI<br />
provisions to be conservative (Table 5.12). The code equations overestimated development<br />
lengths by 19 percent <strong>for</strong> both slate HPLC and normal weight HPC and never underestimated<br />
them. Use of the current code provisions <strong>for</strong> design of development length <strong>for</strong> slate HPLC and<br />
0.6-inch diameter strand was conservative. Based on the concrete strength range addressed in<br />
5-24
this research project, modification of the current code specifications <strong>for</strong> development length was<br />
not necessary <strong>for</strong> HPLC or <strong>for</strong> 0.6-inch diameter strands.<br />
Test #<br />
E=East<br />
W=West<br />
Stirrup<br />
Density<br />
1X<br />
2X<br />
Table 5.11 Development Length Test Results<br />
Strand<br />
Embedment<br />
Average<br />
Strand<br />
Slip<br />
at P max<br />
(inches)<br />
Maximum<br />
Strand<br />
Strain<br />
ε ps<br />
(in/in)<br />
Maximum<br />
Deck<br />
Strain<br />
ε cu<br />
(in/in)<br />
Failure Mode<br />
FL-Flexure<br />
SH-Shear<br />
SL-Strand Slip<br />
(inches)<br />
G1A-E 2X 67 0.0102 0.0158 0.0038 FL/SH-SL<br />
G1A-W 1X 96 0.0000 0.0168 0.0042 FL<br />
G1B-E 1X 67 0.7350 0.0078 0.0030 SH-SL<br />
G1B-W 2X 81 0.0007 0.0190 0.0032 FL<br />
G1C-E 1X 81 0.1988 0.0113 0.0032 SH-SL/FL<br />
G1C-W 1X 91 0.0000 0.0140 0.0036 FL<br />
G2A-E 2X 67 0.0033 0.0190 0.0036 FL<br />
G2A-W 1X 96 0.0000 0.0204 0.0072 FL<br />
G2B-E 1X 67 0.0065 0.0155 0.0045 FL<br />
G2B-W 2X 81 0.0000 0.0199 0.0064 FL<br />
G2C-E 1X 81 0.0041 0.0228 0.0045 FL<br />
G2C-W 1X 91 0.0000 0.0198 0.0049 FL<br />
Basis of<br />
Comparison<br />
Table 5.12 Proposed Equation Evaluation <strong>for</strong> use on HPLC<br />
AASHTO<br />
ACI<br />
Code<br />
Proposed Equation<br />
For<br />
Design<br />
5000 ⎞<br />
+ f<br />
ps<br />
− fse<br />
d<br />
'<br />
f<br />
Proposed Equation<br />
For<br />
Best Fit<br />
2500<br />
f<br />
ps<br />
fse<br />
d<br />
f ⎟ ⎞<br />
50 + −<br />
'<br />
ci ⎠<br />
⎛<br />
2<br />
( f<br />
ps<br />
−<br />
3<br />
f<br />
se<br />
) d ⎜<br />
b<br />
⎟ ⎛<br />
⎜<br />
⎝<br />
⎠ ⎝<br />
Avg Diff (HSLC) 19% 13% 4%<br />
Max Over (HSLC) 30% 31% 21%<br />
Max Under (HSLC) 8% 2% -6%<br />
50<br />
b<br />
⎜<br />
b<br />
ci<br />
Avg Diff (NWC) 18% 2% -5%<br />
Max Over (NWC) 18% 4% -3%<br />
Max Under (NWC) 17% 0% -6%<br />
Avg Diff (Overall) 19% 9% 1%<br />
Max Over (Overall) 30% 31% 21%<br />
Max Under (Overall) 8% 0% -6%<br />
5-25
Test results showed conclusively that shear cracking in the transfer length region across<br />
the bottom strands did not induce significant strand slip if stirrup density was doubled over the<br />
current AASHTO (1996) specified density in the region.<br />
There was no indication throughout this analysis that need existed to differentiate<br />
between slate HPLC and normal weight HPC. With regard to development length, <strong>for</strong> concrete<br />
compressive strengths over 8,000 psi, the prediction of development length was the same <strong>for</strong><br />
both lightweight and normal weight concrete.<br />
5-26
Chapter 6. Prestress Losses in HPLC<br />
6.1 Introduction<br />
One goal of this research was to determine how the use of HPLC would affect the loss of<br />
prestressing <strong>for</strong>ce in bridge girders. The creep and shrinkage data found from HPLC cylinders<br />
and from AASHTO Type II girders made with HPLC (Chapter 5) were used to estimate prestress<br />
losses in bridge girders. These experimental losses are compared with four models: AASHTO<br />
refined and AASHTO lump sum (AASHTO-LRFD, 1998), ACI Committee 209 (ACI-209,<br />
1997), and the PCI method (PCI, 1998), which are presented in Appendix D. For comparison<br />
purposes, ACI-209 estimates were computed <strong>for</strong> 40 years after prestressing assuming that time as<br />
the final loss state. Actual losses were computed from measured, experimental strains of<br />
AASHTO Type II girders. The experimental data did not include steel relaxation losses.<br />
Experimental strains were projected to the 40-year condition <strong>for</strong> comparison with the estimates<br />
from the standards.<br />
6.2 Strain Measurements and Comparison to Predicted Losses<br />
Strain measurements of those girders as shown in Figure 6.1 provided experimental data<br />
<strong>for</strong> actual prestress computations. Table 6.1 presents the comparison between measured and<br />
estimated prestress losses <strong>for</strong> the 8,000-psi and 10,000 psi HPLC girders.<br />
-1000<br />
Microstrains (in/in x 10 -6 )<br />
-800<br />
-600<br />
-400<br />
Deck pouring<br />
-200<br />
8,000-psi Individual Girder Result<br />
10,000-psi Individual Girder Result<br />
0<br />
0 20 40 60 80 100 120 140<br />
Age (Days)<br />
Figure 6.1. Experimental strains <strong>for</strong> the 8,000-psi and 10,000-psi HPLC 39-foot girders.<br />
6-1
Table 6.1 Comparison between experimental and estimated prestress losses of HPLC prestressed<br />
girders<br />
8,000-psi HPLC<br />
Girders<br />
Measured<br />
AASHTO<br />
refined<br />
AASHTO<br />
Lump sum PCI ACI 209<br />
(ksi) (%) (ksi) (%) (ksi) (%) (ksi) (%) (ksi) (%)<br />
Stress After Jacking 202.5 100.0 202.5 100.0 202.5 100.0 202.5 100.0 202.5 100.0<br />
Elastic Shortening 17.0 8.4 11.2 5.5 10.4 5.2 10.5 5.2 12.0 5.9<br />
Creep not measured 16.4 8.1 14.1 7.0 14.8 7.3<br />
Shrinkage separately not estimated<br />
6.5 3.2 5.1 2.5 11.3 5.6<br />
separately<br />
CR+SH 8.8 4.3 22.9 11.3 19.2 9.5 26.1 12.9<br />
Relaxation 11.5* 5.7 18.7 9.2<br />
3.8 1.9 5.6 2.8<br />
Total Timedependent<br />
20.2 10.0 41.5 20.5 24.2 12.0 23.0 11.3 31.7 15.7<br />
Total Losses 37.2 18.4 52.8 26.1 34.7 17.1 33.5 16.5 43.7 21.6<br />
AASHTO AASHTO<br />
10,000-psi HPLC Measured<br />
refined Lump sum PCI ACI 209<br />
Girders<br />
(ksi) (%) (ksi) (%) (ksi) (%) (ksi) (%) (ksi) (%)<br />
Stress After Jacking 202.5 100.0 202.5 100.0 202.5 100.0 202.5 100.0 202.5 100.0<br />
Elastic Shortening 12.0 5.9 10.1 5.0 9.8 4.8 9.0 4.4 10.9 5.4<br />
Creep not measured 16.1 7.9 13.0 6.4 12.7 6.3<br />
Shrinkage separately 6.5 3.2 not estimated 5.1 2.5 11.2 5.6<br />
CR+SH 3.0 1.5 22.6 11.2 separately 18.1 8.9 24.0 11.8<br />
Relaxation 14.6* 7.2 19.2 9.5<br />
3.9 1.9 5.6 2.8<br />
Total Losses 29.6 14.6 51.9 25.6 33.3 16.4 31.0 15.3 40.5 20.0<br />
* Relaxation was determinate with Equation 6.1 using experimental ES, CR and SH.<br />
∆f<br />
2<br />
where<br />
( ∆f<br />
+ ∆f<br />
)<br />
pR2 = 20 − 0.4 ⋅ ∆f<br />
pES<br />
− 0. ⋅<br />
pSR pCR<br />
(6.1)<br />
∆f pR2 : after transfer steel relaxation loss (ksi)<br />
∆f pES : elastic shortening loss (ksi)<br />
∆f pCR : creep of concrete loss (ksi)<br />
∆f pSR : shrinkage of concrete loss (ksi)<br />
Experimental “total losses” <strong>for</strong> 8,000-psi girders made with HPLC was 37.2 ksi. The<br />
AASHTO-LRFD refined and ACI-209 method overestimated total losses by 15.6 and 6.5 ksi,<br />
respectively. The AASHTO-LRFD lump sum and PCI methods were close to experimental data,<br />
but they underestimated total losses by 2.5 and 3.7 ksi, respectively. The experimental prestress<br />
6-2
losses in the 10,000-psi girders totaled 29.6 ksi which was lower than that of the 8,000-psi<br />
girders by 7.6 ksi. AASHTO-LRFD refined and lump sum methods overestimated total loses by<br />
22.3 and 3.7 ksi, respectively.<br />
In Figure 6.2, the predicted-to-measured ratio is shown. Losses are grouped in elastic<br />
shortening, creep and shrinkage, total time dependent, and total losses. Overestimates appear as a<br />
predicted-to-measured ratio greater than one, and the underestimates as lower than one. The four<br />
methods overestimated the total time-dependent prestress losses, but they underestimated elastic<br />
shortening losses regardless the type of HPLC. The AASHTO-LRFD refined, PCI and ACI-209<br />
overestimated creep and shrinkage losses (CR + SH) by at least 100%. The underestimate in<br />
steel relaxation losses given by the PCI and ACI-209 methods was probably due to the much<br />
higher creep and shrinkage losses that they predicted which decreased predicted relaxation in the<br />
steel.<br />
Figures 6.3 and 6.4 present measured and predicted strain data found from cylinder<br />
specimens. The fact that all methods underestimated elastic shortening was probably a<br />
consequence of the procedures <strong>for</strong> measuring elastic shortening. The strain measurement was<br />
taken after prestress transfer, which took approximately one hour. There<strong>for</strong>e, the first reading<br />
after transfer included not only instantaneous elastic strain, but also early creep and shrinkage.<br />
The same argument can be used to explain why all methods overestimated time dependent<br />
losses.<br />
Within time-dependant losses (TD), differences between estimates primarily were due to<br />
shrinkage losses. For the 8,000 psi girders, the PCI method estimated shrinkage losses as 5.1 ksi<br />
(2.5%) while ACI-209 method estimated it to be 11.3 ksi (5.6%).<br />
As shown in Figures 6.3 and 6.4, the largest relative differences were obtained on the<br />
shrinkage portion where PCI and AASHTO refined methods significantly underestimated<br />
shrinkage losses. For the 8,000 psi HPLC, the PCI and AASHTO refined methods<br />
underestimated creep; but <strong>for</strong> the 10,000 psi HPLC those estimates were close to the measured<br />
creep strains. The ACI-209 method gave the best creep estimate <strong>for</strong> the 8,000 psi HPLC, but it<br />
overestimated creep <strong>for</strong> the 10,000 psi girders.<br />
6-3
8.0<br />
Predicted-to-measured ratio<br />
7.0<br />
6.0<br />
5.0<br />
4.0<br />
3.0<br />
Elastic Shortening<br />
Creep & Shrinkage<br />
Total Time Dependent<br />
Total Losses<br />
2.0<br />
1.0<br />
0.0<br />
8,000-psi<br />
10,000-psi<br />
8,000-psi<br />
10,000-psi<br />
8,000-psi<br />
10,000-psi<br />
8,000-psi<br />
HPLC<br />
HPLC<br />
HPLC<br />
HPLC<br />
HPLC<br />
HPLC<br />
HPLC<br />
AASHTO refined AASHTO lump sum PCI ACI 209<br />
10,000-psi<br />
HPLC<br />
Figure 6.2. Comparison between estimated prestress losses <strong>for</strong> HPLC girders from PCI,<br />
AASHTO and ACI-209 models<br />
6-4
Microstrains (in/inx10 -6 )<br />
0 500 1000 1500 2000 2500 3000<br />
Elastic<br />
Strain<br />
1307<br />
1192<br />
1127<br />
1192<br />
Creep<br />
1791<br />
1599<br />
2616<br />
2459<br />
Shrinkage<br />
228<br />
231<br />
828<br />
698<br />
Measured<br />
AASHTO refined<br />
PCI<br />
ACI 209<br />
Figure 6.3 Comparison between 8,000 psi HPLC experimental strains from cylinder specimens<br />
and those estimated by AASHTO-LRFD refined, PCI, and ACI-209 models.<br />
6-5
Microstrains (in/inx10 -6 )<br />
0 500 1000 1500 2000 2500 3000<br />
Elastic<br />
Strain<br />
1470<br />
1275<br />
1148<br />
1275<br />
1850<br />
Creep<br />
1773<br />
2099<br />
2481<br />
Shrinkage<br />
228<br />
231<br />
610<br />
694<br />
Measured<br />
AASHTO refined<br />
PCI<br />
ACI 209<br />
Figure 6.4 Comparison between 10,000 HPLC experimental strains from cylinder specimens<br />
and those estimated by AASHTO-LRFD refined, PCI, and ACI-209 models<br />
6-6
6.3 Conclusions Regarding Prestress Losses<br />
Except <strong>for</strong> the AASHTO lump sum and PCI methods <strong>for</strong> 8,000-psi HPLC, each of the<br />
four methods <strong>for</strong> estimating prestress losses overestimated the total losses measured in 8,000-psi<br />
and 10,000-psi HPLC AASHTO Type II prestressed girders. The under-estimates <strong>for</strong> the<br />
AASHTO lump sum and PCI methods <strong>for</strong> the 8,000 psi girders were less than 2 percent. This<br />
means that each of the four methods may be conservatively used to predict prestress losses in<br />
HPLC girders.<br />
6-7
Chapter 7. Conclusions and Recommendations<br />
7.1. Analytical Investigation<br />
The use of HPLC has the potential to increase the length of simple span AASHTO Type<br />
IV and V sections up to four percent and Bulb-Tee sections up to three percent. However,<br />
AASHTO Type II and III sections do not benefit appreciably from the use of HPLC. The<br />
Modified Bulb-Tee section extended the length of a Standard Bulb-Tee by 10 feet using 8, 10<br />
and 12 ksi HPLC or high-strength NWC. Bulb-Tee (Standard or Modified) sections provided<br />
longer spans at less weight <strong>for</strong> girders over 105 feet in length when compared to AASHTO<br />
sections. For spans between 125 feet and 155 feet, the use of HPLC can reduce the gross vehicle<br />
weight to less than 150 kips so that a super-load permit is not required <strong>for</strong> transport of long span<br />
girders in Georgia.<br />
7.2 HPLC Mixes and Properties<br />
HPLC mixes were developed in the laboratory <strong>for</strong> 8,000 psi and 10,000 psi compressive<br />
strength using slate lightweight ½-in coarse aggregate and normal weight, natural sand. The dry<br />
unit weight of the concretes was approximately 117 and 119 pcf, respectively. A 12,000 psi<br />
design strength mix could not be developed. The strengths of mixes using lightweight fine<br />
aggregate could not be controlled; there<strong>for</strong>e no recommended mix used lightweight fines.<br />
The laboratory mixes were verified during field production. The field mixes yielded<br />
slightly higher strengths than found in the laboratory. Close monitoring of lightweight aggregate<br />
moisture was required.<br />
The HPLC, both 8,000 psi and 10,000 psi design strength continued to gain strength over<br />
the 100-day test period. Accelerated cured cylinders, which matched curing conditions of<br />
precast beams, showed about 25 percent higher one-day strength than ASTM cured cylinders; at<br />
56 days, the ASTM cured cylinders were about 4% stronger than the accelerated cured cylinders.<br />
An equation was developed and provides a better estimate of the modulus of elasticity <strong>for</strong> slate<br />
HPLC than previous relations <strong>for</strong> normal strength concretes.<br />
7-1
7.3 Transfer Length<br />
An evaluation of current code provisions using the 12 HPLC transfer lengths in this<br />
research and 8 normal weight HPC transfer lengths from Reutlinger (1999) showed the current<br />
AASHTO (1996) and ACI (2002) equations to be conservative. The AASHTO equation<br />
overestimated transfer lengths by 42% on average and never underestimated transfer lengths.<br />
The ACI equation using VWSG data to determine prestressing strand stress also overestimated<br />
transfer lengths by 46% and never underestimated transfer lengths. Use of either the AASHTO<br />
or ACI equations to predict transfer length <strong>for</strong> slate HPLC was conservative. Based on the<br />
concrete strength range addressed in this research project, modification of the current code<br />
specifications <strong>for</strong> transfer lengths was not necessary <strong>for</strong> slate HPLC.<br />
There was no indication throughout this analysis that a need existed to differentiate<br />
between slate HPLC and normal weight HPC with regard to transfer length. For initial concrete<br />
strengths, f ci ’, over 6,000 psi, the prediction of transfer length was the same <strong>for</strong> both slate<br />
lightweight and normal weight concrete.<br />
7.4 Flexural Behavior<br />
The current prediction of cracking stress and cracking moment, when examined <strong>for</strong> slate<br />
HPLC, showed indications of becoming unconservative as concrete compressive strengths<br />
approached 11,000 psi. In some cases, the predicted cracking moments exceeded the<br />
experimental values. The use of a lambda factor (λ) of 0.85 <strong>for</strong> HPLC made with slate<br />
lightweight aggregate produced conservative results on average <strong>for</strong> compressive strengths below<br />
11,000 psi. More research is required to examine a potential tension strength ceiling <strong>for</strong> HPLC<br />
and adjustments to lambda <strong>for</strong> concrete compressive strengths over 10,000 psi.<br />
The modulus of rupture test, ASTM C 78, did not accurately predict the cracking stress of<br />
HPLC girders.<br />
The current AASHTO procedure <strong>for</strong> ultimate moment calculation was conservative <strong>for</strong><br />
slate HPLC girders with normal weight concrete decks having a compressive strength under<br />
6,000 psi.<br />
7.5 Shear Behavior<br />
The current AASHTO Standard specification provided a conservative prediction of<br />
concrete and ultimate shear capacity when shear steel capacity was capped at a yield strength of<br />
7-2
60 ksi. The alternate design procedure listed in ACI-318 Section 11.4.2.2 <strong>for</strong> predicting shear<br />
strength produced some unconservative predictions <strong>for</strong> concrete compression strengths over<br />
10,000 psi. The method <strong>for</strong> predicting interface shear strength was conservative <strong>for</strong> slate HPLC.<br />
The current AASHTO LRFD (1998) specification provided a conservative prediction of<br />
ultimate shear strength <strong>for</strong> slate HPLC.<br />
7.6 Development Length<br />
An evaluation of current code provisions using the twelve HPLC girder development<br />
length tests in this study and eight normal weight HPC girder tests from Dill (2000) showed the<br />
current AASHTO and ACI provisions to be conservative. The code equations overestimated<br />
development lengths by 19 percent <strong>for</strong> both HPLC and normal weight HPC and never<br />
underestimated them. Use of the current code provisions <strong>for</strong> design of development length <strong>for</strong><br />
slate HPLC and 0.6-inch diameter strand was conservative. Based on the concrete strength range<br />
addressed in this research project, modification of the current code specifications <strong>for</strong><br />
development length was not necessary <strong>for</strong> HPLC or <strong>for</strong> 0.6-inch diameter strands.<br />
Test results showed conclusively that shear cracking in the transfer length region across<br />
the bottom strands did not induce significant strand slip if stirrup density was doubled over the<br />
current AASHTO specified density in the region.<br />
The addition of silica fume into the mix design at a 10% replacement rate by weight of<br />
cementitious materials gave indications of reducing development length.<br />
There was no indication throughout this analysis that need existed to differentiate<br />
between slate HPLC and normal weight HPC. With regard to development length, <strong>for</strong> concrete<br />
compressive strengths over 8,000 psi, the prediction of development length was the same <strong>for</strong><br />
both slate lightweight and normal weight concrete.<br />
7.7 Long Term Per<strong>for</strong>mance of HPLC<br />
Creep of 8,000-psi HPLC after 620 days under load was close to 1,650 µε <strong>for</strong> 40% of<br />
initial strength and approximately 2,000 µε <strong>for</strong> 60% of initial strength. Creep of 10,000-psi<br />
HPLC after 620 days under load was 1,160 µε <strong>for</strong> 40% of initial strength and 1,500 µε <strong>for</strong> 60%<br />
of initial strength. Fifty and ninety percent of the 620-day creep was reached after approximately<br />
16 and 250 days of loading, regardless the type of HPLC.<br />
7-3
Shrinkage after 620 days of drying was approximately 820 µε <strong>for</strong> the 8,000-psi HPLC<br />
mix and 610 µε <strong>for</strong> the 10,000-psi HPLC mix. Fifty and ninety percent of the 620-day shrinkage<br />
was reached after approximately 30 and 260 days of drying <strong>for</strong> both 8,000-psi and 10,000-psi<br />
HPLC.<br />
The 10,000-psi HPLC had a specific creep similar to that of an HPC of the same grade,<br />
but with less cement paste content, and it had significantly less creep than an HPC of the same<br />
grade and similar cement paste content. The shrinkage of the HPLC was about 20% greater than<br />
the HPC after 620 days. There<strong>for</strong>e, the HPLC had less creep yet somewhat more shrinkage than<br />
comparable HPC.<br />
Final prestress losses were estimated using AASHTO refined, AASHTO lump sum, PCI,<br />
and ACI-209 methods. All of them overestimated the measured time dependant losses in 8,000-<br />
psi and 10,000-psi AASHTO Type II prestressed girders made with HPLC. This result means<br />
that those methods are conservative <strong>for</strong> estimating time dependant losses of HPLC. Total losses,<br />
however, were underestimated by the AASHTO lump sum and PCI method by 1.2 and 1.8% <strong>for</strong><br />
8,000-psi girders, respectively.<br />
7.8 Recommendations<br />
7.8.1 HPLC Mixes and Properties<br />
Accurately control the absorbed water in the LWA. Determine the percentage of<br />
absorbed moisture above which mix water will not be absorbed during concrete batching. Apply<br />
water by sprinkling or other method to the LWA stockpile <strong>for</strong> a sufficient length of time prior to<br />
batching such that the absorbed moisture is in excess of the minimum required amount. Test the<br />
LWA as often as is necessary during batching to insure that moisture contents are within the<br />
tolerance of the given mix design.<br />
Use match curing of cylinders to predict initial strength of the concrete <strong>for</strong> precast<br />
prestressed concrete girder production. For later age testing (28-days and after) ASTM cured<br />
specimens are adequate. The 4 x 8 cylinders provide a reliable measure of compressive strength<br />
and may be used in place of 6 x 12 cylinders.<br />
Use Equation 7.1 to predict the modulus of elasticity <strong>for</strong> slate HPLC.<br />
7-4
E = 44,000<br />
c<br />
' wc<br />
fc<br />
145<br />
(7.1)<br />
where<br />
E c =<br />
concrete modulus of elasticity (psi)<br />
f c ’ =<br />
concrete compressive strength (psi)<br />
w c = unit weight of concrete (lb/ft 3 )<br />
7.8.2 Transfer Length<br />
Use the current AASHTO and ACI equations to conservatively predict transfer length in<br />
pretensioned girders constructed with slate HPLC and 0.6-in pretensioning strands. For a more<br />
accurate prediction that is still conservative, use equation 7.2.<br />
50<br />
d<br />
b<br />
6000<br />
f '<br />
ci<br />
( 7 .2 )<br />
where<br />
d b = diameter of prestressing strand<br />
f ci ' = concrete compressive strength at strand release (psi)<br />
7.8.3 Flexural Behavior<br />
Do not use the modulus of rupture test, ASTM C 78, <strong>for</strong> determining the cracking stress<br />
and cracking moment <strong>for</strong> pretensioned slate HPLC girders.<br />
More research is required to examine a potential tension strength ceiling <strong>for</strong> HPLC, as<br />
related to flexural cracking, and adjustments to lambda <strong>for</strong> concrete compressive strengths over<br />
10,000 psi.<br />
Use the current AASHTO procedure <strong>for</strong> ultimate moment calculation <strong>for</strong> slate HPLC<br />
girders with normal weight concrete decks having a compressive strength under 6,000 psi.<br />
7.8.4 Shear Behavior<br />
Use the current AASHTO Standard specification to provide a conservative prediction of<br />
concrete and ultimate shear capacity in slate HPLC pretensioned girders when shear steel<br />
capacity is capped at a yield strength of 60 ksi.<br />
7-5
More research is required to examine a potential tension strength ceiling <strong>for</strong> HPLC, as<br />
related to diagonal tension cracking, and adjustments to lambda <strong>for</strong> concrete compressive<br />
strengths over 10,000 psi. Examination of the alternate design procedure listed in ACI-318<br />
Section 11.4.2.2 <strong>for</strong> predicting shear strength, V c , is necessary <strong>for</strong> concrete compressive<br />
strengths over 10,000 psi.<br />
The AASHTO Standard Specification can be used to conservatively predict interface<br />
shear strength between slate HPLC and normal weight concrete.<br />
The AASHTO LRFD Specification can be used to conservatively predict ultimate shear<br />
strength in slate HPLC pretensioned girders.<br />
7.8.5 Development Length<br />
The current AASHTO and ACI provisions can be used to conservatively predict<br />
development length in pretensioned girders constructed with slate HPLC and 0.6-in diameter<br />
pretensioning strands. For a more accurate prediction that is still conservative, use equation 7.3.<br />
where<br />
⎛<br />
⎜<br />
⎝<br />
5000<br />
+<br />
f<br />
−<br />
⎟ ⎞<br />
⎠<br />
50 f<br />
' ps<br />
fse<br />
db<br />
ci<br />
d b = diameter of prestressing strand<br />
f ci ' = concrete compressive strength at strand release (psi)<br />
f se = effective prestressing stress after losses (psi)<br />
f ps = stress in prestressed rein<strong>for</strong>cement at nominal strength of member (psi)<br />
(7.3)<br />
In the transfer length region, use two times the stirrup density currently specified by the<br />
AASHTO Standard Specification to limit strand slip in the event of shear cracking.<br />
7.8.6 Prestress Losses<br />
The current AASHTO techniques may be used to conservatively estimate prestress losses<br />
in HPLC girders. Considering creep and shrinkage per<strong>for</strong>mance, the Shams and Kahn model<br />
was the best model <strong>for</strong> predicting long-term strains of HPLC made with locally available<br />
materials in Georgia. The AASHTO-LRFD refined method <strong>for</strong> estimating prestress losses was<br />
7-6
conservative. The AASHTO-LRFD lump sum method gave a good estimate of total losses and<br />
slightly underestimated total losses of 8,000-psi HPLC girders by 1.3%. Overall, the AASHTO-<br />
LRFD refined method may be used conservatively <strong>for</strong> predicting prestress losses in girders made<br />
of high per<strong>for</strong>mance lightweight concrete.<br />
7-7
Appendix A. Background<br />
A.1 Introduction<br />
Much research has been published on lightweight concrete, however, only a small portion<br />
of it focuses on high-strength lightweight concrete used <strong>for</strong> pretensioned bridge girders. In most<br />
cases the research involved concrete with compressive strengths less than 7,500 psi. While this<br />
research is important and in most cases relevant, it does not verify current code provisions <strong>for</strong><br />
use on high strength lightweight concretes (HSLC) commercially available today. The term high<br />
per<strong>for</strong>mance lightweight concrete (HPLC) is synonymous with HSLC. In addition, since the<br />
properties of lightweight aggregate (LWA) vary based on the raw material from which it is made<br />
and the production technique, a direct comparison is not always possible.<br />
This review provides in<strong>for</strong>mation on both HSLC and normal weight concrete. Initially,<br />
the review covers terms and definitions related to lightweight concrete. The production of slate<br />
lightweight aggregate is described and a review of the use of HSLC in prestressed bridge<br />
applications is provided. Previously developed HSLC mix designs are described and comments<br />
about their production in a field environment are discussed. The development of equations to<br />
predict transfer length in normal weight concrete is reviewed and current research on transfer<br />
length is summarized. In<strong>for</strong>mation on shear relating to findings in this research is provided as<br />
well as a review of other ongoing research. The review culminates with a summary of the<br />
development of equations to predict prestressing strand development length as well as a review<br />
of other related research.<br />
A.2 Terms and Definitions Related to <strong>Lightweight</strong> <strong>Concrete</strong><br />
The following terms are used throughout this appendix:<br />
<strong>Lightweight</strong> Aggregate (LWA) – Aggregate with a dry, loose unit weight of 70 lb/ft 3 or less.<br />
<strong>Lightweight</strong> <strong>Concrete</strong> (LWC) - A general term that includes “all-lightweight concrete” and<br />
“sand-lightweight concrete” defined below.<br />
All-<strong>Lightweight</strong> <strong>Concrete</strong> (ALWC) - <strong>Concrete</strong> containing all lightweight aggregate and does<br />
not exceed 115 lb/ft 3 .<br />
Sand-<strong>Lightweight</strong> <strong>Concrete</strong> (SLWC) - <strong>Lightweight</strong> concrete in which all the all of the fine<br />
aggregate consists of normal weight sand.<br />
A-1
Normal-Weight <strong>Concrete</strong> (NWC) - <strong>Concrete</strong> having a unit weight of approximately 145 lb/ft 3 .<br />
<strong>High</strong>-Per<strong>for</strong>mance <strong>Concrete</strong> (HPC) – <strong>Concrete</strong> having a strength over 6,000 psi and/or having<br />
durability characteristics in excess of minimally accepted standards.<br />
<strong>High</strong>-<strong>Strength</strong> <strong>Lightweight</strong> <strong>Concrete</strong> (HSLC) - <strong>Concrete</strong> meeting the conditions of<br />
lightweight concrete and having a compressive strength greater than 6,000 psi. This is the same<br />
as high per<strong>for</strong>mance lightweight concrete (HPLC).<br />
A.3 Production of Slate <strong>Lightweight</strong> Aggregate<br />
The expanded slate LWA used in this research is produced from argillite slate found in<br />
the foothills region of North Carolina east of Charlotte. Found in a geologic <strong>for</strong>mation known as<br />
the “Tillery Formation,” the slate is a thinly laminated, fine-grained siltstone composed of clastic<br />
(transported) rock fragments. The slate was from rock fragments of volcanic ash origin, which<br />
were deposited in a water environment and later solidified into solid rock. Subsequent burial and<br />
tectonic pressure changed the rock into argillite slate. Currently, the Tillery Formation is the<br />
only source of slate used to produce expanded slate LWA.<br />
<strong>Expanded</strong> slate LWA is produced using a rotary kiln approximately 11 feet in diameter<br />
and 160 feet in length. The rotary kiln is constructed on a slight incline on large bearings. The<br />
inside of the kiln is lined with insulation and a refractory material to protect the thick outer steel<br />
casing. Raw slate enters the kiln through pre-heaters that slowly heat the rock. Once in the kiln,<br />
the raw slate slowly tumbles within as it moves down the slight incline towards the “burn zone”<br />
where the raw material ultimately reaches temperatures in excess of 2200 degrees Fahrenheit.<br />
The kilns are normally heated by injecting coal dust or natural gas at the low end. In the “burn<br />
zone” the slate becomes sufficiently plastic <strong>for</strong> small gas pockets within the slate to expand<br />
<strong>for</strong>ming masses of small, unconnected cells. As the expanded slate cools, the cells remain<br />
providing the material its low unit weight and absorption characteristics. The expanded material<br />
called clinker, exits the kiln and is either air or water cooled depending on the manufacturing<br />
process and is then crushed to the desired gradations.<br />
A.4 Use of LWC <strong>for</strong> Prestressed Bridge Applications<br />
The following comments describe many of the known uses of LWC and in some cases<br />
HSLC in bridge applications. Many of the applications were not in pretensioned bridge girders,<br />
but demonstrate the feasibility of LWC and HSLC in prestressed construction.<br />
A-2
Raithby and Lydon described the use of LWC <strong>for</strong> highway bridges in North America and<br />
various countries in Europe. Their overall summary of said bridges was that per<strong>for</strong>mance was<br />
satisfactory and durability was at least as good as NWC. In cases where per<strong>for</strong>mance was not<br />
satisfactory, improper detailing or quality control was at fault. They describe several<br />
advantageous aspects of LWC including weight savings and reduced superstructure<br />
requirements, reduced cost of foundations, and reduced handling costs.<br />
Bender (1980) made many of the same conclusions as Raithby and Lydon after<br />
per<strong>for</strong>ming a cost analysis on the construction of a prestressed concrete bridge. His main<br />
assertion was that the reduced weight of LWC allowed the casting of fewer larger pieces thus<br />
less total pieces were required to be moved during construction.<br />
Brown and Davis conducted a study on the long-term per<strong>for</strong>mance of a prestressed LWC<br />
used in a bridge in Fanning Springs, Florida. Initially built in the early 1960s with 121.5-ft<br />
AASHTO Type IV girders using 6,500-psi concrete weighing 120 pcf; the bridge underwent a<br />
comprehensive load test in 1968 and again in 1992. In comparing data from the two tests, the<br />
deflections were very close. Taking into account a margin of error, there was no change in the<br />
deflection values. Overall, Brown and Davis felt the bridge per<strong>for</strong>med very well.<br />
Janssen wrote about the Shelby Creek Bridge in Pike County, Kentucky. The use of<br />
7,000 psi HSLC reduced hauling and lifting weights and reduced dead loads on the structure.<br />
The post-tensioned girders were 8.5 feet deep and were made with SLWC having a unit weight<br />
of 130 pcf.<br />
Roberts reported on the use of LWC <strong>for</strong> bridges in Cali<strong>for</strong>nia again emphasizing the<br />
importance of reduced weight. He noted that successful use of LWC demanded accurate<br />
knowledge of shrinkage, creep and modulus coefficients.<br />
Murillo, Thoman and Smith described the use of LWC <strong>for</strong> design on the Benicia-<br />
Martinez Bridge across San Pablo Bay, Cali<strong>for</strong>nia. In addition to being the least expensive<br />
alternative, the reduced weight of the structure was also more appealing from the standpoint of<br />
seismic design.<br />
A publication from the <strong>Expanded</strong> <strong>Shale</strong>, <strong>Clay</strong> and Slate Institute (ESCSI) provided a<br />
listing of the most significant uses of LWC <strong>for</strong> bridges worldwide. Of particular note were three<br />
bridges using pretensioned bridge girders including the Coronado Bay Bridge in Cali<strong>for</strong>nia, the<br />
Lewiston Pump-Generating Plant Bridge in New York, and the Sebastian Inlet Bridge in Florida.<br />
A-3
All constructed in the 1960s, the bridge girders used LWC with a compressive strength between<br />
5,000 and 6,000 psi. When the publication was issued in 1994, all the bridges were reported to<br />
be in excellent condition.<br />
Melby, Jordet and Hansvold described the use of HSLC <strong>for</strong> long-span bridges in Norway.<br />
The authors commented that LWC has been used <strong>for</strong> bridges in Norway since 1987. Their<br />
recommendations focused on testing mix designs thoroughly and ensuring excellent quality<br />
control to obtain consistent properties. They stated that the use of LWC was economical <strong>for</strong> long<br />
span bridges, but that bridge geometry would determine the amount of savings. Compressive<br />
strengths up to 8,700 psi with a unit weight of 125 pcf were successfully used to construct the<br />
Raftsundet Bridge.<br />
Holm and Bremner noted that LWC was a very promising alternative <strong>for</strong> the replacement<br />
of functionally obsolete bridges throughout the United States. In many cases, the use of LWC<br />
<strong>for</strong> deck replacement would allow upgrading bridge capacity based on lower deck dead load.<br />
The authors cited as an example the Woodrow Wilson Memorial Bridge in Washington, D. C.<br />
By replacing the bridge deck with LWC, engineers reduced the dead load on the structure and<br />
were able to add an additional lane of traffic without exceeding the load carrying capacity of the<br />
structure.<br />
2.5 HSLC Mix Designs<br />
A.5.1 Coarse Aggregate<br />
Coarse aggregate is a primary factor in developing a mix design that is lightweight, highstrength,<br />
and cost effective. Manufactured lightweight coarse aggregates include expanded<br />
clays, expanded shales, expanded slates, expanded perlite, exfoliated vermiculite, and sintered<br />
fly ash. <strong>Lightweight</strong> coarse aggregates also occur naturally in the <strong>for</strong>m of pumice and tuff.<br />
Depending on the source of the aggregate, the particle shape and surface texture vary<br />
significantly impacting all other aspects of the mix design and the placement characteristics of<br />
the concrete. Numerous authors commented on the need <strong>for</strong> specifications by particular<br />
aggregate manufacturer or source with respect to design characteristics.<br />
The raw material from which the LWA is produced determines the strength of the<br />
aggregate and thus the strength that can be achieved in the concrete. <strong>Expanded</strong> slate aggregates<br />
A-4
are normally recognized as being one of the LWA products able to produce the highest<br />
compressive strength and modulus of elasticity.<br />
The porosity of the LWA determines the degree to which the aggregate will absorb and<br />
release water and varies significantly between LWA types. Based on an absorption test using<br />
ASTM C 127 and ASTM C 128, the absorption of LWA can vary from 5 percent to over 25<br />
percent moisture by mass of dry aggregate as compared to less than 2 percent <strong>for</strong> normal weight<br />
aggregate (Holm and Bremner 2000). Knowledge of the exact absorption characteristics of the<br />
chosen LWA is important in properly batching LWC. In addition, handling and quality control<br />
must be more exact when working with LWA. Bremner and Newman (1982) found that the<br />
internal microstructure of each type of LWA was independent of the source.<br />
A reduction in the maximum size of coarse aggregate can increase compressive strength<br />
without increasing the cement content or reducing the water-cement ratio.<br />
A.5.2 Fine Aggregate<br />
The addition of fine LWA to a mix design further lowers the unit weight of the concrete;<br />
however, other characteristics are impacted. In a study by Pfeifer, various amounts of the<br />
lightweight fine aggregate fraction were replaced with normal weight sand. The results showed<br />
that increasing the proportion of normal weight sand increased both compressive strength and<br />
modulus of elasticity.<br />
A.5.3 Portland Cement<br />
In HSLC mixes, the cement paste matrix must carry a higher portion of the load imposed<br />
on the concrete. As the strength limit of the cement paste matrix is reached, strength of the<br />
aggregate and interface between the aggregate and cement paste become the limiting factors.<br />
The type of cement used in the mix determined its curing characteristics. Use of a Type<br />
I/II cement results in lower initial strengths, but slightly higher strengths after 28 days. The use<br />
of Type III cement yields higher compressive strengths initially, which was desirable <strong>for</strong><br />
prestressed construction, but results in slightly lower strengths at 28 days compared to Type I/II.<br />
A.5.4 Silica Fume<br />
The inclusion of silica fume in LWC mix designs was reported to significantly improve<br />
strength and other per<strong>for</strong>mance characteristics. Fujii et al. reported results of a study where they<br />
A-5
showed a silica fume blended cement to provide superior strength results compared to a beliterich<br />
cement. In a study including high-strength NWC and HSLC, Leming reported that silica<br />
fume was particularly effective in increasing the compressive strength of any concrete. Mor<br />
reported the dramatically improved bond strength between LWC and rein<strong>for</strong>cing steel based on<br />
the use of silica fume, an occurrence that was verified during this research.<br />
A.5.5 Moisture Content<br />
Control of moisture in HSLC is critical. In order to produce concrete having the water to<br />
cementitious materials ratio desired, the exact absorbed (moisture within the pore structure of the<br />
LWA) and adsorbed (moisture on the outside surface of the LWA – free moisture) moisture of<br />
the aggregate must be known. The amount of absorbed moisture directly impacts the specific<br />
gravity of the LWA as proportioned and mixed. Smeplass made this point very clear by stating<br />
“The consequence of this observation may be that the mix water absorption of LWA must be<br />
determined in the actual initial moisture condition, as under concrete production, and as often as<br />
necessary to detect variation.”<br />
Based on the porosity of LWA, the determination of absorbed moisture content and<br />
specific gravity must be handled differently than with normal weight aggregate. Holm and<br />
Valsangkar suggested a 1-day soak of LWA prior to determining specific gravity using a<br />
pycnometer. After soaking the aggregate <strong>for</strong> 24 hours, the additional water absorbed in the<br />
pycnometer during specific gravity testing is minimal. Based on the then determined absorbed<br />
moisture content, the dry specific gravity could be determined by dividing the 24-hour soak<br />
specific gravity by (1 + absorbed moisture content).<br />
A.5.6 Mix Proportioning<br />
Mix proportioning of LWC is covered in ACI 211.2-91. The current guide does not<br />
cover mix designs <strong>for</strong> concrete in excess of 6,000 psi strength.<br />
A.6 Field Production of HSLC<br />
Comments on field production of HSLC were limited. Holm and Bremner (2000)<br />
suggested four basic principles including well-proportioned, workable mixtures that use a<br />
minimum amount of water, equipment capable of expeditiously moving the concrete, proper<br />
consolidation in the <strong>for</strong>ms, and quality workmanship in finishing. They suggested that the<br />
A-6
aggregate must be saturated by presoaking if the concrete is to be pumped. In the event of dry<br />
aggregate, pumping could <strong>for</strong>ce mix water into the LWA pores reducing the workability of the<br />
mix.<br />
Valum and Nilsskog reported on field production of HSLC having a compressive strength<br />
of 8,700 psi <strong>for</strong> the construction of the Raftsundet Bridge in Norway. Field production included<br />
steps to insure expanded slate aggregate absorption was maintained between 7 and 9 percent to<br />
prevent mix water absorption. The time from batching until concrete placement could be as long<br />
as 2 hours. In addition, bulk density and surface moisture were determined prior to each<br />
concrete placement to insure proper mix proportioning. Prior to a concrete truck leaving the<br />
batch plant, concrete temperature, slump, air content and wet density were checked <strong>for</strong><br />
compliance with design specifications. Any results out of specification resulted in the mix being<br />
discarded. While these standards would be common <strong>for</strong> the production of normal weight HPC,<br />
the more exacting control of aggregate moisture content was evident <strong>for</strong> HSLC. In addition,<br />
exact control of moisture also enabled better control of unit weight.<br />
Hoff described field production of HSLC <strong>for</strong> offshore plat<strong>for</strong>m construction. Many of<br />
the same steps were followed as mentioned by Valum and Nilsskog. Hoff reiterated the<br />
importance of moisture control and the impact it could have on slump loss during placement and<br />
also commented that excessive moisture could result in unsuitable resistance to freezing and<br />
thawing damage.<br />
A.7 HSLC Short and Long-Term Material Properties<br />
The following sections address specific material properties and material related<br />
phenomenon where differences were noted between HSLC and NWC.<br />
2.7.1 Modulus of Elasticity<br />
An in-depth explanation of the determination of modulus of elasticity is covered in<br />
Chapter 3, Analytical Investigation on HSLC <strong>for</strong> Pretensioned Bridge Girders.<br />
The current ACI equation <strong>for</strong> modulus of elasticity is:<br />
E<br />
c =<br />
33w<br />
1.5<br />
c<br />
f<br />
'<br />
c<br />
( A.1)<br />
where<br />
E c =<br />
concrete modulus of elasticity (psi)<br />
A-7
f c ’ = concrete compressive strength (psi)<br />
w c = unit weight of concrete (lb/ft 3 )<br />
An equation by Morales (Equation A.2) was suggested <strong>for</strong> use with lightweight concrete.<br />
E<br />
c<br />
= (40,000<br />
f<br />
'<br />
c<br />
⎛ wc<br />
⎞<br />
+ 1,000,000) ⎜ ⎟<br />
⎝145<br />
⎠<br />
1.5<br />
( A.2)<br />
Table A.1 lists compressive strengths, dry (equilibrium) unit weights and modulus values<br />
reported by various authors <strong>for</strong> slate HSLC mix designs having compressive strengths between<br />
6,000 and 12,000 psi.<br />
Table A.1 Reported <strong>Strength</strong>, Weight and Elasticity Modulus Values <strong>for</strong> Slate HSLC<br />
Author(s) or<br />
Source<br />
Compressive<br />
<strong>Strength</strong><br />
f c ’<br />
(psi)<br />
Dry Unit<br />
Weight<br />
w<br />
(pcf)<br />
Modulus of<br />
Elasticity<br />
E c<br />
(million psi)<br />
Brown<br />
Davis<br />
6,500 120 3.90<br />
Leming 7,180 116.4 3.58<br />
FIP Committee 7,500 118.6 3.55<br />
Harmon 8,170 111.7 3.27<br />
Bilodeau<br />
Chevrier<br />
Malhotra<br />
Hoff<br />
9,090 119.2 4.06<br />
Valum<br />
Nilsskog<br />
9,550 123.0 3.41<br />
Mor 9,650 130.0 3.91<br />
Holm<br />
Bremner<br />
9,856 117.0 3.50<br />
Carolina Stalite Company 10,281 126.0 4.10<br />
Harmon 10,980 119.2 3.95<br />
Harmon 11,500 134.0 4.40<br />
Carolina Stalite Company 11,588 132.0 4.40<br />
Harmon 11,850 122.0 4.56<br />
A-8
A.7.2 <strong>Strength</strong> Ceiling<br />
Harmon discussed a strength ceiling <strong>for</strong> HSLC being in the region of 12,000 to 13,000<br />
psi based on the limiting strength of the slate LWA. Holm also discussed the strength ceiling<br />
with respect to smaller maximum size of aggregate. As the maximum size of aggregate is<br />
reduced, strength increases to some upper limit determined by the strength ceiling. Beyond the<br />
strength ceiling, additional binder does not increase the concrete’s strength.<br />
Bremner and Holm addressed the elastic mismatch between LWA and the high-strength<br />
cement paste matrix. As the HSLC strength increases, the difference between the elasticity<br />
modulus values becomes more pronounced. Under load, the “elastic mismatch” results in<br />
fracture that begins as transverse splitting of the LWA. This splitting action is indirectly<br />
responsible <strong>for</strong> the strength ceiling of HSLC.<br />
Holm also reported a tensile strength ceiling <strong>for</strong> LWC. Since the LWA is approximately<br />
one half voids, its tensile strength will be reduced in comparison to NWA. Holm suggested the<br />
LWA tensile strength ceiling might also be responsible <strong>for</strong> compression strength limitations.<br />
A.7.3 Internal Curing<br />
Internal curing results when absorbed water in the LWA provides an internal reservoir to<br />
enhance cement hydration and extend the curing process. Several authors have commented on<br />
this phenomenon as related to LWC and HSLC. Bremner, Holm and Ries per<strong>for</strong>med a study in<br />
which LWA was added to NWC mixes to provide additional internal cure water in mixes having<br />
strengths from 6,400 psi to 8,700 psi. The internal curing is reported to not only add in strength<br />
gain, but positively impacts durability characteristics by providing a higher quality and denser<br />
matrix.<br />
A.8 Transfer Length<br />
Transfer length (l t ) is defined as the distance required to transfer the effective prestressing<br />
<strong>for</strong>ce from the strand to the surrounding concrete. The transfer length is developed when the<br />
pretensioning strands are released by flame cutting or other method from the restraining<br />
abutments. Numerous factors are thought to contribute to determining the transfer length<br />
including size and surface condition of the prestressing strand, concrete strength and modulus of<br />
elasticity at time of strand release, level of prestressing in the strand, and the amount of confining<br />
A-9
steel and concrete consolidation in the transfer length region. Many experimental programs have<br />
focused on the above factors in determining a relation to predict transfer length.<br />
The Master’s Thesis by Chris Reutlinger, “Direct Pull-Out Capacity and Transfer Length<br />
of 0.6-Inch Diameter Prestressing Strand in <strong>High</strong> Per<strong>for</strong>mance <strong>Concrete</strong>” provides very thorough<br />
coverage of the history and development of equations to predict transfer length. The following is<br />
a summary of current code provisions and other proposed equations as determined <strong>for</strong> NWC.<br />
There are no known proposed equations specifically addressing transfer length <strong>for</strong> HSLC.<br />
A.8.1 Janney, 1954<br />
Initial transfer length testing by Janney in 1954 concluded that transfer length and the<br />
general shape of the stress transfer distribution were attributable to diameter and surface<br />
condition of the prestressing wire and concrete strength. Janney did not suggest a relation <strong>for</strong><br />
predicting transfer length.<br />
A.8.2 Hanson and Kaar, 1959<br />
Although the focus of Hanson and Kaar’s work was on flexural bond, an appendix<br />
included comments on an assumed average transfer bond stress of 400 psi. Equation A.3 was<br />
proposed as a way to determine the transfer bond stress.<br />
u<br />
t<br />
=<br />
A<br />
ps<br />
Σ<br />
f<br />
l<br />
0 t<br />
se<br />
( A.3)<br />
A ps is the area of prestressing strand, f se is the effective prestressing stress at transfer, Σ o is the<br />
actual perimeter of the prestressing strand, l t is the transfer length and u t is the transfer bond<br />
stress.<br />
A.8.3 Kaar, LaFraugh and Mass, 1963<br />
Kaar et al. concluded that transfer length varied directly based on strand diameter <strong>for</strong> ¼-<br />
inch and ½-inch strands but did not follow this same direct proportion <strong>for</strong> 0.6-inch strand. Kaar<br />
et al. found concrete strength did not impact transfer length, but affected the shape of the stress<br />
distribution. <strong>High</strong>er concrete strength allowed the concrete to pick up stress more quickly when<br />
A-10
compared to lower strength specimens. Kaar et al. also reported differences in transfer length<br />
between “dead” and “cut” ends.<br />
A.8.4 Mattock, 1963<br />
In 1963, Mattock used Equation A.3 with an assumed average transfer bond stress of 400<br />
psi to derive the current ACI-319-99 equation <strong>for</strong> transfer length. The factors 0.725 and 4/3 were<br />
used to determine the actual area and perimeter respectively.<br />
l<br />
⎛<br />
2<br />
d ⎞<br />
⎜ π<br />
b<br />
0.725 ⎟ f<br />
⎜ 4 ⎟<br />
=<br />
⎝<br />
⎠<br />
⎛ 4 ⎞<br />
⎜ π db<br />
⎟0.4<br />
⎝ 3 ⎠<br />
se<br />
t<br />
=<br />
1<br />
2.94<br />
f<br />
se<br />
d<br />
b<br />
( A.4)<br />
where<br />
d b =<br />
diameter of prestressing strand<br />
f se =<br />
effective prestressing stress after losses (psi)<br />
Equation A.4 was simplified to Equation A.5, which is the current ACI expression.<br />
l<br />
t<br />
=<br />
f<br />
se<br />
3<br />
d<br />
b<br />
( A.5)<br />
Mattock assumed the effective stress, f se , <strong>for</strong> 250 ksi strand was 150 ksi and further simplified<br />
Equation A.5 to Equation A.6, which was adopted by ACI in 1963 and AASHTO 40 in 1973.<br />
l<br />
t<br />
=<br />
50d<br />
( A.6)<br />
b<br />
Equation A.6, currently maintained by AASHTO, is based on a limited number of tests where<br />
strand ultimate strengths were less than products available today.<br />
A-11
A.8.5 Martin and Scott, 1976<br />
Martin and Scott re-evaluated previous testing by Hanson and Kaar based on prestressing<br />
strand having an ultimate strength, f pu , of 270 ksi, and commonly encountered strand surface<br />
conditions, and they recommended the implementation of Equation A.7.<br />
l<br />
t<br />
=<br />
80 d<br />
( A.7)<br />
b<br />
A.8.6 Zia and Mostafa, 1977<br />
Based on an extensive review of transfer length testing, Zia and Mostafa proposed<br />
Equation A.8 to account <strong>for</strong> the effects of strand diameter, initial level of prestress, and concrete<br />
strength at transfer. Equation A.9 was reported to be applicable <strong>for</strong> concrete strengths from<br />
2,000 to 8,000 psi. This evaluation is reported in Chapter 9.<br />
where<br />
d b = diameter of prestressing strand<br />
f si = stress in prestressing strands just after release<br />
f ci ’ = concrete compressive strength at release (psi)<br />
l<br />
t<br />
f<br />
si<br />
= 1 .5 d 4.6<br />
( A.8)<br />
' b<br />
−<br />
f<br />
ci<br />
A.8.7 FHWA Memorandum, 1988<br />
Based on testing at the University of North Carolina in 1986 where poor transfer and<br />
development length results were recorded, the FHWA issued a memorandum specifying four<br />
interim restrictions, one of which was the restriction from using 0.6-inch prestressing strand.<br />
This restriction prevented the prestressed concrete industry from fully utilizing the benefits of<br />
higher strength concretes in larger members. Several research programs were initiated based on<br />
the FHWA restrictions.<br />
A-12
A.8.8 Deatherage, Burdette and Chew, 1989<br />
Deatherage et al. conducted experimental testing on 20 AASHTO Type I girders with<br />
varying strand diameters and spacings. Their conclusions were that 0.6-inch diameter strand<br />
should be allowed and that strand spacing of 1.75 inches should be allowed <strong>for</strong> ½-inch diameter<br />
strand. Equation A.9 was suggested <strong>for</strong> the calculation of transfer length <strong>for</strong> ½-inch, ½-inch<br />
special and 9 / 16 -inch diameter prestressing strand. Equation A.9 was conservative and acceptable<br />
<strong>for</strong> use on 0.6-inch strand, but further research was recommended.<br />
l<br />
t<br />
=<br />
f<br />
si<br />
3<br />
d<br />
b<br />
( A.9)<br />
A.8.9 Russell, 1992<br />
Russell per<strong>for</strong>med an extensive series of testing of rectangular, scale model AASHTOtype<br />
and full-sized Texas Type C cross sections as part of a PhD Thesis under the supervision of<br />
Dr. Ned Burns. The specimens were all prestressed with ½-inch or 0.6-inch strand spaced at 2<br />
inches, except <strong>for</strong> three rectangular sections that were prestressed with 0.6-inch strand spaced at<br />
2.25 inches. In many of the specimens, strands were debonded to various distances from the<br />
girder ends. Russell concluded that larger cross sections had shorter transfer lengths, larger<br />
strand diameters required longer transfer lengths, strand spacing greater than 2 inches <strong>for</strong> 0.6-<br />
inch strand was not required, debonded strands had transfer lengths similar to fully bonded,<br />
strands and confining rein<strong>for</strong>cement did not affect transfer length. Russell suggested Equation<br />
A.10 <strong>for</strong> predicting transfer length.<br />
where<br />
f se =<br />
l<br />
t<br />
=<br />
effective prestressing stress after losses (psi)<br />
f<br />
se<br />
2<br />
d<br />
b<br />
( A.10)<br />
A-13
2.8.10 Mitchell, Cook, Khan and Tham, 1993<br />
Mitchell et al. based their research on determining the effect of concrete strength on<br />
transfer length. They examined strand diameters of 3/8-inch, 1/2-inch and 0.6-inch used to<br />
prestress rectangular sections made using normal weight concretes having strengths from 4,500<br />
to 12,900 psi at 28 days. The method of strand release was gradual which was reported to<br />
provide a better comparison to the sudden strand release used in most prestressing operations.<br />
Based on their results, Mitchell et al. proposed Equation A.11.<br />
l<br />
t<br />
=<br />
3<br />
0 .33 f<br />
si<br />
d<br />
b<br />
( A.11)<br />
'<br />
f<br />
ci<br />
A.8.11 Buckner, 1994<br />
Buckner noted that inconsistencies existed between the methods used by various<br />
researchers to determine transfer length. After an evaluation of results, Buckner concluded that<br />
the 95 Percent Average Mean Strain (AMS) Method provided the best overall prediction of<br />
transfer length. Furthermore, he recommended Equation A.12 <strong>for</strong> predicting transfer length.<br />
Buckner noted that 1250/E ci was about 3 <strong>for</strong> compressive strengths greater than 3,500 psi; thus,<br />
his findings endorsed Equation A.9 as well.<br />
where<br />
E ci =<br />
l<br />
t<br />
=<br />
1250 f<br />
concrete modulus of elasticity at release (psi)<br />
E<br />
ci<br />
si<br />
d<br />
b<br />
( A.12)<br />
A.8.12 FHWA Study, 1996<br />
In addition to the numerous studies a<strong>for</strong>ementioned, the FHWA also published findings<br />
from their own study addressing the bond of prestressing strand in NWC and HPC. The FHWA<br />
study addressed the following variables:<br />
1. <strong>Concrete</strong> compressive strength at 28 days, f c ’<br />
2. Square root of concrete compressive strength at 28 days, √f c ’<br />
A-14
3. <strong>Concrete</strong> compressive strength at transfer, f ci ’<br />
4. Square root of concrete compressive strength at transfer, √f ci ’<br />
5. <strong>Concrete</strong> modulus of elasticity at 28 days, E c<br />
6. <strong>Concrete</strong> modulus of elasticity at transfer, E ci<br />
7. Prestressing strand diameter<br />
8. Prestressing strand area<br />
9. Stress in prestressing strand prior to transfer, f si<br />
10. Effective prestress, f se<br />
Based on FHWA results and their analysis of other research results, the restriction on the use of<br />
0.6-inch strand was lifted. The FHWA proposed Equations A.13 and A.14 <strong>for</strong> “best-fit” and to<br />
provide a 95% confidence interval, respectively.<br />
l<br />
t<br />
f<br />
pt<br />
d<br />
b<br />
= 4 − 21<br />
( A.13)<br />
'<br />
f<br />
c<br />
where<br />
l<br />
t<br />
f<br />
pt<br />
db<br />
= 4 − 5<br />
( A.14)<br />
'<br />
f<br />
d b = diameter of prestressing strand (in.)<br />
f c ’ = concrete compressive strength (psi)<br />
f pt = stress in prestressing strand just prior to strand release (psi)<br />
c<br />
A.9 Flexural Behavior<br />
A review indicates that only limited research has been conducted on the flexural behavior<br />
of composite HSLC girders. Prior to the onset of flexural cracking and the point at which<br />
flexural cracking occurs, the behavior of the HSLC is important. Beyond the cracking state, the<br />
behavior of the NWC deck is the governing concern. To the authors’ knowledge, no background<br />
in<strong>for</strong>mation was available related to the findings and conclusions identified in this research <strong>for</strong><br />
flexural behavior. The general flexural behavior of normal weight prestressed composite girders<br />
made with normal strength concrete is well understood and discussed in standard text books.<br />
A-15
A.10 Shear Behavior<br />
Similar to flexural behavior, only a limited amount of research has been conducted on<br />
prestressed HSLC. Comments are provided <strong>for</strong> both HSLC and normal weight HPC as well as<br />
<strong>for</strong> LWC as applicable to this research.<br />
A.10.1 Hanson, 1961<br />
The origination of the lambda factor <strong>for</strong> use with LWC was based on work done by<br />
Hanson. Using the results of testing per<strong>for</strong>med at PCA and at the University of Texas, Hanson<br />
determined a good correlation between diagonal tensile strength in beams with the splitting<br />
tension test. Hanson then determined that the ratio of splitting tension strength in lightweight<br />
concrete to that <strong>for</strong> normal weight concrete of the same compression strength was in general<br />
about 0.85 <strong>for</strong> concrete strengths below 5,000 psi. This relation was first reported in the 1963<br />
ACI 318 Code. In the early 1970’s, the reduction factor was <strong>for</strong>malized as lambda, λ, as 0.85 <strong>for</strong><br />
sand LWC and 0.75 <strong>for</strong> all LWC. Based on the high degree of variability of LWA, concerns<br />
exist today that the lambda factors may become unconservative <strong>for</strong> concrete strengths over 5,000<br />
psi (Holm, 2002).<br />
A.10.2 Johnson and Ramirez, 1989<br />
Johnson and Ramirez conducted research on non-prestressed beams, but made some<br />
observations that may be applicable <strong>for</strong> prestressed HSLC and normal weight HPC. One<br />
conclusion reached in their research was that in higher strength beams, shear rein<strong>for</strong>cement<br />
spacing was greater creating a deficiency in reserve shear strength. Once the upper limit of<br />
concrete shear capacity was exceeded, the shear <strong>for</strong>ce transferred to shear rein<strong>for</strong>cement would<br />
cause it to yield and rupture. They suggested applying either an upper limit to the term (f c ’) 1/2 to<br />
limit the increase in V c due to increasing f c ’ or increasing the minimum shear rein<strong>for</strong>cement<br />
requirement as concrete strength increases. The 1989 ACI 318 code has included a specification<br />
reflecting this recommendation.<br />
A.10.3 Shahawy and Batchelor, 1996<br />
Shahawy and Batchelor conducted a research program examining the shear behavior of<br />
full-scale prestressed concrete girders made from 6,000 psi NWC. Of particular interest in their<br />
A-16
findings were comments that the AASHTO LRFD provisions <strong>for</strong> shear were very conservative<br />
and required modification to improve their reliability.<br />
A.10.4 Barnes, Burns and Kreger, 1999<br />
Barnes, Burns and Kreger conducted an extensive research program at the University of<br />
Texas at Austin using 0.6-inch diameter prestressing strand in I-shaped prestressed girders made<br />
with normal weight HPC having strengths from 5,000 to 11,000 psi. The authors recommended<br />
limiting the principal tensile stress in the region from the composite section centroid to the<br />
extreme tensile fiber to 4(f c ’) 1/2 . This recommendation corresponds with ACI 318-99 Section<br />
11.4.2.2 but extends the applicable area to include the section from the composite centroid to the<br />
extreme tension fiber.<br />
A.10.5 Ma, Tadros and Baishya, 2000<br />
Ma, Tadros, and Baishya examined shear behavior in pretensioned I-girders made with<br />
8,000 psi normal weight HPC. They concluded that both the AASHTO Standard and LRFD<br />
Specifications produced conservative predictions of girder shear capacity. When considering the<br />
results of their study, it must be recognized that prestressing strands were anchored in end<br />
diaphragms thus eliminating the possibility of slip and possibly increasing shear capacity at the<br />
girder ends.<br />
A.10.6 Ramirez, Olek, Rolle, and Malone, 2000<br />
Ramirez, Olek, Rolle, and Malone conducted research on HSLC pretensioned girders<br />
made with ½-inch, and 0.6-inch diameter prestressing strands. The HSLC was made using<br />
expanded shale aggregate; the resulting concrete strengths ranged from 6,500 to 10,000 psi. The<br />
research at Purdue is thought to be the only other research conducted using 0.6-inch diameter<br />
prestressing strand in HSLC. As with Ma, Tadros and Baishya (2000), an additional 1-meter<br />
anchorage was provided <strong>for</strong> the prestressing strand behind the center of bearing. Their<br />
conclusions related to shear were that the current AASHTO Standard and LRFD procedures<br />
were conservative <strong>for</strong> shear. Additionally they reported that the minimum amount of shear<br />
rein<strong>for</strong>cement <strong>for</strong> HSLC pretensioned girders must be further investigated based on a lower ratio<br />
of measured/calculated shear capacity with increased concrete strength.<br />
A-17
A.10.7 ACI Committee 213, 2001<br />
In a draft copy of Chapter 5, ACI 213, shear and diagonal tension strength is covered in<br />
Section 5.8. Committee 213 reports that lightweight concrete members behave in fundamentally<br />
the same manner as normal weight concrete members. They recommend that the permissible<br />
shear capacity may be determined by substituting the splitting tensile strength, f ct /6.7 <strong>for</strong> (f c ’) 1/2<br />
in the shear provisions of Chapter 11, ACI 318.<br />
A.11 Development Length<br />
Development length of prestressing strands is the sum of the transfer length and the<br />
flexural bond length. Development length can be defined as the minimum distance from the end<br />
of the member beyond which the application of a point load will result in a flexural failure. As<br />
in transfer length, many factors are thought to affect development length. Many experimental<br />
programs have addressed development length resulting in suggested equations <strong>for</strong> its prediction.<br />
The Master’s Thesis by Chris Reutlinger, “Direct Pull-Out Capacity and Transfer Length<br />
of 0.6-inch diameter Prestressing Strand in <strong>High</strong> Per<strong>for</strong>mance <strong>Concrete</strong>” provides very thorough<br />
coverage of the history and development of equations to predict development length. The<br />
following is a summary of current code provisions and other proposed equations as determined<br />
<strong>for</strong> NWC. The summary closely mirrors the development of transfer length equations. There are<br />
no known equations specifically addressing development length <strong>for</strong> HSLC.<br />
A.11.1 Janney, 1954<br />
Initial development length testing by Janney in 1954 was based on the use of 5/16-inch<br />
wire having two different surface conditions prestressed to 0, 60, 120 and 165 ksi in beams made<br />
with NWC having strengths from 4,500 to 4,800 psi. Janney reported a “wave of flexural bond<br />
stress concentration” and noted that once general bond slip occurred, the beam failed shortly<br />
thereafter. Janney contributed bond in the transfer region predominantly to the Hoyer effect,<br />
which was the confining pressure applied to the wire by the concrete. Janney also reported<br />
improved bond characteristics <strong>for</strong> slightly rusted wire.<br />
A.11.2 Hanson and Kaar, 1959<br />
Hanson and Kaar conducted a study involving 47 small-scale concrete beams rein<strong>for</strong>ced<br />
with various sizes of Grade 250 stress-relieved strand. The tests focused on five factors<br />
A-18
including strand diameter, embedment length, concrete strength, percentage of rein<strong>for</strong>cement,<br />
and strand surface condition. All beams were loaded until failure. Hanson and Kaar reported<br />
observations similar to those of Janney. The results of Hanson and Kaar’s research were the basis<br />
<strong>for</strong> the current AASHTO development length expression shown in Equation A.16 and developed<br />
by Mattock. Equation A.15 simplifies to Equation A.16.<br />
l<br />
d<br />
= l<br />
t<br />
+ l<br />
fb<br />
=<br />
f<br />
se<br />
3<br />
d<br />
b<br />
+ ( f<br />
*<br />
su<br />
−<br />
f<br />
se<br />
) d<br />
b<br />
( A.15)<br />
l<br />
d<br />
= ( f<br />
*<br />
su<br />
−<br />
2<br />
3<br />
f<br />
se<br />
) d<br />
b<br />
( A.16)<br />
where<br />
l d =<br />
development length of prestressing strand (in.)<br />
l fb =<br />
flexural bond length (in.)<br />
l t =<br />
transfer length of prestressing strand (in.)<br />
d b =<br />
diameter of prestressing strand (in.)<br />
f se =<br />
effective prestressing stress after losses (psi)<br />
f su *=<br />
stress in prestressed rein<strong>for</strong>cement at nominal strength of member (psi)<br />
Shortly after the development of Equation A.16 concerns developed based on the introduction<br />
and common use of Grade 270 prestressing strand.<br />
A.11.3 Martin and Scott, 1976<br />
Martin and Scott re-evaluated the currently suggested equation (Equation A.16) and<br />
determined that inconsistencies may have been responsible <strong>for</strong> the collapse of a 20-ft span slab<br />
under construction loads. They suggested two new equations that did not determine<br />
development length, but specified a maximum strand stress based on a given embedment length.<br />
The two equations are shown below <strong>for</strong> the given location l x .<br />
For l x less than 80d b :<br />
A-19
f<br />
*<br />
su<br />
lx<br />
≤<br />
80d<br />
b<br />
⎛ ⎞<br />
⎜135<br />
⎟<br />
⎜ + 31<br />
1 ⎟<br />
⎜ 6<br />
d<br />
⎟<br />
⎝ b ⎠<br />
( A.17)<br />
For l x greater than 80d b :<br />
f<br />
135<br />
≤<br />
*<br />
su<br />
+<br />
1<br />
6<br />
db<br />
0.39l<br />
d<br />
b<br />
x<br />
( A.18)<br />
Equation A.18 was rewritten in terms of l x in Table A.1 given in section A.11.14, Summary.<br />
A.11.4 Zia and Mostafa, 1977<br />
Zia and Mostafa also realizing the inconsistencies with Equation A.16 suggested a new<br />
equation as well (Equation A.19) which incorporated their suggested transfer length equation,<br />
Equation A.8.<br />
l<br />
d<br />
= l<br />
t<br />
+ l<br />
fb<br />
⎛<br />
= ⎜<br />
1.5<br />
⎝<br />
f<br />
f<br />
si<br />
'<br />
ci<br />
d<br />
b<br />
⎞<br />
− 4.6⎟<br />
+ 1.25( f<br />
⎠<br />
*<br />
su<br />
−<br />
f<br />
se<br />
) d<br />
b<br />
( A.19)<br />
A.11.5 FHWA Memorandum, 1988<br />
Based on testing at the University of North Carolina in 1986 where poor transfer and<br />
development length results were recorded, the FHWA issued a memorandum specifying 4<br />
interim restrictions as listed in Section A.8.7. Several research programs were initiated based on<br />
the FHWA restrictions.<br />
A.11.6 Deatherage, Burdette and Chew, 1989<br />
Deatherage et al. conducted experimental testing on 20 AASHTO Type I girders with<br />
varying strand diameters and strand spacings and concrete design strengths of 5,000 psi. They<br />
suggested the flexural bond component suggested by AASHTO should be increased by 50<br />
percent as shown in Equation A.20 below.<br />
A-20
l<br />
d<br />
= l<br />
t<br />
+ l<br />
fb<br />
=<br />
f<br />
si<br />
3<br />
d<br />
b<br />
+ 1.50( f<br />
*<br />
su<br />
−<br />
f<br />
se<br />
) d<br />
b<br />
( A.20)<br />
A.11.7 Russell, 1992<br />
Russell per<strong>for</strong>med an extensive series of testing of rectangular, scale model AASHTOtype<br />
and full-sized Texas Type C cross sections as part of a PhD Thesis under the supervision of<br />
Dr. Ned Burns. The specimens were all prestressed with ½-inch or 0.6-inch strand spaced at 2<br />
inches except three rectangular sections that were prestressed with 0.6-inch strand spaced at 2.25<br />
inches. In many of the specimens, strands were debonded to various distances from the girder<br />
ends. Russell concluded that “shear cracking through the transfer region will cause its bond to<br />
fail and that if cracks do not occur that the strand will develop is prestressing <strong>for</strong>ce plus any<br />
additional tension required by external loads.” To prevent cracking from occurring through the<br />
transfer region, Russell developed the criteria listed in Equation A.21 where l t was calculated<br />
using Equation A.10.<br />
where<br />
M<br />
cr<br />
><br />
l V<br />
M cr = Cracking moment capacity of a member<br />
V u = Ultimate shear <strong>for</strong>ce at the critical section<br />
t<br />
u<br />
(A.21)<br />
In addition, Russell specified that if V u >V cw that vertical and longitudinal mild steel shear<br />
rein<strong>for</strong>cement should be provided to prevent web shear cracking from passing through the<br />
transfer region (V cw is the shear <strong>for</strong>ce causing web-shear cracking).<br />
2.11.8 Mitchell, Cook, Khan and Tham, 1993<br />
Mitchell et al. based their research on determining the effect of concrete strength on<br />
development length. They examined strand diameters of 3 / 8 -inch, ½-inch and 0.6-inch used to<br />
prestress rectangular sections made using concretes having strengths from 3,000 to 7,310 psi at<br />
release and from 4,500 to 12,900 psi at 28 days. Based on experimental results, Equation A.22<br />
was suggested.<br />
A-21
l<br />
d<br />
3<br />
4.5<br />
= 0 .33 f<br />
si<br />
d<br />
b<br />
+ ( f f ) d<br />
' su<br />
−<br />
se b '<br />
f<br />
f<br />
ci<br />
c<br />
( A.22)<br />
A.11.9 Buckner, 1994<br />
Buckner noted that there was an interaction between transfer length, effective prestress<br />
and design stress. Buckner recommended using a procedure similar to that of Hanson and Kaar.<br />
He also theorized that the development length expression should be based also on ultimate strain<br />
and suggested Equations A.23 and A.24.<br />
l<br />
d<br />
f<br />
si<br />
d<br />
b<br />
= lt<br />
+ l<br />
fb<br />
= + λ ( f<br />
3<br />
*<br />
su<br />
−<br />
f<br />
se<br />
) d<br />
b<br />
( A.23)<br />
1.0<br />
≤ [ λ = (0.6 + 40ε<br />
)] ≤ 2.0<br />
( A.24)<br />
ps<br />
where<br />
d b = diameter of prestressing strand<br />
f pt = stress in prestressing strand just prior to strand release<br />
f su *= stress in prestressed rein<strong>for</strong>cement at nominal strength of member<br />
f se = effective prestressing stress after losses<br />
l fb = flexural bond length<br />
l t = transfer length of prestressing strand<br />
ε ps = strain corresponding with f su *<br />
A.11.10 FHWA Study, 1996<br />
In addition to the numerous studies a<strong>for</strong>ementioned, the FHWA also published findings<br />
from their own study addressing the bond of prestressing strand in NWC and HPC. The FHWA<br />
study addressed variables as specified previously in A.8.12. Based on FHWA results and the<br />
results of other research programs, the restriction on the use of 0.6-inch strand was lifted. The<br />
FHWA proposed Equations A.25 and A.26 <strong>for</strong> “best-fit” or “mean” and to provide a “95%<br />
confidence interval,” respectively.<br />
A-22
l<br />
d<br />
= l<br />
t<br />
+ l<br />
fb<br />
⎛<br />
= ⎜<br />
⎝<br />
f<br />
d<br />
⎞ ⎛ 6.4( f<br />
− 21⎟<br />
+ ⎜<br />
⎠ ⎝<br />
−<br />
pt b<br />
su<br />
4<br />
'<br />
'<br />
f<br />
c<br />
f<br />
c<br />
f<br />
se<br />
) d<br />
b<br />
26<br />
⎟ ⎞<br />
+<br />
⎠<br />
( A.25)<br />
l<br />
d<br />
= l<br />
t<br />
+ l<br />
fb<br />
⎛<br />
= ⎜<br />
⎝<br />
f<br />
d<br />
⎞ ⎛ 6.4( f<br />
− 5⎟<br />
+ ⎜<br />
⎠ ⎝<br />
−<br />
pt b<br />
su<br />
4<br />
'<br />
'<br />
f<br />
c<br />
f<br />
c<br />
f<br />
se<br />
) d<br />
b<br />
15<br />
⎟ ⎞<br />
+<br />
⎠<br />
( A.26)<br />
A.11.11 Barnes, Burns and Kreger, 1999<br />
Barnes, Burns and Kreger tested 36 AASHTO Type I normal weight HPC girders having<br />
release strengths from 4,000 to 7,000 psi and strengths at testing from 5,700 to 11,000 psi. All<br />
prestressing strands were 0.6-inch diameter Grade 270 ksi LOLAX strands in either a “bright” or<br />
“rusted” surface condition. Included in the test program were girders with fully bonded strands<br />
and debonded strands. One of the outcomes of the research program was Equation A.27 <strong>for</strong><br />
predicting development length.<br />
l<br />
d<br />
=<br />
5 ⎛<br />
⎜<br />
4 ⎜<br />
⎝<br />
f<br />
pt<br />
f<br />
'<br />
ci<br />
+ ( f<br />
ps<br />
−<br />
f<br />
pe<br />
) d<br />
⎟ ⎟ ⎞<br />
⎠<br />
b<br />
( A.27)<br />
A.11.12 Peterman, Ramirez, Olek, 2000<br />
Peterman, Ramirez, and Olek conducted research on HSLC bridge girders. Their<br />
research is the only other research known where HSLC girders using 0.6-inch diameter strands<br />
were tested. Their report indicated that all multiple strand specimens were rein<strong>for</strong>ced with<br />
sufficient stirrups to prevent web-shear cracking at the member ends. The prevention of shear<br />
cracking in the transfer region has been shown to result in strand slip causing premature shear<br />
failure.<br />
2.11.13 Kolozs, 2000<br />
Kolozs, under the supervision of Professors Ned Burns and John Breen, tested HSLC<br />
girders with strengths between 6,000 and 8,000 psi prestressed with ½-inch diameter Grade 270<br />
LOLAX strand. Kolozs found the current AASHTO equation <strong>for</strong> development length was<br />
conservative.<br />
A-23
A.11.14 Summary of Development Length Review<br />
Again, there are currently no specific equations <strong>for</strong> predicting development length <strong>for</strong><br />
girders made with HSLC. Chapter 5, Development Length, uses Equations A.16 through A.20<br />
and A.22 through A.27 <strong>for</strong> an evaluation of development length results from this research<br />
program to determine which variables are most applicable <strong>for</strong> HSLC girders and to suggest a<br />
better equation <strong>for</strong> predicting development length.<br />
A-24
Table A.1 Summary of Development Length Equations<br />
Source / Author of Equation Development Length, l d<br />
AASHTO / ACI<br />
( f<br />
ps<br />
− 2<br />
3<br />
f<br />
se<br />
) db<br />
Barnes, Burns and Kreger<br />
⎛ f<br />
⎞<br />
pt<br />
1.25⎜<br />
+ ( f<br />
ps<br />
− f ⎟<br />
pe<br />
) db<br />
⎜ '<br />
f<br />
⎟<br />
⎝ ci<br />
⎠<br />
Buckner<br />
db<br />
f<br />
si<br />
+ λ ( f<br />
su<br />
− f<br />
se<br />
) db<br />
3<br />
Deatherage et al.<br />
db<br />
f<br />
si<br />
+ 1.5( f<br />
su<br />
− f<br />
se<br />
) db<br />
3<br />
Lane 95%<br />
⎛ 4 f<br />
pt<br />
db<br />
⎞ ⎛ 6.4( f −<br />
⎟ ⎞<br />
su<br />
f<br />
se<br />
) db<br />
⎜ − 5<br />
⎟ +<br />
⎜<br />
+ 15<br />
'<br />
'<br />
⎝ fc<br />
⎠ ⎝ f<br />
c ⎠<br />
Lane 95% ⎛ 4 f<br />
pt<br />
db<br />
⎞ ⎛ 6.4( f −<br />
(10 ksi limit on f c ’) ⎟ ⎞<br />
su<br />
f<br />
se<br />
) db<br />
⎜ − 5<br />
⎟ +<br />
⎜<br />
+ 15<br />
'<br />
'<br />
⎝ fc<br />
⎠ ⎝ f<br />
c ⎠<br />
Lane Mean<br />
⎛ 4 f<br />
pt<br />
db<br />
⎞ ⎛ 6.4( f −<br />
⎟ ⎞<br />
su<br />
f<br />
se<br />
) db<br />
⎜ − 21<br />
⎟ +<br />
⎜<br />
+ 26<br />
'<br />
'<br />
⎝ fc<br />
⎠ ⎝ fc<br />
⎠<br />
Lane Mean ⎛ 4 f<br />
pt<br />
db<br />
⎞ ⎛ 6.4( f −<br />
(10 ksi limit on f c ’) ⎟ ⎞<br />
su<br />
f<br />
se<br />
) db<br />
⎜ − 21<br />
⎟ +<br />
⎜<br />
+ 26<br />
'<br />
'<br />
⎝ fc<br />
⎠ ⎝ fc<br />
⎠<br />
Martin and Scott<br />
135 db<br />
( f<br />
ps<br />
− )<br />
1/ 6<br />
d 0.39<br />
Mitchell et al. 0.33 f<br />
Zia and Mostafa<br />
f<br />
si<br />
d<br />
b<br />
3<br />
f<br />
'<br />
ci<br />
b<br />
+ ( f<br />
su<br />
− f<br />
se<br />
) d<br />
si<br />
( 1.5 db<br />
− 4.6) + 1.25( f<br />
' su<br />
−<br />
f<br />
ci<br />
b<br />
f<br />
se<br />
4.5<br />
f<br />
'<br />
c<br />
) d<br />
b<br />
d b<br />
f pt<br />
f si<br />
f se<br />
f pe<br />
f ps<br />
f su<br />
ES<br />
CR<br />
Prestressing strand diameter<br />
Stress in prestressing strand prior to release<br />
Stress in prestressing strand immediately after release (f pt -ES)<br />
Stress in prestressing strand after all losses (f pt -ES-CR-SH)<br />
Same as f se<br />
Stress in prestressing strand at member nominal strength<br />
Ultimate stress of prestressing strand<br />
Prestress losses due to elastic shortening<br />
Prestress losses due to creep<br />
A-25
SH Prestress losses due to shrinkage<br />
'<br />
f ci<br />
’<br />
f c<br />
M n<br />
M cr<br />
I t<br />
V u<br />
<strong>Concrete</strong> compressive strength at release<br />
<strong>Concrete</strong> compressive strength at time of testing<br />
Nominal moment capacity of a member<br />
Cracking moment capacity of a member<br />
Trans<strong>for</strong>med moment of inertia of a member<br />
Ultimate shear <strong>for</strong>ce at the critical section<br />
λ 1.0 ≤ [λ = (0.6+40ε ps )] ≤ 2.0<br />
A.12 Elements of Bond<br />
There are three mechanisms that allow the development of bond stress between the<br />
prestressing strand and the concrete to include adhesion, frictional bond due to Hoyer’s effect,<br />
and mechanical interlock. Slipping of the prestressing strand relative to the concrete is required<br />
to develop bond stress. In general, bond resistance of seven-wire prestressing strand remains<br />
constant or increases after initial slip.<br />
A.12.1 Adhesion<br />
Adhesion occurs in a very thin layer at the interface between the concrete and<br />
prestressing strand. Acting like an “adhesive,” adhesion exhibits rigid-brittle behavior<br />
preventing slip of the strand relative to the concrete up to a critical stress level. During the<br />
transfer of prestress or girder testing, adhesion is lost when the bond stress exceeds the critical<br />
stress level. Once the critical stress level is exceeded, the adhesion portion of bond is lost. In the<br />
case of seven-wire prestressing strand, the loss of adhesion is often replaced by other<br />
mechanisms of bond. Because failure of the adhesive bond occurs at a very small displacement,<br />
the overall contribution of adhesion to bond is minor.<br />
A.12.2 Frictional Bond Due to Hoyer’s Effect<br />
Research by E. Hoyer in 1939 using small diameter smooth piano wire resulted in the<br />
identification of a mechanism of bond now known by his name. When wire or prestressing<br />
strand is tensioned, Poisson effects cause the diameter to become smaller. After tensioning,<br />
concrete is cast around the strands and allowed to cure to some initial required strength. At<br />
A-26
strand release, the strand attempts to return elastically to its initial length prior to tensioning. As<br />
the strand becomes shorter, Poisson effects cause an increase in strand diameter creating radial<br />
compression stress between the strand and concrete. The resulting increase in strand diameter<br />
upon release is most pronounced at the free end of the strand and becomes less to a point where<br />
it becomes constant at a distance approximately equal to the transfer length from the end of the<br />
member. After initial end slip at strand release, the resulting frictional bond resistance and<br />
wedge action shown in Figure A.1 restrain the strand and maintain tension in it.<br />
A-27
Normal<br />
Strand<br />
Diameter<br />
Due to Zero<br />
Strand Force<br />
End Slip<br />
Wedge Action<br />
Reduced<br />
Strand<br />
Diameter<br />
Due to F se<br />
F se<br />
Figure A.1 Wedge Action Resulting from Hoyer’s Effect<br />
During the application of load to a girder, the stress in the strand increases. At the point<br />
where the stress exceeds the stress in the strand at transfer in the transfer region, the wedge<br />
action begins to diminish.<br />
A.12.3 Mechanical Interlock<br />
Standard seven-wire prestressing strand is manufactured by wrapping six wires around a<br />
seventh center wire in a helical pattern. <strong>Concrete</strong> placed around the strand fills the narrow<br />
spaces (interstices) between the individual wires completely encapsulating the strand. When the<br />
strand is prevented from twisting, the concrete ridges acting on the outside wires of the strand<br />
restrict movement by mechanical interlock. In order to prevent twisting, the wedge action<br />
created by Hoyer’s effect must exist. Mechanical interlock is reported to enhance the frictional<br />
bond component at strand release.<br />
A-28
Appendix B. Creep and Shrinkage<br />
B.1 Creep of HPLC<br />
While it is clear that HPLC can be produced with high strength lightweight concrete, its<br />
creep characteristics have not been extensively or systematically investigated. Creep is typically<br />
reduced in HPC but is typically greater in lightweight concrete. These competing effects make<br />
creep in HPLC difficult to predict.<br />
Moreover, some observations and recommendations presented in the literature are not<br />
consistent. For instance, Berra and Ferrada (1990) concluded that specific creep in HPLC is<br />
twice that of normal weight concrete of the same strength. On the other hand, Malhotra (1990)<br />
gave values of creep of fly ash HPLC in the range 460 to 510 µε. These values are fairly close to<br />
those obtained by Penttala and Rautamen (1990) <strong>for</strong> HPC, and they are significantly lower than<br />
the values between 878 and 1,026 µε reported <strong>for</strong> HPC by Huo et al. (2001).<br />
In a recent state-of-the-art report on high-strength, high-durability structural lightweight<br />
concrete, Holm and Bremner (2000) remarked on the discrepancies found in the literature. They<br />
contrasted the work of Rogers (1957) with the research done by Reichard (1964) and Shideler<br />
(1957). In the <strong>for</strong>mer, creep of HSLC was found to be similar to that measured in companion<br />
HSC while the last two found greater creep in “all lightweight” concrete (fine and coarse<br />
lightweight aggregate), than in the normal weight concretes.<br />
Leming (1990) compared the creep of three mixes: two 4,000-psi concrete with same mix<br />
proportions, but with either lightweight or normal weight coarse aggregate. The third mix was<br />
an 8,000-psi concrete with lightweight coarse aggregate. One-year creep was 1,095, 608, and 520<br />
µε <strong>for</strong> the 4,000-psi lightweight, 4,000-psi normal weight concrete, and 8,000-psi lightweight<br />
concrete, respectively. The result <strong>for</strong> the 8,000-psi lightweight concrete was 85% of the value<br />
obtained <strong>for</strong> the 4,000-psi normal weight concrete.<br />
There have been few research studies concerning creep of HPLC. However, conclusions<br />
from different researchers are sometimes opposed which makes the estimate of creep in HPLC<br />
extremely difficult. As a consequence, when HPLC is to be used in a certain project,<br />
per<strong>for</strong>mance of a laboratory creep test <strong>for</strong> the specific mix is recommended in order to obtain<br />
more accurate data <strong>for</strong> the design and prediction of creep in the project.<br />
The two principle phases of HPLC: high per<strong>for</strong>mance matrix and lightweight aggregate<br />
have several possible specific implications on creep in concrete. It is commonly assumed that<br />
B-1
normal weight aggregate does not creep at the stress levels present in concrete. However, in<br />
HSLC, the higher stress placed on the member might induce creep in the lightweight aggregate,<br />
due to its lower modulus and strength. Also, improvements in the interfacial transition zone,<br />
af<strong>for</strong>ded by the use of ultra-fine pozzolanic particles and lightweight aggregate, can alter the<br />
mechanisms <strong>for</strong> creep. Particularly, they can alter mechanisms not only compared to normal<br />
strength concrete, but also compared to high strength concrete (due to improved compatibility<br />
between the aggregate and paste). Finally, the increased aggregate porosity and the effect of<br />
“internal curing” (when using saturated lightweight aggregate) can influence moisture<br />
movements during creep. These possible changes in expected behavior (as compared to normal<br />
concrete and high strength concrete) resulting from the use of high per<strong>for</strong>mance matrix and<br />
lightweight aggregate are described in further detail below.<br />
Aggregate mechanical properties: In normal weight concrete, creep is largely a<br />
phenomenon occurring in the paste, but its magnitude, and perhaps its temporal development,<br />
can be affected by the quantity and quality of the aggregate. The high porosity of lightweight<br />
aggregates may influence creep of concrete not only indirectly by reducing the elastic modulus<br />
and strength of the concrete, but also directly by participating in the moisture movements<br />
occurring during creep, as considered in the seepage theory.<br />
Improved interface characteristics: Micrographs of SLC (structural lightweight concrete)<br />
showed that the boundary between cementitious matrix and coarse aggregate was<br />
indistinguishable from the bulk paste (Holm and Bremner, 2000). This may result from: (1)<br />
improved physical bonding between the paste and aggregate (due to increased aggregate<br />
porosity); (2) improved chemical bonding between the paste and aggregate (due to pozzolanic<br />
activity); (3) reduced microcracking (due to elastic matching between aggregate and paste); and<br />
(4) reduced bleeding. In addition, “internal curing” may improve the strength and density of the<br />
interfacial transition zone (ITZ). This occurs when presoaked lightweight aggregate provides an<br />
internal reservoir of water maintaining favorable moisture conditions and extending the local<br />
hydration processes (ACI-213, 1987 -reapproved 1999; Holm and Bremner, 1990). These<br />
improvements to the ITZ could mitigate the “microcracking effect” on creep. Katz et al. (1999)<br />
postulated that an improved ITZ can be obtained by using dry lightweight aggregate. They<br />
concluded that the suction imposed by a dry lightweight aggregate can lead to a dense ITZ, with<br />
even some penetration of cement particles into the shell of the aggregate.<br />
B-2
Changes in moisture migration: the seepage theory views creep as a result of water<br />
movement under stress from micropores to the larger capillary pores. If water migration is the<br />
main factor in concrete creep, both the aggregate porosity (i.e., volume of pores, pore size, and<br />
pore distribution) and the permeability of the cementitious matrix become important factors.<br />
Several (ACI-213, 1999; Holm, 1995; Neville et al., 1983) have cited the importance of using<br />
lightweight aggregate in a saturated condition while mixing. If the aggregate is not saturated, a<br />
more rapid movement of water from the paste would be expected to lead to greater creep. On the<br />
other hand, the moisture conditions given by the saturated lightweight aggregate could replace<br />
the water lost under stress (seepage).<br />
B.2 Shrinkage of HPLC<br />
As occurs with creep of HPLC, there are only a few articles regarding shrinkage of<br />
HPLC. Besides, they usually do not report autogenous and drying shrinkage separately, but as<br />
overall shrinkage. Berra and Ferrada (1990) found that compared with HPC, HPLC had a lower<br />
shrinkage rate, but a higher ultimate value. According the authors, the lower rate was caused by<br />
the presence of water in the aggregate which delays drying. Holm and Bremner (1994) also<br />
observed that HSLC mix lagged behind at early ages, but one-year shrinkage was approximately<br />
14% higher than the HPC counterpart. Holm and Bremner (1994) measured a higher shrinkage<br />
when they incorporated fly ash to the HSLC mix. Malhotra’s (1990) results, on the other hand,<br />
showed that fly ash particles in the HPLC helped to reduce shrinkage after one year.<br />
Leming (1990) reported one-year shrinkage of 4,000-psi and 8,000-psi lightweight<br />
concretes, made with saturated expanded slate, of 390 and 310 µε, respectively while the<br />
corresponding shrinkage of a 4,000-psi NWC was found to be 360 µε. Bilodeau et al. (1995)<br />
investigated HSLC with 28-day compressive strength ranging from 7,250 to 10,000 psi and<br />
found that the 450-day shrinkage was in the range 518 to 667 µε. Curcio et al. (1998) reported<br />
that one-year and ultimate shrinkage of HPLC with Type III cement and fly ash was 450 and 500<br />
µε, respectively.<br />
Kohno et al. (1999) found out that autogenous shrinkage is reduced by the use of<br />
lightweight fine aggregate. They concluded that this is because water lost by self-desiccation of<br />
the cement paste is immediately replaced by moisture from lightweight aggregate. Aïtcin (1992)<br />
reported values of shrinkage of HPLC as low as 70 and 260 µε, after a 28-day curing.<br />
B-3
B.3 Creep and Shrinkage Models<br />
Among the variety of methods proposed <strong>for</strong> creep and shrinkage in concrete, seven of<br />
them are as follows: American <strong>Concrete</strong> Institute committee 209 (ACI-209, 1997), American<br />
Association of State <strong>High</strong>way and Transportation Officials (AASHTO-LRFD, 1998), Comite<br />
Euro-Internacional du Beton and Federation Internationale de la Precontrainte (CEB-FIP, 1990),<br />
Bažant and Panula’s (BP, 1978), Bažant and Baweja’s (B3, 1995), Gardner and Lockman’s (GL,<br />
2001), and Sakata’s model (SAK, 1993). Five methods aimed to be used <strong>for</strong> high strength<br />
concrete are as follows: CEB-FIP as modified by Yue and Taerwe (1993), BP as modified by<br />
Bažant and Panula (1984), SAK as modified by Sakata et al. (2001), Association Française de<br />
Recherches et d'Essais sur les Matériaux de Construction (AFREM, 1996), and AASHTO-LRFD<br />
as modified by Shams and Kahn (2000). Most of the expressions presented here are empirical,<br />
so they have different versions depending on the unit system. Only the three models found most<br />
applicable are present.<br />
B.3.1. ACI-209 Method (Normal <strong>Strength</strong> <strong>Concrete</strong>)<br />
American <strong>Concrete</strong> Institute through its committee 209 “Prediction of Creep, Shrinkage and<br />
Temperature Effects in <strong>Concrete</strong> Structures” proposes an empirical model <strong>for</strong> predicting creep<br />
and shrinkage strain as a function of time. The two models have the same principle: a<br />
hyperbolic curve that tends to an asymptotic value called the ultimate value. The shape of the<br />
curve and ultimate value depend on several factors such as curing conditions, age at application<br />
of load, mix design, ambient temperature and humidity.<br />
Creep Model. Creep model proposed by ACI-209 has three constants that determine the<br />
asymptotic value, creep rate and change in creep rate. The predicted parameter is not creep<br />
strain, but creep coefficient (creep strain-to-initial strain ratio). The latter allows <strong>for</strong> the<br />
calculation of a creep value independent from the applied load. Equation B.1 presents the<br />
general model.<br />
ψ<br />
( t − t'<br />
)<br />
φt<br />
=<br />
⋅φ<br />
ψ u<br />
d + ( t − t'<br />
)<br />
where<br />
ø t : creep coefficient at age “t” loaded at t′<br />
t: age of concrete (days)<br />
(B.1)<br />
B-4
t′: age of concrete at loading (days)<br />
ψ: constant depending on member shape and size<br />
d: constant depending on member shape and size<br />
ø u : ultimate creep coefficient<br />
ACI-209 recommended a value of 0.6 and 10 <strong>for</strong> ψ and d, respectively. Ultimate creep<br />
coefficient value depends on the factors are described in Equation B.2. ACI proposed an average<br />
creep coefficient value of 2.35 which is multiplied by six factors depending on particular<br />
conditions, as shown in Equation B.2<br />
φu = 2 . 35⋅γ<br />
la<br />
⋅γ<br />
λ<br />
⋅γ<br />
vs<br />
⋅γ<br />
s<br />
⋅γ<br />
ψ<br />
⋅γ<br />
α<br />
(B.2)<br />
where<br />
ø u : ultimate creep coefficient<br />
−0.118<br />
⎧1.25<br />
⋅ t'<br />
<strong>for</strong> moist curing<br />
γ<br />
la<br />
= ⎨<br />
; age of loading factor<br />
−0.<br />
094<br />
⎩1.13⋅<br />
t'<br />
<strong>for</strong> steam curing<br />
t′: age of concrete at loading (days)<br />
⎧1.27<br />
− 0.67 ⋅ h <strong>for</strong> h ≥ 0.40<br />
γ<br />
λ<br />
= ⎨<br />
; ambient relative humidity factor<br />
⎩ 1.00 otherwise<br />
h: relative humidity in decimals<br />
( 1+<br />
1.13⋅<br />
exp{ − 0. })<br />
2<br />
γ<br />
VS<br />
= 54 ⋅ V<br />
3<br />
S<br />
V: specimen volume (in 3 )<br />
S: specimen surface area (in 2 )<br />
γ = 0.82 + 0. 067 ⋅ s ; slump factor<br />
s<br />
s: slump (in)<br />
; volume-to-surface ratio factor<br />
λ ψ<br />
= 0 .88 + 0. 24 ⋅ψ ; fine aggregate content factor<br />
ψ: fine aggregate-to-total aggregate ratio in decimals<br />
γ α<br />
= 0 .46 + 0. 09 ⋅α ; air content factor<br />
α: air content (%)<br />
After applying the factors above, ultimate creep coefficient value is usually between 1.3 and<br />
4.15, which means that creep strain is between 1.3 and 4.15 times the initial elastic strain.<br />
B-5
Drying Shrinkage Model. Similar to creep, ACI-209 shrinkage model has constants that<br />
determine the shrinkage asymptotic value, shrinkage rate and rate change. Equation B.3 shows<br />
such a model.<br />
( ε<br />
sh<br />
)<br />
t<br />
( t − t )<br />
= )<br />
u<br />
(B.3)<br />
f + ( t −<br />
α<br />
0<br />
⋅ ( ε<br />
α sh<br />
t0)<br />
where<br />
t: age of concrete (days)<br />
t 0 : age at the beginning of drying (days)<br />
(ε sh ) t : shrinkage strain after “t-t 0 ” days under drying (in/in)<br />
α: constant depending on member shape and size<br />
f: constant depending on member shape and size<br />
(ε sh ) u : ultimate shrinkage strain (in/in)<br />
ACI-209 recommends a value <strong>for</strong> f of 35 and 55, <strong>for</strong> seven days moist curing and 1 to 3 days<br />
steam curing, respectively, while a value of 1.0 is suggested <strong>for</strong> α. Ultimate shrinkage value<br />
depends on the factors described in Equation B.4. As shown in Equation B.4, ACI-209 proposes<br />
an average value of 780 µε <strong>for</strong> shrinkage which is multiplied by seven factors depending on<br />
particular conditions.<br />
( ε<br />
sh<br />
)<br />
u<br />
= 780 ⋅γ<br />
λ<br />
⋅γ<br />
vs<br />
⋅γ<br />
s<br />
⋅γ<br />
ψ<br />
⋅γ<br />
c<br />
⋅γ<br />
α<br />
(B.4)<br />
where<br />
(ε sh ) u : ultimate shrinkage strain<br />
⎧1.40<br />
−1.0<br />
⋅ h <strong>for</strong> 0.40 ≤ h ≤ 0.80<br />
γ<br />
λ<br />
= ⎨<br />
; ambient relative humidity factor<br />
⎩3.00<br />
− 3.0 ⋅ h <strong>for</strong> h > 0.80<br />
h: relative humidity in decimals<br />
γ<br />
VS<br />
= 1.2 ⋅ exp{ − 0. 12 ⋅ V }; volume-to-surface ratio factor<br />
S<br />
V: specimen volume (in 3 )<br />
S: specimen surface area (in 2 )<br />
γ = 0.89 + 0. 041⋅<br />
s ; slump factor<br />
s<br />
B-6
s: slump (in)<br />
γ ψ<br />
⎧ 0.30 −1.4<br />
⋅ψ<br />
<strong>for</strong> ψ ≤ 0.50<br />
= ⎨<br />
; fine aggregate content factor<br />
⎩0.90<br />
− 0.2 ⋅ψ<br />
<strong>for</strong> ψ > 0.50<br />
ψ: fine aggregate-to-total aggregate ratio in decimals<br />
γ = 0.75 + 0. 00036 ⋅ c ; cement content factor<br />
c<br />
c: cement content (lb/yd 3 )<br />
γ α<br />
= 0 .95 + 0. 08⋅α<br />
; air content factor<br />
α: air content (%)<br />
µε.<br />
After applying the factors above, ultimate shrinkage value is usually between 415 and 1070<br />
B.3.2. AASHTO-LRFD Method (Normal <strong>Strength</strong> <strong>Concrete</strong>)<br />
AASHTO-LRFD method (1998) is very similar to ACI-209 method, but it incorporates more<br />
recent data. AASHTO-LRFD method proposes slightly different correction factors.<br />
Creep Model. The general equation <strong>for</strong> creep coefficient is the same as ACI-209 (Equation B.1).<br />
However the expression <strong>for</strong> calculating ultimate creep coefficient differs from ACI expression<br />
(Equation B.2). Equation B.5 presents AASHTO-LRFD expression <strong>for</strong> ultimate creep<br />
coefficient.<br />
φ = 3. 50 ⋅ k ⋅ k ⋅ k ⋅ k<br />
(B.5)<br />
u<br />
la<br />
where<br />
ø u : ultimate creep coefficient<br />
k la<br />
118<br />
h<br />
c<br />
f<br />
−0.<br />
= 1.00 ⋅ t'<br />
<strong>for</strong> moist curing ; age of loading factor<br />
until ⎧ ⎡<br />
⎤⎫<br />
loading<br />
⎪ ⎢ 4000<br />
⎥⎪<br />
t'<br />
= ∑ ∆ti<br />
⋅ exp⎨−<br />
⎢<br />
−13.<br />
65⎥⎬<br />
; maturity of concrete at loading (days)<br />
⎪<br />
T ( ∆t<br />
)<br />
⎢273<br />
+<br />
i<br />
⎥⎪<br />
⎩ ⎣<br />
T 0 ⎦⎭<br />
∆t i : period of time (days) at temperature T(∆t i ) ( o o<br />
o<br />
C) ( C = 0.556×<br />
F −17.<br />
778)<br />
T 0 : 1 o C<br />
k h<br />
= 1 .58 − 0. 83⋅<br />
h ; ambient relative humidity factor<br />
B-7
h: relative humidity in decimals<br />
k c<br />
⎡ t<br />
⎢<br />
⎢ 26 ⋅ exp 0.36<br />
= ⎢<br />
⎢ t<br />
⎢ 45 + t<br />
⎢⎣<br />
⎤<br />
{ ⋅V<br />
} + t ⎥<br />
⎥ ⎡1.80<br />
+ 1.77 ⋅ exp{ − 0.54 ⋅V<br />
}<br />
S<br />
⎥ ⋅ ⎢<br />
⎥ ⎢<br />
⎣<br />
⎥<br />
⎥⎦<br />
2.587<br />
⎤<br />
S ⎥ ; size factor<br />
⎥<br />
⎦<br />
until ⎧ ⎡<br />
⎤⎫<br />
day n<br />
⎪ ⎢ 4000<br />
⎥⎪<br />
t = ∑ ∆ti<br />
⋅ exp⎨−<br />
⎢<br />
−13.<br />
65⎥⎬<br />
; maturity of concrete (days) after “n” days<br />
⎪<br />
T ( ∆t<br />
)<br />
⎢273<br />
+<br />
i<br />
⎥⎪<br />
⎩ ⎣<br />
T 0 ⎦⎭<br />
V: specimen volume (in 3 )<br />
S: specimen surface area (in 2 )<br />
k<br />
f<br />
= 1<br />
f<br />
c<br />
'<br />
; concrete strength factor<br />
0.67 +<br />
9<br />
f c ’: compressive strength of concrete cylinders at 28 days (ksi)<br />
Drying Shrinkage Model. ASSHTO-LRFD general expression <strong>for</strong> shrinkage is the same as ACI<br />
expression (Equation B.3) including the values <strong>for</strong> f of 35 and 55 <strong>for</strong> moist and steam curing,<br />
respectively. The expression <strong>for</strong> calculating ultimate shrinkage is different from ACI expression,<br />
and it is presented in Equation B.6.<br />
(ε ) = K ⋅ k ⋅ k<br />
(B.6)<br />
sh<br />
u<br />
s<br />
h<br />
where<br />
(ε sh ) u : ultimate shrinkage strain (in/in)<br />
⎧510<br />
µε <strong>for</strong> moist curing<br />
K = ⎨<br />
; ultimate shrinkage base value<br />
⎩560<br />
µε <strong>for</strong> steam curing<br />
k s<br />
=<br />
⎡<br />
⎢<br />
⎢<br />
⎢<br />
⎢<br />
⎢<br />
⎣<br />
26 ⋅ exp 0.36<br />
( t − t )<br />
0<br />
{ ⋅V<br />
} + ( t − t0<br />
)<br />
45<br />
S<br />
( t − t0<br />
)<br />
+ ( t − t )<br />
0<br />
⎤<br />
⎥ ⎡<br />
⎤<br />
⎥ 1064 − 0.94 ⋅V<br />
⋅ ⎢<br />
S ⎥<br />
⎥<br />
; size factor<br />
⎢ 923 ⎥<br />
⎥ ⎣<br />
⎦<br />
⎥<br />
⎦<br />
B-8
t: age of concrete (days)<br />
t 0 : age at the beginning of drying (days)<br />
V: specimen volume (in 3 )<br />
S: specimen surface area (in 2 )<br />
k h<br />
⎧2.00<br />
−1.43⋅<br />
h<br />
= ⎨<br />
⎩4.29<br />
− 4.29 ⋅ h<br />
h: relative humidity in decimals<br />
<strong>for</strong> h < 0.80<br />
; ambient relative humidity factor<br />
<strong>for</strong> h ≥ 0.80<br />
B.3.3. AASHTO-LRFD as modified by Shams and Kahn (2000) (<strong>High</strong> <strong>Strength</strong><br />
<strong>Concrete</strong>)<br />
Shams and Kahn (2000), proposed some changes to AASHTO-LRFD creep and shrinkage<br />
expression in order to better predict long-term strains of HPC as given below.<br />
Creep Model. Shams and Kahn method <strong>for</strong> estimating creep is presented in Equation B.7.<br />
0.6<br />
( t − t'<br />
)<br />
+ ( t − t'<br />
) 0. 6<br />
φ<br />
t<br />
= φ ∞<br />
⋅ kvs<br />
⋅ k<br />
f<br />
⋅ k<br />
H<br />
⋅ kt<br />
'<br />
⋅ k ⋅ k<br />
c<br />
σ m<br />
⋅<br />
(B.7)<br />
d<br />
where<br />
ø t : creep coefficient at “t” loaded at t′<br />
until ⎧ ⎡<br />
⎤⎫<br />
day n<br />
⎪ ⎢ 4000<br />
⎥⎪<br />
t = ∑ ∆ti<br />
⋅ exp⎨−<br />
⎢<br />
−13.<br />
65⎥⎬<br />
; maturity of concrete (days) after “n” days<br />
⎪<br />
T ( ∆t<br />
)<br />
⎢273<br />
+<br />
i<br />
⎥⎪<br />
⎩ ⎣<br />
T 0 ⎦⎭<br />
until ⎧ ⎡<br />
⎤⎫<br />
loading<br />
⎪ ⎢ 4000<br />
⎥⎪<br />
t'<br />
= ∑ ∆ti<br />
⋅ exp⎨−<br />
⎢<br />
−13.<br />
65⎥⎬<br />
; maturity of concrete at loading (days)<br />
⎪<br />
T ( ∆t<br />
)<br />
⎢273<br />
+<br />
i<br />
⎥⎪<br />
⎩ ⎣<br />
T 0 ⎦⎭<br />
∆t i : period of time (days) at temperature T(∆t i ) ( o o<br />
o<br />
C) ( C = 0.556×<br />
F −17.<br />
778)<br />
T 0 : 1 o C<br />
φ<br />
∞<br />
= 2.73: ultimate creep coefficient<br />
B-9
⎡ t<br />
⎢<br />
⎢ 26 ⋅ exp 0.36<br />
k =<br />
S<br />
vs ⎢<br />
⎢<br />
t<br />
⎢ 45 + t<br />
⎣<br />
V: specimen volume (in 3 )<br />
⎤<br />
{ ⋅V<br />
} + t ⎥<br />
⎥ ⎡1.80<br />
+ 1.77 ⋅ exp{ − 0.54 ⋅V<br />
}<br />
S: specimen surface area (in 2 )<br />
⎥ ⋅ ⎢<br />
⎥ ⎢<br />
⎣<br />
⎥<br />
⎦<br />
4.8<br />
k = f c<br />
1.645 + f '<br />
; concrete strength factor<br />
c<br />
2.587<br />
f c ’: compressive strength of concrete cylinders at 28 days (ksi)<br />
⎤<br />
S ⎥ ; size factor<br />
⎥<br />
⎦<br />
k H<br />
= 1 .58 − 0. 83⋅<br />
h ; ambient relative humidity factor<br />
h: relative humidity in decimals<br />
k t '<br />
⎧ 0.7 ⎫<br />
= 0.65 ⋅ exp⎨<br />
⎬ ; maturity at loading factor<br />
⎩t'<br />
+ 0.57 ⎭<br />
k σ<br />
{ ⋅ ( Γ − 0.4)<br />
}<br />
⎧exp 1.5<br />
⎪<br />
= ⎨<br />
⎪<br />
⎩ 1.0 <strong>for</strong> Γ ≤ 0.4<br />
Γ: stress-to-strength ratio at loading<br />
<strong>for</strong> 0.4 ≤ Γ ≤ 0.6<br />
; stress-to-strength ratio factor<br />
k m<br />
( 1 − exp{ − 0.59 ⋅ }) 5. 73<br />
= 1 + 0.65 ⋅<br />
m : moist curing period factor<br />
m: moist curing period (days)<br />
d<br />
= t'<br />
0.356 + 0.09 ⋅ t'<br />
: maturity <strong>for</strong> 50% of ultimate creep coefficient<br />
Drying Shrinkage Model. Equation B.8 shows Shams and Kahn drying shrinkage expression.<br />
⎡ t − t ⎤<br />
o<br />
ε<br />
sh<br />
( t, to<br />
) = ε<br />
sh∞<br />
⋅ kvs<br />
⋅ k<br />
H<br />
⋅ kt<br />
⋅ ⎢ ⎥ (B.8)<br />
o<br />
⎣ f + ( t − to<br />
) ⎦<br />
0.5<br />
B-10
where<br />
ε<br />
sh ∞<br />
⎧ 510 µε <strong>for</strong> steam<br />
- cured concrete<br />
= ⎨<br />
⎩560<br />
µε <strong>for</strong> moist - cured concrete<br />
; ultimate shrinkage strain<br />
until ⎧ ⎡<br />
⎤⎫<br />
day n<br />
⎪ ⎢ 4000<br />
⎥⎪<br />
t = ∑ ∆ti<br />
⋅ exp⎨−<br />
⎢<br />
−13.<br />
65⎥⎬<br />
; maturity of concrete (days) after “n” days<br />
⎪<br />
T ( ∆t<br />
)<br />
⎢273<br />
+<br />
i<br />
⎥⎪<br />
⎩ ⎣<br />
T 0 ⎦⎭<br />
until<br />
beginning<br />
drying<br />
⎧ ⎡<br />
⎤⎫<br />
⎪ ⎢ 4000<br />
⎥⎪<br />
t0<br />
= ∑ ∆ti<br />
⋅ exp⎨−<br />
⎢<br />
−13.<br />
65⎥⎬<br />
; maturity of concrete at the beginning of drying<br />
⎪<br />
T ( ∆t<br />
)<br />
⎢273<br />
+<br />
i<br />
⎥⎪<br />
⎩ ⎣<br />
T0<br />
⎦⎭<br />
(days)<br />
∆t i : period of time (days) at temperature T(∆t i ) ( o o<br />
o<br />
C) ( C = 0.556×<br />
F −17.<br />
778)<br />
T 0 : 1 o C<br />
k vs<br />
⎡<br />
⎢<br />
⎢<br />
26 ⋅ exp 0.36<br />
=<br />
⎢<br />
⎢<br />
⎢ 45<br />
⎣<br />
( t − t )<br />
0<br />
{ ⋅V<br />
} + ( t − t0<br />
)<br />
S<br />
( t − t0<br />
)<br />
+ ( t − t )<br />
0<br />
⎤<br />
⎥ ⎡<br />
⎤<br />
⎥<br />
1064 − 0.94 ⋅V<br />
⋅ ⎢<br />
S ⎥<br />
⎥<br />
; size factor<br />
⎢ 923 ⎥<br />
⎥ ⎣<br />
⎦<br />
⎥⎦<br />
k H<br />
⎧2.00<br />
−1.43⋅<br />
h<br />
= ⎨<br />
⎩4.29<br />
− 4.29 ⋅ h<br />
<strong>for</strong> h < 0.80<br />
; ambient relative humidity factor<br />
<strong>for</strong> h ≥ 0.80<br />
h: relative humidity in decimals<br />
⎧ 4.2 ⎫<br />
kt<br />
= 0.67 ⋅ exp⎨<br />
⎬; factor <strong>for</strong> maturity at the beginning of drying<br />
0<br />
⎩9.45<br />
+ to<br />
⎭<br />
f: 23 (days)<br />
B-11
Appendix C. Girder Construction and Testing<br />
This appendix presents further details of the girder design, construction, and testing.<br />
C.1 Composite Girder Design Procedure<br />
Three each Series G1 girders and three each Series G2 girders were designed with<br />
concrete design strengths, f c ’, of 8,000 psi and 10,000 psi, respectively. Based on previous<br />
experiences, it was assumed the girder lengths would be in the range of 35-45 feet. Final design<br />
lengths were revised to accommodate the tests as needed. Three tests were planned <strong>for</strong> each of<br />
the six girders indicating 18 total tests. Since two concrete strengths were being investigated,<br />
there were 9 different test configurations that were per<strong>for</strong>med on each series of girders. The<br />
prestressed girder design spreadsheet was used to iteratively design the tests to fit on the girders.<br />
The resulting tests were detailed in Table C.1. The a/d ratio listed under “Point Load Placement<br />
Criteria” is the shear span to depth ratio where “d” is the total height of the composite girder.<br />
Test<br />
Configuration<br />
Stirrup<br />
Density<br />
Table C.1 – Girder Test Configurations<br />
Point Load<br />
Placement<br />
Criteria<br />
Shear<br />
Span<br />
“a”<br />
(inches)<br />
Distance<br />
“L 1 ”<br />
Distance<br />
“L 2 ”<br />
Distance<br />
“L”<br />
(inches) (inches) (inches)<br />
1 Single l d 90 456 0 456<br />
2 Double 0.70*l d 61 316 0 456<br />
3 Double 0.85*l d 75 456 0 456<br />
4 Single 0.95*l d 85 504 0 504<br />
5 Single 0.70*l d 61 321 0 456<br />
6 Single 0.85*l d 75 369 0 504<br />
7 Minimum a/d=2.28 82 185 140 456<br />
8 Minimum a/d=2.67 96 210 135 456<br />
9 Minimum a/d=3.33 120 244 135 504<br />
d = 47.5 inches<br />
The dimension “a” was the shear span. The dimension L 1 was the distance from the left<br />
support to the right support. The dimension L 2 was the distance from the left COB to the left<br />
support. The COB was the point at a distance of 6 inches in from each girder-end that was<br />
assumed to be the girder’s support point <strong>for</strong> curing. L 2 was used to signify a cantilever on the<br />
C-1
left girder-end. The dimension L was the distance from COB to COB. The dimensions “a,” L 1 ,<br />
L 2 and L are shown in Figure C.1.<br />
Diagrams of the test configurations are depicted in Figures C.2 through C.10. Diagrams<br />
of the resulting three girders, configuration “A”, “B” and “C”, in each series, G1 and G2, are<br />
depicted in Figures C.11 through C.13.<br />
Portion of Girder Damaged During Test # 1<br />
Test # 1 on Composite Girder<br />
Portion of Girder Damaged During Test # 2<br />
Test # 2 on Composite Girder<br />
a<br />
Center<br />
Of<br />
Bearing<br />
Center<br />
Of<br />
Bearing<br />
L 2<br />
L<br />
L<br />
Test # 3 on Composite Girder<br />
Figure C.1 Test set-up<br />
C-2
6” 90” 50”<br />
Segment of girder<br />
assumed damaged<br />
during test # 1<br />
a = 90”<br />
L 1 = 456”<br />
L 2 = 0”<br />
L = 456”<br />
Single Density<br />
Stirrups (#4)<br />
Load @ l d<br />
Figure C.2 Test Configuration 1<br />
6” 61” 70”<br />
Segment of girder<br />
assumed damaged<br />
during test # 2<br />
a = 61”<br />
L 1 = 316”<br />
L 2 = 0”<br />
L = 456”<br />
Double Density<br />
Stirrups (#4)<br />
Load @ 0.7*l d<br />
6” 75” 60”<br />
Figure C.3 Test Configuration 2<br />
Segment of girder<br />
assumed damaged<br />
during test # 3<br />
a = 75”<br />
L 1 = 456”<br />
L 2 = 0”<br />
L = 456”<br />
Double Density<br />
Stirrups (#4)<br />
Load @ 0.85*l d<br />
Figure C.4 Test Configuration 3<br />
C-3
6” 85” 50”<br />
Segment of girder<br />
assumed damaged<br />
during test # 4<br />
a = 85”<br />
L 1 = 504”<br />
L 2 = 0”<br />
L = 504”<br />
Single Density<br />
Stirrups (#4)<br />
Load @ 0.95* l d<br />
6” 61” 50”<br />
Figure C.5 Test Configuration 4<br />
Segment of girder<br />
assumed damaged<br />
during test # 5<br />
a = 61”<br />
L 1 = 321”<br />
L 2 = 0”<br />
L = 456”<br />
Single Density<br />
Stirrups (#4)<br />
Load @ 0.7*l d<br />
Figure C.6 Test Configuration 5<br />
6” 75” 50”<br />
Segment of girder<br />
assumed damaged<br />
during test # 6<br />
a = 75”<br />
L 1 = 369”<br />
L 2 = 0”<br />
L = 504”<br />
Single Density<br />
Stirrups (#4)<br />
Load @ 0.85*l d<br />
Figure C.7 Test Configuration 6<br />
C-4
146” 103” 82”<br />
137”<br />
Test<br />
# 1<br />
Test<br />
# 2<br />
a = 82”<br />
L 1 = 185”<br />
L 2 = 140”<br />
L = 456”<br />
Minimum<br />
Stirrups (#4)<br />
a/d=2.28<br />
Figure C.8 Test Configuration 7<br />
141” 114” 96”<br />
117”<br />
Test<br />
# 3<br />
Test<br />
# 5<br />
a = 96”<br />
L 1 = 210”<br />
L 2 = 135”<br />
L = 456”<br />
Minimum<br />
Stirrups (#4)<br />
a/d=2.67<br />
Figure C.9 Test Configuration 8<br />
141” 124” 120”<br />
131”<br />
Test<br />
# 4<br />
Test<br />
# 6<br />
a = 120”<br />
L 1 = 244”<br />
L 2 = 135”<br />
L = 504”<br />
Minimum<br />
Stirrups (#4)<br />
a/d=3.33<br />
Figure C.10 Test Configuration 9<br />
C-5
146” 89” 96” 137”<br />
Stirrups @ 24” Spacing<br />
Test<br />
# 1<br />
Test<br />
# 7<br />
Test<br />
# 2<br />
Figure C.11 Girder Layout A<br />
141” 114” 96” 117”<br />
Stirrups @ 24” Spacing<br />
Test<br />
# 3<br />
Test<br />
# 8<br />
Test<br />
# 5<br />
Figure C.12 Girder Layout B<br />
141” 124” 120” 131”<br />
Stirrups @ 24” Spacing<br />
Test<br />
# 4<br />
Test<br />
# 9<br />
Test<br />
# 6<br />
Figure C.13 Girder Layout C<br />
C-6
C.2 Girder Construction<br />
Prior to lifting the <strong>for</strong>mwork into place, the <strong>for</strong>ms were coated with a <strong>for</strong>m release agent<br />
(<strong>for</strong>m oil). It was necessary to recheck the DEMEC embedments and wipe any excess oil from<br />
the wing nuts prior to <strong>for</strong>m installation. In a few cases, wing nuts had been knocked off the<br />
embedment strips and required replacement. Once properly aligned, the <strong>for</strong>ms were locked into<br />
place by large threaded rods beneath the <strong>for</strong>mwork and wishbone struts on top. Figure C.14<br />
shows installation of the <strong>for</strong>mwork.<br />
Figure C.14 Formwork with DEMEC Embedment Strips Being Lifted Into Place<br />
C.2.1 Batching and <strong>Concrete</strong> Placement<br />
Prior to batching the HSLC, moisture tests were conducted on the lightweight aggregate<br />
and sand to determine the exact mix design. The moisture tests were started at least two hours<br />
prior to placement to allow time to correctly dry the aggregate and configure the mix design.<br />
The concrete was mixed in a rotary auger-type mixer located in an elevated mix station<br />
approximately 200 feet from the prestressing bed. The mix station did not have a silo <strong>for</strong> fly ash<br />
or silica fume, thus those two components had to be added manually. The concrete components<br />
C-7
were added in a specific sequence <strong>for</strong> each batch of concrete. The lightweight and normal<br />
weight aggregates were added first with all the low range water reducer (LRWR), air entraining<br />
agent (AEA), high range water reducer (HRWR), and approximately half the mix water. Next,<br />
the Type III cement was added. Additional water was added as necessary to allow proper mixing<br />
of the cement. Next the Class F fly ash was added with additional water as required. Last, the<br />
silica fume was added. Any remaining water up to the specified mix design amount was added<br />
and the result was observed. If the mix was still stiff, additional HRWR was added to bring the<br />
mix to a workable state.<br />
Upon batching of concrete, it was loaded into the transport vehicle and brought to the<br />
quality control station. Tindall personnel per<strong>for</strong>med a slump test according to ASTM C231, a<br />
unit weight test according to ASTM C138, and recorded the temperature according to ASTM<br />
C1064. Georgia Tech personnel per<strong>for</strong>med an air content test using a roll-a-meter according to<br />
ASTM C173. To the greatest extent possible, these tests were per<strong>for</strong>med on each batch of<br />
concrete.<br />
After delivering concrete to the quality control station, the remaining concrete was<br />
transported to the girder line where it was placed into the <strong>for</strong>ms (Figure C.15). The Tindall<br />
concrete workers placed the concrete in lifts vibrating each lift with a spud vibrator. One<br />
Georgia Tech researcher was present on the girder line at all times during concrete placement to<br />
insure the concrete workers did not damage any instrumentation or DEMEC inserts. After all<br />
lifts of concrete were in place, the top of the girder was screeded and raked to give it the required<br />
¼-inch variation <strong>for</strong> good bond between the deck and girder. The girders were then covered with<br />
heavy plastic to protect them from rain and hold in heat during the curing process.<br />
C.2.2 <strong>Concrete</strong> Curing<br />
The girders were allowed to cure overnight. Temperature was monitored on each girder<br />
using the embedded thermocouple and a printing thermometer. A typical temperature curing<br />
curve <strong>for</strong> girder G1A is shown in Figure C.16 together with the temperature in the curing box <strong>for</strong><br />
test cylinders.<br />
C-8
Figure C.15 Placement of concrete in Girder G2-B<br />
180<br />
160<br />
Temperature<br />
(degrees Fahrenheit))<br />
140<br />
120<br />
100<br />
80<br />
60<br />
40<br />
4x8 Cylinders<br />
6x12 Cylinders<br />
4x4x14 Beams<br />
Ambient<br />
Girder G1-1<br />
0 4 8 12 16 20 24<br />
Time (hours)<br />
Figure C.16 Typical Temperature Curing Curve <strong>for</strong> Girder G1A<br />
C-9
C.2.3 Formwork Removal, Detensioning, And Measurements<br />
After the metal <strong>for</strong>ms were removed, the DEMEC steel embedment strips were<br />
unscrewed and stripped out. Initial DEMEC readings were taken. After all strands were cut, the<br />
“release” concrete surface strain, VWSG, and deflection readings and subsequent readings were<br />
recorded. After prestress release, the girders were moved to a storage area and placed on<br />
wooden dunnage located at the centers of bearing (6 inches from each end). While in storage,<br />
Georgia Tech researchers took readings as outlined in Chapter 5 to examine transfer length<br />
(Figure C.17).<br />
Figure C.17 Dr. Karl F. Meyer taking DEMEC strain measurements.<br />
C.2.4 Completion of Construction at Structures Laboratory<br />
After curing <strong>for</strong> approximately 3-4 weeks at the Tindall Plant, the girders were<br />
transported on flatbed trucks to the Georgia Tech Structures Lab. In the lab, the girders were<br />
stored as they had been at the concrete plant. One final set of surface strain, VWSG, and<br />
C-10
deflection readings were taken upon arrival and prior to beginning deck construction. Two weeks<br />
after the girders were delivered to the Georgia Tech Structures Lab, composite decks were cast<br />
on each girder. The concept <strong>for</strong> deck placement was to cast the entire deck on all six girders in<br />
one placement. Figure C.18 shows a cross section of the <strong>for</strong>mwork used to place the composite<br />
decks.<br />
Figure C.18 Formwork <strong>for</strong> Composite Deck<br />
The type of concrete used <strong>for</strong> the composite deck was the standard Georgia Department<br />
of Transportation 3,500 psi normal weight bridge deck mix. Thomas <strong>Concrete</strong>, of Atlanta,<br />
Georgia delivered the concrete to the Structures Lab in readymix trucks.<br />
C.3 Direct Pull-Out Test<br />
During girder placement, 24-inch x 36-inch x 24-inch specimen blocks were cast from<br />
the G1 and G2 series mixes <strong>for</strong> the “Mostafa”prestressing strand direct pull-out test as shown in<br />
Figure C.19.<br />
C-11
Figure C.19 Mostafa Prestressing Strand Direct Pull-out Test<br />
. Figures C.20 shows a typical plot of <strong>for</strong>ce vs. strand pull-out. All strands reached their yield<br />
stress which demonstrated adequate strand bond and good strand surface condition.<br />
60<br />
50<br />
Strand Force (kips)<br />
40<br />
30<br />
20<br />
10<br />
Strand 1<br />
Strand 2<br />
Strand 5<br />
Strand 6<br />
0<br />
0.0 0.5 1.0 1.5 2.0<br />
Strand Pull-out (inches)<br />
Figure C.20 Direct Pull-Out Results <strong>for</strong> G1 Series HSLC<br />
C-12
C.4 Girder Testing<br />
Figure C.21 shows an overall and typical test setup. During tests, cracks were marked<br />
and measurements were taken at 25 kip load increments and 0.25 inch deflection increments<br />
(Figure C.22)<br />
Hydraulic ram<br />
LVDT strain<br />
rosette<br />
Slip gages<br />
Figure C.21 Test of Girder G1-A-west.<br />
C-13
Figure C.22 Ms. Lyn Clements (GDOT) marking cracks<br />
C.5 Details of Strand Development Length Results<br />
In order to evaluate the development length test results, strand end slip was<br />
graphed against embedment length. Since only selected embedment lengths were tested, it was<br />
not possible to exactly pinpoint the development length. It was possible, however, to identify<br />
points at which the failure transitioned from flexure to shear-slip. Figure C.23 shows a bar graph<br />
<strong>for</strong> all G1 girders. The G1 1X bar graphs <strong>for</strong> the 67 and 81-inch embedment length strand slip<br />
results were limited to 0.02 inches to better show the 2X bar graph results. The table below the<br />
C-14
ar graph shows the actual strand slip values. Figure C.24 shows a bar graph <strong>for</strong> all G2 girder<br />
tests that compares average strand end slip with embedment length.<br />
Strand Slip (in)<br />
0.020<br />
0.018<br />
0.016<br />
0.014<br />
0.012<br />
0.010<br />
0.008<br />
0.006<br />
0.004<br />
0.002<br />
0.000<br />
67 81 91 96<br />
G1 1X Stirrups 0.7350 0.1988 0.0000 0.0000<br />
G1 2X Stirrups 0.0102 0.0007<br />
Strand Embedment Length (in)<br />
Figure C.23 G1 Series Girder Average Strand End Slip vs Embedment Length Values<br />
0.008<br />
Strand Slip (in)<br />
0.006<br />
0.004<br />
0.002<br />
0.000<br />
67 81 91 96<br />
G2 1X Stirrups 0.0065 0.0041 0.0000 0.0000<br />
G2 2X Stirrups 0.0033 0.0000<br />
Strand Embedment Length (in)<br />
Figure C.24 G2 Series Girder Average Strand End Slip vs Embedment Length Values<br />
C-15
If significant strand end slip over occurred during the test, it was impossible to accurately<br />
estimate what the level of stress was at a point along the strand based on CSS data. Strand end<br />
slip indicates there is a lack of adequate bond between the strand and concrete; near perfect bond<br />
is necessary <strong>for</strong> CSS to be a meaningful predictor of an increase in strand stress. A telling<br />
depiction of the effect of strand end slip can be seen in Figure C.25 <strong>for</strong> test G1B-East, which<br />
shows the stress level in the strand to be 260 ksi near the end of the girder and only 227 ksi at the<br />
point of load application. Extensive shear cracking in the transfer length region during test G1B-<br />
East initiated a strand slip failure resulting in strand end slip of 0.75 inches. The slip allowed the<br />
shear cracks to expand causing CSS values in that region to become extremely large. When used<br />
to predict strand strain, the values were found to be erroneous.<br />
300<br />
Stress in Strands (ksi)<br />
250<br />
200<br />
150<br />
100<br />
50<br />
0<br />
0 10 20 30 40 50 60 70 80<br />
Distance From Girder End (Inches)<br />
Strand Yield Stress at Load Point<br />
Strand Maximum Stress at Load Point<br />
Strand Maximum Stress<br />
Effective Prestress<br />
Crack Locations<br />
Figure C.25 G1B-East Strand Stress vs. Distance from Girder end<br />
In tests where strand slip was less than 0.01 inches, the CSS data appeared consistent and<br />
was used to determine the strain and the stress in the prestressing strand. Two trends became<br />
evident in examining these plots. First, in every case where strand slip was under 0.01 inches,<br />
there was an observed increase in strand stress in the transfer length region above the level of<br />
effective prestress. The effect was far more pronounced with shorter embedment lengths.<br />
C-16
Second, in some cases, the length over which the largest amount of prestressing <strong>for</strong>ce was<br />
transferred appeared to be a distance somewhat less than the original transfer length discussed in<br />
Chapter 5. Figure C.26 shows test G1A-East as an example of the strand stress increase in the<br />
transfer length region as well as the apparent reduction in transfer length. The embedment length<br />
on this test was only 67 inches. The “lone” triangle plots the maximum stress in the strand at the<br />
point of loading at the girder’s ultimate load. This actual plot of strand stress differs<br />
significantly from the theoretical diagram which would go linearly from “0” to the triangle.<br />
300<br />
Stress in Strands (ksi)<br />
250<br />
200<br />
150<br />
100<br />
50<br />
0<br />
0 10 20 30 40 50 60 70 80<br />
Distance From Girder End (Inches)<br />
Strand Yield Stress at Load Point<br />
Strand Maximum Stress at Load Point<br />
Strand Maximum Stress<br />
Effective Prestress<br />
Crack Locations<br />
Figure C.26 G1A-East Strand Stress vs. Distance from Girder End<br />
Figure C.27 shows typical CSS data corresponding with applied shear levels, the location<br />
of shear cracks crossing the bottom strands, and the transfer length region. CSS data was plotted<br />
because it provided a measure of crack growth and allowed identification of the cracks that were<br />
increasing most significantly in size. Comparing crack locations with the resulting end slip<br />
allowed determination of the region where shear cracking most significantly impacted strand<br />
slip. Based on crack location, a comparison was made between strand slip in girders with single<br />
and double density shear rein<strong>for</strong>cement.<br />
C-17
CSS at Level of Bottom Strands (µε)<br />
4500<br />
4000<br />
3500<br />
3000<br />
2500<br />
2000<br />
1500<br />
1000<br />
500<br />
0<br />
0 10 20 30 40<br />
Crack<br />
Lt<br />
V=169 K<br />
V=242 K<br />
V=291 K<br />
V=315 K<br />
V=339K<br />
V=355 K<br />
Distance From Girder End (Inches)<br />
Shear Crack Data<br />
Distance From End (Inches) 5.0 7.0 12.5 20.5 23.5 26.5 34.0 42.0 44.0 47.5<br />
Applied Shear at Cracking (Kips) 169 315 242 339 315 355 339 339 291 355<br />
Figure C.27 G1A-East CSS and Shear Cracking vs. Distance from Girder End<br />
Shear cracking across the bottom strands within the transfer length region initiated large<br />
increases in strand end slip. Russell (1992) reported this phenomenon. Despite several shear<br />
cracks in the transfer length region, tests G1B-West and G2B-West showed no slip because of<br />
the double stirrup density. Tests G1A-East and G2A-East showed slip, but at very small or<br />
almost acceptable levels. Russell reported that additional bond stresses can be developed<br />
beyond initial strand slip and that small slips are not always followed by complete anchorage<br />
failure. Russell also reported that closely spaced cracks were an indication of good bond and<br />
wide crack spacing indicated poor bond. Both of Russell’s observations were confirmed in the<br />
present tests.<br />
<strong>Concrete</strong> grade also played a significant role in determining development length. Table<br />
5.11 clearly demonstrates a reduction in development length based on concrete grade alone. The<br />
G1 series girders had compressive strengths on average approximately 1500 psi less than the G2<br />
series girders. The water cement ratios were approximately 0.29 <strong>for</strong> the G1 series girders and<br />
0.23 <strong>for</strong> the G2 series girders. A significant difference between the two mix designs was the<br />
amount of silica fume. The G1 series girders had 2 percent silica fume by weight of the total<br />
C-18
cementitious materials, and the G2 series girders had 10 percent. Leming (1988), Vaysburg<br />
(1996), and Yeginobali et al. (1998) have stated that the addition of silica fume will significantly<br />
improve the tensile strength and bond of lightweight concrete to prestressing strand. The results<br />
of the present research confirm this observation.<br />
C-19
Appendix D. Prestress Losses in HPLC<br />
D.1 General<br />
Prestress losses in special concretes such as structural lightweight concrete (SLC), high<br />
per<strong>for</strong>mance concrete (HPC), and high per<strong>for</strong>mance lightweight concrete (HPLC) follow the<br />
same principles and are affected by the same factors that affect normal weight normal strength<br />
concrete (NWNSC), but they are influenced by the particular properties of each.<br />
Prestress losses in HPC: HPC usually has higher modulus of elasticity, a lower creep and<br />
a similar or lower shrinkage than a NSC. Based on that, it is expected to obtain fewer losses due<br />
to elastic shortening, fewer losses due to creep losses, similar or fewer losses due to shrinkage,<br />
and more losses due to steel relaxation. The expected increase in steel relaxation losses is a<br />
consequence of a higher stress level in the prestressing steel due to a decrease on concrete losses.<br />
Total losses are expected to be less than NSC. According Roller et al. (1995), measured longterm<br />
prestress losses in HPC prestressed girder were approximately 50% less than the expected<br />
value.<br />
Prestress losses in SLC: Properties of SLC may vary in a wide range, so the prestress<br />
losses may also widely vary. In general SLC presents a lower modulus of elasticity than a NWC<br />
of the same strength. It also has a higher ultimate creep and ultimate shrinkage than the NWC<br />
counterparts. There<strong>for</strong>e, elastic shortening, and final creep and shrinkage losses are expected to<br />
be greater in SLC. Steel relaxation losses, however, are going to decrease due to the increase in<br />
the others. ACI-213 (1999) concluded that combined loss of prestress in a SLC member is about<br />
110 to 115% of the total losses <strong>for</strong> NWC when both are cured normally. If they are steam-cured,<br />
prestress losses in SLC are expected to be 124% of the losses in NWC. PCI (1998) gave a range<br />
<strong>for</strong> total prestress losses of “sand-lightweight” members of 30,000 to 55,000 psi which is about<br />
15% higher than the range given <strong>for</strong> NWC.<br />
Prestress losses in HPLC: To the authors’ knowledge, there is no previous research on<br />
prestress losses of HPLC; however, from the material properties some conclusions can be drawn.<br />
Elastic shortening losses are expected to be similar or less than NWNSC but more than HPC.<br />
Creep and shrinkage losses would be similar to the one of HPC. Steel relaxation losses would<br />
tend to be higher than losses in NWNSC because the previous losses are lower.<br />
D-1
D.2 Standard Prediction Methods<br />
Prestress losses methods can be classified into two groups: (1) final prestress losses<br />
estimate and (2) losses estimated at any time. There are three methods <strong>for</strong> estimating final<br />
prestress losses: Precast Prestressed <strong>Concrete</strong> Institute Method (PCI, 1999), refined estimate and<br />
approximate lump sum estimate, both proposed by the American Association of State <strong>High</strong>way<br />
and Transportation Officials Method (AASHTO-LRFD, 1998). For losses at any time, American<br />
<strong>Concrete</strong> Institute Committee 209 (ACI-209, 1997) proposed a prestress loss estimate method<br />
based on creep and shrinkage estimates (Equations B.1 and B.3 in Appendix B).<br />
Even though anchorage seating losses and friction losses can be an important portion of the<br />
total prestress losses, they are not considered here because such losses are related with the<br />
manufacturing process rather than material properties.<br />
D.2.1. PCI Method<br />
The PCI method gives an estimate of the final prestress losses of a prestressed concrete member<br />
based on four equations <strong>for</strong> each type of losses. They are applicable to NWC and SLC. Total<br />
losses are given by Equation D.1<br />
T . L.<br />
= ES + CR + SH + RE<br />
(D.1)<br />
where<br />
T.L.: total prestress losses (ksi)<br />
ES: elastic shortening loss (ksi)<br />
CR: creep of concrete loss (ksi)<br />
SH: shrinkage of concrete loss (ksi)<br />
RE: steel relaxation loss (ksi)<br />
Elastic Shortening. Caused by concrete shortening around tendons as the prestressing <strong>for</strong>ce is<br />
transferred, elastic shortening can be estimated by Equation D.2.<br />
K<br />
es<br />
⋅ E<br />
ps<br />
⋅ f<br />
cir<br />
ES = (D.2)<br />
E<br />
ci<br />
where<br />
ES: elastic shortening loss (ksi)<br />
K es : elastic shortening constant, 1.0 <strong>for</strong> pretensioned members<br />
D-2
E ps : elastic modulus of prestressing steel (ksi)<br />
E ci : elastic modulus of concrete at transfer (ksi)<br />
f<br />
cir<br />
= K<br />
cir<br />
⎛ Pi<br />
⋅⎜<br />
⎝ Ag<br />
Pi<br />
⋅ e<br />
+<br />
I<br />
g<br />
2<br />
⎞ M<br />
⎟ −<br />
⎠ I<br />
g<br />
g<br />
⋅ e<br />
: net compressive stress in the section at the center of gravity<br />
of the prestressing <strong>for</strong>ce (cgs) immediately after transfer (ksi)<br />
where<br />
K cir : a constant, 0.9 <strong>for</strong> pretensioned members<br />
P i : initial prestressing <strong>for</strong>ce after anchorage seating loss (kip)<br />
e: eccentricity of the cgs. with respect to the center of gravity of the section at the cross section<br />
considered. Eccentricity is negative if below concrete section neutral axis (in)<br />
A g : gross area of the section (in 2 )<br />
I g : gross moment of inertia (in 4 )<br />
M g : the dead load gravity moment applied to the section at time of prestressing (kip-in)<br />
Creep of concrete. The final loss of prestress due to creep is given by Equation D.3.<br />
⎛ E<br />
ps ⎞<br />
CR = K<br />
cr<br />
⋅<br />
⎜ ⋅ ( f<br />
cir<br />
− f<br />
cds<br />
)<br />
E<br />
⎟<br />
(D.3)<br />
⎝ c ⎠<br />
where<br />
CR: creep loss (ksi)<br />
⎧2.0 <strong>for</strong> NWC<br />
K<br />
cr<br />
= ⎨<br />
: creep constant<br />
⎩1.6 <strong>for</strong> SLC<br />
E c : elastic modulus of concrete at design age (ksi)<br />
E ps : elastic modulus of prestressing steel (ksi)<br />
M<br />
e<br />
sd<br />
f<br />
cds<br />
= : stress in concrete at the cgs due to all superimposed dead loads (ksi)<br />
I<br />
g<br />
M sd : Moment due to all superimposed permanent dead loads and sustained loads after<br />
prestressing (kip-inches)<br />
I g : gross moment of inertia (in 4 )<br />
D-3
Shrinkage of concrete. The final prestress loss due to drying shrinkage is given by member<br />
geometry and relative humidity at which member is exposed. Equation D.4 shows PCI<br />
expression to estimate shrinkage loss.<br />
SH<br />
⎛ V ⎞<br />
( ×<br />
6<br />
8.2 10 ) ⋅ K ⋅ E ⋅ ⎜1<br />
− 0.06 ⎟ ⋅ ( 100 − RH )<br />
=<br />
−<br />
sh<br />
ps<br />
⎝<br />
S ⎠<br />
where,<br />
SH: shrinkage loss (ksi)<br />
K sh : 1.0 <strong>for</strong> pretensioned members<br />
E ps : elastic modulus of prestressing steel (ksi)<br />
V: specimen volume (in 3 )<br />
S: specimen surface area (in 2 )<br />
RH: relative humidity, %<br />
(D.4)<br />
Steel relaxation. defined as the loss of stress over a certain period of time, steel relaxation<br />
depends on the type of prestressing steel (stress-relieved or lo relaxation) and the other prestress<br />
losses. Equation D.5 gives the loss of prestress due to steel relaxation.<br />
[ K − J ⋅ ( SH + CR + ES ) ⋅ ( − RH )] C<br />
RE =<br />
re<br />
100 ⋅<br />
(D.5)<br />
where<br />
RE: steel relaxation loss (ksi)<br />
K re : maximum relaxation stress, 5,000 psi <strong>for</strong> grade 270, low relaxation strands<br />
J: parameter, 0.04 <strong>for</strong> grade 270, low relaxation strands,<br />
ES: elastic shortening loss (ksi)<br />
CR: creep of concrete loss (ksi)<br />
SH: shrinkage of concrete loss (ksi)<br />
C: parameter depending on the initial prestress to ultimate strand strength and strand type, 0.70<br />
in this case.<br />
D-4
D.2.2. AASHTO-LRFD Refined Estimates of Time-Dependent Losses<br />
According to AASHTO-LRFD (1998), the total loss of prestress, not including anchorage<br />
seating loss, is the sum of the elastic shortening, creep, shrinkage, and steel relaxation losses,<br />
given by Equation D.6. Equation D.6 applies to prestressed members with spans no greater than<br />
250 ft., NWC and compressive strength above 3,500 psi.<br />
∆ f = ∆f<br />
+ ∆f<br />
+ ∆f<br />
+ ∆f<br />
+ ∆f<br />
(D.6)<br />
pT<br />
pES<br />
pCR<br />
pSH<br />
pR1 pR2<br />
where<br />
∆f pT : total prestress losses (ksi)<br />
∆f pES : elastic shortening loss (ksi)<br />
∆f pCR : creep of concrete loss (ksi)<br />
∆f pSR : shrinkage of concrete loss (ksi)<br />
∆f pR1 : initial steel relaxation loss (ksi)<br />
∆f pR2 : after transfer steel relaxation loss (ksi)<br />
Elastic Shortening. According to AASHTO-LRFD, the Elastic shortening loss is given by<br />
Equation D.7.<br />
E<br />
p<br />
∆ f<br />
pES<br />
= ⋅ f<br />
cgp<br />
(D.7)<br />
E<br />
ci<br />
where,<br />
∆f pES : elastic shortening loss (ksi)<br />
f<br />
cgp<br />
⎛ Pi<br />
= ⎜<br />
⎝ Ag<br />
Pi<br />
⋅ e<br />
+<br />
I<br />
g<br />
2<br />
⎞ M<br />
⎟ −<br />
⎠ I<br />
g<br />
g<br />
⋅ e<br />
( f cgp ) : sum of the stresses in the concrete at the cgs due to<br />
prestress <strong>for</strong>ce at transfer and the maximum dead load moment (ksi)<br />
P i : initial prestressing <strong>for</strong>ce after anchorage seating loss (kip)<br />
e: eccentricity of the cgs. with respect to the center of gravity of the section at the cross section<br />
considered. Eccentricity is negative if below concrete section neutral axis (in)<br />
A g : gross area of the section (in 2 )<br />
I g : gross moment of inertia (in 4 )<br />
M g : the dead load gravity moment applied to the section at time of prestressing (kip-in)<br />
D-5
E p : elastic modulus of prestressing steel (ksi)<br />
E ci : elastic modulus of concrete at transfer (ksi)<br />
Creep of concrete. The final loss of prestress due to creep is given by Equation D.8.<br />
∆f<br />
= 12 ⋅ f − 7 ⋅ ∆f<br />
(D.8)<br />
pCR<br />
cgp<br />
cds<br />
where,<br />
∆f pCR : creep of concrete loss (ksi)<br />
f<br />
cgp<br />
⎛ Pi<br />
= ⎜<br />
⎝ Ag<br />
Pi<br />
⋅ e<br />
+<br />
I<br />
g<br />
2<br />
⎞ M<br />
g<br />
⎟ −<br />
⎠ I<br />
g<br />
⋅ e<br />
(f cgp ) : sum of the stresses in the concrete at the cgs due to<br />
prestress <strong>for</strong>ce at transfer and the maximum dead load moment (ksi)<br />
P i : initial prestressing <strong>for</strong>ce after anchorage seating loss (kip)<br />
e: eccentricity of the cgs. with respect to the center of gravity of the section at the cross section<br />
considered. Eccentricity is negative if below concrete section neutral axis (in)<br />
A g : gross area of the section (in 2 )<br />
I g : gross moment of inertia (in 4 )<br />
M g : the dead load gravity moment applied to the section at time of prestressing (kip-in)<br />
M<br />
∆ f<br />
cds<br />
=<br />
I<br />
sd<br />
g<br />
e<br />
: change in concrete stress at the center of gravity of prestressing strands due to<br />
permanent loads, with the exception of the loads at the time the prestressing <strong>for</strong>ce is applied.<br />
(ksi)<br />
Shrinkage of concrete. The prestress loss due to drying shrinkage is given in Equation D.9.<br />
∆ = 17 .0 − 0. 15⋅<br />
H<br />
(D.9)<br />
f pSR<br />
where,<br />
∆f pSR : shrinkage of concrete loss (ksi)<br />
H: relative humidity, %<br />
Steel relaxation. Steel relaxation loss is considered to be comprised of two components:<br />
relaxation at transfer and relaxation over the rest of the life of the girder. For low relaxation<br />
strands, the two components are given by Equations D.10 and D.11.<br />
D-6
∆f<br />
log(24 ⋅t)<br />
⎛ f<br />
⎜<br />
⎞<br />
55⎟<br />
⎝ ⎠<br />
pj<br />
pR1 = ⋅ − 0. ⋅ f<br />
⎜<br />
pj<br />
(D.10)<br />
40 f ⎟<br />
py<br />
where,<br />
∆f pR1 : initial steel relaxation loss (ksi)<br />
t: time since prestressing (days)<br />
f pj : initial prestress (ksi)<br />
f py : yield strength of the prestressing steel (ksi)<br />
∆f<br />
= − ⋅ ∆f<br />
− 2 ⋅<br />
( ∆f<br />
+ ∆f<br />
)<br />
pR2 20 0.4<br />
pES<br />
0.<br />
pSR pCR<br />
(D.11)<br />
where<br />
∆f pR2 : after transfer steel relaxation loss (ksi)<br />
∆f pES : elastic shortening loss (ksi)<br />
∆f pCR : creep of concrete loss (ksi)<br />
∆f pSR : shrinkage of concrete loss (ksi)<br />
D.2.3. AASHTO-LRFD Lump Sum Estimate of Time-Dependent Losses<br />
Lump sum method is based on data taken from a large number of prestressed structures, and it<br />
gives an estimate of final prestress losses due to concrete creep and shrinkage and steel<br />
relaxation. According to AASHTO-LRFD (1998), Lump sum method is applicable to members<br />
that are made from NWC, so it is not suitable <strong>for</strong> predicting losses in SLC. Lump sum method<br />
proposes eleven equations depending on the type of beam section and prestressing element<br />
(strands, bars). For I-shaped girders prestressed with 235, 250, or 270 ksi wires or strands, the<br />
time-dependent losses can be obtained from Equation D.12.<br />
⎡ f<br />
c<br />
' −6.0⎤<br />
∆f<br />
pTD<br />
= 33 .0 ⋅ ⎢1.0<br />
− 0.15⋅<br />
⎥ + 6. 0 ⋅ PPR<br />
(D.12)<br />
⎣<br />
6.0 ⎦<br />
where<br />
∆f pTD : time-dependent losses (ksi)<br />
f c ’: compressive strength of concrete cylinders at 28 days (ksi)<br />
D-7
Aps<br />
⋅ f<br />
py<br />
PPR = : partial prestressing ratio<br />
A ⋅ f + A ⋅ f<br />
ps<br />
py<br />
s<br />
y<br />
A ps : area of prestressing steel (in 2 )<br />
f py : yield stress of prestressing steel (ksi)<br />
A s : area of non-prestressing steel (in 2 )<br />
f y : yield stress of non-prestressing steel (ksi)<br />
D.2.4. ACI-209 Method<br />
Based on creep and shrinkage equations presented in section B.3.1, ACI through its committee<br />
209, proposed a general expression <strong>for</strong> estimating loss of prestress in prestressed concrete beams<br />
as shown in Equation D.13. ACI-209 considered data from SLC in developing their equations;<br />
there<strong>for</strong>e, the following equations are applicable to SLC.<br />
[ ES + CR + SH + ( f ) ]<br />
sr t<br />
λ<br />
t<br />
=<br />
×100<br />
(D.13)<br />
f<br />
si<br />
where<br />
λ t : prestress losses in percent of the initial tensioning stress<br />
ES: elastic shortening loss (ksi)<br />
CR: creep of concrete loss (ksi)<br />
SH: shrinkage of concrete loss (ksi)<br />
(f sr ) t : steel relaxation loss (ksi)<br />
f si : initial tensioning stress (ksi)<br />
Elastic Shortening. Elastic shortening can be estimated by Equation D.14<br />
ES = n ⋅<br />
(D.14)<br />
f c<br />
where<br />
ES: elastic shortening loss (ksi)<br />
n: modular ratio at the time of prestressing<br />
f<br />
c<br />
=<br />
P<br />
A<br />
i<br />
g<br />
Pi<br />
⋅ e<br />
+<br />
I<br />
g<br />
2<br />
M<br />
+<br />
I<br />
g<br />
g<br />
⋅ e<br />
: net compressive stress in the section at the center of gravity of the<br />
prestressing <strong>for</strong>ce (cgs) immediately after transfer (ksi)<br />
D-8
P i : initial prestressing <strong>for</strong>ce after anchorage seating loss (kip)<br />
e: eccentricity of the cgs. with respect to the center of gravity of the section at the cross section<br />
considered. Eccentricity is negative if below concrete section neutral axis (in)<br />
A g : gross area of the section (in 2 )<br />
I g : gross moment of inertia (in 4 )<br />
M g : the dead load gravity moment applied to the section at time of prestressing (kip-in)<br />
Creep of concrete. Equation D.15 shows the expression used <strong>for</strong> creep losses estimate.<br />
⎛ Ft<br />
⎞<br />
CR = ES ⋅φ ⋅<br />
⎜1−<br />
⎟<br />
t<br />
(D.15)<br />
⎝ 2 ⋅ F0<br />
⎠<br />
where<br />
CR: creep of concrete loss (ksi)<br />
ES: elastic shortening loss (ksi)<br />
φ t : creep coefficient as defined by ACI-209 (Equation B.1 of Appendix B)<br />
F t : Loss of prestress ratio given in Table D.1<br />
F 0<br />
Table D.1. Loss of prestress ratios <strong>for</strong> different concretes and time under loading conditions<br />
Type of concrete<br />
Normal<br />
weight<br />
concrete<br />
Sandlightweight<br />
concrete<br />
Alllightweight<br />
concrete<br />
For three weeks to one month between<br />
0.10 0.12 0.14<br />
prestressing and sustained load application<br />
For two to three months between prestressing 0.14 0.16 0.18<br />
and sustained load application<br />
Ultimate 0.18 0.21 0.23<br />
D-9
Shrinkage of concrete. Prestress losses due to drying shrinkage are estimated by Equation D.16.<br />
The denominator K SE represents the stiffening effect of the steel and the effect of concrete creep.<br />
Without K SE the losses due to drying shrinkage are somewhat overestimated.<br />
E<br />
ps<br />
SH = ( ε<br />
sh<br />
) ⋅<br />
(D.16)<br />
t<br />
K<br />
SE<br />
where<br />
SH: shrinkage of concrete loss (ksi)<br />
(ε sh ) t : shrinkage strain as defined by ACI-209 (Equation B.3 of Appendix B)<br />
E ps : Elastic modulus of prestressing steel<br />
K<br />
SE<br />
= 1 + n ⋅ ρξ =1.25 (design simplification)<br />
s<br />
n: modular ratio at the time of prestressing<br />
ρ: non-prestressing rein<strong>for</strong>cement ratio<br />
ξ s : cross section shape coefficient<br />
Steel relaxation. Steel relaxation losses depend on the steel of the strands (stress-relieved or low<br />
relaxation), and time. For low relaxation strands, the relaxation losses are given by Equation<br />
D.17.<br />
[] t<br />
RE = 0.005⋅<br />
f<br />
pj<br />
⋅ log10<br />
(D.17)<br />
where<br />
RE: steel relaxation loss (ksi)<br />
f pj : initial prestress (ksi)<br />
t: time under load in hours (<strong>for</strong> t>10 5 , RE = 0 . 025⋅<br />
f<br />
pj<br />
)<br />
D-10
References<br />
AASHTO (1996), Standard Specifications <strong>for</strong> <strong>High</strong>way Bridges, 16 th ed., American<br />
Association of State <strong>High</strong>way and Transportation Officials, Washington, D. C., 1996.<br />
AASHTO-LRFD (1998), LRFD Bridge Design Specifications, American Association of<br />
State <strong>High</strong>way and Transportation Officials, Washington, D. C., 1998.<br />
ACI 318-89, Building Code Requirements <strong>for</strong> Rein<strong>for</strong>ced <strong>Concrete</strong>, ACI 318-89, and<br />
Commentary, American <strong>Concrete</strong> Institute, Detroit, 1989.<br />
ACI 318-99, Building Code Requirements <strong>for</strong> Rein<strong>for</strong>ced <strong>Concrete</strong>, ACI 318-99, and<br />
Commentary, American <strong>Concrete</strong> Institute, Detroit, 1999.<br />
ACI Manual of <strong>Concrete</strong> Practice, “Standard Practice <strong>for</strong> Selecting Proportions <strong>for</strong> Structural<br />
<strong>Lightweight</strong> <strong>Concrete</strong> (ACI 211.2-91), American <strong>Concrete</strong> Institute, Detroit, 1996.<br />
ACI-Committee116 (2000) "Cement and <strong>Concrete</strong> Terminology", ACI Manual of <strong>Concrete</strong><br />
Practice, American <strong>Concrete</strong> Institute, Farmington Hills, MI, pp. 116R.1-16R.73.<br />
ACI-Committee209 (1971). "Effect of <strong>Concrete</strong> Constituent, Environment, and Stress on the<br />
Creep and Shrinkage of <strong>Concrete</strong>". Designing <strong>for</strong> Effects of Creep, Shrinkage, Temperature<br />
in <strong>Concrete</strong> Structures, Farmington Hills, MI, American <strong>Concrete</strong> Institute.<br />
ACI-Committee209 (1992/Reapproved 1997) "Prediction of Creep, Shrinkage, and<br />
Temperature Effects in <strong>Concrete</strong> Structures", ACI Manual of <strong>Concrete</strong> Practice, American<br />
<strong>Concrete</strong> Institute, Farmington Hills, MI, pp. 209R.1-09R.47.<br />
ACI-Committee213 (1987/Reapproved 1999) "Guide <strong>for</strong> Structural <strong>Lightweight</strong> Aggregate<br />
<strong>Concrete</strong>", ACI Manual of <strong>Concrete</strong> Practice, American <strong>Concrete</strong> Institute, Farmington<br />
Hills, MI, pp. 213R.1-31R.27.<br />
ACI-Committee363 (1992/Reapproved 1997) "State-of-the-Art Report on <strong>High</strong>-<strong>Strength</strong><br />
<strong>Concrete</strong>", ACI Manual of <strong>Concrete</strong> Practice, American <strong>Concrete</strong> Institute, Farmington<br />
Hills, MI, pp. 363R.1-63R.55.<br />
ASTM C 31, Standard Practice <strong>for</strong> Making and Curing <strong>Concrete</strong> Test Specimens in the<br />
Field, American Society <strong>for</strong> Testing and Materials, West Conshohocken, PA, 1998, 5 pp.<br />
ASTM C 33, Standard Specification <strong>for</strong> <strong>Concrete</strong> Aggregates, American Society <strong>for</strong> Testing<br />
and Materials, West Conshohocken, PA, 1999, 8 pp.<br />
ASTM C 39, Standard Test Method <strong>for</strong> Compressive <strong>Strength</strong> of Cylindrical <strong>Concrete</strong><br />
Specimens, American Society <strong>for</strong> Testing and Materials, West Conshohocken, PA, 1999, 5<br />
pp.<br />
References-1
ASTM C 78, Standard Test Method <strong>for</strong> Flexural <strong>Strength</strong> of <strong>Concrete</strong> (Using Simple Beam<br />
with Third-Point Loading), American Society <strong>for</strong> Testing and Materials, West<br />
Conshohocken, PA, 1994, 3 pp.<br />
ASTM C 127, Standard Test Method <strong>for</strong> Specific Gravity and Absorption of Coarse<br />
Aggregate, American Society <strong>for</strong> Testing and Materials, West Conshohocken, PA, 1993, 5<br />
pp.<br />
ASTM C 128, Standard Test Method <strong>for</strong> Specific Gravity and Absorption of Fine Aggregate,<br />
American Society <strong>for</strong> Testing and Materials, West Conshohocken, PA, 1997, 5 pp.<br />
ASTM C 138, Standard Test Method <strong>for</strong> Unit Weight, Yield, and air Content (Gravimetric)<br />
of <strong>Concrete</strong>, American Society <strong>for</strong> Testing and Materials, West Conshohocken, PA, 2000, 3<br />
pp.<br />
ASTM C 143, Standard Test Method <strong>for</strong> Slump of Hydraulic-Cement <strong>Concrete</strong>, American<br />
Society <strong>for</strong> Testing and Materials, West Conshohocken, PA, 1998, 3 pp.<br />
ASTM C 150, Standard Specification <strong>for</strong> Portland Cement, American Society <strong>for</strong> Testing<br />
and Materials, West Conshohocken, PA, 2000.<br />
ASTM C 173, Standard Test Method <strong>for</strong> Air Content of Freshly Mixed <strong>Concrete</strong> by the<br />
Volumetric Method, American Society <strong>for</strong> Testing and Materials, West Conshohocken, PA,<br />
1994, 3 pp.<br />
ASTM C 231, Standard Test Method <strong>for</strong> Air Content of Freshly Mixed <strong>Concrete</strong> by the<br />
Pressure Method, American Society <strong>for</strong> Testing and Materials, West Conshohocken, PA,<br />
1994, 3 pp.<br />
ASTM C 260, Standard Specification <strong>for</strong> Air Entraining Admixtures <strong>for</strong> <strong>Concrete</strong>, American<br />
Society <strong>for</strong> Testing and Materials, West Conshohocken, PA, 2000, 3 pp.<br />
ASTM C 330, Standard Specification <strong>for</strong> <strong>Lightweight</strong> Aggregates <strong>for</strong> Structural <strong>Concrete</strong>,<br />
American Society <strong>for</strong> Testing and Materials, West Conshohocken, PA, 1999, 4 pp.<br />
ASTM C 469, Standard Test Method <strong>for</strong> Static Modulus of Elasticity and Poisson’s Ratio of<br />
<strong>Concrete</strong> in Compression, American Society <strong>for</strong> Testing and Materials, West Conshohocken,<br />
PA, 1994, 4 pp.<br />
ASTM C 494, Standard Specification <strong>for</strong> Chemical Admixtures <strong>for</strong> <strong>Concrete</strong>, American<br />
Society <strong>for</strong> Testing and Materials, West Conshohocken, PA, 1999, 9 pp.<br />
ASTM C 496, Standard Test Method <strong>for</strong> Splitting Tensile <strong>Strength</strong> of Cylindrical <strong>Concrete</strong><br />
Specimens, American Society <strong>for</strong> Testing and Materials, West Conshohocken, PA, 1996, 4<br />
pp.<br />
ASTM C 512, Standard Test Method <strong>for</strong> Creep of <strong>Concrete</strong> in Compression, American<br />
Society <strong>for</strong> Testing and Materials, West Conshohocken, PA, 1992, 4 pp.<br />
References-2
ASTM C 618, Standard Specification <strong>for</strong> Coal Fly Ash and Raw or Calcined Natural<br />
Pozzolan <strong>for</strong> Use as a Mineral Admixture in <strong>Concrete</strong>, American Society <strong>for</strong> Testing and<br />
Materials, West Conshohocken, PA, 1999, 4pp.<br />
ASTM C 1064, Standard Test Method <strong>for</strong> Temperature of Freshly Mixed Portland Cement<br />
<strong>Concrete</strong>, American Society <strong>for</strong> Testing and Materials, West Conshohocken, PA, 1999, 2 pp.<br />
ASTM C 1231, Standard Practice <strong>for</strong> Use of Unbonded Caps in Determination of<br />
Compressive <strong>Strength</strong> of Hardened <strong>Concrete</strong> Cylinders, American Society <strong>for</strong> Testing and<br />
Materials, West Conshohocken, PA, 2000, 4 pp.<br />
Barnes, R. W., Burns, N. H., Kreger, M. E., “Development Length of 0.6-inch Prestressing<br />
Strand in Standard I-Shaped Pretensioned <strong>Concrete</strong> Beams,” Research Report 1388-1, Center<br />
<strong>for</strong> Transportation Research, Bureau of Engineering Research, The University of Texas at<br />
Austin, December 1999, 318 pp.<br />
Bender, B. F., “Economics and Use of <strong>Lightweight</strong> <strong>Concrete</strong> in Prestressed Structures,” PCI<br />
Journal, Vol. 35, No. 6, November-December 1980, pp. 62-67.<br />
Bilodeau, A., Chevrier, R., Malhotra, M., Hoff, G. C., “Mechanical Properties, Durability<br />
and Fire Resistance of <strong>High</strong>-<strong>Strength</strong> <strong>Lightweight</strong> <strong>Concrete</strong>,” Proceedings of the<br />
International Symposium on Structural <strong>Lightweight</strong> Aggregate <strong>Concrete</strong>, Sandefjord,<br />
Norway, June 1995, pp. 432-443.<br />
Bond of Rein<strong>for</strong>cement in <strong>Concrete</strong>, International Federation <strong>for</strong> Structural <strong>Concrete</strong> (fib)<br />
State-of-Art Report, Bulletin 10, Lausanne, Switzerland, 2000, 427 pp.<br />
Bremner, T. W., Holm, T. A., “Elastic Compatibility and the Behavior of <strong>Concrete</strong>,” ACI<br />
Journal, Vol. 83, No. 2, March-April 1986, pp. 244-250.<br />
Bremner, T. W., Holm, T. A., Ries, J. P., “Enhanced Hydration and Properties of Specified<br />
Density <strong>Concrete</strong>,” <strong>Expanded</strong> <strong>Shale</strong>, <strong>Clay</strong> and Slate Institute In<strong>for</strong>mation Sheet 4284.1,<br />
February 2001, 8 pp.<br />
Bremner, T. W., Newman, “Microstructure of Low Density <strong>Concrete</strong> Aggregate,”<br />
Proceedings of the Ninth Congress of the Federation Internationale de la Precontrainte,<br />
Volume 3, Commission Reports, Stockholm, June 1982.<br />
Brown, W. R., Davis, C. R., A Load Response Investigation of Long Term Per<strong>for</strong>mance of a<br />
Prestressed <strong>Lightweight</strong> <strong>Concrete</strong> Bridge at Fanning Springs, Florida, Final Report, No.<br />
FL/DOT/SMO-93-401, Florida Department of Transportation, April 1993, 66 pp.<br />
Buchberg, B. S. (2002) "Investigation of Mix Design and Properties of <strong>High</strong>-<strong>Strength</strong>/<strong>High</strong>-<br />
Per<strong>for</strong>mance <strong>Lightweight</strong> <strong>Concrete</strong>", School of Civil & Environmental Engineering, Georgia Institute<br />
of Technology, Atlanta, pp. 453.<br />
Buckner, C. D., “A Review of Strand Development Length <strong>for</strong> Pretensioned <strong>Concrete</strong><br />
Members,” PCI Journal, Vol. 40, No. 2, March/April 1995, pp. 84-105.<br />
References-3
Cagley, J. R., “Changing from ACI 318-99 to ACI 318-02, What’s New?,” <strong>Concrete</strong><br />
International, Vol. 23, No. 6, June 2001, pp. 69-182.<br />
Carolina Stalite, In<strong>for</strong>mation from Carolina Stalite Company, Salisbury, NC, 2000, 6 pp.<br />
Collins, M. P., Mitchell, D., Prestressed <strong>Concrete</strong> Structures, Prentice Hall, Englewood<br />
Cliffs, New Jersey, 1991.<br />
Comite Euro-Internacional du Beton (CEB), Federation Internationale de la Precontrainte<br />
(FIP) (1977) "<strong>Lightweight</strong> Aggregate <strong>Concrete</strong>. CEB/FIP Manual of Design and<br />
Technology", The Construction Press, Lancaster.<br />
Comite Euro-Internacional du Beton (CEB), Federation Internationale de la Precontrainte<br />
(FIP) (1990) "Evaluation of the Time Dependent Behavior of <strong>Concrete</strong>", The Construction<br />
Press, Lancaster.<br />
Deatherage, J. H., Burdette, E. G., and Chew, C. K., “Development Length and Lateral<br />
Spacing Requirements of Prestressing Strand <strong>for</strong> Prestressed <strong>Concrete</strong> Bridge Girders,” PCI<br />
Journal, Vol. 39, No. 1, January/February 1994, pp. 70-83.<br />
den Uijl, J. A., “Bond Modeling of Prestressing Strand,” ACI SP 180, ed. Roberto Leon,<br />
American <strong>Concrete</strong> Institute, Farmington Hills, pp. 145-169.<br />
Dill, J. C., “Development Length of 0.6-inch Diameter Prestressing Strand in <strong>High</strong>-<br />
Per<strong>for</strong>mance <strong>Concrete</strong>,” Masters Thesis, Georgia Institute of Technology, May 2000, 322 pp.<br />
<strong>Expanded</strong> <strong>Shale</strong>, <strong>Clay</strong> and Slate Institute, “Back-up Statistics to Building Bridges,”<br />
In<strong>for</strong>mation Sheet # 470.4, Salt Lake City, June 1994, 15 pp.<br />
Findley, W. N., Lai J. S. and Onaran K. (1989) "Creep ands Relaxation of Nonlinear<br />
Viscoelastic Materials", Dover Publications, Inc, New York.<br />
FIP Committee, “Chapter 7, Design of Prestressed <strong>Lightweight</strong> <strong>Concrete</strong> Structures,”<br />
Federation Internationale de la Precontrainte Manual of <strong>Lightweight</strong> Aggregate <strong>Concrete</strong>,<br />
2 nd Edition, 1983, pp. 168-206.<br />
Fujji, K., Kakizaki, M., Edahiro, H., Unisuga, Y., Yamamoto, Y., “Properties of <strong>High</strong>-<br />
<strong>Strength</strong> and <strong>High</strong>-Fluidity <strong>Lightweight</strong> <strong>Concrete</strong>,” ACI SP 179, American <strong>Concrete</strong><br />
Institute, Detroit, pp. 254-271.<br />
Gardner, N. J., and Lockman, M. J. (2001) "Design Provisions <strong>for</strong> Drying Shrinkage and Creep of<br />
Normal-<strong>Strength</strong> <strong>Concrete</strong>", ACI Material Journal, V. 98 No.2: p. 159-67.<br />
Goodspeed, C. H., Vanikar, S., and Cook, Raymond A. (1996) "<strong>High</strong>-Per<strong>for</strong>mance <strong>Concrete</strong><br />
Definition <strong>for</strong> <strong>High</strong>way Structures", <strong>Concrete</strong> International, V. 18 No.2: p. 62-67.<br />
Guide <strong>for</strong> <strong>High</strong>-<strong>Strength</strong> <strong>Concrete</strong>, ACI 363, American <strong>Concrete</strong> Institute, Detroit, 2000.<br />
References-4
Guide <strong>for</strong> Structural <strong>Lightweight</strong> Aggregate <strong>Concrete</strong>, ACI 213, (Draft Copy <strong>for</strong> Voting by<br />
Committee 213), American <strong>Concrete</strong> Institute, Detroit, 2002.<br />
Hansen, H. H., “Shelby Creek Bridge,” Portland Cement Association Engineered <strong>Concrete</strong><br />
Structures, Vol. 5, No. 2, August 1992, p. 3.<br />
Hanson, J. A., “Tensile <strong>Strength</strong> and Diagonal Tension Resistance of Structural <strong>Lightweight</strong><br />
<strong>Concrete</strong>,” Journal of the American <strong>Concrete</strong> Institute, Vol. 58, No. 1, July 1961, pp. 1-37.<br />
Hanson, N. W., Karr, P. H., “Flexural Bond Tests of Pretensioned Prestressed Beams,”<br />
Journal of the American <strong>Concrete</strong> Institute, Vol. 55, No. 7, January 1959, pp. 783-802.<br />
Harmon, K., “Physical Characteristics of Rotary Kiln <strong>Expanded</strong> Slate <strong>Lightweight</strong><br />
Aggregate,” Proceedings, Second International Symposium on Structural <strong>Lightweight</strong><br />
Aggregate <strong>Concrete</strong>, Kristiansand, Norway, June 2000, 11 pp.<br />
Hoff, G. C. (1990). "<strong>High</strong>-<strong>Strength</strong> <strong>Lightweight</strong> <strong>Concrete</strong> - Current Status and Future Needs". <strong>High</strong>-<br />
<strong>Strength</strong> <strong>Concrete</strong>. Second International Symposium, Berkeley, Cali<strong>for</strong>nia, American <strong>Concrete</strong><br />
Institute.<br />
Hoff, G. C., “<strong>High</strong> <strong>Strength</strong> <strong>Lightweight</strong> Aggregate <strong>Concrete</strong> <strong>for</strong> Arctic Applications,” ACI<br />
SP 136, American <strong>Concrete</strong> Institute, Detroit, 1992, pp. 1-65.<br />
Holm, T. A. (1995) "<strong>Lightweight</strong> <strong>Concrete</strong> and Aggregates, Standard Technical Publication STP<br />
169C", American Society <strong>for</strong> Testing and Materials, Philadelphia, PA.<br />
Holm, T. A., and Bremner, T. W. (1994) "<strong>High</strong> <strong>Strength</strong> <strong>Lightweight</strong> Aggregate <strong>Concrete</strong>", <strong>High</strong><br />
Per<strong>for</strong>mance <strong>Concrete</strong>: Properties and Applications(Ed, Shah, S. P. a. A., S. H.), McGraw-Hill, New<br />
York, NY, pp. 341-74.<br />
Holm, T. A., and Bremner, T. W. (2000) "State-of-the-Art Report on <strong>High</strong>-<strong>Strength</strong>, <strong>High</strong>-<br />
Durability Structural Low-Density <strong>Concrete</strong> <strong>for</strong> Applications in Severe Marine<br />
Environments", US Army Corps of Engineers. Engineer Research and Development Center,<br />
Structures Laboratory, ERDC/SL TR-00-3, Vicksburg, MS. 103 pp.<br />
Holm, T. A., Bremner, T. W., “70 Year Per<strong>for</strong>mance record <strong>for</strong> <strong>High</strong>-<strong>Strength</strong> Structural<br />
<strong>Lightweight</strong> <strong>Concrete</strong>,” Proceedings of the First Materials Engineering Congress,<br />
Serviceability & Durability of Construction Materials, Denver, August 2000, pp. 884-893.<br />
Holm, T. A., Bremner, T. W., “Chapter 10, <strong>High</strong> <strong>Strength</strong> <strong>Lightweight</strong> Aggregate <strong>Concrete</strong>,”<br />
<strong>High</strong> Per<strong>for</strong>mance <strong>Concrete</strong>s and Applications, S. P. Shah and S. H. Ahmad, ed., Edward<br />
Arnold, London, pp. 341-374.<br />
Holm, T. A., Personal telephone conversation on March 25, 2002 concerning the origination<br />
of the lightweight concrete factor, λ.<br />
Holm, T. A., Valsangkar, A. J., “<strong>Lightweight</strong> Aggregate Soil Mechanics: Properties and<br />
Applications,” Transportation Research Record 1422; Soils, Geology, and Foundations;<br />
References-5
<strong>Lightweight</strong> Artificial and Waste Materials <strong>for</strong> Embankments Over Soft Soils, Transportation<br />
Research Board, January 1993, pp. 7-13.<br />
Janney, J. R., “Nature of Bond in Pre-Tensioned Prestressed <strong>Concrete</strong>,” Journal of the<br />
American <strong>Concrete</strong> Institute, Vol. 50, No. 9, May 1954, pp. 717-736.<br />
Johnson, M. K., Ramirez, J. A., “Minimum Shear Rein<strong>for</strong>cement in Beams with <strong>High</strong>er<br />
<strong>Strength</strong> <strong>Concrete</strong>,” ACI Structural Journal, Vol. 86, No. 4, July-August 1989, pp. 376-382.<br />
Kahn, L. F., Saber, A., “Analysis and Structural Benefits of <strong>High</strong> Per<strong>for</strong>mance <strong>Concrete</strong> <strong>for</strong><br />
Pretensioned Bridge Girders,” PCI Journal, Vol. 45, No. 4, July/August 2000, pp. 100-107.<br />
Kohno, K., Okamoto, T., Isikawa, Y., Sibata, T., Mori, H., “Effects of Artificial <strong>Lightweight</strong><br />
Aggregate on Autogenous Shrinkage of <strong>Concrete</strong>,” Cement and <strong>Concrete</strong> Research, Vol. 29,<br />
1999, pp. 611-614.<br />
Kolozs, R. T., “Transfer and Development Lengths of Fully Bonded 1/2-Inch Prestressing<br />
Strand in Standard AASHTO Type I Pretensioned <strong>High</strong> Per<strong>for</strong>mance <strong>Lightweight</strong> <strong>Concrete</strong><br />
(HPLC) Beams,” Masters Thesis, The University of Texas at Austin, May 2000, 155 pp.<br />
Lane, S. N., A New Development Length Equation <strong>for</strong> Pretensioned Strands in Bridge Beams<br />
and Piles, Final Report, No. FHWA-RD-98-116, Federal <strong>High</strong>way Administration,<br />
December 1998, 131 pp.<br />
Leming, M. L., Creep and Shrinkage of <strong>Lightweight</strong> <strong>Concrete</strong>, North Carolina State<br />
University Publication, 1990, 4 pp.<br />
Leming, M. L., Properties of <strong>High</strong> <strong>Strength</strong> <strong>Concrete</strong> – An Investigation of <strong>High</strong> <strong>Strength</strong><br />
<strong>Concrete</strong> Characteristics using Materials in North Carolina, Final Report, No. 23241-86-3,<br />
North Carolina Department of Transportation, July 1988, 186 pp.<br />
Lin, T. Y., Burns, N. H., Design of Prestressed <strong>Concrete</strong> Structures, Third Edition, John<br />
Wiley and Sons, New York, New York, 1981.<br />
Logan, D. R., “Acceptance Criteria <strong>for</strong> Bond Quality of Strand <strong>for</strong> Pretensioned Prestressed<br />
<strong>Concrete</strong> Applications,” PCI Journal, Vol. 42, No. 2, March/April 1997. pp. 52-90.<br />
Lopez, M., and Kahn, L. F. (2003) "Time Dependent Behavior of <strong>High</strong> Per<strong>for</strong>mance<br />
<strong>Concrete</strong>: Evaluation of a Georgia's <strong>High</strong> Per<strong>for</strong>mance <strong>Concrete</strong> Bridge", School of Civil &<br />
Environmental Engineering, Georgia Institute of Technology, Atlanta<br />
Ma, J., Tadros, M. H., Baishya, M, “Shear Behavior of Pretensioned <strong>High</strong>-<strong>Strength</strong> <strong>Concrete</strong><br />
Bridge I-Girders,” ACI Structural Journal, Vol. 97, No. 1, January-February 2000, pp. 185-<br />
192.<br />
MacGregor, J. G., Rein<strong>for</strong>ced <strong>Concrete</strong>, Second Edition, Prentice Hall, Englewood Cliffs,<br />
New Jersey, 1992, 848 pp.<br />
References-6
Martin, L. D., Scott, N. L., “Development of Prestressing Strand in Pretensioned Members,”<br />
ACI Journal, Vol. 73, No. 8, August 1976, pp. 453-456.<br />
Mehta, P. K. a. M., Paulo J.M. (1993) "<strong>Concrete</strong>. Microstructure, Properties and Materials",<br />
Mc Graw-Hill.<br />
Mehta, P. K., Monteiro, P. J. M., <strong>Concrete</strong> Microstructure, Properties, and Materials,<br />
Second Edition, McGraw Hill, New York, New York, 1993.<br />
Melby, K., Jordet, E. A., Hansvold, C., “Long-span Bridges in Norway Constructed in <strong>High</strong>-<br />
<strong>Strength</strong> LWA <strong>Concrete</strong>,” Engineering Structures, Vol. 18, No. 11, November 1996, pp.<br />
845-849.<br />
Meyer, K. F., and Kahn, L. F. (2002) "<strong>Lightweight</strong> <strong>Concrete</strong> Reduces Weight and Increases<br />
Span Length of Pretensioned <strong>Concrete</strong> Bridge Girders", PCI Journal, V. 47 No.1: p. 68-75.<br />
Meyer, K. F., Kahn, L. F., “Annotated Bibliography <strong>for</strong> <strong>High</strong>-<strong>Strength</strong>, <strong>Lightweight</strong><br />
Prestressed <strong>Concrete</strong> Bridge Girders,” Task 1 Report, Georgia Department of Transportation<br />
Project No. 2004, Georgia Institute of Technology, January 2001, 14 pp.<br />
Meyer, K. F., Kahn, L. F., Lai, J.S., and Kurtis, K.E. (2002) "Transfer and Development<br />
Length of <strong>High</strong> <strong>Strength</strong> <strong>Lightweight</strong> <strong>Concrete</strong> Precast Prestressed Bridge Girders",<br />
Structural Engineering, Mechanics and Materials, School of Civil and Environmental<br />
Engineering, Georgia Institute of Technology, Atlanta, pp. 617.<br />
Mindess, S., Young, J.F, and Darwin, D. (2003) "<strong>Concrete</strong>", Prentice Hall, Upper Saddle<br />
River.<br />
Mitchell, D., Cook, W. D., Khan, A. A., Tham, T., “Influence of <strong>High</strong> <strong>Strength</strong> <strong>Concrete</strong> on<br />
Transfer and Development Length of Pretensioning Strand,” PCI Journal, Vol. 38, No. 3,<br />
May/June 1993, pp. 52-56.<br />
Mor, A., “Steel-<strong>Concrete</strong> Bond in <strong>High</strong> <strong>Strength</strong> <strong>Lightweight</strong> <strong>Concrete</strong>,” ACI Materials<br />
Journal, Vol. 89, No. 1, January-February 1992, pp. 76-82.<br />
Morales, J., Short-Term Mechanical Properties of <strong>High</strong> <strong>Strength</strong> <strong>Lightweight</strong> <strong>Concrete</strong>,<br />
Report 82-9 on NSF Grant No. ENG78-05124, Ithaca, August 1982.<br />
Murillo, J. A., Thoman S., Smith, D., “<strong>Lightweight</strong> <strong>Concrete</strong> <strong>for</strong> a Segmental Bridge,” Civil<br />
Engineering, Vol. 64, No. 5, May 1994, pp. 68-70.<br />
Nawy, E. G. (2001) "Fundamentals of <strong>High</strong>-Per<strong>for</strong>mance <strong>Concrete</strong>", John Wiley and Sons,<br />
New York.<br />
Nawy, E. G., Prestressed <strong>Concrete</strong> A Fundamental Approach, Third Edition, Prentice Hall,<br />
Upper Saddle River, New Jersey, 2000,<br />
References-7
Neville, A. M. (1964) "Creep of <strong>Concrete</strong> as a Function of its cement Paste Content",<br />
Magazine of <strong>Concrete</strong> Research, V. 16 No.46: p. 21-30.<br />
Neville, A. M. (1996) "Properties of <strong>Concrete</strong>", Addison Wesley Logman Limited, New York.<br />
Neville, A. M., Dilger, W.H., and Brooks, J.J. (1983) "Creep of Plain and Rein<strong>for</strong>ced<br />
<strong>Concrete</strong>", Construction Press, London and New York.<br />
PCI (1998) "PCI Design Handbook, Precast and Prestressed <strong>Concrete</strong>", Precast / Prestressed<br />
<strong>Concrete</strong> Institute, Chicago.<br />
PCI-Committee on Prestress, L. (1975) "Recommendations <strong>for</strong> Estimating Prestress Losses",<br />
PCI Journal, V. 28 No.4: p. 43-75.<br />
Peterman, R. J., Ramirez, J. A., Olek, J., “Design of Semi-lightweight Bridge girders,<br />
Development Length Considerations,” Transportation Research Board Record 1696, Paper<br />
No. 5B0063, Transportation Research Board, 2000.<br />
Peterman, R. J., Ramirez, J. A., Olek, J., “Evaluation of Strand Transfer and Development<br />
Lengths in Pretensioned Girders with Semi-<strong>Lightweight</strong> <strong>Concrete</strong>,” Final Report,” Report<br />
FHWA/IN/JTRP-99/3, Purdue University, July 1999, 89 pp.<br />
Pfeiffer, D. W., “Sand Replacement in Structural <strong>Lightweight</strong> <strong>Concrete</strong>,” ACI Journal, Vol.<br />
64, No. 7, July 1967, pp. 384-392.<br />
Raithby, K. D., Lydon, F. D., “<strong>Lightweight</strong> <strong>Concrete</strong> in <strong>High</strong>way Bridges,” The International<br />
Journal of Cement Composites and <strong>Lightweight</strong> <strong>Concrete</strong>, Vol. 2, No. 3, May 1981, pp. 133-<br />
146.<br />
Ramirez, J., Olek, J., Rolle, E., Malone, B., “Per<strong>for</strong>mance of Bridge Decks and Girders with<br />
<strong>Lightweight</strong> Aggregate <strong>Concrete</strong>, Final Report,” Report FHWA/IN/JTRP-98/17, Purdue<br />
University, October 2000, 616 pp.<br />
Reutlinger, C., “Direct Pull-Out Capacity and transfer Length of 0.6-inch Diameter<br />
Prestressing Strand in <strong>High</strong>-Per<strong>for</strong>mance <strong>Concrete</strong>,” Masters Thesis, Georgia Institute of<br />
Technology, Atlanta, GA, May 1999, 352 pp.<br />
Roberts, J. E., “<strong>Lightweight</strong> <strong>Concrete</strong> Bridges <strong>for</strong> Cali<strong>for</strong>nia <strong>High</strong>way System,” ACI SP 136,<br />
American <strong>Concrete</strong> Institute, Detroit, 1992, pp. 254-271.<br />
Roller, J. J., Russell, H.G., Bruce, R.N., and Martin, B.T. (1995) "Long-Term Per<strong>for</strong>mance<br />
of Prestressed, Pretensioned <strong>High</strong> <strong>Strength</strong> <strong>Concrete</strong> Bridge Girders", PCI Journal, V. 40<br />
No.6: p. 48-59.<br />
Russell, B. W., “Design Guidelines <strong>for</strong> Transfer, Development and Debonding of Large<br />
Diameter Seven Wire Strands in Pretensioned <strong>Concrete</strong> Girders,” Doctoral Thesis, The<br />
University of Texas at Austin, 1992, 464 pp.<br />
References-8
Shahawy, M. A., Batchelor, B., “Shear Behavior of Full-Scale Prestressed <strong>Concrete</strong> Girders:<br />
Comparison Between AASHTO Specifications and LRFD Code,” PCI Journal, Vol. 41, No.<br />
3, May-June 1996, pp. 48-62.<br />
Shams, M. K., and Kahn, L. F. (2000) "Time Dependent Behavior of <strong>High</strong>-Per<strong>for</strong>mance<br />
<strong>Concrete</strong>", School of Civil & Environmental Engineering, Georgia Institute of Technology,<br />
Atlanta, GA.<br />
Shams, M., “Time-Dependent Behavior of <strong>High</strong>-Per<strong>for</strong>mance <strong>Concrete</strong>,” Doctoral Thesis,<br />
Georgia Institute of Technology, May 2000, 572 pp.<br />
Shideler, J. J., “<strong>Lightweight</strong>-Aggregate <strong>Concrete</strong> <strong>for</strong> Structural Use,” Journal of the<br />
American <strong>Concrete</strong> Institute, Vol. 54, No. 10, October 1957, pp. 299-328.<br />
Sikes, G. H., Strougal, E. J., Meisner, J. L., “Computer Manual <strong>for</strong> Service Load Design of<br />
<strong>Concrete</strong> Bridge Slabs,” Georgia Department of Transportation, January 1999, 18 pp.<br />
Slapkus, A., and Kahn, L.F. (2002) "Evaluation of Georgia's <strong>High</strong> Per<strong>for</strong>mance <strong>Concrete</strong><br />
Bridge", School of Civil & Environmental Engineering, Georgia Institute of Technology,<br />
Atlanta, pp. 382.<br />
Smeplass, S., “Moisture in Light Weight Aggregates – Practical Consequences <strong>for</strong> the<br />
Production Properties of Light Weight Aggregate <strong>Concrete</strong>”, Proceedings, Second<br />
International Symposium on Structural <strong>Lightweight</strong> Aggregate <strong>Concrete</strong>, Kristiansand,<br />
Norway, June, 2000.<br />
Valum, R., Nilsskog, J. E., “Production and Quality Control of <strong>High</strong> Per<strong>for</strong>mance<br />
<strong>Lightweight</strong> <strong>Concrete</strong> <strong>for</strong> the Raftsundet Bridge,” Proceedings of the Fifth International<br />
Symposium on Utilization of <strong>High</strong> <strong>Strength</strong> / <strong>High</strong> Per<strong>for</strong>mance <strong>Concrete</strong>, Sandefjord,<br />
Norway, June 2000, pp. 909-918.<br />
Vaysburg, A., “Durability of <strong>Lightweight</strong> <strong>Concrete</strong> Bridges in Severe Environments,”<br />
<strong>Concrete</strong> International, Vol. 18, No. 7, July 1996, pp. 33-38.<br />
Wang, P. T., Shah, S. P., Naaman A. E., “Stress-Strain Curves of Normal and <strong>Lightweight</strong><br />
<strong>Concrete</strong> in Compression,” ACI Journal, Vol. 75, No. 11, November 1978, pp. 603-611.<br />
Yeginobali, A., Sobolev, K. G., Soboleva, S. V., Tokyay, M., “<strong>High</strong> <strong>Strength</strong> Natural<br />
<strong>Lightweight</strong> Aggregate <strong>Concrete</strong> with Silica Fume,” ACI SP 178, American <strong>Concrete</strong><br />
Institute, Detroit, May 1998, pp. 739-758.<br />
Zia, P., Mostafa, T., “Development Length of Prestressing Strands,” PCI Journal, Vol. 22,<br />
No. 5, September/October 1977, pp. 54-65.<br />
Zia, P., Preston, H. Kent, Scott, Norman L., and Workman, Edwin B. (1979) "Estimating<br />
Prestress Losses", <strong>Concrete</strong> International, V. 76 No.6: p. 32-38.<br />
References-9