
Create successful ePaper yourself
Turn your PDF publications into a flip-book with our unique Google optimized e-Paper software.
414 LIEW ET AL.<br />
Engine Performance Parameters<br />
After the operating conditions for each engine component are<br />
determined, it is then possible to calculate the engine performance<br />
parameters. Whereas specific thrust is often used in on-design cycle<br />
analysis, thrust is commonly used in off-design cycle analysis.<br />
Accordingly, uninstalled thrust produced by the engine is<br />
F =ṁ 0 (F/ṁ 0 ) (29)<br />
As shown in Eq. (29), thrust accounts for the variation in both specific<br />
thrust 11 F/ṁ 0 and mass flow rate ṁ 0 .<br />
Uninstalled thrust-specific fuel consumption S is simply obtained<br />
by<br />
S = f o /(F/ṁ 0 ) (30)<br />
Thermal efficiency η th , which is defined as the net rate of the<br />
kinetic energy gain out of the engine divided by the rate of thermal<br />
energy available from the fuel, is<br />
η tH = Ėkinetic,gain<br />
ṁ f · h PR<br />
(31)<br />
For full throttle operation, the maximum inlet HPT total temperature<br />
(T t4 or main burner exit total temperature) and the LPT<br />
inlet total temperature (T t4.5 or ITB exit total temperature) are set<br />
to the values as listed in Table 2. For partial throttle operation, the<br />
minimum thrust is set to 20% of the maximum thrust.<br />
A program 11 was written in combination among Microsoft ® Excel<br />
spreadsheet neuron cells, VisualBasic, and macrocode to provide<br />
user-friendly interface so that the compilation and preprocessing<br />
are not needed.<br />
Predicted Performance Results<br />
Full Throttle Performance<br />
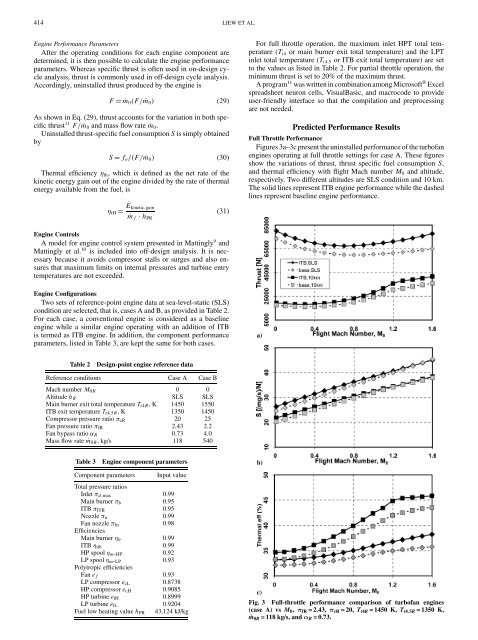
Figures 3a–3c present the uninstalled performance of the turbofan<br />
engines operating at full throttle settings for case A. These figures<br />
show the variations of thrust, thrust specific fuel consumption S,<br />
and thermal efficiency with flight Mach number M 0 and altitude,<br />
respectively. Two different altitudes are SLS condition and 10 km.<br />
The solid lines represent ITB engine performance while the dashed<br />
lines represent baseline engine performance.<br />
Engine Controls<br />
A model for engine control system presented in Mattingly 9 and<br />
Mattingly et al. 10 is included into off-design analysis. It is necessary<br />
because it avoids compressor stalls or surges and also ensures<br />
that maximum limits on internal pressures and turbine entry<br />
temperatures are not exceeded.<br />
Engine Configurations<br />
Two sets of reference-point engine data at sea-level-static (SLS)<br />
condition are selected, that is, cases A and B, as provided in Table 2.<br />
For each case, a conventional engine is considered as a baseline<br />
engine while a similar engine operating with an addition of ITB<br />
is termed as ITB engine. In addition, the component performance<br />
parameters, listed in Table 3, are kept the same for both cases.<br />
a)<br />
Table 2<br />
Design-point engine reference data<br />
Reference conditions Case A Case B<br />
Mach number M 0R 0 0<br />
Altitude h R SLS SLS<br />
Main burner exit total temperature T t4R , K 1450 1550<br />
ITB exit temperature T t4.5R , K 1350 1450<br />
Compressor pressure ratio π cR 20 25<br />
Fan pressure ratio π fR 2.43 2.2<br />
Fan bypass ratio α R 0.73 4.0<br />
Mass flow rate ṁ 0R , kg/s 118 540<br />
Table 3<br />
Engine component parameters<br />
Component parameters<br />
Input value<br />
Total pressure ratios<br />
Inlet π d,max 0.99<br />
Main burner π b 0.95<br />
ITB π ITB 0.95<br />
Nozzle π n 0.99<br />
Fan nozzle π fn 0.98<br />
Efficiencies<br />
Main burner η b 0.99<br />
ITB η itb 0.99<br />
HP spool η m-HP 0.92<br />
LP spool η m-LP 0.93<br />
Polytropic efficiencies<br />
Fan e f 0.93<br />
LP compressor e cL 0.8738<br />
HP compressor e cH 0.9085<br />
HP turbine e tH 0.8999<br />
LP turbine e tL 0.9204<br />
Fuel low heating value h PR 43,124 kJ/kg<br />
b)<br />
c)<br />
Fig. 3 Full-throttle performance comparison of turbofan engines<br />
(case A) vs M 0 , π fR = 2.43, π cR = 20, T t4R = 1450 K, T t4.5R = 1350 K,<br />
ṁ 0R = 118 kg/s, and α R = 0.73.