
Create successful ePaper yourself
Turn your PDF publications into a flip-book with our unique Google optimized e-Paper software.
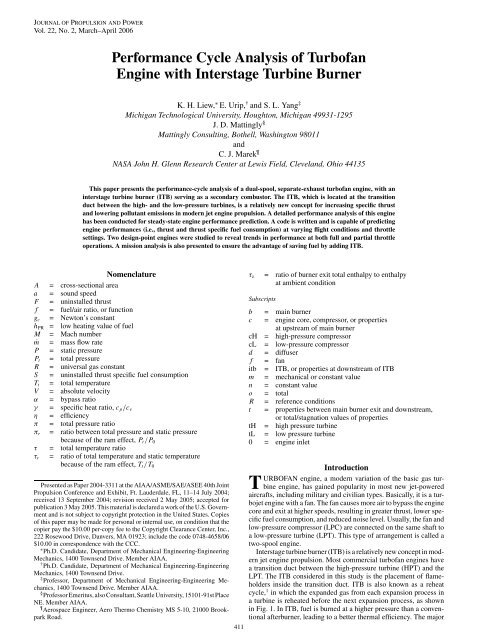
JOURNAL OF PROPULSION AND POWER<br />
Vol. 22, No. 2, March–April 2006<br />
Performance Cycle Analysis of Turbofan<br />
Engine with Interstage Turbine Burner<br />
K. H. Liew, ∗ E. Urip, † and S. L. Yang ‡<br />
Michigan Technological University, Houghton, Michigan 49931-1295<br />
J. D. Mattingly §<br />
Mattingly Consulting, Bothell, Washington 98011<br />
and<br />
C. J. Marek <br />
NASA John H. Glenn Research Center at Lewis Field, Cleveland, Ohio 44135<br />
This paper presents the performance-cycle analysis of a dual-spool, separate-exhaust turbofan engine, with an<br />
interstage turbine burner (ITB) serving as a secondary combustor. The ITB, which is located at the transition<br />
duct between the high- and the low-pressure turbines, is a relatively new concept for increasing specific thrust<br />
and lowering pollutant emissions in modern jet engine propulsion. A detailed performance analysis of this engine<br />
has been conducted for steady-state engine performance prediction. A code is written and is capable of predicting<br />
engine performances (i.e., thrust and thrust specific fuel consumption) at varying flight conditions and throttle<br />
settings. Two design-point engines were studied to reveal trends in performance at both full and partial throttle<br />
operations. A mission analysis is also presented to ensure the advantage of saving fuel by adding ITB.<br />
Nomenclature<br />
A = cross-sectional area<br />
a = sound speed<br />
F = uninstalled thrust<br />
f = fuel/air ratio, or function<br />
g c = Newton’s constant<br />
h PR = low heating value of fuel<br />
M = Mach number<br />
ṁ = mass flow rate<br />
P = static pressure<br />
P t = total pressure<br />
R = universal gas constant<br />
S = uninstalled thrust specific fuel consumption<br />
T t = total temperature<br />
V = absolute velocity<br />
α = bypass ratio<br />
γ = specific heat ratio, c p /c v<br />
η = efficiency<br />
π = total pressure ratio<br />
π r = ratio between total pressure and static pressure<br />
because of the ram effect, P t /P 0<br />
τ = total temperature ratio<br />
τ r = ratio of total temperature and static temperature<br />
because of the ram effect, T t /T 0<br />
Presented as Paper 2004-3311 at the <strong>AIAA</strong>/ASME/SAE/ASEE 40th Joint<br />
Propulsion Conference and Exhibit, Ft. Lauderdale, FL, 11–14 July 2004;<br />
received 13 September 2004; revision received 2 May 2005; accepted for<br />
publication 3 May 2005. This material is declared a work of the U.S. Government<br />
and is not subject to copyright protection in the United States. Copies<br />
of this paper may be made for personal or internal use, on condition that the<br />
copier pay the $10.00 per-copy fee to the Copyright Clearance Center, Inc.,<br />
222 Rosewood Drive, Danvers, MA 01923; include the code 0748-4658/06<br />
$10.00 in correspondence with the CCC.<br />
∗ Ph.D. Candidate, Department of Mechanical Engineering-Engineering<br />
Mechanics, 1400 Townsend Drive. Member <strong>AIAA</strong>.<br />
† Ph.D. Candidate, Department of Mechanical Engineering-Engineering<br />
Mechanics, 1400 Townsend Drive.<br />
‡ Professor, Department of Mechanical Engineering-Engineering Mechanics,<br />
1400 Townsend Drive. Member <strong>AIAA</strong>.<br />
§ Professor Emeritus, also Consultant, Seattle University, 15101-91st Place<br />
NE. Member <strong>AIAA</strong>.<br />
Aerospace Engineer, Aero Thermo Chemistry MS 5-10, 21000 Brookpark<br />
Road.<br />
τ λ = ratio of burner exit total enthalpy to enthalpy<br />
at ambient condition<br />
Subscripts<br />
b = main burner<br />
c = engine core, compressor, or properties<br />
at upstream of main burner<br />
cH = high-pressure compressor<br />
cL = low-pressure compressor<br />
d = diffuser<br />
f = fan<br />
itb = ITB, or properties at downstream of ITB<br />
m = mechanical or constant value<br />
n = constant value<br />
o = total<br />
R = reference conditions<br />
t = properties between main burner exit and downstream,<br />
or total/stagnation values of properties<br />
tH = high pressure turbine<br />
tL = low pressure turbine<br />
0 = engine inlet<br />
Introduction<br />
TURBOFAN engine, a modern variation of the basic gas turbine<br />
engine, has gained popularity in most new jet-powered<br />
aircrafts, including military and civilian types. Basically, it is a turbojet<br />
engine with a fan. The fan causes more air to bypass the engine<br />
core and exit at higher speeds, resulting in greater thrust, lower specific<br />
fuel consumption, and reduced noise level. Usually, the fan and<br />
low-pressure compressor (LPC) are connected on the same shaft to<br />
a low-pressure turbine (LPT). This type of arrangement is called a<br />
two-spool engine.<br />
Interstage turbine burner (ITB) is a relatively new concept in modern<br />
jet engine propulsion. Most commercial turbofan engines have<br />
a transition duct between the high-pressure turbine (HPT) and the<br />
LPT. The ITB considered in this study is the placement of flameholders<br />
inside the transition duct. ITB is also known as a reheat<br />
cycle, 1 in which the expanded gas from each expansion process in<br />
a turbine is reheated before the next expansion process, as shown<br />
in Fig. 1. In ITB, fuel is burned at a higher pressure than a conventional<br />
afterburner, leading to a better thermal efficiency. The major<br />
411
412 LIEW ET AL.<br />
Table 1<br />
Engine performance variables<br />
Fig. 1<br />
T-s diagram of a gas turbine engine with ITB.<br />
advantages associated with the use of ITB are an increase in thrust<br />
and potential reduction in NO x emission. 2 Recent studies on the<br />
turbine burners can be found in the literature (for example, see Liew<br />
et al., 2,3 Liu and Sirignano, 4 Sirignano and Liu, 5 and Vogeler 6 ).<br />
However, these studies are only limited to parametric cycle analysis,<br />
which is also known as on-design analysis.<br />
The work presented here is a systematic performance-cycle analysis<br />
of a dual-spool, separate-exhaust turbofan engine with an ITB.<br />
Performance-cycle analysis is also known as off-design analysis. It<br />
is an extension work for the previous study, 2,3 that is, on-design cycle<br />
analysis, in which we showed how the performance of a family<br />
of engines was determined by design choices, design limitations, or<br />
environmental conditions. 7<br />
In general, off-design analysis differs significantly from ondesign<br />
analysis. In on-design analysis, the primary purpose is to<br />
examine the variations of specific engine performance at a flight<br />
condition with changes in design parameters, including design variables<br />
for engine components. Then, it is possible to narrow the<br />
desirable range for each design parameter. Once the design choice<br />
is made, it gives a so-called reference-point (or design-point) engine<br />
for a particular application. Off-design analysis is then performed<br />
to estimate how this specific reference-point engine will behave at<br />
conditions other than those for which it was designed. Furthermore,<br />
the performance of several reference-point engines can be compared<br />
to find the most promising engine that has the best balanced<br />
performance over the entire flight envelope.<br />
Approach<br />
The station numbering for the turbofan cycle analysis with ITB<br />
is in accordance with APR 755A (Ref. 8) and is given in Fig. 2. The<br />
ITB (the transition duct) is located between stations 4.4 and 4.5.<br />
The resulting analysis gives a system of 18 nonlinear algebraic<br />
equations that are solved for 18 dependent variables. Table 1 gives<br />
the variables and constants in this analysis. As will be shown, specific<br />
values of the independent variables m and n are desirable for<br />
the computations of A 4.5 and A 8 .<br />
Off-Design Cycle Analysis<br />
The following assumptions are employed:<br />
1) The air and products of combustion behave as perfect gases.<br />
2) All component efficiencies are constant.<br />
3) The area at each engine station is constant, except the areas at<br />
stations 4.5 and 8.<br />
4) The flow is choked at the HPT entrance nozzles (station 4), at<br />
LPT entrance nozzles (station 4.5), and at the throat of the exhaust<br />
nozzles (stations 8 and 18).<br />
5) At this preliminary design phase, turbine cooling is not<br />
included.<br />
An off-design cycle analysis is used to calculate the uninstalled<br />
engine performance. The methodology is similar to those described<br />
in Mattingly 9 and Mattingly et al. 10 Two important concepts are<br />
mentioned here to help explaining the analytical method.<br />
The first is called referencing, in which the conservation of mass,<br />
momentum, and energy are applied to the one-dimensional flow of<br />
a perfect gas at an engine steady-state operating point. This leads to<br />
a relationship between the total temperatures τ and pressure ratios<br />
Independent Constant Dependent<br />
Component variable or known variable<br />
Engine M 0 , T 0 , P 0 —— ṁ 0 ,α<br />
Diffuser —— π d = f (M 0 ) ——<br />
Fan —— η f π f ,τ f<br />
Low-pressure compressor —— η cL π cL ,τ cL<br />
High-pressure compressor —— η cH π cH ,τ cH<br />
Burner T t4 π b f<br />
High-pressure turbine —— η tH , M 4 π tH ,τ tH<br />
Interstage burner T t4.5 π itb f itb<br />
Low-pressure turbine n η tL , M 4.5 , π tL ,τ tL<br />
A 4.5 = f (τ itb , n)<br />
Fan exhaust nozzle —— π fn M 18 , M 19<br />
Core exhaust nozzle m π n , M 8 , M 9<br />
A 8 = f (τ itb , m)<br />
Total number 7 —— 18<br />
Fig. 2<br />
Station numbering of a turbofan engine with ITB.<br />
π at a steady-state operating point, which can be written as f (τ, π)<br />
equal to a constant. The reference-point values (subscript R) from<br />
the on-design analysis can be used to give value to the constant<br />
and allow one to calculate the off-design parameters, as described<br />
next:<br />
f (τ, π) = f (τ R ,π R ) = constant (1)<br />
The second concept is the mass flow parameter (MFP), where the<br />
one-dimensional mass flow property per unit area can be written in<br />
the following functional form:<br />
MFP = ṁ √ T t<br />
/<br />
Pt A<br />
√<br />
= M γ g c /R{1 + [(γ − 1)/2]M 2 } (γ +1)/2(1−γ) (2)<br />
This relation is useful in calculating flow areas, or in finding any<br />
single flow quantity, provided the other four quantities are known<br />
at that station.<br />
Component Modeling<br />
In off-design analysis, there are two classes of predicting individual<br />
component performance. First, actual component characteristics<br />
can be obtained from component hardware performance data,<br />
which give a better estimate. However, in the absence of actual<br />
component hardware in a preliminary engine design phase, simple<br />
models of component performance in terms of operating conditions<br />
are used.<br />
High-Pressure Turbine<br />
Writing mass flow rate equation at stations 4 and 4.5 in terms of<br />
the flow properties and MFP gives<br />
and<br />
ṁ 4 = ( P t4<br />
/√<br />
Tt4<br />
)<br />
A4 MFP(M 4 ) =ṁ 3 (1 + f b ) (3)<br />
ṁ 4.5 = ( P t4.5<br />
/√<br />
Tt4.5<br />
)<br />
A4.5 MFP(M 4.5 ) =ṁ 3 (1 + f b + f itb ) (4)
LIEW ET AL. 413<br />
Rearranging Eqs. (3) and (4) and equating ṁ 3 yield<br />
√<br />
P t4.4 Tt4 MFP(M 4 ) (1 + f b + f itb ) P t4.4<br />
√ A 4.5 = A 4 (5)<br />
P t4 Tt4.5 MFP(M 4.5 ) (1 + f b ) P t4.5<br />
The right-hand side of the preceding equation is considered constant<br />
because of the following assumptions: the flow is choked at<br />
stations 4 and 4.5, the flow area at station 4 is constant, variation of<br />
fuel-air ratios f is ignored compared to unity, and the total pressure<br />
ratio of ITB is constant. Using referencing, it yields<br />
√ ( √ )<br />
Tt4 Pt4.4 Tt4<br />
√ A 4.5 = √ A 4.5<br />
Tt4.5 Tt4.5<br />
P t4.4<br />
P t4<br />
Rearranging and solving for π tH (= P t4.4 /P t4 ) yields<br />
√<br />
τtH τ itb A 4.5R<br />
π tH = ( √τtH ) π tHR (7)<br />
τ itb<br />
A 4.5<br />
The equation relating π tH and τ tH comes from HPT efficiency<br />
equation:<br />
{<br />
(γ<br />
τ tH = 1 − η tH 1 − π t − 1)/γ t<br />
}<br />
tH<br />
(8)<br />
A 4.5 /A 4.5R is related to the total temperature ratio of the ITB<br />
raised to the power of a value n:<br />
P t4<br />
R<br />
R<br />
(6)<br />
A 4.5 /A 4.5R = (τ itb /τ itbR ) n (9)<br />
From Eq. (9), if n is set equal to 1 , then Eq. (7) reduces to<br />
2<br />
/ √τtH<br />
π tH = ( / √τtH )<br />
π tH<br />
R<br />
(10)<br />
For this reason, 1 is used for n in this study. Accordingly, the LPT<br />
2<br />
entrance area A 4.5 is controlled such that the HPT exit conditions<br />
(i.e., P 4.4 and T 4.4 ) are unaffected by the ITB operation.<br />
Low-Pressure Turbine<br />
Writing the mass conservation at stations 4.5 and 8 using MFP<br />
and flow properties gives<br />
√<br />
τtL A 8R A 4.5 MFP(M 8R )<br />
π tL = π tLR (11)<br />
τ tLR A 8 A 4.5R MFP(M 8 )<br />
Similarly, the LPT efficiency equation gives<br />
τ tL = 1 − η tL<br />
[ 1 − π<br />
(γ itb − 1)/γ itb<br />
tL<br />
]<br />
(12)<br />
One relationship for A 8 /A 8R is similar to A 4.5 /A 4.5R except that<br />
it is raised to the power of a value m:<br />
A 8 /A 8R = (τ itb /τ itb R ) m (13)<br />
For the same reason as for n, when m is set equal to 1 in 2<br />
Eq. (13) and M 8 = M 8R , Eq. (11) reduces to<br />
π tL / √ τ tL = ( / √τtL )<br />
π tL (14)<br />
Accordingly, the engine’s low-pressure-turbine performance in<br />
Eq. (11) will vary the same as the turbofan engine without the ITB<br />
when the ITB is turned off.<br />
Engine Bypass Ratio<br />
An expression for the engine bypass ratio is expressed by<br />
R<br />
α =ṁ f /ṁ c (15)<br />
In terms of MFP and flow properties, the bypass ratio can be<br />
rewritten using referencing as<br />
√<br />
π cLR π cHR /π fR Tt4 /T t4R<br />
α = α R<br />
π cL π cH /π f τ r τ f /(τ rR τ fR )<br />
MFP(M 18 )<br />
MFP(M 18R )<br />
(16)<br />
Fan and Low-Pressure Compressor<br />
The equation for the total temperature ratio of the fan, which<br />
can be derived directly from the power balance of the low-pressure<br />
spool, is written as<br />
[ ]<br />
τ λ − itb (1 − τtL )(1 + f b + f itb )<br />
τ f = 1 + (τ fR − 1)η mL<br />
τ r τ cLR − 1 + α(τ fR − 1)<br />
Fan total pressure ratio is given by<br />
(17)<br />
π f = [1 + η f (τ f − 1)] γc/(γc − 1) (18)<br />
Because the LPC and the fan are on the same shaft, it is reasonable<br />
to approximate that the total enthalpy rise of LPC is proportional to<br />
that of the fan. The use of referencing thus gives<br />
h t2.5 − h t2<br />
= τ ( )<br />
cL − 1<br />
h t13 − h t2 τ f − 1 = τcL − 1<br />
(19)<br />
τ f − 1<br />
R<br />
Equation (19) is rewritten to give the LPC total temperature ratio:<br />
τ cL = 1 + (τ f − 1) (τ cL − 1) R<br />
(τ f − 1) R<br />
(20)<br />
The LPC total pressure ratio is expressed as<br />
π cL = [1 + η cL (τ cL − 1)] γc/(γc − 1) (21)<br />
High-Pressure Compressor<br />
From the power balance of the high-pressure spool, solving for<br />
the total temperature ratio across HPC gives<br />
τ cH = 1 + η mH (1 + f b ) τ λ − b(1 − τ tH )<br />
τ r τ cL<br />
(22)<br />
HPC total pressure ratio is then given by<br />
π cH = [1 + η cH (τ cH − 1)] γc/(γc − 1) (23)<br />
Exhaust Nozzles<br />
The Mach number at both core (stations 8 and 9) and fan exhaust<br />
nozzles (stations 18 and 19) follows directly using<br />
√<br />
M 9 = [2/(γ itb − 1)] [ ]<br />
(P t9 /P 9 ) (γ itb − 1)/γ itb − 1<br />
(24)<br />
If M 9 > 1, then M 8 = 1, else M 8 = M 9 (25)<br />
√<br />
M 19 = [2/(γ c − 1)] [ (P t19 /P 19 ) (γc − 1)/γc − 1 ] (26)<br />
If M 19 > 1, then M 18 = 1, else M 18 = M 19 (27)<br />
Engine Mass Flow Rate<br />
An expression for the overall engine mass flow rate follows by<br />
using MFP at station 4, giving<br />
ṁ 0 =ṁ 0R<br />
1 + α<br />
1 + α R<br />
P 0 π r π d π cL π cH<br />
(P 0 π r π d π cL π cH ) R<br />
√<br />
Tt4R<br />
T t4<br />
(28)<br />
Fuel-Air Ratios<br />
The constant specific heat model 10 is used to compute the fuel-air<br />
ratios for main burner and ITB.
414 LIEW ET AL.<br />
Engine Performance Parameters<br />
After the operating conditions for each engine component are<br />
determined, it is then possible to calculate the engine performance<br />
parameters. Whereas specific thrust is often used in on-design cycle<br />
analysis, thrust is commonly used in off-design cycle analysis.<br />
Accordingly, uninstalled thrust produced by the engine is<br />
F =ṁ 0 (F/ṁ 0 ) (29)<br />
As shown in Eq. (29), thrust accounts for the variation in both specific<br />
thrust 11 F/ṁ 0 and mass flow rate ṁ 0 .<br />
Uninstalled thrust-specific fuel consumption S is simply obtained<br />
by<br />
S = f o /(F/ṁ 0 ) (30)<br />
Thermal efficiency η th , which is defined as the net rate of the<br />
kinetic energy gain out of the engine divided by the rate of thermal<br />
energy available from the fuel, is<br />
η tH = Ėkinetic,gain<br />
ṁ f · h PR<br />
(31)<br />
For full throttle operation, the maximum inlet HPT total temperature<br />
(T t4 or main burner exit total temperature) and the LPT<br />
inlet total temperature (T t4.5 or ITB exit total temperature) are set<br />
to the values as listed in Table 2. For partial throttle operation, the<br />
minimum thrust is set to 20% of the maximum thrust.<br />
A program 11 was written in combination among Microsoft ® Excel<br />
spreadsheet neuron cells, VisualBasic, and macrocode to provide<br />
user-friendly interface so that the compilation and preprocessing<br />
are not needed.<br />
Predicted Performance Results<br />
Full Throttle Performance<br />
Figures 3a–3c present the uninstalled performance of the turbofan<br />
engines operating at full throttle settings for case A. These figures<br />
show the variations of thrust, thrust specific fuel consumption S,<br />
and thermal efficiency with flight Mach number M 0 and altitude,<br />
respectively. Two different altitudes are SLS condition and 10 km.<br />
The solid lines represent ITB engine performance while the dashed<br />
lines represent baseline engine performance.<br />
Engine Controls<br />
A model for engine control system presented in Mattingly 9 and<br />
Mattingly et al. 10 is included into off-design analysis. It is necessary<br />
because it avoids compressor stalls or surges and also ensures<br />
that maximum limits on internal pressures and turbine entry<br />
temperatures are not exceeded.<br />
Engine Configurations<br />
Two sets of reference-point engine data at sea-level-static (SLS)<br />
condition are selected, that is, cases A and B, as provided in Table 2.<br />
For each case, a conventional engine is considered as a baseline<br />
engine while a similar engine operating with an addition of ITB<br />
is termed as ITB engine. In addition, the component performance<br />
parameters, listed in Table 3, are kept the same for both cases.<br />
a)<br />
Table 2<br />
Design-point engine reference data<br />
Reference conditions Case A Case B<br />
Mach number M 0R 0 0<br />
Altitude h R SLS SLS<br />
Main burner exit total temperature T t4R , K 1450 1550<br />
ITB exit temperature T t4.5R , K 1350 1450<br />
Compressor pressure ratio π cR 20 25<br />
Fan pressure ratio π fR 2.43 2.2<br />
Fan bypass ratio α R 0.73 4.0<br />
Mass flow rate ṁ 0R , kg/s 118 540<br />
Table 3<br />
Engine component parameters<br />
Component parameters<br />
Input value<br />
Total pressure ratios<br />
Inlet π d,max 0.99<br />
Main burner π b 0.95<br />
ITB π ITB 0.95<br />
Nozzle π n 0.99<br />
Fan nozzle π fn 0.98<br />
Efficiencies<br />
Main burner η b 0.99<br />
ITB η itb 0.99<br />
HP spool η m-HP 0.92<br />
LP spool η m-LP 0.93<br />
Polytropic efficiencies<br />
Fan e f 0.93<br />
LP compressor e cL 0.8738<br />
HP compressor e cH 0.9085<br />
HP turbine e tH 0.8999<br />
LP turbine e tL 0.9204<br />
Fuel low heating value h PR 43,124 kJ/kg<br />
b)<br />
c)<br />
Fig. 3 Full-throttle performance comparison of turbofan engines<br />
(case A) vs M 0 , π fR = 2.43, π cR = 20, T t4R = 1450 K, T t4.5R = 1350 K,<br />
ṁ 0R = 118 kg/s, and α R = 0.73.
LIEW ET AL. 415<br />
In Fig. 3a, ITB engines at two different altitudes exhibit an increase<br />
in thrust over the baseline engine as M 0 increases. Because<br />
of more fuel injected into ITB in addition to the main burner, ITB<br />
engines do have slightly higher fuel consumption than the baseline<br />
engine. Nevertheless, adding ITB is still beneficial because the improvement<br />
in thermal efficiency (Fig. 3c) reflects that the gain in<br />
thrust offsets the slight increase in S. In addition, ITB engines perform<br />
even better at supersonic flight because there is no increase in<br />
S at all as M 0 is greater than 1.1.<br />
In Figs. 3a and 3c, both thrust and thermal efficiency curves at<br />
10 km exhibit a slope change at a M 0 of 1.2. The engine control<br />
system takes place at that operating point in order to limit the main<br />
burner exit temperature from exceeding the maximum inlet turbine<br />
temperature limit.<br />
Figures 4a–4c present the uninstalled performance of the turbofan<br />
engines operating at full throttle settings for case B. It is found<br />
that both engines have similar performance trends over the flight<br />
spectrum as in case A. While gaining higher thrust, ITB engine at<br />
10 km starts consuming less fuel at M 0 greater than 0.7.<br />
a)<br />
b)<br />
Fig. 5 Partial-throttle performance of turbofan engine (case A) at<br />
altitude of 10 km, π fR = 2.43, π cR = 20, T t4R = 1450 K, T t4.5R = 1350 K,<br />
ṁ 0R = 118 kg/s, and α R = 0.73.<br />
a)<br />
b)<br />
c)<br />
Fig. 4 Full-throttle performance comparison of turbofan engines (case<br />
B) vs M 0 , π fr = 2.2, π cR = 25, T t4R = 1550 K, T t4.5R = 1450 K, ṁ 0R =<br />
540 kg/s, and α R = 4.0.<br />
Partial Throttle Performance<br />
Figures 5a and 5b (case A) and 6a and 6b (case B) show the<br />
“S vs F” and “η th vs F” curves at partial throttle settings for three<br />
different values of M 0 at an altitude of 10 km. As seen clearly in<br />
Figs. 5a and 6a, the partial throttle performance curves for ITB<br />
engines preserve the classical hook shape that is known as “ throttle<br />
hook” in the propulsion community. As the throttle is reduced (i.e.,<br />
the thrust is decreased) until the ITB is turned off (which appears as<br />
a discontinuity in each curve), it results in a change in slope from a<br />
linear curve to a spline. This change is accompanied by an abrupt<br />
increase in S and a drop in thrust.<br />
According to Figs. 5a and 6a, it is clearly noticed that adding ITB<br />
further extends the engine operational range by producing higher<br />
thrust levels than that of a baseline engine. Within these higher<br />
thrust levels, the fuel consumption increases linearly with increasing<br />
thrust until it reaches a local maximum point, which represents<br />
the full throttle operation point. Depending on the engine configuration<br />
and flight conditions, this maximum point might or might not<br />
be higher than the S level of a baseline engine at its full throttle operation.<br />
For example, the local maximum points for the case A ITB<br />
engine with M 0 of 0.8 and 1.0 (Fig. 5a) have always higher S levels<br />
than that of baseline engine. This can be shown in Fig. 3b, where<br />
the case A ITB engine’s full throttle operations at M 0 lower than<br />
1.2 yield slightly higher fuel consumption. Nevertheless, Fig. 6a<br />
shows that case B ITB engine operating at full throttle condition<br />
exhibits lower S values at three different M 0 . Therefore, for some<br />
applications (e.g., case A) it might be better to operate the ITB engine<br />
at partial throttle settings (i.e., lower T t4.5 ) to avoid burning<br />
extra fuel while still achieving modest thrust augmentations. This<br />
will certainly provide fuel saving to many aircraft engines, which<br />
normally run at partial throttle settings during cruise operations at<br />
high altitude.<br />
As shown in Figs. 5b and 6b, the thermal efficiency of ITB engine<br />
is greatly improved over the baseline engine when ITB is on. However,<br />
its variation within the extended operational range is relatively<br />
small.
416 LIEW ET AL.<br />
Table 4<br />
Summary of results for mission analysis<br />
(24,000 lbf of takeoff weight)<br />
Baseline ITB<br />
Fuel Fuel Fuel Fuel<br />
Mission Alt, used, used, saved, saved,<br />
phases and segments M 0 kft lbf lbf lbf %<br />
1-2: A, warm up 0.0 2 380 347 33 8.7<br />
2-3: E, climb/acceleration 0.875 23 484 475 9 1.9<br />
3-4: Subsonic cruise climb 0.9 42 510 501 8 1.7<br />
5-6: Combat air patrol 0.697 30 715 703 13 1.8<br />
6-7: F, acceleration 1.09 30 248 244 4 1.6<br />
G, supersonic —— —— —— —— —— ——<br />
6-7: Penetration 1.5 30 1778 1716 62 3.5<br />
7-8: I, 1.6M/5-g turn 1.6 30 415 401 14 3.3<br />
7-8: J, 0.9M/5-g turn 0.9 30 297 292 5 1.8<br />
7-8: K, acceleration 1.2 30 226 225 1 0.5<br />
8-9: Escape dash 1.5 30 520 503 16 3.1<br />
10 —— —— —— —— —— ——<br />
11: Subsonic cruise climb 0.9 48 462 458 4 0.9<br />
12 —— —— —— —— —— ——<br />
13: Loiter 0.355 10 628 625 3 0.5<br />
Total —— —— 6664 6490 173 2.6<br />
For the following mission study, only case A is considered. For<br />
simplicity, only critical mission phases and segments are selected.<br />
Each selected mission leg is judged to be critical because it has<br />
a high fuel consumption and is an extreme operating condition. 10<br />
In each mission leg, the ITB engine is operating at partial throttle<br />
settings to avoid burning extra fuel as previously discussed.<br />
Table 4 contains a summary of the mission performance of ITB<br />
engine (case A) as compared to baseline engine in term of fuel consumption.<br />
Each aircraft has an initial takeoff weight of 24,000 lbf.<br />
It is found that ITB engine uses less fuel in all phases. Particularly,<br />
the fuel consumption in the warm-up (1-2) phase is significantly<br />
less. This calculation also shows that ITB engine consumes about<br />
2.6% less fuel for all of those selected critical mission legs, which<br />
ensure the fuel efficiency of an ITB engine over the baseline engine.<br />
To get an even better fuel consumption, one might want to return<br />
to the on-design cycle analysis 2,3 and choose other reference-point<br />
engines for further investigation.<br />
Conclusions<br />
A performance-cycle analysis of a separate-flow and two-spool<br />
turbofan with ITB has been presented. The mathematical modeling<br />
of each engine component (e.g., compressors, burners, turbines,<br />
and exhaust nozzles), in terms of its operating condition, has been<br />
systematically described. Results of this study can be summarized<br />
as follows:<br />
1) ITB engine at full throttle setting has enhanced performance<br />
over baseline engine.<br />
2) ITB operating at partial throttle settings will exhibit higher<br />
thrust at lower S and improved thermal efficiency over the baseline<br />
engine.<br />
3) Mission study ensures the ITB engine’s advantage of saving<br />
fuel over the baseline engine.<br />
Acknowledgment<br />
The authors would like to thank NASA John H. Glenn<br />
Research Center at Lewis Field for its financial support under Grant<br />
NAG3-2759.<br />
a)<br />
b)<br />
Fig. 6 Partial-throttle performance of turbofan engine (case B) at<br />
altitude of 10 km, π fR = 2.2, π cR = 25, T t4R = 1550 K, T t4.5R = 1450 K,<br />
ṁ 0R = 540 kg/s, and α R = 4.0.<br />
Mission Analysis<br />
A systematic mission study of the fuel consumption is performed<br />
to reveal the advantage of saving fuel by adding ITB. However, at this<br />
preliminary design phase the engine manufacturer’s published data<br />
are often unavailable; therefore, the off-design engine model like this<br />
one can be used to give a preliminary estimate of fuel consumption<br />
in each mission phase. 10 A 5% installation loss is accounted to give<br />
the mission analysis fuel consumption.<br />
References<br />
1 Zucrow, M. J., Aircraft and Missile Propulsion: Volume II, Wiley, New<br />
York, 1964, pp. 52, 53.<br />
2 Liew, K. H., Urip, E., Yang, S. L., and Siow, Y. K., “A Complete Parametric<br />
Cycle Analysis of a Turbofan with Interstage Turbine Burner,” <strong>AIAA</strong><br />
Paper 2003-0685, Jan. 2003.<br />
3 Liew, K. H., Urip, E., and Yang, S. L., “Parametric Cycle Analysis of a<br />
Turbofan Engine with an Interstage Turbine Burner,” Journal of Propulsion<br />
and Power, Vol. 21, No. 3, 2005, pp. 546–551.<br />
4 Liu, F., and Sirignano, W. A., “Turbojet and Turbofan Engine Performance<br />
Increases Through Turbine Burners,” Journal of Propulsion and<br />
Power, Vol. 17, No. 3, 2001, pp. 695–705.<br />
5 Sirignano, W. A., and Liu, F., “Performance Increases for Gas-Turbine<br />
Engines Through Combustion Inside the Turbine,”Journal of Propulsion and<br />
Power, Vol. 15, No. 1, 1999, pp. 111–118.<br />
6 Vogeler, K., “The Potential of Sequential Combustion for High Bypass<br />
Jet Engines,” Proceedings of the International Gas Turbine and Aeroengine<br />
Congress and Exhibition, June 1998; also ASME 98-GT-311, June 1998.<br />
7 Oates, G. C., Aerothermodynamics of Gas Turbine and Rocket Propulsion,<br />
2nd ed., <strong>AIAA</strong> Education Series, <strong>AIAA</strong>, Washington, DC, 1988,<br />
pp. 277–296.<br />
8 “Gas Turbine Engine Performance Station Identification and Nomenclature,”<br />
Aerospace Recommended Practice (ARP) 755A, Society of Automotive<br />
Engineers, Warrendale, PA, 1974.<br />
9 Mattingly, J. D., Elements of Gas Turbine Propulsion, McGraw–<br />
Hill, New York, 1996, pp. 18–31, 114–123, 240–246, 256–299, 346–361,<br />
392–405.<br />
10 Mattingly, J. D., Heiser, W. H., and Pratt, D. T., Aircraft Engine Design,<br />
2nd ed., <strong>AIAA</strong> Education Series, <strong>AIAA</strong>, Reston, VA, 2002, pp. 55–92,<br />
139–162, 577–587.<br />
11 Liew, K. H., Urip, E., Yang, S. L., Mattingly, J. D., and Marek, C. J.,<br />
“Performance (Off-Design) Cycle Analysis for a Turbofan Engine with<br />
Interstage Turbine Burner,” NASA-TM-2005-213658, July 2005.