Background Information - Computer Science 101 - West Virginia ...
Background Information - Computer Science 101 - West Virginia ...
Background Information - Computer Science 101 - West Virginia ...

You also want an ePaper? Increase the reach of your titles
YUMPU automatically turns print PDFs into web optimized ePapers that Google loves.
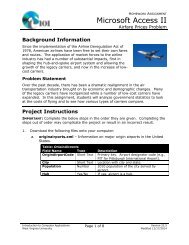
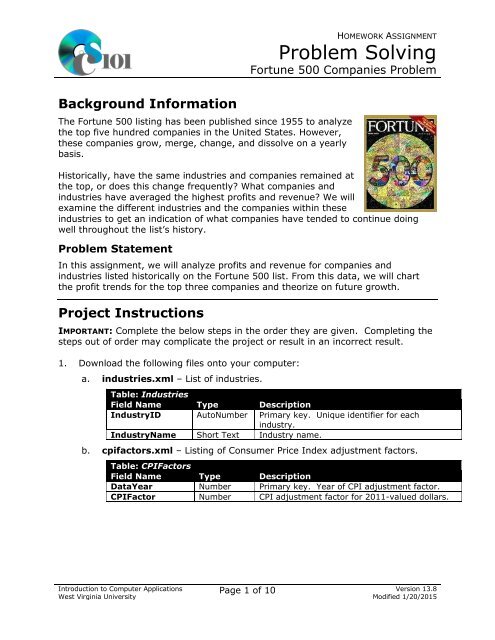
<strong>Background</strong> <strong>Information</strong>HOMEWORK ASSIGNMENTProblem SolvingFortune 500 Companies ProblemThe Fortune 500 listing has been published since 1955 to analyzethe top five hundred companies in the United States. However,these companies grow, merge, change, and dissolve on a yearlybasis.Historically, have the same industries and companies remained atthe top, or does this change frequently? What companies andindustries have averaged the highest profits and revenue? We willexamine the different industries and the companies within theseindustries to get an indication of what companies have tended to continue doingwell throughout the list’s history.Problem StatementIn this assignment, we will analyze profits and revenue for companies andindustries listed historically on the Fortune 500 list. From this data, we will chartthe profit trends for the top three companies and theorize on future growth.Project InstructionsIMPORTANT: Complete the below steps in the order they are given. Completing thesteps out of order may complicate the project or result in an incorrect result.1. Download the following files onto your computer:a. industries.xml – List of industries.Table: IndustriesField Name Type DescriptionIndustryID AutoNumber Primary key. Unique identifier for eachindustry.IndustryName Short Text Industry name.b. cpifactors.xml – Listing of Consumer Price Index adjustment factors.Table: CPIFactorsField Name Type DescriptionDataYear Number Primary key. Year of CPI adjustment factor.CPIFactor Number CPI adjustment factor for 2011-valued dollars.Introduction to <strong>Computer</strong> Applications<strong>West</strong> <strong>Virginia</strong> UniversityPage 1 of 10 Version 13.8Modified 1/20/2015
HOMEWORK ASSIGNMENTProblem SolvingFortune 500 Companies Problemc. companies.xml – Listing of companies appearing on the Fortune 500list.Table: CompaniesField Name Type DescriptionCompanyID AutoNumber Primary key. Unique identifier for eachcompany.CompanyName Short Text Company name.IndustryID Number Industry categorization for each company.d. rankings.xml – Data on company rankings from 1955 to 2011.Table: RankingsField Name Type DescriptionDataYear Number Part of composite key. Year of ranking onFortune 500 list.Ranking Number Part of composite key. Yearly ranking forcompany on the Fortune 500 list.CompanyID Number Part of composite key. Numeric valuerepresenting company name.Revenue Currency Amount of revenue generated by the companyin the previous year.Profit Currency Amount of profit generated by the company inthe previous year.e. commercialbanking.txt – Report text file to format in Word.f. bank.png – Image of a bank building for use in PowerPoint.Microsoft Access Portion2. Begin by creating a new Microsoft Access database namedlastname_firstname_ffhcp.accdb .3. Import the structure and data of the tables from industries.xml,cpifactors.xml, companies.xml, and rankings.xml into your new database.4. Create the appropriate relationships for the following tables. Enforcereferential integrity, but do not enable cascade updates or cascade deletes.a. Rankings and Companiesb. CPIFactors and Rankingsc. Industries and CompaniesIntroduction to <strong>Computer</strong> Applications<strong>West</strong> <strong>Virginia</strong> UniversityPage 2 of 10 Version 13.8Modified 1/20/2015
HOMEWORK ASSIGNMENTProblem SolvingFortune 500 Companies Problem5. Create separate queries to provide the information requested below. Nameeach query after the step in which it appears (e.g., name the query in Step 5aas Query5A ).HINT: Run your queries to test them. Make sure that they display all and onlythe records that you would expect to appear.a. Create a new query that lists each company’s name, its industry name,and each year where it appeared on the Fortune 500 list. Include twocalculated fields, one to find the yearly revenue in inflation-adjusted 2011dollars and another to find the yearly profit in inflation-adjusted 2011dollars.You can calculate the yearly revenue in inflation-adjusted 2011 dollarsusing the formula:[Rankings. Revenue] ∗ [CPIFactors. CPIFactor]You can calculate the yearly profit in inflation-adjusted 2011 dollars usingthe formula:[Rankings. Profit] ∗ [CPIFactors. CPIFactor]Format both calculated fields as currency with no decimal places. Sort bycompany name and then by year, both in ascending order.HINT: This query will show 28,500 records and 5 fields.b. Make a new query. For each year, calculate the total revenue, totalprofit, average revenue, and average profit for the top 10 companies.Only include records for companies ranked #1 through #10 in theirrespective years. Do not show the ranking field in the result.Format all four calculated fields as currency with no decimal places. Sortby year in ascending order.HINT: For the ranking field, change the Total option from Group By toWhere.HINT: This query will show 57 records and 5 fields.Introduction to <strong>Computer</strong> Applications<strong>West</strong> <strong>Virginia</strong> UniversityPage 3 of 10 Version 13.8Modified 1/20/2015
HOMEWORK ASSIGNMENTProblem SolvingFortune 500 Companies Problemc. We want to know which industries annually average more than $1 billionin revenue and also more than $1 billion in profit. For this query, copyand-pastethe below SQL code:SELECT Industries.IndustryName, Avg(Rankings.Revenue) ASAverageRevenue, Avg(Rankings.Profit) AS AverageProfit,Count(Rankings.Ranking) AS RankedCompaniesFROM Industries INNER JOIN (Companies INNER JOIN Rankings ONCompanies.CompanyID = Rankings.CompanyID) ONIndustries.IndustryID = Companies.IndustryIDGROUP BY Industries.IndustryNameHAVING (((Avg(Rankings.Revenue))>1000000000) AND((Avg(Rankings.Profit))>1000000000))ORDER BY Avg(Rankings.Profit);IMPORTANT: Do not make any modifications to this query other thanentering the above SQL code.HINT: This query will show 5 records and 4 fields.d. We would like to gather information on three major banking companies:Bank of America Corp., Citigroup, and FleetBoston Financial. For thisquery, copy-and-paste the below SQL code:SELECT Companies.CompanyName, Industries.IndustryName,Rankings.DataYear, CCur([Revenue]*[CPIFactor]) ASAdjustedRevenue, CCur([Profit]*[CPIFactor]) AS AdjustedProfitFROM Industries INNER JOIN (CPIFactors INNER JOIN (CompaniesINNER JOIN Rankings ON Companies.CompanyID =Rankings.CompanyID) ON CPIFactors.DataYear =Rankings.DataYear) ON Industries.IndustryID =Companies.IndustryIDWHERE (((Companies.CompanyName)="Bank of America Corp." Or(Companies.CompanyName)="Citigroup" Or(Companies.CompanyName)="FleetBoston Financial"))ORDER BY Companies.CompanyName, Rankings.DataYear;IMPORTANT: Do not make any modifications to this query other thanentering the above SQL code.HINT: This query will show 44 records and 5 fields.6. Run the Compact and Repair Database utility on your database.Microsoft Excel Portion7. Create a new Microsoft Excel workbook namedlastname_firstname_ffhcp.xlsx .Introduction to <strong>Computer</strong> Applications<strong>West</strong> <strong>Virginia</strong> UniversityPage 4 of 10 Version 13.8Modified 1/20/2015
8. We must adjust the sheets in our workbook.a. Rename Sheet1 to Most Profit by Industry .b. Add a new sheet named Commercial Bank Revenue .HOMEWORK ASSIGNMENTProblem SolvingFortune 500 Companies Problem9. We need to import the results of the Microsoft Access queries into the newMicrosoft Excel workbook.a. We wish to import the results of Query5C into the Most Profit by Industrysheet. This query returns information on the industries that generated anannual average of at least $1 billion in revenue and $1 billion in profit.Using the DATA ribbon, import the data from Query5C and place itstarting in cell A1. View the data as a table.b. We want to import the results of Query5D into the Commercial BankRevenue sheet. This query returns Fortune 500 rankings for three majorcommercial banks.Using the DATA ribbon, import the data from Query5D and place itstarting in cell A1. View the data as a table.10. We would like to create a chart to display information on the most profitableindustries.Create a new 2-D clustered column chart based on cells A1 through C6 of theMost Profit by Industry sheet. Save the chart to a new sheet named MostProfit by Industry Chart .Specify appropriate chart and axis titles. Format the value axis as currencywith no decimal places.11. To better understand the data, we wish to create a PivotChart with anassociated PivotTable.a. Create a new PivotChart and PivotTable based on the data in cells A1through E45 of the Commercial Bank Revenue sheet. Save the PivotChartto a new sheet named Bank Revenue PivotChart and the PivotTable to anew sheet named Bank Revenue PivotTable .b. On the PivotTable, do the following:i. Add the year as a Rows field.ii.iii.Add the company name as a Columns field.Add the inflation-adjusted revenue as a Values field.Introduction to <strong>Computer</strong> Applications<strong>West</strong> <strong>Virginia</strong> UniversityPage 5 of 10 Version 13.8Modified 1/20/2015
HOMEWORK ASSIGNMENTProblem SolvingFortune 500 Companies Problemc. We need to perform some formatting on the PivotTable.i. Format the cells as indicated below:(1) Bank of America Corp., Citigroup, FleetBoston Financial,and Grand Total columns: currency with no decimal placesd. We also need to perform some formatting on the PivotChart.i. Change the chart type to a 2-D line chart.ii.iii.Microsoft Word PortionFormat the value axis as currency with no decimal places.Specify appropriate chart and axis titles.12. Create a new Microsoft Word document namedlastname_firstname_ffhcp.docx .13. Insert a cover page using the built-in Sideline style. On the cover page,include the information noted below.a. Company: The words <strong>Computer</strong> <strong>Science</strong> <strong>101</strong> Section followed by thesection number in which you are enrolled.b. Title: Fortune 500 and Commercial Bankingc. Subtitle: Definitions and Examplesd. Author: Your first and last name.e. Date: The current date.14. Insert a second page if one does not already exist. On it, copy-and-paste thecontents of the file commercialbanking.txt.NOTE: The imported text file contains directions and comments (inside of “”symbols) for use in formatting the document. You should remove thesedirections and comments once you have applied the formatting specified.15. Where indicated, embed a copy of the chart from the Bank Revenue Chartsheet in your Microsoft Excel workbook. Size the chart to be 4-inches high by6.5-inches wide. Be sure to include a caption for the chart.16. Where indicated, insert a new equation using the Microsoft Word equation toolrepresenting the formula below. Your formula must identically reproduce:[Profit][CPIFactor]Introduction to <strong>Computer</strong> Applications<strong>West</strong> <strong>Virginia</strong> UniversityPage 6 of 10 Version 13.8Modified 1/20/2015
HOMEWORK ASSIGNMENTProblem SolvingFortune 500 Companies Problem17. At the end of the document, we wish to create a bibliography page.a. Define the following sources as references for your report.i. Type: Web siteii.iii.iv.◊◊Name of web page: Bank of America HomepageName of web site: Bank of America◊ Year: 2008◊ Date accessed: December 18, 2008◊URL: http://www.bankofamerica.comType: Web site◊◊Name of web page: Citigroup HomepageName of web site: Citigroup◊ Year: 2008◊ Date accessed: December 18, 2008◊URL: http://www.citigroup.comType: Web site◊◊Name of web page: JPMorgan Chase Home PageName of web site: JPMorgan Chase◊ Date: December 18, 2008◊ Date accessed: December 18, 2008◊URL: http://www.jpmorganchase.comType: Article in a periodical◊ Title: 2008 Fortune 500: Wal-Mart’s No. 1◊Periodical title: Fortune◊ Date: May 5, 2008b. Where indicated on the last page, insert a Bibliography-style bibliographyusing an APA style.18. We must finish formatting the document.a. Apply the formatting and changes to your report text as specified by theincluded comments.Remove the included comments from your document once you haveapplied the required formatting.Introduction to <strong>Computer</strong> Applications<strong>West</strong> <strong>Virginia</strong> UniversityPage 7 of 10 Version 13.8Modified 1/20/2015
HOMEWORK ASSIGNMENTProblem SolvingFortune 500 Companies Problemb. Ensure the document conforms to the following requirements:i. Modify the Normal formatting style to specify Verdana 11-point asthe default font.ii.In the right-hand corner of the header on all pages after the coverpage, list your last name followed by the page number. The pagenumber should begin at 1 on the first actual page of text (the pageafter the cover page).iii. The first line of your text paragraphs should be indented by 0.5-inch. Do not indent the cover page, headings, images, captions,equations, or bibliography.iv.Except on the cover page, use double line spacing.v. Ensure that there is no (0-point) line spacing before and after eachparagraph except on the cover page.vi.vii.Use 1.0-inch margins on all sides.Delete any duplicate line breaks.NOTE: This includes spaces between paragraphs and spacesbetween or after headings.Microsoft PowerPoint Portion19. Create a new Microsoft PowerPoint presentation namedlastname_firstname_ffhcp.pptx .20. In the presentation, create the following slides:a. Title slide listing a title for the presentation, your full name, coursesection, and an automatically-updating date.b. Slide titled Most Profit by Industry . Embed a copy of the columnchart from the Most Profit by Industry sheet of your Microsoft Excelworkbook.21. Create slides to answer four of the five below analysis questions, one questionper slide. Title the slide with the name of the question being answered (e.g.,"Question A").a. Even after adjusting for inflation, the total revenue of Fortune 500companies has had over a 10-fold increase from 1955 to 2011. Whatmight this indicate about the companies on the list?b. The #29 company on 2003’s Fortune 500 list, Time Warner, lost $98.7billion on $41.8 billion of revenue the previous year. Why didn’t TimeWarner have to file for bankruptcy with such a huge loss?Introduction to <strong>Computer</strong> Applications<strong>West</strong> <strong>Virginia</strong> UniversityPage 8 of 10 Version 13.8Modified 1/20/2015
HOMEWORK ASSIGNMENTProblem SolvingFortune 500 Companies Problemc. Looking through the companies on the Fortune 500 lists, name at leastone industry that you think would be a good investment and one that youthink would be a bad investment. Explain your rationale.d. When profits and revenue are adjusted for inflation, the top fourindustries all involve finances in some way. Why might this be the case?e. The Fortune 500 listings only include publicly-traded companies. Whyaren’t privately-owned companies listed?22. We wish to apply formatting to the presentation. Use your best judgment tocreate a professional-looking presentation.a. Apply one slide design of your choice to all slides.b. Apply an animation of your choice to the Most Profit by Industry chart.c. Apply slide transitions to all of the slides.d. Edit the parent (top-most) slide master to add the bank.png image tothe bottom-left corner of the slides. Size the image to be 0.5-inches highby 0.53-inches wide.NOTE: Depending on the slide design used, the image may not appear ontitle slides. This is fine as long as the image is correctly added to the slidemaster.e. Add your name, an automatically-updating date, and the slide number tothe footer of all slides except the title slide.Project RequirementsYou must submit all four files (Microsoft Access, Microsoft Excel, MicrosoftPowerPoint, and Microsoft Word) for this assignment.Curriculum <strong>Information</strong>Project TypeMicrosoft Access databaseMicrosoft Excel spreadsheetMicrosoft PowerPoint presentationMicrosoft Word documentRelationship to GEC Objective 2In this assignment, students perform data management and analysis on real-worldstatistics related to the economy. They explore the data to find explanations forthe historical data and to understand the possible future impact of existing trends.Introduction to <strong>Computer</strong> Applications<strong>West</strong> <strong>Virginia</strong> UniversityPage 9 of 10 Version 13.8Modified 1/20/2015
Relationship to GEC Objective 4HOMEWORK ASSIGNMENTProblem SolvingFortune 500 Companies ProblemFor over 50 years, the Fortune 500 listing has served as an important barometer ofthe American economy. By reviewing its listings, we can gain important insights tohow the economy and business world has evolved over the past half-century.Grading RubricThis project is worth 50 points and will be graded based upon the followingcomponents. The instructor may adjust the below values as he or she feelsappropriate:Step 3 2 points Step 14 2.5 pointsSteps 4a-c 1.5 points total Step 15 1.5 pointsSteps 5a-b 2.5 points each Step 16 1.5 pointsSteps 5c-d 1 points each Steps 17a-b 2.5 points totalSteps 8a-b 1 points total Steps 18a-b 3.5 points totalSteps 9a-b 1.5 points total Steps 20a-b 2.5 points totalStep 10 3 points Steps 21a-e (pick 4 of 5) 2.5 points eachSteps 11a-d 5 points total Steps 22a-e 2.5 points totalSteps 13a-e2.5 points totalAcknowledgmentsThe image in the introduction appears courtesy of Fortune magazine [1].References[1] Fortune 500 magazine cover. 2004. Available:http://i.cnn.net/money/.element/img/1.0/sections/mag/fortune/global500/fortune_g500_cover06.jpg.Introduction to <strong>Computer</strong> Applications<strong>West</strong> <strong>Virginia</strong> UniversityPage 10 of 10 Version 13.8Modified 1/20/2015