vulnerable group development (vgd) - WFP Remote Access Secure ...
vulnerable group development (vgd) - WFP Remote Access Secure ...
vulnerable group development (vgd) - WFP Remote Access Secure ...

Create successful ePaper yourself
Turn your PDF publications into a flip-book with our unique Google optimized e-Paper software.
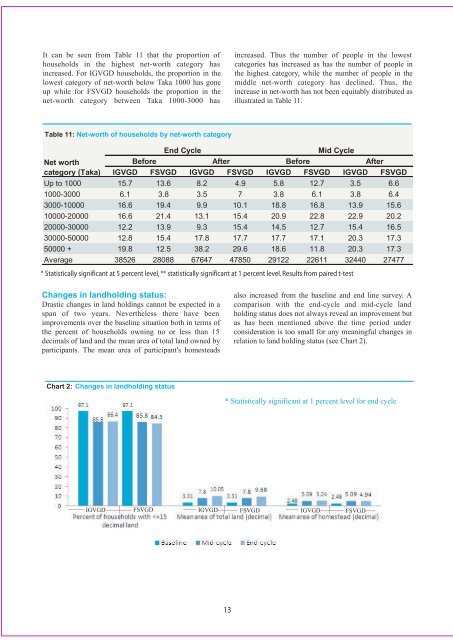
It can be seen from Table 11 that the proportion ofhouseholds in the highest net-worth category hasincreased. For IGVGD households, the proportion in thelowest category of net-worth below Taka 1000 has goneup while for FSVGD households the proportion in thenet-worth category between Taka 1000-3000 hasincreased. Thus the number of people in the lowestcategories has increased as has the number of people inthe highest category, while the number of people in themiddle net-worth category has declined. Thus, theincrease in net-worth has not been equitably distributed asillustrated in Table 11.Table 11: Net-worth of households by net-worth categoryNet worthcategory (Taka)End CycleMid CycleBefore After Before AfterIGVGD FSVGD IGVGD FSVGD IGVGD FSVGD IGVGD FSVGDUp to 1000 15.7 13.6 8.2 4.9 5.8 12.7 3.5 6.61000-3000 6.1 3.8 3.5 7 3.8 6.1 3.8 6.43000-10000 16.6 19.4 9.9 10.1 18.8 16.8 13.9 15.610000-20000 16.6 21.4 13.1 15.4 20.9 22.8 22.9 20.220000-30000 12.2 13.9 9.3 15.4 14.5 12.7 15.4 16.530000-50000 12.8 15.4 17.8 17.7 17.7 17.1 20.3 17.350000 + 19.8 12.5 38.2 29.6 18.6 11.8 20.3 17.3Average 38526 28088 67647 47850 29122 22611 32440 27477* Statistically significant at 5 percent level, ** statistically significant at 1 percent level. Results from paired t-testChanges in landholding status:Drastic changes in land holdings cannot be expected in aspan of two years. Nevertheless there have beenimprovements over the baseline situation both in terms ofthe percent of households owning no or less than 15decimals of land and the mean area of total land owned byparticipants. The mean area of participant's homesteadsalso increased from the baseline and end line survey. Acomparison with the end-cycle and mid-cycle landholding status does not always reveal an improvement butas has been mentioned above the time period underconsideration is too small for any meaningful changes inrelation to land holding status (see Chart 2).Chart 2: Changes in landholding status* Statistically significant at 1 percent level for end cycleIGVGD FSVGDIGVGD FSVGDIGVGD FSVGD13