vulnerable group development (vgd) - WFP Remote Access Secure ...
vulnerable group development (vgd) - WFP Remote Access Secure ...
vulnerable group development (vgd) - WFP Remote Access Secure ...

Create successful ePaper yourself
Turn your PDF publications into a flip-book with our unique Google optimized e-Paper software.
VULNERABLE GROUP DEVELOPMENT (VGD)Making a differenceto the extreme poor womenin Bangladesh through a socialsafety net programmeDhaka, BangladeshOctober 10, 2007
PROGRAMME OUTCOME REPORTONVULNERABLE GROUP DEVELOPMENT ACTIVITY<strong>WFP</strong> BANGLADESHWorld Food ProgrammeDhaka, BangladeshPrepared by theData Analysis andTechnical Assistance LtdData Analysis and Technical Assistance, Limited8/4 Block A (Unit 2), Lalmatia, Dhaka 1207, BangladeshOctober 10, 2007
EXECUTIVE SUMMARYVulnerable Group Development (VGD) is one of the largest safety net programmes assisted by the WorldFood Programme (<strong>WFP</strong>). It is targeted at poor and <strong>vulnerable</strong> women in Bangladesh. The ultimate goal ofthe programme is to bring sustainable improvement to the lives of ultra-poor households. Starting withassisting war, famine and flood victims in the early 1970s, the VGD programme has evolved over time tofocus on helping poor women graduate out of poverty. Currently about 750,000 women participants (about3.75 million beneficiaries) from ultra-poor households receive a monthly food ration combined with apackage of <strong>development</strong> services. The <strong>development</strong> package includes life skills and income generating skillstraining as well as a personal savings programme and access to micro-credit/NGO membership. There aretwo different forms of VGD: Income Generating Vulnerable Group Development (IGVGD) and FoodSecurity Vulnerable Group Development (FSVGD). IGVGD participants are provided with a monthly foodration of 30 kilograms of wheat/rice or 25 kilograms of fortified flour (atta) while FSVGD participants areprovided with a cash support of Taka 100 along with 15 kilograms flour. VGD activities are run on a twoyearcycle, and participants can only participate for one cycle. At the end of the previous CountryProgramme (CP) (2001-2006), the <strong>WFP</strong> Country Office in Bangladesh launched a New Country Programmeto be implemented from 2007 to 2010. The VGD programme is one of the components that makes up theNew Country Programme which aims to improve the nutritional status of women, children and adolescentsthrough improved food consumption, education, skills <strong>development</strong>, livelihood diversification and riskmitigation.This report highlights the findings of the outcome survey conducted on the VGD beneficiary householdswho participated in the 2005-2006 VGD programme cycle. The purpose of the survey was to assess thechanges in the lives of ultra-poor households brought about by VGD activity by comparing to their statusbefore the programme (baseline) and the middle of the programme. The survey undertaken in July 2007,referred to as the end-cycle outcome study covered 345 women in 46 Unions under 46 Upazilas in 29districts from each of the programme components (IGVGD and FSVGD).The study found that VGD activity made a significant difference in the food and livelihood security ofextremely poor households in Bangladesh. A comparison of food consumption status between before andafter programme participation show that the percentage of households consuming three square meals a dayhave more than doubled for IGVGD beneficiaries and almost tripled for FSVGD beneficiaries. Notably,most VGD beneficiaries retained their improved food consumption six months after they completed theirVGD cycle, although their food consumption reached a peak during their enrolment in the programme. Thisis no small achievement. However nearly 50 percent of the IGVGD households and 40 percent of theFSVGD households still do not consume three full meals a day. Though most households were food securein terms of number of meals they consumed, there was little improvement in dietary diversity and the bulkof household food expenditure continued to be on cereals.Even after the programme cycle, almost all the households still have an income of less than US$ 1 per capitaper day. However, the proportion of VGD households with per capita daily income equal or more than US$0.5 increased from 3 percent to 33 percent among IGVGD beneficiaries and 25 percent among FSVGDbeneficiaries. In relation to monthly per capita food expenditure and monthly per capita total expenditure,FSVGD households are behind IGVGD households. The VGD beneficiaries and their families achieved aphenomenal change in terms of the net worth of their households. Much of this increase is due to theacquisition of productive assets which has brought about an improvement in their material and economicwell-being.
The proportion of women in the 2005-2006 VGD cycle who are now directly involved in an IGA is higher(FSVGD - 75%; IGVGD - 60%) than that of baseline situation (31%). As FSVGD women receive acombination of food and cash with mandatory saving procedures, they are able to start an IGA without theadded hassle of paying back the borrowed capital with interest. IGVGD women, on the other hand, have abuilt-in credit programme which gives them access to a micro finance facility at the end of their IGAtraining. However, ultra-poor women are often reluctant to start or continue an IGA with the burden ofrepaying a loan by following a NGO mandatory installment procedure.The significant decline in the number of households making distress sales between the baseline and the endcyclesurvey suggests that both IGVGD and FSVGD women improved their crises coping capabilities. Thedecline in distress sales was higher for IGVGD households in comparison to FSVGD households. Thevulnerability of these poor households has also reduced in terms of sacrificing productive assets to cope withcrises. In comparison to the baseline situation, families were using more positive coping strategies duringdifficult periods, such as using their savings or borrowing from friends and relatives.In relation to women's empowerment, beneficiaries from male-headed VGD households still had little say inthe household decision making process. FSVGD women were more empowered than their IGVGDcounterparts in areas of decision making relating to investing in IGAs, investing in household assets, takingloans and depositing savings. Since these are key areas of household decision making, it is a good reflectionof the usefulness of monthly cash entitlements given to FSVGD women in addition to their food entitlement.Giving cash directly to women appears to make them more empowered to make important decisions relatingto money matters.Both IGVGD and FSVGD households do not seem to follow healthy cooking practices and neither do theymaintain proper health, hygiene and sanitation. They also have a low level awareness and knowledge ofAIDS. More than 70 percent of the women surveyed had not heard of AIDS.
Key outcomes of VGDcycle (2005-2006):•The proportion of VGD households consuming three squaremeals a day more than doubled between the baseline andoutcome surveys.•The proportion of households earning more than US$ 0.50 perday increased by 30 percentage points among IGVGDhouseholds and 22 percentage points among FSVGDhouseholds.•After participation in VGD activity the number of womeninvolved in income generating activities increased by 31percentage points for IGVGD participants and 45 percentagepoints for FSVGD participants.•The net worth of IGVGD households increased by 57percentage points and 26 percentage points for FSVGDhouseholds between the middle and the end of theprogramme.•Women who are given cash directly seem more empoweredto make important household decisions relating to money.
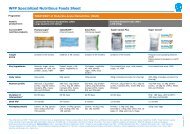
CONTENTS1 Introduction 1Introduction ................................................................. 1Purpose of the Survey .................................................. 2Survey Design and Sampling ....................................... 2Training ....................................................................... 5Field Operarions .......................................................... 5Quality Control Mechanisms........................................ 5Problem Encountered in the Field ................................ 5Data Entry and Cleaning .............................................. 5Data Processing and Analysis ....................................... 52 Background characteristics 6of VGD householdsCharacteristics of sample households ........................... 6Characteristics of sample beneficiaries .......................... 63 Improved household food 7security of the extreme poor4 Enhanced household 11livelihood security of theextreme poorExpenditure pattern of households .............................. 11Changes in the net-worth of beneficiary households .. 12Changes in landholding status ...................................... 13Skill <strong>development</strong> of beneficiary women:participation in IGA ................................................. 14Savings pattern of households ...................................... 17Crises coping strategies of households ........................ 17Knowledge of flood management strategies ................ 19Indebtedness of households ......................................... 205 Healthy practices in the 22daily life of the extremepoorHealthy practices and hygiene .................................... .22AIDS awareness........................................................... 23Mother and child health............................................... 246 Social transformation of the 27extreme poorAwareness of women rights:......................................... 27Status of women participation in decision making ...... 287 Conclusions ions and 30RecommendationsRecommendations ...................................................... 31Case Study:1. A Giant Step for Meem ....................................... 152. Vulnerable Group Developmentprogramme has changed Zayeda's life ................ 163. VGD helps Rupali recover after floods ............... 214. Bonary makes a profit 15,600 takaper month ............................................................ 265. Knowledge of women rights helpsShahida protect herself from violence ................ 29List of figuesFigure 1: Targeting the poor - who are themost food insecure and most <strong>vulnerable</strong> ..... 1Figure 2: VGD Programme Survey SItes ................... 4List of charts:Chart 1: Proportion of households spendingmore than 70% of total expenditureon food ........................................................12Chart 2: Changes in landholding status ..................... 13Chart 3: Involvement in IGA: end-cycleand baseline .................................................14Chart 4: Proportion of households making distresssales/mortgages before and after joiningprogramme ...................................................17Chart 5: Crises coping strategies of households ....... 19Chart 6: Healthy practices and hygiene .................... 22Chart 7: Mother and childcare: Knowledge .............. 25Chart 8: Index of mobility of VGD women ...............29
CONTENTSList of tables:Table 1: Region-wise division of samplehouseholds under VGDprogramme ................................................... 3Table 2: Characteristics of samplehouseholds ................................................... 6Table 3: Background characteristics of samplebeneficiary women ....................................... 6Table 4: Proportion of households consuming2/3 meals per day ......................................... 7Table 5: Number of major food <strong>group</strong>sconsumed by households per day ................. 8Table 6: Number of major food <strong>group</strong>sconsumed by households per day(<strong>WFP</strong> specified) ............................................ 8Table 7: Diet diversity index of beneficiaryhouseholds..................................................... 9Table 8: Proportion of food expenditure onthe selected food <strong>group</strong>s by foodexpenditure category ...................................10Table 9: Expenditure pattern ofhouseholds ...................................................11Table 10: Net-worth of households ...........................12Table 11: Net-worth of households bynet-worth category .....................................13Table 12: Skill <strong>development</strong> of beneficiarywomen .......................................................14Table 13: Savings of beneficiaryhouseholds..................................................17Table 14: Quantum of savings by beneficiaryhouseholds..................................................17Table 15: Proportion of households sellingat least 25% of their productive assetsin distress (non-land) .................................18Table 16: Type of crises faced by householdsfor which distress sales/mortgageswere made ..................................................18Table 17: Knowledge of flood managementtechniques ................................................ 19Table 18: Indebtedness of households ..................... 20Table 19: Reasons for borrowing ............................ 20Table 20: Water and sanitation of VGDhouseholds ............................................... 23Table 21: Water and sanitation index ofbeneficiary households ............................ 23Table 22: AIDS awareness issues ............................ 23Table 23: Mother and childcare:knowledge-practice gap ........................... 24Table 24: Social awareness among IGVGD andFSVGD beneficiaries .............................. 27Table 25: Awareness of women rights ...................... 28Table 26: Status of women participationin decision making .................................. 28Table 27: Socio-economic characteristicsof IGVGD and FSVGD householdsbased on level of food insecurity ............. 30AppendixWater and sanitation index ..........................................32Mobilty Index ...............................................................32
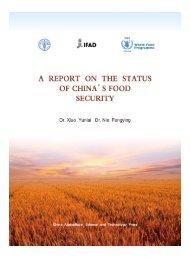
Chapter 1IntroductionIntroduction:Vulnerable Group Development (VGD) is one of thelargest safety net programs assisted by the World FoodProgramme (<strong>WFP</strong>). It is specifically targeted at poorwomen in Bangladesh. The programme's ultimate goal isto bring sustainable improvement to the lives of membersof ultra-poor households. Since the VGD programme wasstarted to assist war, famine and flood victims in the early70's, it has evolved to become one of <strong>WFP</strong>'s keyprogramme strategies to assist poor women escapepoverty line of less than 1,805 kcal intake a day andenable them to participate in government and NGOsupported<strong>development</strong> activities.VGD aims to reach ultra-poor rural women withcomplementary inputs that will improve their nutritionand enhance their livelihoods and self-reliance. Over 24months, the VGD assistance package includes:- fortified wheat flour or rice to offset the opportunitycosts of participating in training programmes and toimprove nutrition;- training in health and nutrition, civil and legal rights,literacy and numeracy, HIV awareness and preventionmeasures, child trafficking, budget management, andincome-generating activities;- enrolment in personal savings programmes;- micro-credit aimed at securing small businesses toenhance livelihood security; and- NGO membership for women who repay loans.The VGD programme had two components: (i) IncomeGenerating VGD (IGVGD) and (ii) Food Security VGD(FSVGD). The components together served 750,000participants (about 3.75 million beneficiaries) from theultra-poor households. In the IGVGD component,beneficiaries received a monthly ration of 30 KGs ofwheat or 25 KGs of fortified flour (atta) and in theFSVGD programme, beneficiaries receive 15 kg atta andTaka 150 per month. All the programmes are similar intheir beneficiary targeting approach and <strong>development</strong>package service delivery.FSVGD was only operational in seven districts inNortherh Bangladesh: Dinajpur, Kurigram, Lalmonirhat,Naogaon, Rajshahi, Panchagarh and Thakurgaon. Theseareas are 'monga'(Bangla name for a near faminesitutation) prone areas where the level of food insecurityis very high. IGVGD was operational in all remainingdistricts across the country.Figure-1: Targeting the poor - who are the most food insecure and most <strong>vulnerable</strong>147 millionCalorie IntakePoverty LineUltraPoor2,122 KCal1,805 KCalIncome20+ MillionPercentage of income spent on food1
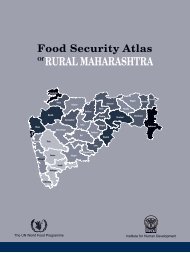
Purpose of the SurveyThis outcome survey, undertaken in July 2007, covers the phased out beneficiaries of both IGVGD and FSVGD activityin the 2005-2006 VGD programme cycle. In this report it will be referred to as the end-cycle outcome survey. Itspurpose is to assess the intended change in the lives of ultra-poor households as a result of their participation in IGVGDand FSVGD activity. The VGD women were surveyed after six months of their phase out from the programme. Overall,the survey aimed to assess the food security and nutritional status of beneficiary households and their health andlivelihood status in comparison to the baseline results collected in 2005.Survey Design and SamplingSurvey site: The survey was conducted in 46 unions in 46 Upazilas in 29 districts all over Bangladesh (see Figure 2).Of these, the FSVGD survey was done in the northern districts of Dinajpur, Kurigram, Rajshahi, Lalmonirhat, Naogaon,Thakurgaon, Panchagarh while the IGVGD survey was done in the rest of the country.Sampling design and sample size: In order to determine the required sample size an approach based onconfidence level and precision rate was followed. The advantage of this approach is that the statistical validity of asample does not depend on its size relative to the population being investigated. Rather what matters is the requiredlevel of probability (confidence level), required degree of precision and the variability of the population. The followingformula was used to estimate the required sample size:2z × p × qn =2eWhere,n = sample sizez = standard normal variate at a given level ofsignificance (z = 1.96 at 95% confidence interval)p = proportion of success for the indicatorq = 1 - pe = precision rate or amount of admissible error in theestimateThe sample design needed to take into account the cost and time needed to interview each respondent and the timeneeded to move from respondent to respondent. If the latter factor was not an issue, a simple random sampling wouldsuffice. To minimize survey costs, the right trade-off is needed between the number of clusters and the size of eachcluster. Fewer clusters will reduce travel and other costs of seeking out the sample as the respondents are within alimited area. However, the variation within the population will not be well reflected as one can expect there to be lessvariation among people in one cluster compared to people in a range of clusters. The sample size needs to be increasedor compensated for this 'cluster effect'. The cluster effect can be calculated using the formula:CfWhere,C = cluster factorfz = cluster coefficient (usually taken to be 0.2)Cn=n1+z(C −1)= number of samples in each clusterThe cluster size was set at 15 households per cluster taking into account cost and interview time, time needed to movebetween respondents and the size of the survey team. Using the above formula, an adjustment factor of 3.8 wascalculated for a cluster sample of 15.The union is the lowest administrative level in the VGD programme. Thus a union was taken as the Primary SamplingUnit (PSU). Each union was selected as a cluster. To minimize enumerator hardship in contacting sample respondentsscattered over the whole union, one or two wards were selected at random. From these randomly selected wards, thesample was drawn. A two-stage systematic cluster random sampling technique was used to select the samplehouseholds. The sample was drawn according to probability proportionate to size (PPS) where the number ofprogramme participants per union was taken as the weight. The list provided by <strong>WFP</strong> served as the sampling frame todraw the sample target beneficiaries. Table 1 gives the region-wise distribution of sample households.2
Table 1: Region-wise division of sample households under VGD programmeNo. of samplehouseholdsTotal beneficiaryhouseholds% of sample to totalbeneficiaryhouseholdsDistrict Upazila Union IGVGD FSVGD IGVGD FSVGD IGVGD FSVGDBagerhat Mollahat Chunkhola 15 175 8.6Barisal Gournadi Nalchira 15 88 17Brahmanbaria Sarail Pakshimul 15 250 6Comilla Barura Jhalam 15 80 18.8Comilla Birampur Jotbani 15 100 15Dinajpur Bochaganj Ishania 15 250 6Dinajpur Dinajpur Askorpur 15 130 11.5Dinajpur Nawabganj Daudpur 15 113 13.3Gaibandha Gobindaganj Mahimaganj 15 382 3.9Gopalganj Gopalganj(s) Paikkandi 15 264 5.7Habiganj Bahubal Shatkapon 15 200 7.5Jamalpur Islampur Gaibandha 15 290 5.2Jessore Sarsha Lauxmanpur 15 100 15Kishoreganj Katiadi Luhajuri 15 203 7.4Kishoreganj Chilmari Nayerhat 15 210 7.1Kishoreganj Fulbari Nowdanga 15 300 5Kurigram Kurigram Jatrapur 15 395 3.8Kurigram Nageswari Newashi 15 284 5.3Kurigram Rajarhat Gharialdanga 15 380 3.9Kurigram Ulipur Thetrai 15 309 4.9Kushtia Khoksha Betbaria 15 240 6.3Kushtia Hati Bandha Barakhata 15 730 2.1Lalmonirhat Kaliganj Chandrapur 15 323 4.6Lalmonirhat Lalmonirhat Mogalhat 15 300 5Mymensingh Nandail Chondipasha 15 234 6.4Mymensingh Trishal Bailor 15 220 6.8Mymensingh Badalgachi Bilashbari 15 225 6.7Mymensingh Manda Manda 15 238 6.3Naogaon Mohadevpur Chandash 15 305 4.9Naogaon Neyamatpur Sreemantapur 15 220 6.8Naogaon Raninagar Baragacha 15 175 8.6Narail Kalia Joynagar 15 230 6.5Natore Lalpur Walia 15 267 5.6Nawabganj Nawabganj Jhilim 15 229 6.6Netrokona Kendua Balaishimul 15 270 5.6Panchagarh Debiganj Sonahar 15 250 6Rajbari Pangsha Kashba Mazail 15 260 5.8Rajshahi Puthia Bhalukgachi 15 164 9.1Rajshahi Tanore Kamargaon 15 360 4.2Rangpur Kaunia Tepa Modhupur 15 440 3.4Serajganj Serajganj Sialkole 15 193 7.8Shariatpur Shariatpur(s) Domshar 15 188 8Sylhet Bishwanath Daulatpur 15 135 11.1Tangail Ghatail Ghatail 15 100 15Thakurgaon Baliadangi Barobari 15 187 8Thakurgaon Ranisankail Dharmagarh 15 195 7.7ALL345 345 5038 6143 6.84 5.623
UlipurGhatailMandaKaliaPangshaTrishalNandailBauraGobindaganjNiamatpurDinajpurKenduaTanoreNawabganjIslampurSharshaGopalganjNageshwariLalpurSirajganjSarailDebiganjMahadebpurKatiadiKurigramNawabgonjPuthiaBahubalKaligonzRanisankailBaliadangiHatibandhaRaninagarPalongMollahatLalmonirhatatatBochaganjKauniaBirampurRajarhatPhulbariBishwanathBadalgachhiGaurnadiKhoksaChilmariSylhetRangamatiTangailBograKhulnaDinajpurComillaBandarbanNaogaonPabnaMymensinghSatkhiraSunamganjJessoreHabiganjNatoreNetrakonaSirajganjRangpurRajshahiBagerhatNoakhaliFaridpurDhakaJamalpurMaulvibazarKushtiaKishoreganjGazipurGaibandhaFeniJhenaidahChandpurSherpurNarailRajbariNawabganjBarisalMaguraManikganjChittagongBholaKurigramKhagrachhariCox's BazarNilphamariThakurgaonGopalganjBrahamanbariaNarsingdiShariatpurPanchagarhLakshmipurMadaripurLalmonirhatJoypurhatChuadangaMunshiganjPatuakhaliMeherpurBargunaPirojpurNarayanganjJhalokatiFSVGDIGVGD
TrainingA five-day training was organised and delivered by DATA(Data Analysis and Technical Assistance Limited) for theenumerators. The training included a briefing on theobjectives of the survey, interview techniques as well as adetailed explanation of each question and its relevance tothe survey, how to pose the question and how to code theanswers. Useful feedback received from the traineeshelped in the <strong>development</strong> of the questionnaire. A set ofguidelines was also created during the training session,which was given to each enumerator to use during datacollection.Field OperationsBased on the sample size distribution, the field surveywas carried out by two teams, each consisting of twofemale and two male enumerators and a supervisor.Following the plan, the enumerators had to interviewthree households per day and have the survey complete in25 days. However, the floods in August and September2007 hampered the pace of activity and the survey wasdelayed by two weeks. The enumerators had to work ininclement weather under hard conditions. Given theextensive flooding, the enumerators had to take boats toand from the survey sites, at great risk to their personalsafety.Quality Control MechanismsEach team of enumerators were overseen by a supervisorwho managed the day-to-day data collection process.Field supervisors checked the enumerators' interviewingtechnique, reviewed questionnaires for problems, anddealt with logistical problems on a daily basis.Supervisors used the Lot Quality Assessment Technique(a lot of questionnaires drawn randomly from a pile offilled-in questionnaires and rechecked with theinterviewee) to ensure the interview quality during thesurvey. At the end of each day, supervisors andenumerators discussed and corrected any problems thatmay have arisen in the field. Each enumerator checked hisor her work before handing the questionnaire to the fieldsupervisor, who reviewed the filled-in questionnairesagain, before passing it on for data entry.Problems Encountered in the FieldAs already been mentioned, the field conditions were verydifficult due to incessant rain and unprecedented floods.Data Entry and CleaningCollected data was entered using the customized MS<strong>Access</strong> data input software developed by DATA. Once theentry was completed, the following techniques wereemployed to check the consistency and validity of data:1. Five percent of the filled-in questionnaires werechecked against entered data to measure transmissionerrors or typological errors, and;2. A logical consistency checking technique wasemployed to identify inconsistencies using SPSS andSTATA software. Any inconsistencies ordiscrepancies found were corrected.Data Processing and AnalysisResults from the survey were processed using MS Excel,SPSS and STATA software.Since the present survey objective was to assessoutcomes, the basic methodology involved a comparisonof VGD households with the earlier baseline surveyhouseholds. Different statistical tools and methods havebeen used to analyse the quantitative data. Results fromthe qualitative survey have been put in separate boxes.5
Chapter 2Background characteristicsof VGD householdsCharacteristics of sample households:VGD activity targets extreme poor households from thecommunity with particular socio-economiccharacteristics. The survey found nearly 50 percent ofIGVGD households were female-headed while onequarterof FSVGD sample households were femaleheaded.The average household size in both FSVGD andIGVGD <strong>group</strong>s was four. The majority of the householdswere Muslim followed by Hindu (8% IGVGD and 12%FSVGD) and Christian (0.3 %). Almost all the householdswere Bengali. Wage labour was the main source ofincome for FSVGD household heads (66 percent), incomparison to 36 percent of IGVGD household heads.Petty trade or self-employment was the second mostcommon source of income followed by agriculturalsources and services.Table 2: Characteristics of sample householdsHousehold characteristics IGVGD FSVGDi) Male headed hhs (%) 52.8 73.3ii) Female headed hhs (%) 47.2 26.7iii) Average hh size 4.4 4.3Religion of hh (%)Muslim 91.6 87.2Hindu 8.1 12.5Christian 0.3 0.3Buddhist 0 0Others 0 0iv) Ethnicity of HHs (%)Bengali 99.4 99.4Bihari 0 0.3Tribal 0.6 0.3v) Main source of income of household head (%)Agriculture sources 20.6 11.9Wage labor 35.9 62.6Petty trade/self employment 25.8 15.9Services 4.3 3.8Beggar 0.9 1.2Housewife 8.4 1.7Others 4.1 2.9Characteristics of sample beneficiariesThe average age of beneficiary women in both programswas 36-40 years (Table 3). Their marital status shows thatunmarried beneficiaries were rare but about one-fourth ofIGVGD women and 16 percent of FSVGD women werewidows. About 7-10 percent of women in both <strong>group</strong>swere divorced, or separated or abandoned.The literacy and education level of the beneficiaries fromboth <strong>group</strong>s was very poor. About 22 percent of theIGVGD women and 13 percent of the FSVGD womenwere illiterate. Sixty to 70 percent of women only knewhow to sign their names. More women in the IGVGD6<strong>group</strong> could read and write Bangla than in the FSVGD<strong>group</strong> (17% vs 10%). Most of those who could read andwrite do not seem to have received formal education asonly 15 percent of IGVGD women and 13 percent ofFSVGD women had finished primary school. Only 6percent of IGVGD participants and 3 percent of FSVGDparticipants graduated from secondary school.Most beneficiaries practice agriculture as their primaryoccupation. A large proportion of beneficiaries werehousewives followed by day labour and petty trade.Table 3: Background characteristics of samplebeneficiary womenCharacteristicsIGVGD FSVGDi) Mean age of beneficiary in years 39.4 36.1ii) Marital status of beneficiary (%)Unmarried 1.4 1.2Married 63.8 72.2Widowed 27 16.5divorced/separated/abandoned 7.8 10.1iii) Literacy of beneficiary (%)Illiterate 22 13.3Sign only 59.4 73.3Read only 1.7 3.2Read and write bangle 16.8 10.1iv) Education of beneficiary (%)None 79.1 84.1Primary 14.8 12.8Secondary 6.1 2.9Above secondary 0 0.3v) Occupation of beneficiary (%)Housewife 30.7 15.1Day labour 19.1 31Agriculture 35.7 43.5Petty trade 8.7 8.4Services 0.9 0.9Others 4.9 1.2vi) No. of children of beneficiary 2.2 2vii) Beneficiaries with children below5 years of age (%)31.9 27viii) Beneficiaries with school goingchildren (below 15 years of age) (%)57.7 55.7ix) Beneficiaries husband is disabled(%)11.4 4.8x) Average no. of dependants inhousehold (non-income earners)2.4 2.1Both beneficiary <strong>group</strong>s have an average of two childrenper household which is also the average number ofdependants per household implying that most families arenuclear families. About 30 percent of these householdshave children below 5 years of age while about 55 percentof households have school going children below 15 yearsof age. Eleven percent of IGVGD women and 5 percentof FSVGD women had a disabled husband.
Chapter 3Improved household foodsecurity of the extreme poorAt the national level food security means the availabilityin the country of sufficient stocks of food to meetdomestic demand until such time as stocks can bereplenished from harvests or imports. At the individuallevel, it means that all members of the society haveaccess to the food they need, either from their ownproduction, from the market and/or from thegovernment's transfer mechanism. Experiences haveshown that even when national level food security isachieved, individuals and <strong>group</strong>s in the country can stillgo hungry because they do not have the means to accessfood (Clay, 1989). The food security situation of VGDhouseholds was examined in terms of meal frequency,dietary diversity and household food expenditurepatterns.The proportion of IGVGD and FSVGD households whocould not afford to consume three meals a day declinedsubstantially since the baseline survey (Table 4). This isno small achievement. However, the percentage ofhouseholds who consumed three full meals a daydecreased between the end-cycle and the mid-cycle butremained substantially higher than the baseline situation.The proportion of households consuming two full mealsa day also declined between the mid-cycle and the endcycleand there was an increase in the number ofparticipants falling into the 'one meal per day' and 'no fullmeal taken' categories. The percentage of IGVGDhouseholds who took only a single meal in a dayincreased from eight percent in the mid-cycle to 13percent in the end-cycle. The respective figures forFSVGD were seven percent and 11 percent. There wasalso a substantial increase in the proportion ofhouseholds who did not take a single full meal in a day.Thus, it appears that the households' food consumptionreached a peak in the middle of the programme butdecreased again after the households graduated from theprogramme.The proportion of VGDhouseholds consuming threesquare meals a day has morethan doubled compared to theprevious situation.Table 4: Proportion of households consuming 2/3 meals per dayEnd-cycle Mid-cycle BaselineNo. of mealsIGVGD FSVGD IGVGD FSVGD3 full meals per day 55.1 60.3 55.7 63.3 21.12 full meals per day 26.1 24.9 34.5 29.8 39.61 full meal per day 13 11.3 8.1 6.7 24.6No full meal taken 5.8 3.5 1.7 0.3 14.7Chi-square (p-value) 0 07
Table 5: Number of major food <strong>group</strong>s consumed by households per dayEnd-cycle Mid-cycle BaselineNo. of food <strong>group</strong>sIGVGD FSVGD IGVGD FSVGD6 food <strong>group</strong>s 29.3 46.4 51.6 41.9 25.7At least 5 food <strong>group</strong>s 73.9 78 83.5 76.9 70.5At least 4 food <strong>group</strong>s 96.2 92.2 97.4 93.6 96.2At least 3 food <strong>group</strong>s 100 99.7 100 100 99.4At least 2 food <strong>group</strong>s 100 100 100 100 100Chi-square (p-value) 0.5 0Information was collected on the households' consumption of the six major food <strong>group</strong>s: cereals, pulses, fats and oils,vegetables and fruits, tubers and animal products. Although most households are food secure in terms of number ofmeals eaten per day, their dietary diversity is low (Table 5). Less than 30 percent of the IGVGD households consumeall six food <strong>group</strong>s per day. In contrast 46 percent of FSVGD households consume all food <strong>group</strong>s per day. If one looksat the percentage of households consuming at least four food <strong>group</strong>s a day (which is the requirement for a balanceddiet), the situation has not changed since the baseline.Table 6: Number of major food <strong>group</strong>s consumed by households per day (<strong>WFP</strong> specified)End-cycle Mid-cycle BaselineNo. of food <strong>group</strong>sIGVGD FSVGD IGVGD FSVGDConsumed 4 food <strong>group</strong>s* 82 74.2 80 80.1 63.6Consumed any 3 of 4 food <strong>group</strong>s* 18 25.8 19.4 19.4 33.2Total 100 100 99.4 99.4 96.8Chi-square (p-value) 0 0* These 4 food <strong>group</strong>s consist of cereals, animal products, vegetables/fruits, oils & fats8
To assess the dietary diversity of households, an index on diet diversity of the households was calculated usingthe Berry index of diversity (Berry 1971) which is obtained222⎛ a1⎞ ⎛ a2⎞ ⎛ an⎞D = 1−⎜ ⎟ + ⎜ ⎟ + .......... + ⎜ ⎟⎝ A ⎠ ⎝ A ⎠ ⎝ A ⎠where aj refers to individual food consumption expenditure while A refers to the total consumption1expenditure of the household. The diversification index (D) is always between zero and unity with zeroimplying no diversification. D increases as the ratio approaches unity.A look at the diet diversity index (Table 7) also shows similar results to that in Table 5. The proportion ofhouseholds with high diet diversity has decreased. However, the proportion of households with low diet diversityhas also decreased, while households with medium diet diversity has increased. The proportion of householdswith medium diet diversity was higher in the mid-cycle than in the end-cycle.Table 7: Diet diversity index of beneficiary householdsPercentage of householdsDiet diversity indexEnd-cycleMid-cycle BaselineIGVGD FSVGD IGVGD FSVGD VGDLow (0.0 to 0.65) 46.4 47.8 34.2 34.7 49.7Medium (0.65-0.80) 53 51.6 64.6 64.5 48.8High (> 0.80) 0.6 0.6 1.2 0.9 1.4When compared with the mid-cycle results, thereappears to be a fall in the variety of food <strong>group</strong>sconsumed and a consequent fall in the diet diversityindex. Overall, it can be seen from Table 4, Table 5and Table 6 that households are improving from thebaseline situation in terms of frequency of mealsconsumed but not in terms of dietary diversity,significantly impacting on a household's nutritionalsecurity. Thus, despite spending a majority of theirincome on food (Table 7), these households do notconsume a well balanced diet. Notably, less than onepercent of IGVGD or FSVGD households have ahigh level of dietary diversity. In rural areas ofBangladesh, many households still consider a fullplate of rice a full meal. There could be a couple ofreasons behind this. Firstly, they cannot afford morethan this and secondly, even if they could, they arenot aware of the importance of dietary diversity. Inmany cases, even when the awareness exists,households are simply not able to assimilate thisknowledge into action. Perhaps it highlights the needto strengthen the existing VGD nutrition awarenesstraining on the importance of food diversity and alsoto ensure that households adopt and adhere to thispractice as far as possible.During the process of economic transformation, theproportion of expenditure spent on staple foodgradually reduces. After a threshold level of income,households can afford a diversified diet and thepercentage of income spent on staple food startsdeclining. Though one is looking at a very lowincome range here, this trend is reflected in table 8.Cereal expenditure as a proportion of total foodexpenditure is seen to decline with increasing foodexpenditure. As participants spend more on food theproportion of expenditure spent on cereals andvegetables and tubers decreases and the proportion ofexpenditure spent on protein-rich animal foodsincreases. Table 8 shows the percentage ofexpenditure per food <strong>group</strong> made by VGDbeneficiaries in the mid and end-cycles.1 This index is also known as Simpson index. See G.P. Patil and C. Taillie. 1982. Diversity as a concept and itsmeasurement, Journal of the American Statistical Association 77, 548-561.9
Table 8: Proportion of food expenditure on the selected food <strong>group</strong>s by food expenditure category% of food exp ofIGVGD beneficiaries onCerealFruit/vegAnimalOilBaselineMid-cycleEnd-cycleBaselineMid-cycleEnd-cycleBaselineMid-cycleEnd-cycleBaselineMid-cycleEnd-cycleFood expenditure <strong>group</strong>Low(< 2500)53.549.454.710.716.013.511.713.711.64.23.44.8IGVGDMedium(2500-3500)47.047.051.914.817.712.718.417.215.43.13.04.3High(>3500)43.144.845.412.517.113.618.419.019.23.13.04.7FSVGDFood expenditure <strong>group</strong>Low(< 2500)53.551.953.810.714.414.411.714.613.04.23.03.8Medium(2500-3500)47.046.653.514.815.213.018.419.915.93.12.63.4High(>3500)43.141.242.812.514.915.718.424.521.83.12.33.810
Enhanced household livelihoodChapter 4 security of the extreme poorThe poor do not have adequate purchasing power tosecure their access to food. The chronic foodinsecurity of VGD beneficiaries comes from theiroverall household livelihood insecurity in terms ofcapabilities, assets (including both material and socialresources) and means of making a living. VGDactivity contributes significantly to the acquisition ofproductive assets, enhancement of household incomeand an increase in households' ability to meet foodand non-food livelihood priorities.Expenditure pattern of households: Acomparison of the expenditure pattern of participantsbetween the baseline and end-cycle situation showsthat monthly per capita food and non-foodexpenditure has increased substantially. Usinghousehold expenditure as an indicator of proxy forhousehold income, the survey results show that theaverage monthly expenditure of IGVGD householdsis about 8 percent higher than that of FSVGDhouseholds. Both IGVGD households and FSVGDhouseholds spend 68 percent of their expenditure onfood, particularly cereals (mainly rice).Approximately, 10 percent of food expenditure isspent on vegetables and fruits and 15 percent of foodexpenditure is spent on protein-rich items such asmeat, eggs and fish. The increase in the price of thesehas surpassed the increase in poor household'spurchasing power resulting in the low intake in bothIGVGD and FSVGD households. The scenario seemsmuch the same for both <strong>group</strong>s of households. Theaverage percentage of non-food expenditure to totalexpenditure is about 30 percent for both <strong>group</strong>s.Almost all VGD households still have an income ofless than US$ 1 per capita per day. The changes in percapita per day income for both the <strong>group</strong>s are onlyvisible if the internationally defined poverty line islowered to US$ 0.50 per person per day. The VGDhouseholds with per capita income of less than US$0.50 per day reduced from 97 percent to 67 percentamong IGVGD households and 75 percent amongFSVGD households.The proportion of householdsearning more than US$ 0.50 per dayincreased by 30 percentage pointsamong IGVGD households and 22percentage points among FSVGDhouseholds.Table 9: Expenditure pattern of householdsEnd-cycleMid-cycleExpenditure categoryIGVGD FSVGD IGVGD FSVGD BaselinePer capita monthly food expenditure (Taka) 620* 586* 565 589 300Per capita monthly non-food expenditure(Taka) 330* 292* 271 240 167Per capita total monthly expenditure (Taka) 950* 878* 835 829 466Average monthly food exp of households(Taka) 2609* 2364* 2355 2540 1310Average non-food exp of households (Taka) 1357* 1167* 1105 1031 728Average monthly total exp of households(Taka) 3966* 3531* 3460 3571 2038Percentage of cereals to total expenditure 52.2 52.5 48.2 48.8 53Percentage of animal food to totalexpenditure 14.1 14.7 15.2 17.6 12.1Percentage of vegetables and fruits to totalexpenditure 13.3 14.2 16.6 14.7 10.9Percentage of food exp to total expenditure 68.3 68.2 69.8 71.6 68.7Percentage of non-food exp to totalexpenditure 31.7 31.8 30.2 28.4 31Proportion of households whose income isless than USD1/capita/day 96.8 98.6 98 98.8 99.1Proportion of households whose income isless than USD 0.5/capita/day 67 75.4 81.2 79.2 96.5* Statistically significant at 1 percent level11
The proportion of expenditure on cerealsdecreased from the baseline survey butincreased slightly between the mid-cycleand end-cycle. The proportion ofexpenditure spent on animal foods as well asvegetables and fruits also decreased. Thepercentage of food expenditure incomparison to non-food expenditure alsodecreased between the end-cycle and thebaseline.Chart 1 shows the proportion of householdsspending more than 70 percent of their totalexpenditure on food. Although theproportion households spending more than70 percent of their total expenditure on fooddecreased since the baseline situation, thedecline is very minimal. However, forFSVGD households, the decline between themid-cycle and the baseline wascomplemented by a further decline, althoughmarginal, between the mid-cycle and theend-cycle. Moreover, for IGVGDhouseholds some of the improvements madebetween the baseline and mid-cycle fell aftertheir graduation from the programme.% of householdsChart 1: Proportion of households spending morethan 70% of total expenditure on food605040302010050.7IGVGD52.8 52.3F S VGDProgramme51.6 54mid-cycle end-cycle ba s e lineIt appears that for IGVGD households, the withdrawal of food rations atthe end of the programme impacts on their food consumption routine andhouseholds decrease expenditure in other areas to accommodate theadditional food expenses.FSVGD households seem less affected when their food rations stop. It ispossible that due to their monthly cash entitlements FSVGD householdsare able to cope better with change when the food aid stops. Secondly,when their food rations stop at the end of the programme cycle, their cashflow (which they get for a few months together) still continues.Changes in the net-worth of beneficiary households:Net worth is defined as the value of assets and savings minus loans outstanding. Table 10 illustrates significant changesin the net worth of both FSVGD and IGVGD households between the mid-cycle and the end-cycle. The net worth ofIGVGD beneficiary households increased by a remarkable 57 percent between the mid and end-cycle. For FSVGDhouseholds, the increase was lower at 26 percent. This increase was brought about mainly by an increase in productivenon-land assets as well as an appreciation in the value of land.Table 10: Net-worth of householdsEnd CycleMid CycleBefore After Before AfterIGVGD FSVGD IGVGD FSVGD IGVGD FSVGD IGVGD FSVGDProductive non-land assets 3659 3989 8673** 9436** 2693 4749 5508 7465Land asset 33523 22690 58225** 35153** 25481 16795 25845 18476Non-productive assets 961 557 1638* 837* 1033 764 1092 825Financial assets (savings etc) 427 545 1769** 1551** 297 366 1813 1579Loans given out 158 174 379* 572* 19 132 603 463Stock 0 31 65* 94* 31 198 227 285Investment 216 101 1538* 533* 122 110 291 302Total assets 38944 28088 72288** 48177** 29675 23115 35378 29396Liabilities (loans taken/borrowings) 418 0 4641** 327** 553 504 2938 1919Net worth (total asset-liabilities) 38526 28088 67647** 47850** 29122 22611 32440 2747712
It can be seen from Table 11 that the proportion ofhouseholds in the highest net-worth category hasincreased. For IGVGD households, the proportion in thelowest category of net-worth below Taka 1000 has goneup while for FSVGD households the proportion in thenet-worth category between Taka 1000-3000 hasincreased. Thus the number of people in the lowestcategories has increased as has the number of people inthe highest category, while the number of people in themiddle net-worth category has declined. Thus, theincrease in net-worth has not been equitably distributed asillustrated in Table 11.Table 11: Net-worth of households by net-worth categoryNet worthcategory (Taka)End CycleMid CycleBefore After Before AfterIGVGD FSVGD IGVGD FSVGD IGVGD FSVGD IGVGD FSVGDUp to 1000 15.7 13.6 8.2 4.9 5.8 12.7 3.5 6.61000-3000 6.1 3.8 3.5 7 3.8 6.1 3.8 6.43000-10000 16.6 19.4 9.9 10.1 18.8 16.8 13.9 15.610000-20000 16.6 21.4 13.1 15.4 20.9 22.8 22.9 20.220000-30000 12.2 13.9 9.3 15.4 14.5 12.7 15.4 16.530000-50000 12.8 15.4 17.8 17.7 17.7 17.1 20.3 17.350000 + 19.8 12.5 38.2 29.6 18.6 11.8 20.3 17.3Average 38526 28088 67647 47850 29122 22611 32440 27477* Statistically significant at 5 percent level, ** statistically significant at 1 percent level. Results from paired t-testChanges in landholding status:Drastic changes in land holdings cannot be expected in aspan of two years. Nevertheless there have beenimprovements over the baseline situation both in terms ofthe percent of households owning no or less than 15decimals of land and the mean area of total land owned byparticipants. The mean area of participant's homesteadsalso increased from the baseline and end line survey. Acomparison with the end-cycle and mid-cycle landholding status does not always reveal an improvement butas has been mentioned above the time period underconsideration is too small for any meaningful changes inrelation to land holding status (see Chart 2).Chart 2: Changes in landholding status* Statistically significant at 1 percent level for end cycleIGVGD FSVGDIGVGD FSVGDIGVGD FSVGD13
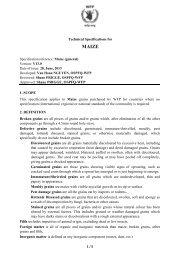
Skill <strong>development</strong> of beneficiarywomen: participation in IGAs:VGD activity includes income generatingskills <strong>development</strong> training for the ultrapoorwomen to facilitate their increasedparticipation in IGAs. Table 12 shows thenumber of women involved in an IGAdoubled between the baseline and outcomesurvey. Most women have received somekind of IGA training. The most populartype of training received was poultry andlivestock rearing, followed by homesteadgardening. Other types of training includedpetty trade, fish culture and handicrafts. Allbeneficiaries in FSVGD and 98 percent inIGVGD have used or are using theirtraining to either generate income or havestarted an IGA which is expected togenerate income in the near future. In theFSVGD programme, women get a cashgrant of Taka 150 every month in additionto 15 kilograms of fortified wheat flour(atta). These households can use theaccumulated grant to invest in an IGAwithout the hassle of paying back interest.In the IGVGD programme, beneficiariesreceive either 30 kilograms of rice or 25kilograms of fortified atta but no cash.They are given access to credit through anin-built credit programme, which has topaid back in instalments.Table 12: Skill <strong>development</strong> of beneficiary womenInvolvement in IGA% of householdsIGVGD FSVGD Baseline1. Received any IGA training (%) 89.3 99.1 n/a2. Type of IGA training:a) Poultry rearing 75 63.2 67.6b) Livestock rearing 74.7 62 34.3c) Homestead gardening 16.9 11.1 0d) Petty trade 7.8 7.3 5.6e) Fish culture 0.3 2.3 0f) Handicrafts 1 18.1 9.3g) Others 3.2 3.8 3.73. Percentage of women applying acquired skillsa) Used training for incomegeneration/expected income generation98.1 100 n/ab) women currently involved in IGA 60.9 75.9 31.2c) women who have taken loan frompartner NGO to invest in IGA38 4.1 n/aAs of June-August 2007, only 61 percent of the IGVGD beneficiarieswere engaged in an IGA while 76 percent of FSVGD beneficiaries wereengaged in an IGA. About 38 percent of the IGVGD women have takenout a loan from partner NGOs to start an IGA, while only four percentof the FSVGD beneficiaries have done so. Thus, the cash grant given toFSVGD women has a considerable impact on their decision and abilityto start an IGA. Chart 3 depicts the increase in the involvement ofbeneficiary women in IGAs after enrolling in the VGD programme.Chart 3: Involvementin IGA: end-cycleand baseline% of households10080604020031.20IGVGD60.90Base line31.20FSVGDEnd cycle75.9014
Farida Akter Meem, 25, lives with her four-member family in Hatinanda village, Kamarga union, TanoreUpazila in Rajshahi district. She lives with her father who suffers from asthma, her school age brother, andher mother. In the past her father ran a tea stall, however, the family used all the earnings from the stall tomarry off Meem's two younger sisters. Meem was unable to find a husband of her own because she sufferedfrom heart problems. She was also too unwell to help her ailing father run the small shop. As a result, theshop remained closed most of the time. In 2001, with a generous donation from some prominent socialworkers she underwent successful open heart surgery at the National Heart Foundation in Dhaka.Meem was incorporated into the 2005-06 FSVGD cycle due to her susceptible health and poor economicstatus. She hoped that the monthly wheat ration of 15 kilograms would ease her family's food demands andthe monthly cash transfer of Taka 150 (which they would receive for 3-4 months at a time) would be used forher brother's education.At present, Meem earns about Taka 7500 per month - enough to get her father the medical treatment heneeds, fund her brother's education and meet other household expenses. Her main desire now is to see herown business "Neel Aachal" expand and flourish.Determined to extricate herself and her family from the clutches of poverty, she decided to attend the IGAskills training provided to her as part of the FSVGD intervention. At the training, she learnt basic tailoring andhandicrafts. With her newly acquired knowledge as capital she began to make things at home and sell themfor a small profit to shops in Rajshahi. Meanwhile a local NGO "Aasroy" (Bangla for shelter) working inMeem's village noticed her work and enthusiasm. "Aasroy", invited her to take further training consisting of a3-month long training on making handicrafts and hand painting on fabric, along with other poor <strong>vulnerable</strong>women.On completion of the training Meem took a micro credit loan of Taka 4000 from "Aasroy". She used it to buysome fabric, thread, dyes and a brush and began working at home. She also began to train others in theskills that she had learned for a fee of Taka 50 per person. She now has four <strong>group</strong>s of women who come toher regularly for training, giving her Taka 3000 per month. Apart from this, Meem and four other women makesarees, other garments and handicrafts such as doormats, cushion covers and bed covers, which is soldthrough Meem's own outlet called "Neel Aachal".15
Zayeda, 35 years old, lives with her three daughters and a sick husband in Gurhail village under MirzapurUpazila of Tangail district. They have no assets, no land except a small homestead with a thatched house.Her husband has been sick for a long time and can rarely work. When he can work he works as a seasonalboatman. Zayeda worked as housemaid and somehow managed a meager income. Survival was difficult andvulnerability was extreme.Zayeda was enrolled in the Vulnerable Group Development (VGD) programme in the 2003-2004 VGD cycle.During this period she received <strong>WFP</strong> food ration and training on income generating skills in poultry raising;and social awareness training from BRAC. She has learnt a lot thanks to the training programme, not only onincome earning but also on life skills. After the completion of the training she took loan from BRAC to start herown income generating activity.She prepared one tin-shade for chick rearing and bought day-old chicks for Tk. 350. She raised the chicks for60 days and sold them in the local market. Zayeda noticed that there was great demand for fresh chicken inthe local market and her small business started to make a profit. Her net annual profit stood at TK. 40,000.Gradually she expanded her business and invested more capital. She also diversified her earning sources byinvesting in vegetable cultivation and cow rearing. In the meantime, Zayeda arranged treatment for herhusband. Now he can assist his wife in running the business. Zayeda has sent her daughters to school. Sheis the proud owner of a tin shade house and has also bought some agricultural land.Zayeda feels that VGD programme has been a blessing, and she foresees a bright future for the family.Moreover, with her small business and the VGD food ration not only her livelihood situation has improved butalso her confidence level. Self-confident Zayeda feels VGD programme has changed her life.She confidently states that when she is old, no one will take care of her, not even her daughters. It will be themoney that she has acquired through her VGD participation that will take care of her.16
Savings pattern of householdsThe savings characteristics of beneficiaries(Table 13) reveal that more than 90 percent ofFSVGD households have savings and thebulk of these households started savingbefore joining the programme. At presentmost FSVGD households keep their savingsin the programme fund. In comparison themajority of IGVGD households who havesavings (about 60 percent) keep their savingswith NGOs or international organisations (50percent) while only 33 percent of householdsmaintain savings with the programme fund.Like the FSVGD households, most IGVGDhouseholds started saving before joining theprogramme. It is interesting to note that bothprogramme beneficiary <strong>group</strong>s preferinstitutional or formal savings and very fewsave at home or with friends and relatives.The difference in the savings pattern ofIGVGD and FSVGD households is thatamong the latter, 55 percent of those whosaved belonged to the smallest savingscategory i.e. under Taka 1000 (Table 14).Very few belonged to the higher savingscategories of Taka 3000 and above (7.2percent households). In the case of IGVGDbeneficiaries, nearly 40 percent had nosavings at all while about 15 percent hadsavings of Taka 3000 and above. Thus thereappears to be more "inequality" amongIGVGD households. The average savings ofthe IGVGD households was about 20 percenthigher than the average FSVGD beneficiarysavings.Table 13: Savings of beneficiary householdsAspect of savings IGVGD FSVGDWhether have any savings:Yes 62.3 92.8No 37.7 7.2When saved:Before joining programme 54.5 89after joining programme 9 2.9partially before and partially after 4.1 7Place of saving:a) Programme fund 32.7 58.4b) Home 7.5 5.5c) Bank 4.4 10.3d) NGO/IO 49.1 20.1e) Post Office/government organization 2.8 1.9f) Other Social Organization 1.9 3.6g) Relatives/friends 0.6 0.2h) Elsewhere 0.9 0Table 14: Quantum of savings by beneficiary householdsAmount of savings (Tk)Percentage ofIGVGD FSVGDNo savings 37.7 7.2Up to 1000 25.2 54.81000-2000 11.9 23.82000-3000 9.6 73000-4000 5.2 1.44000-5000 2.9 25000 plus 7.2 3.8Average savings (Tk) 1,533 1,255Crises coping strategies of households: The poor are <strong>vulnerable</strong> to shocks (natural disasters, crop failure)that cause transitory food insecurity. Improved livelihoods, in terms of expanded asset bases or household savings,reduce the vulnerability of households to short term disruptions in income flows, because part of a household's asset basecan be sold or savings can be used in times of adversity.In order to assess whether the programme has made any impact on the vulnerability of the participants, the surveyattempted to assess whether a household's ability to deal with a crisis was enhanced due to participation in theprogramme. In a time of crisis it is common for extreme poor households to sell household assets to meet expenses.These assets are often sold at below market value and their loss compromises a household's ability to rebuild after acrisis occurs. Crises or any kind of shocks to a household are either inevitable (such as the marriage of a familymember) or cannot be anticipated beforehand (such as accident or illnesses). Chart 4 shows the proportion of householdsmaking distress sales or mortgaging their assets either before or after joining the IGVGD and FSVGD respectively. Theproportion of IGVGD households making distress sales decreased in comparison to FSVGD. The vulnerability ofFSVGD beneficiaries also decreased after joining the programme but to a lesser extent.Chart 4: Proportion of households making distresssales/mortgages before and after joiningprogramme% of Samplehouseholds20151051510970IGVGDbeforeFSVGDafter17
Table 15 shows the proportion of productive assetsbeneficiary households sold in times of distress.Households making distress sales were divided into two<strong>group</strong>s i.e. households selling 'up to 25 percent of assets'and 'more than 25 percent of assets' in order to judge thevulnerability of the households to shocks. In bothIGVGD and FSVGD households, distress sales in thefirst category (up to 25 percent of productive non-landassets) increased while that in the second category (morethan 25 percent of productive non-land assets)decreased. Thus, although households are still makingdistress sales after participation in the programme thepercentage of productive assets sold has decreased. Thisimplies that their level of vulnerability has decreased.Table 15: Proportion of households selling at least 25% of their productive assets in distress (non-land)Proportion of productiveassets sold in distressbeforeprogrammeafter joiningprogrammebeforeprogrammeafter joiningprogrammeUp to 25% 2.9* 3.35* 0.6* 3.35*More than 25% 10.7 5.5 7.5 3.05* A paired t-test revealed significance at 1 percent levelIGVGDFSVGDTable 16 shows the different types of crisis faced by the householdsfor which distress sales or mortgages were made. The questionnairewas designed to collect information on two specific time periods: '1year before joining the programme' and 'after joining theprogramme'. Since the survey was conducted six months after thecycle ended, the time span for 'after' was two and a half years. Giventhe longer time frame of the second time period, distress sales ofpoor households can be logically expected to increase. Therefore tomake the 'before programme' and 'after programme' comparable, the'after' figures for the time period were adjusted. In all cases asubstantial decline in occurrence of distress sales or mortgagesamong households is seen for both <strong>group</strong>s. The decline is morepronounced among FSVGD households demonstrating substantiallyreduced vulnerability of the extreme poor households participating inthe programme.Table 16: Type of crises faced by households for which distress sales/mortgages were madeIGVGDFSVGDCrises typeBeforeprogrammeprogramme(projectAfterprogramme% change inoccurrenceBeforeprogrammeprogramme(projectAfterprogramme% change inoccurrence(1 year) cycle+6 (1 year) (1 year) (1 year) cycle+6 (1 year) (1 year)Treatment 15 20 10 -33.3 28 15 8 -71.4Housing/ house repairing 2 1 1 -50 4 4 2 -50Marriage 1 2 1 0 8 11 6 -25Loan repayment 2 2 1 -50 15 5 3 -80Buy food 22 33 17 -22.7 27 16 8 -70.4Buy clothes 9 16 8 -11.1 4 5 3 -25Meet education expenses 7 13 7 0 4 3 2 -50Others 2 2 1 -50 9 5 3 -66.718
Coping strategies were categorised intotwo <strong>group</strong>s: strategies that do not have anegative impact (positive strategies) andstrategies that have a negative impact(negative strategies). The former includedstrategies such as borrowing from friendsand relatives, selling household stocksand using savings while the latterincluded selling land, selling otherproductive assets and borrowing from amoney lender. Chart 5 shows that none ofthe IGVGD households used any positivestrategies before or after joining theprogramme. However, the employment ofnegative strategies declined after joiningthe programme. For the FSVGDhouseholds, the employment of positivestrategies increased after joining theprogramme while use of negativestrategies declined substantially.% of house holds181614121086420Chart 5: Crises coping strategies of households0 0Knowledge of flood management strategiesFloods are a regular occurrence in Bangladesh. Even while the survey was beingconducted, the country was experiencing massive floods. Given the geographiclocation of Bangladesh, programmes must operate in the context of frequentnatural disasters. Beneficiaries were questioned on their knowledge of floodmanagement strategies. Nine precautionary flood-related activities weredelineated in the questionnaire including: keeping medicines handy for floodrelateddiseases, constructing elevated platforms on homesteads, keeping booksand valuables on raised platforms, stocking up rice, pulses, puffed rice, keroseneoil, candles, match boxes, etc, raising homestead level, storing drinking waterand other dry foods, keeping poultry and cattle in safe places and keeping'chulha' (make-shift oven for cooking) and fuel in stock. Table 17 illustratesVGD participant's knowledge of flood management techniques.11.7 10.616.4positive negative positive negativeIGVGDFSVGD019.2beforeafterTable 17: Knowledge of flood management techniquesIGVGD FSVGDIndividual level strategiesStock up medicines for flood related diseases 1.7 0.9Construct raised bamboo stages near house 22.3 20.6Keep books, valuables, etc on raised ground 24.9 6.1Stock up rice, pulses, puffed rice, kerosene, candle, match etc. 40.9 28.7Raise homestead by piling up earth 45.2 39.1Collect dry foods and drinking water 19.4 22Keep poultry and livestock in safe places 34.8 58Make arrangements for alternate stove along with fuel 16.5 11.3Others 2.6 0.6Total 208.4 187.2Community level strategiesGive midwifery training to select women before flood 1.2Make embankments 16.8 17.1Encourage temporary migration before flood 10.4 42.9Keep boat ready for use 9 4.9Warn people using loudspeakers 4.9 18.8Raise roads, if possible 32.5 15.9Others 44.3 30.7Total 119.1 130.419Percentage of households
Indebtedness of householdsSince the IGVGD programme has a built-in credit facilitywherein, on completion of IGA training, households canborrow for investment, the indebtedness of IGVGDhouseholds is higher than the indebtedness of FSVGDhouseholds (Table 18). This is further validated by thefact that nearly 91 percent of IGVGD households tookloans after joining the programme in contrast to 87percent of FSVGD households. The majority of loanstaken out by both beneficiary <strong>group</strong>s were with NGOs.Interestingly quite a good number of IGVGD householdstook loans from informal money lenders (Mahajans) whocharge exorbitant rates. It should be noted that anincreased loan burden does not necessarily indicate adeteriorating economic condition of a household. WhenNGOs or formal financial institutions fail to provideenough loans for productive investment or when aprospective investor does not have access to such sources,she needs to seek a loan from non-institutional sources.This is not harmful if one can manage to borrow at areasonable interest rate.Table 18: Indebtedness of householdsIndebtedness attributeIGVGD(number)FSVGD(number)% of indebted households 52.2 (180) 34.5 (119)% of households who borrowed after joining programme 91.1(164) 87.4(104)% of households who borrowed before joining programme 11.7(21) 8.4(10)% of households who borrowed both before and after joining programme 5.6(7) 7.6(9)Sources of loan% of indebted households borrowing from formal sources 13.9(25) 10.9(13)% of indebted households borrowing from NGO sources 81.7(147) 84.0(100)% of indebted households borrowing from informal money lenders (mahajan ) 21.7(39) 7.6(9)% of indebted households borrowing from relatives and friends 29.4(53) 23.5(28)% of indebted households borrowing from other sources (shop, samity , employer, etc.) 8.3(15) 2.5(3)FSVGD households achieved higher savings and took out fewer loans than IGVGD households (Table 19). Twice theproportion of IGVGD households borrowed for business purposes. Disturbingly, in both <strong>group</strong>s, about 13 percent ofbeneficiaries took out loans to cover their food needs. It appears that although households may have improved theirmaterial well-being, they are still food insecure. In addition to formal borrowings and NGO loans, approximately 29percent of these households took loans from friends and relatives (Table 18).Table 19: Reasons for borrowingReasons IGVGD FSVGDNon-food household consumption exp 0.4 2.6Food needs 13.3 13.1housing 7.9 18.3business purposes 31.5 15.7To purchase productive asset 5.7 11.1Agriculture 6.5 9.8education/training 2.2 0.7medical/emergency purposes 13.6 12.4any future unforeseen contingencies 1.1 0To get loan 0 0for marriage/dowry 5.7 10.5To repay Loan 9 4.6Court case 2.5 0others 0.7 1.320
VGD HELPS RUPALI RECOVER AFTER FLOODRupali is 25 years old and has two young children. Her husbandis a day labourer who earns about 50 taka for the days when hecan find work. Since the flood though, work is impossible to find.There are no employment opportunities in the local area as allagricultural land is still submerged beneath flood water. Rupali'shusband will shortly migrate to the nearest city (Bogra) and lookfor work. Rupali says that he is currently "wandering from here tothere - not doing much".Despite her husband's current unemployment status, Rupali andher family are better-off than many flood affected families. Shecontributes this to her recent participation in the VGD program.While she was a VGD beneficiary, Rupali received a monthlyration of rice. With one meal a day being provided for her and herfamily, she was able to save 1,500 taka over two years. Rupaliused this money to purchase a goat, which soon gave birth tothree kids. She also used a 10,000 taka loan provided by a localNGO to purchase a calf. By raising and selling goats, Rupali managed to earn and save nearly 4,000 taka. This moneywas the difference between her family starving and not starving during the recent floods.When the flood water reached her area, Rupali moved her children, bed, livestock and food (10kg rice and 3kg ofpulse) to the nearby embankment. She stayed there for about 12 days. During this time both her and her children, andall of her goats, became sick from the dirty flood water. Unfortunately, four of her goats died. Rupali used a portion ofher savings to treat her family's illness - she did not need to take a loan from a rich family as many of her neighbourswere forced to do. Rupali used the remaining 2,500 taka of her savings to purchase paddy. Given the current demandfor paddy as farmers start to replant their rice crops, she recently sold this for a profit and purchased pulse, oil, salt, riceand vegetables to feed her family and straw for her cow. At no time during the flood did Rupali feel she may have tosell her cow.Rupali's future plan is, once the flood water fully recedes from her area, to take another loan and re-start her goatrearing business."I am confident that the local NGO will give me another loan. I have proved myself capable of paying my current loan.My confidence is because of my involvement in the VGD program. The training provided and the NGO loan willhelp me to soon recover from the flood."21
PercentChapter 5Healthy practices in the daily lifeof the extreme poorHealthy practices and hygiene:There appears to have been improvement in health andhygiene practices of VGD households in relation to foodpreparation, cleanliness, sanitation and garbage disposal.To establish nutrition related practices, questions wereasked about which stage of the cooking process thevegetables were usually washed and the length of timethey were cooked. Approximately 22 percent of IGVGDhouseholds and 35 percent of FSVGD households washtheir vegetables before cutting. This is considered bestpractice as it helps retain the maximum amount ofnutrients in the vegetables. Overcooking vegetables alsodiminishes the nutritional value of vegetables. A smallpercentage of the households (10% IGVGD and 22%FSVGD) cooked the vegetables till just done, these figuresreveal an improvement over the baseline scenario whereonly 5 percent followed this practice.Almost all beneficiaries wash their hands after using thetoilet. The hand washing behaviour of beneficiaries beforecooking has also improved substantially compared to thebaseline situation. Similarly, usage of soap for handwashing is quite high among the phased-out programmeparticipants. However, improvement in terms of coveringwater and food containers was not satisfactory. The situationis similar in the case of wearing footwear to toilet. Thesefindings call for more intensive awareness raisinginitiatives.In comparison to the baseline survey the percentage ofhouseholds using open places to dispose of their garbagehas reduced. The percentage of households practicingenvironmentally unfriendly garbage disposal has increased.Hygienic disposal of garbage is more prevalent amongIGVGD households in comparison to FSVGD households.Chart 6: Healthy practices and hygiene10080604020094.292.88273.947.44942.235.43122.32219.110.74.6988975.472.841.645.8Base-lineIGVGDFSVGD64.14856.876.230.144.661.48.72.3292.274.8 75.126.78.13.2Wash vegetables before cuttingCook vegetable till just done (notovercook)Always wash before cookingAlways wash before eating/feedingchildrenAlways wash after using toiletUsage of soap for hand washingDrinking water coveredFood containers coveredAll household members wear sandals totoiletHygienic disposal (collection system)Unhygienic disposal (open place)Environmentally unfriendly disposal(burn/bury)22212
About 26 percent of IGVGD households use a sanitary toiletwhile only eight percent of FSVGD households use a sanitarylatrine (Table 21). Though these perecentages are very low, theydo reflect a substantive improvement over the baseline situationwhen only two percent of the households had access to a sanitarylatrine. Similarly, the proportion of households who had no toiletat all and simply used open fields reduced by 19 percent amongIGVGD and 20 percent among for FSVGD households. Almostall households get their drinking water from tube wells (Table20).A water and sanitation index was formulated to judge households'overall degree of cleanliness. The details on the formulation ofthe index are shown in the Appendix. Table 21 clearly illustratesthat hygiene among VGD households in relation to water andsanitation is still very poor despite improvement in comparison tothe baseline situation. Less than five percent of IGVGD andFSVGD households follow good hygiene practices. The majorityof IGVGD households fall into the lowest category of the waterand sanitation index, while the majority of FSVGD householdsfall into the medium category of the water and sanitation index.Table 20: Water and sanitation of VGD householdsWater and sanitation IGVGD FSVGD BaselineSource of drinking water (% of households):Tube well 98.3 99.7 98.8Tap water 1.2 0 0Open well 0 0.3 0.6River/pond/stream 0.6 0.6Others 0 0 0Type of latrine (% of households):Sanitary 26.4 7.5 2Non-water sealed pit 49.6 51.9 26Kutchha latrine 12.2 29 39.6Open field 11.6 11 30.9Others 0.3 0.6 1.4Table 21: Water and sanitation index of beneficiary householdsProportion of householdsIndex rangeFSVGDIGVGDLow (< 5) 53 33Medium (5-8 42 62.9High (>8) 4.9 4.1Baseline85.814.20AIDS awareness:The survey showed that VGD women had little awarenessof AIDS. Over, 70 percent of the women surveyed areunaware of AIDS. Among those who responded that theywere aware of AIDS, more than 75 percent did not knowhow the disease spreads (Table 22). Only a little above tenpercent of the AIDS aware VGD women knew that thedisease spreads through unprotected sex. About 7-9 percentfelt that AIDS spreads through accepting blood from anAIDS affected person. Approximately, 6-7 percent of thebeneficiaries were aware that AIDS can spread through theuse of an infected syringe.Table 22: AIDS awareness issuesIGVGD FSVGDKnowledge of deadly AIDSTerminating disease 13.3 21.4Infectious disease 3.2 2.9Disease caused by infidelity 9.6 2.9Do not know 73.9 72.8Do you know how AIDS spreadUnprotected sex 13.3 14.2Accepting blood from an AIDS patient 9 7Using a syringe used by an AIDS patient 7.5 6.4If an AIDS patient get pregnant 0.3 0Do not know 78.8 77.423
Mother and child health:Table 23 shows beneficiaries' level of knowledge regardingmother and childcare. The table also looks at the practicesadopted by mothers in order to establish if there is a gapbetween knowledge and practice. It must be noted thatfindings related to the practice of mother and childcare wascollected from mothers with children under 18 months old,while information on the level of knowledge on goodpractice was collected from all beneficiary respondents. Inorder to make the knowledge-practice gap comparable,Table 23 has been shown based on the total number ofmothers with children upto 18 months of age. Chart 7,however, gives the knowledge about mother-child care ofall beneficiaries.Table 23: Mother and childcare: knowledge-practice gapMother-child care issuesIGVGDFSVGDknowledge Practice knowledge PracticeAware of birth registration 50 40 80.6 64.5Aware of qualified prenatal care(%) 62 28 93.5 77.4Av. no. of prenatal consultations (no. of times) 2.6 3.7Aware of tetenus innoculation during pregnancy (%) 98 80 90.3 77.4Aware of benefits of colostrum (%) 98 98 100 100Aware duration of exclusive breast feeding (6 months) % 44 6 48.6 16.1Child immunization:Polio 87.8 84.8 93.5 76.7Measles 75.5 54.3 61.3 56.724
It was found that there is a large gap between knowledgeand practice in relation to mother and childcare. However,the benefit of colostrums/breast feeding appears to be wellknown and well practiced. Knowledge among beneficiariesabout the importance of the tetanus inoculation duringpregnancy was rather high but practice was relatively low.Awareness of the importance of the polio vaccine forchildren was high but very few women put this knowledgeinto practice. The campaign for polio eradication has to bestrengthened in the ultra poor regions of North Bengal. Theknowledge-practice gap was the highest in relation to theduration of exclusive breast-feeding. Less than 50 percentof the women were aware of the recommended practice of6 months of exclusive breast-feeding and among thewomen who were aware very few put the knowledge intopractice.Chart 7: Mother and childcare: knowledgePercent1201008060402053.970.471.397.798 98 98.894.249.342.69188.4IGVGD92.582.868.552.5FSVGD65.652.52126.412.5 7.956.723.60Aware of birth registration (% ofhouseholds)Aware of qualified prenatal care(% of households)Aware of tetanus inoculationduring pregnancy (% ofhouseholds)Aware of benefits of colostrums(% of households)Aware of duration of exclusivebreast feeding (6 months) (%)Child immunization (% ofhouseholds)Aware of PolioAware of TetanusAware of measlesAware of diphtheriaAware of whooping coughAware of tuberculosisOnly 54 percent of IGVGD women were aware of birth registration, while 70 percent of FSVGD women were aware ofbirth registration. It must be noted that the importance of birth registration only begun to receive attention recently. There isnow an on-going nationwide campaign for birth registration. In this context it is quite commendable that a large number ofFSVGD women are aware of birth registration. Although most women knew of the importance of child immunisation, theirawareness of the different types of vaccination for children was low, especially for diphtheria, whooping cough andtuberculosis.25
BONARI MAKES A PROFIT 15,600 TAKA PER MONTHBonari is 42 years old. Her husband is a day labourer and cuts grass for other people's cattle. He is 70 years old andbecoming too old and not strong enough to continue this demanding, manual labour. As a result Bonari is responsible forbeing the main wage earner of the family.A few years ago Bonari was working in the local rice mill. She did this job on a daily basis. If there was no work for her ona particular day then she was not paid a wage. This happened many times. Her wage was not money but broken and leftover rice from the day's milling. Bonari took this rice home to feed her family. Mixed with salt and chilli, this was onlyenough for one or two meals a day. To make the family's poverty more complete, Bonari was forced to sell all her assets, aslittle as there was, to pay for her daughter's marriage and dowry. Life was hard.Fortunately, based on her hardship, Bonari became a participant of the <strong>WFP</strong>'s Vulnerable Group Development (VGD)program. She was provided training in both social awareness issues and income generating activities (IGA). As her IGA,Bonari selected small trade training. She had no land to raise cows or goats and her only experience was working in therice mill. She believed that, using this training, she could begin trading rice paddy and make an income from this. Duringthe VGD training, Bonari learnt how to determine the sale price of rice based on labour costs and other inputs, whichturned out to be a very important lesson.Once her training was complete, Bonari received a 4,000 taka loan from a local NGO. With 1,750 taka of this moneyshe invested in her business and bought 200kg of rice paddy from the local market. Over a period of twodays, she processed this paddy into rice at home. When the time came to dry the rice, since shedoes not have enough room at her house, she took this to the rice mill where she previouslyworked. For a charge of 50 taka, the mill also completed the process of milling thepaddy into consumable rice.Together with her son, Bonari sells her fine grade rice at the local market.Bonari sells 200kg of rice, in small amounts, for a total of 3,100 taka.Given that Bonari can complete this milling process three times aweek, this calculates to a 15,600 taka profit per month! Thisprofit varies slightly depending on the time of year andwhether paddy is being harvested, which impacts on itspurchase price. However, since Bonari can buy rice froma "paddy keeper" whenever she likes and continuemilling throughout the year, she earns a significantprofit every week.With her profit, Bonari has purchased a cow,invested in her business by installing a waterpump in her yard and improved her house.She looks back at her life a few years agoand cannot believe far she has improved.She sees her poverty as a blessing indisguise. Because she was poor she wasoffered a life changing opportunitythrough the VGD program. Never againdoes she have to worry about earningenough money to support her family.She has become a very successful,independent business woman in herown right.26
Chapter 6Social transformation of theextreme poorAwareness of women rights:Delivering of life skills awareness tarining on womenrights issues, has been effective to greatly enhance theknowledge level of VGD women. This section seeks toexamine the social transformation brought about by VGDprogramme in relation to different aspects of socialawareness. Table 24 lays out the responses received fromIGVGD and FSVGD women regarding their socialawareness. Most beneficiaries are aware that marriageshave to be registered. Several reasons were cited by thesewomen on why they think marriages have to beregistered. The highest number of respondents felt it wasrequired in case of marriage termination. Respondentsalso stated that marriage registration is required forsecuring the rights of women. Other responses includedthat marriage registration is required because not registering is a lawful offence and the alimony amount is officiallyindicated. Besides the satisfactory level of the women's awareness of marriage registration, they are also aware of thelocation of marriage registration but not aware of the marriage registration fee.Approximately 70 percent of beneficiaries in both programs were aware of the minimum age at marriage for girls butthey did not seem to know that a minimum age exists for boys as well. It is heartening to know that more than 95percent of the beneficiaries were aware of the hazards of early marriage and cited reasons such as hazardous to becomemother too early (66% IGVGD and 93% FSVGD), cannot come to terms with burden of additional responsibilities (34%and 19%), higher risk of death during childbirth (40% and 52%) and inability to take proper care of husband andchildren (27% and 13%). Among those who supported early marriage, most felt so because lower dowry is oftenrequired. A substantial proportion responded that early marriage reduces parental burden while others felt early marriagecould help prevent any scandal that might occur or any rumour that may float around involving a girl. Thus, showing thecontinued insecurity faced by girls in Bangladeshi society.Table 24: Social awareness among IGVGD and FSVGD beneficiariesSocial awareness issuesIGVGD FSVGDAware of marriage registration 88.4 90.1Know why marriages have to be registeredTo secure the rights of woman 28.9 23.8Lawful offence 16.1 7.1Alimony amount is indicated in registration 11.5 3.9Required in case of marriage termination 38 65.3Others 5.6 0Know where marriages have to be registeredKazi office 82.6 82.6Marriage registrar 13.1 14.5Do not know 3.3 2.9Others 1 0Know about the marriage registration fee 4.9 11Aware of minimum age for marriage for girls 67 73Aware of minimum age for marriage for boys 13.9 11.6Know about the hazards of early marriage for girls 96.2 95.9Support early marriageWhy?Reduces paternal family burden/expenses 38.5 28.6Require less dowry 61.5 42.9Avoid any untoward incident/scandal 30.8 28.6Avoid rumours 23.1 0Why not?Hazardous to become mother too early 66.3 93.1Cannot come to terms with burden of additional responsibilities 34 18.7Mother’s survival at risk during child delivery 40.1 52.3Cannot take proper care of husband and children 26.8 13.327
Table 25 looks at beneficiaries understanding of women'srights. Most women are aware that it is an offence to giveand receive a dowry and that if a man marries a secondtime, he has to seek permission from his first wife.Surprisingly, about 80 percent of the women in bothIGVGD and FSVGD believed that if their husband said'talaq' (divorce) three times it would lead to divorce. Themajority of the women surveyed were unaware of theirinheritance rights and were unaware that the law does notsay that the son must inherit all the property. Thus, in manyareas of social <strong>development</strong> women continue to beuninformed and there is a strong need for more rigorousawareness raising on such issues.Status of women participation in decisionmaking:Table 26 shows the status of women in the householdthrough their level of participation in decision making.Male and female-headed households have been separatedsince the level of empowerment is likely to be verydifferent for these two <strong>group</strong>s. Beneficiaries responded toa list of decision-making issues such as expenditurerelating to food, child's education, health and other nonfooditems as well as family planning, travel/visit etc.More beneficiaries of male-headed IGVGD householdsseem to have no say in the decision making process incomparison to women from FSVGD households. In allareas of decision-making listed in the table below, exceptfor family planning and voting, more than one-third of theTable 25: Awareness of women rightsWomen’s rights issue IGVGD FSVGDDowry is an offence 85.5 92.5Second marriage requirespermission from first wifeSaying 'talaq' thrice does notlead to divorceLaw does not say that son willinherit all property85.5 97.473 75.484.6 91.6women of male-headed IGVGD households had no say atall. In contrast, 10 percent of FSVGD women had no sayin decision making. It is interesting to note that in termsof family planning, the participation of women in thedecision making process in both programme <strong>group</strong>s washigh. The fact that FSVGD women participate more thantheir IGVGD counterparts in key areas of decisionmakingsuch as investing in IGAs, investing in householdassets, taking a loan, depositing savings, etc. is, perhaps, agood reflection of the impact of the FSVDG monthly cashentitlement. Since the cash is given directly to thebeneficiary (mostly 3-4 months accumulated amount at atime), they seem to be more empowered to makeimportant decisions relating to money matters.Table 26: Status of women participation in decision makingDecisions onIGVGDFSVGDMale-headed Female-headed Male-headed Female-headedSelf Joint No say Self Joint No say Self Joint No say Self Joint No sayFood purchase 33 30.2 36.8 69.3 22.1 8.6 9.5 77.5 13 79.3 9.8 10.9Children’s education 18.7 26.4 39 53.4 14.1 7.4 6.3 68 11.1 59.8 12 4.3Clothes purchase 16.5 33.5 50 68.1 19.6 12.3 5.5 80.2 14.2 77.2 12 10.9Health expenses 16.5 38.5 45.1 57.1 28.8 14.1 5.9 82.2 11.9 70.7 14.1 15.2Invest in IGA 11 26.9 61.5 58.9 21.5 18.4 10.7 67.2 11.5 66.3 14.1 12Marriage-children orother family member2.2 27.5 35.2 22.1 12.3 16.6 2 48.2 9.9 34.8 13 14.1Family planning 15.4 57.1 3.8 17.2 12.9 5.5 1.6 84.6 2.4 10.9 13 0Household assets 7.1 30.8 61 57.7 20.9 19.6 14.2 72.3 12.6 73.9 12 14.1Travel/visit 18.7 34.6 46.2 66.3 20.9 12.9 17.8 70.4 11.9 79.3 12 8.7Non-food spending 5.5 29.7 50.5 52.1 20.2 16 20.2 69.6 9.5 73.9 12 13Voting 58.8 16.5 24.2 71.8 16 9.2 60.9 30.4 6.7 90.2 5.4 3.3Taking a loan 6 25.3 63.7 42.9 22.1 19 2.8 44.7 5.9 28.3 14.1 6.5Depositing savings 9.3 28 59.3 47.9 20.9 18.4 11.5 71.1 11.1 70.7 13 10.9All responses 217 371.4 611.5 684.7 252.1 177.9 168.8 866.4 131.6 815.2 156.5 20028
The beneficiary women were asked whether they go out of their homesto places such as a friend's or relative's house, union council, market,hospital etc. on their own and the frequency of these trips. Based on theparticipant's responses, an index of mobility was created for beneficiarywomen (see Appendix for details). Chart 8 classifies the women interms of their degree of mobility. In conformity to the discourse ofempowerment, most FSVGD women seem to have a moderate to ahigh degree of mobility. Although the majority of IGVGD women havemoderate to high mobility, more than one-quarter also have lowmobility which corresponds with their lack of participation in decisionmaking.KNOWLEDGE OF WOMENRIGHTS HELPS SHAHIDAPROTECT HERSELF FROMVIOLENCEChart 8: Index of mobility of VGD women% of VGD Women907560453015027.23.5Low mobility( 3.5)<strong>WFP</strong>'s VGD programme has taught Shahida how to protectherself against violence. It has also given her the confidence toeffectively use Bangladesh family law the and legal system toprovide a better life for her and her daughters.One year ago Shahida's husband declared that he was taking asecond wife. This came as a complete surprise to Shahida as they had not discussed this before. He showed Shahida afalse marriage registration and informed her that his second wife would be joining the family within a few days.Shahida felt she had no choice other than letting this wedding take place. However, while negotiations for this secondmarriage were delayed, Shahida was provided with some very important information. While participating in VGDsocial awareness training, she discovered that her husband actually needed her permission to take a second wife.Shahida went straight home and refused to give her permission for this marriage.And that's when her husband started to physically torture Shahida. He pulled her hair, punched her in the face and hither with a piece of bamboo. This lasted several weeks and still Shahida refused to give her permission. She was certainthat once her husband had married a second time he would divorce her. Life for a divorced woman in Bangladesh,especially one with two small daughters, is very hard. Shahida felt that a second wife would threaten her and herchildren's security.Shahida discussed her situation with her neighbours. Unfortunately, her husband became aware of this. He threatened tokill her if she ever spoke out again. Shahida feared for her life. She knew that her husband's previous wife had diedunder suspicious circumstances and she was personally aware of his capacity for violence.Shahida sought refuge in her father's house. With the knowledge that the VGD programme had provided, that therewere laws to help a woman stop the violence against her, Shahida approached the NGO that had provided her training.As a first step, the NGO suggested trying to solve the issues with the help of a local committee. However, thesediscussions did not resolve anything, as her husband was very angry with Shahida for now living with her father.Shahida refused to give up. She knew a second wife would always threaten her future unless this issue was resolvednow. So Shahida sought help from a local lawyer. Again a meeting was held. But this time the lawyer threatenedShahida's husband with legal consequences. He was told his potential punishment was up to 14 years in jail for theviolence against Shahida and additional jail terms for fraud (producing fake documents) and not seeking the permissionof Shahida for any additional marriages. Shahida's husband quickly reconsidered the situation. He now realised thatShahida was fully informed of her rights under Bangladeshi law and she would never agree to a second marriage. Heagreed to stop the physical violence against her.Shahida knew she was "healthy, capable of work, and able to support my husband and children. There was no reasonfor my husband to need a second wife. I could not let my children's future be threatened. I am thankful for the VGDprogramme for giving me the information and courage I needed to stop this second marriage. Otherwise, I could easilyhave found myself divorced and living a desperate life."29
Chapter 7ConclusionsandRecommendationsThe primary objective of <strong>WFP</strong>'s VGD programme is to enhance the food consumption and nutritional well-being of ultrapoorpeople. By comparing the baseline survey with both the mid-cycle and the end-cycle surveys, improvement can be seenin poor households' access to food since their participation in VGD. Overall, beneficiaries' food consumption reached a peakduring their enrolment in the programme. Some of the improvements made, in terms of food security, by some householdsduring the mid-cycle stage declined (see Tables 4, 5 and 6) by the time the end cycle survey was conducted. This raises someimportant questions: who are the people who are not able to sustain the improvement in food security brought about by theVGD programme? And who are the people who are able to graduate out of poverty once they enter the VGD programme?Why does this difference exist?To answer the above question as best as possible from the information obtained from the survey, the beneficiaries were<strong>group</strong>ed into two, based on their level of food insecurity. These two <strong>group</strong>s were (a) households which consumed three fullmeals a day and (b) households which did not consume three full meals a day. Table 27 depicts some basic socio-economiccharacteristics of these two <strong>group</strong>s.Table 27: Socio-economic characteristics of IGVGD and FSVGD households based on level of food insecurityHousehold characteristicsIGVGDConsumed3 full mealsDid notconsume 3full mealsFSVGDDid notConsumedconsume 33 full mealsfull mealsHousehold size 4.37 4.52 4.24 4.41Per capita monthly total expenditure (taka) 1,024 859 967 744Per capita monthly total non-food expenditure (taka) 350 305 315 257Per capita monthly total food expenditure (taka) 675 553 652 487Mean savings of households (taka) 4507 1276 1476 921Loan taken from partner NGO 23 20.6 2.9 2.2Loan taken from other NGO 22.1 8.4 22.1 21.9Loan taken from any NGO 41 25.8 24.5 24.1Any institutional loan taken 44.2 32.9 28.4 25.5Non institutional loan taken 13 17.4 6.3 8Directly involved in IGA 65.8 56.1 80.3 69.3Main source of income of household head (%)Agriculture sources 23.2 17.4 14.4 8Wage labour 32.6 40 60.6 65.7Petty trade/self employment 27.4 23.9 15.4 16.8Services 3.7 5.2 4.3 2.9Beggar 1.1 0.6 1 1.5Housewife 8.9 7.7 1.9 1.5Others 3.2 5.2 2.4 3.6Occupation of beneficiary (%)Housewife 31.6 29.7 12.5 19Day labour 15.8 23.2 29.3 33.6Agriculture 40 30.3 49.5 34.3Petty trade 8.9 8.4 7.2 10.2Services 0.5 1.3 0.5 1.5Others 3.2 7.1 1 1.530
Using the consumption of three full meals a day as an indicator of food security, it is clear from the table 27 that the socioeconomiccharacteristics of households who do not become food secure even after entering VGD are substantially differentfrom those who do become food secure. The former households were worse off than the later in terms of per capita food andnon-food expenditure, savings, involvement in IGA and access to credit facilities. The average size of food insecurehouseholds is larger in comparison to the households that are able to achieve food security. Most of the household heads infood insecure households are day labourers. In IGVGD households, the food expenditure per capita of food insecurehouseholds is 22 percent less than food secure households and 34 percent less for FSVGD households. Direct involvement inIGA is also lower for the food insecure households. These food insecure households seem to be the poorest of the very poorhouseholds who do not have enough to offer as collateral, thus the higher proportion of these households resorting to noninstitutionalloans.Thus, beneficiaries who are unable to harness the full benefits of the VGD programme and graduate out of food insecurityare the poorest of the very poor households. These households only benift from the consumtion of temporary food aid.Although they attend the trainning sessions and meet the mandatory savings requirements they do not have the capability toutilise the other benefits of the programme as leverage to escape the poverty cycle.RECOMMENDATIONSThe poorest of the very poor among the VGD beneficiaries need to be identified.There are quite a sizeable proportion of beneficiaries, for whom the only benefitthat VGD brings about is the increase in direct food consumption. They need to begiven extra leverage so they can move closer to the poverty line and have agreater opportunity to graduate from poverty. Perhaps an additional cash grant tothese households could provide the extra leverage required.IGA training should be more demand-driven in order to cater to the needs of theparticipants and a wider choice of activities needs to be available to beneficiaries.Training facilities should be able to reinforce beneficeries existing IGA activities togive the beneficiaries the additional knowledge and skills required to expand orstrengthen the IGA activities they are already involved in. The training should bemore practically based, which could increase the beneficiaries' confidence ininvesting in an IGA. At present though most beneficiaries attend the IGA trainingsessions as per requirement, many of them are reluctant to use micro creditfacilities for future income generation. In the current survey, only 38 percent ofIGVGD women used the in-built credit programme to start an IGA. Often womenchoose not to borrow money from NGOs due to their lack of confidence or fear ofdebt.Many women enter the programme with a desire of receiving the free food rationwithout fully understanding the benefits of the programme. As a result, they do notreceive the full benefits that the programme has to offer. Social awareness trainingcould be used to initiate social change especially in relation to women'sempowerment.Despite participating in life skills training beneficiaries' knowledge of AIDS isappallingly low. Misconceptions about social ills are also prevalent. Incentiveschemes could be used to encourage social <strong>development</strong>. Each village couldhonour one or two beneficiaries who display the best knowledge of social<strong>development</strong>. This could bring 'status' to the woman and she would be lookedupon as somebody to emulate. This has the potential to bring about much-neededsocial change among rural women which, in turn, will impact upon their overallwell-being.31
AppendixWATER AND SANITATION INDEXThis is a continuous variable, ranging from 0-10. The points for each question were averaged,but normalized for the number of responses against each question. The index is the sum of thecomponents.Hand washing practice scoreNever/sometimes = 0Always = 1Soap usageNo soap or unused soap = 0Used soap = 1LatrineHygienic = 1 (water-sealed)Unhygienic = 0 (open space, unsealed , hanging / katcha)Handwashing after using toiletPoor practice = 0 (dirt, mud, only water)Good practice = 1 (soap, ash)Garbage DisposalPoor practice = 0 (burn / bury, drain / ditch, anywhere, leave in courtyard)Good practice = 1 (collected, designated place)Safe drinking waterSource is tubewell =1 (whether or not purify)Source is not tubewell but purify =1Source is not tubewell and not purify =0MOBILITY INDEXCan you go out of the house alone?Yes =1No =0For all 'yes' responses, give a score of 1 for 'own village', 2 for different village and 3 for city.Add these scores for each households and average for number of responses. Again for 'howoften', give a score of 0 for never, 1 for only in times of need, 2 for sometimes and 3 for all thetime. Average for no. of responses. Now add the 2 averaged scores for each households. Divideinto terciles. The lowest tercile will be low mobility, the middle tercile will show moderatemobility and the last tercile will show high mobility.32