Table of Contents - California Air Resources Board
Table of Contents - California Air Resources Board
Table of Contents - California Air Resources Board
You also want an ePaper? Increase the reach of your titles
YUMPU automatically turns print PDFs into web optimized ePapers that Google loves.
5<br />
Aerosol Dynamics Inc. Draft 8/3/1999<br />
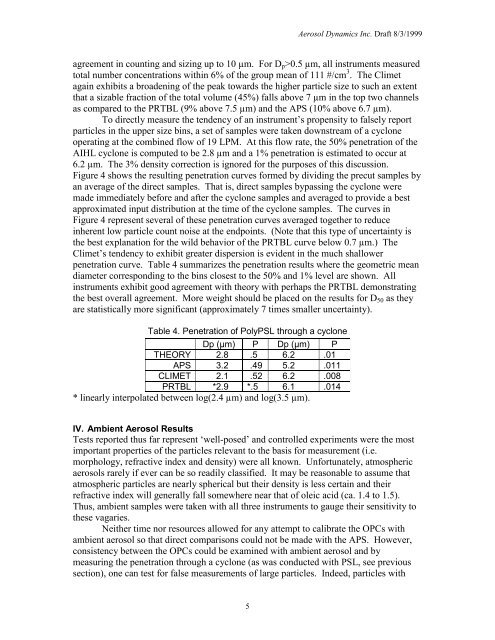
agreement in counting and sizing up to 10 µm. For Dp>0.5 µm, all instruments measured<br />
total number concentrations within 6% <strong>of</strong> the group mean <strong>of</strong> 111 #/cm 3 . The Climet<br />
again exhibits a broadening <strong>of</strong> the peak towards the higher particle size to such an extent<br />
that a sizable fraction <strong>of</strong> the total volume (45%) falls above 7 µm in the top two channels<br />
as compared to the PRTBL (9% above 7.5 µm) and the APS (10% above 6.7 µm).<br />
To directly measure the tendency <strong>of</strong> an instrument’s propensity to falsely report<br />
particles in the upper size bins, a set <strong>of</strong> samples were taken downstream <strong>of</strong> a cyclone<br />
operating at the combined flow <strong>of</strong> 19 LPM. At this flow rate, the 50% penetration <strong>of</strong> the<br />
AIHL cyclone is computed to be 2.8 µm and a 1% penetration is estimated to occur at<br />
6.2 µm. The 3% density correction is ignored for the purposes <strong>of</strong> this discussion.<br />
Figure 4 shows the resulting penetration curves formed by dividing the precut samples by<br />
an average <strong>of</strong> the direct samples. That is, direct samples bypassing the cyclone were<br />
made immediately before and after the cyclone samples and averaged to provide a best<br />
approximated input distribution at the time <strong>of</strong> the cyclone samples. The curves in<br />
Figure 4 represent several <strong>of</strong> these penetration curves averaged together to reduce<br />
inherent low particle count noise at the endpoints. (Note that this type <strong>of</strong> uncertainty is<br />
the best explanation for the wild behavior <strong>of</strong> the PRTBL curve below 0.7 µm.) The<br />
Climet’s tendency to exhibit greater dispersion is evident in the much shallower<br />
penetration curve. <strong>Table</strong> 4 summarizes the penetration results where the geometric mean<br />
diameter corresponding to the bins closest to the 50% and 1% level are shown. All<br />
instruments exhibit good agreement with theory with perhaps the PRTBL demonstrating<br />
the best overall agreement. More weight should be placed on the results for D50 as they<br />
are statistically more significant (approximately 7 times smaller uncertainty).<br />
<strong>Table</strong> 4. Penetration <strong>of</strong> PolyPSL through a cyclone<br />
Dp (µm) P Dp (µm) P<br />
THEORY 2.8 .5 6.2 .01<br />
APS 3.2 .49 5.2 .011<br />
CLIMET 2.1 .52 6.2 .008<br />
PRTBL *2.9 *.5 6.1 .014<br />
* linearly interpolated between log(2.4 µm) and log(3.5 µm).<br />
IV. Ambient Aerosol Results<br />
Tests reported thus far represent ‘well-posed’ and controlled experiments were the most<br />
important properties <strong>of</strong> the particles relevant to the basis for measurement (i.e.<br />
morphology, refractive index and density) were all known. Unfortunately, atmospheric<br />
aerosols rarely if ever can be so readily classified. It may be reasonable to assume that<br />
atmospheric particles are nearly spherical but their density is less certain and their<br />
refractive index will generally fall somewhere near that <strong>of</strong> oleic acid (ca. 1.4 to 1.5).<br />
Thus, ambient samples were taken with all three instruments to gauge their sensitivity to<br />
these vagaries.<br />
Neither time nor resources allowed for any attempt to calibrate the OPCs with<br />
ambient aerosol so that direct comparisons could not be made with the APS. However,<br />
consistency between the OPCs could be examined with ambient aerosol and by<br />
measuring the penetration through a cyclone (as was conducted with PSL, see previous<br />
section), one can test for false measurements <strong>of</strong> large particles. Indeed, particles with


