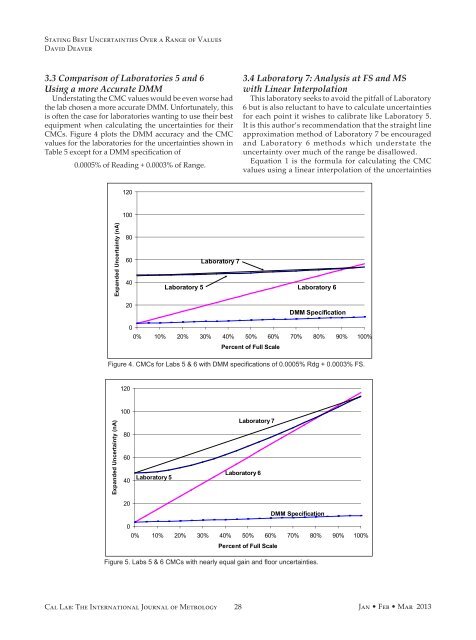
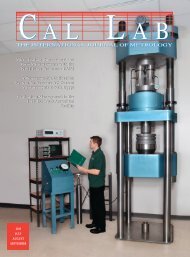
Stating Best Uncertainties Over a Range of ValuesDavid Deaver3.3 Comparison of <strong>Lab</strong>oratories 5 and 6Using a more Accurate DMMUnderstating the CMC values would be even worse hadthe lab chosen a more accurate DMM. Unfortunately, thisis often the case for laboratories wanting to use their bestequipment when calculating the uncertainties for theirCMCs. Figure 4 plots the DMM accuracy and the CMCvalues for the laboratories for the uncertainties shown inTable 5 except for a DMM specification of0.0005% of Reading + 0.0003% of Range.3.4 <strong>Lab</strong>oratory 7: Analysis at FS and MSwith Linear InterpolationThis laboratory seeks to avoid the pitfall of <strong>Lab</strong>oratory6 but is also reluctant to have to calculate uncertaintiesfor each point it wishes to calibrate like <strong>Lab</strong>oratory 5.It is this author’s recommendation that the straight lineapproximation method of <strong>Lab</strong>oratory 7 be encouragedand <strong>Lab</strong>oratory 6 methods which understate theuncertainty over much of the range be disallowed.Equation 1 is the formula for calculating the CMCvalues using a linear interpolation of the uncertainties120100Expanded Uncertainty (nA)806040<strong>Lab</strong>oratory 5<strong>Lab</strong>oratory 7<strong>Lab</strong>oratory 620DMM Specification00% 10% 20% 30% 40% 50% 60% 70% 80% 90% 100%Percent of Full ScaleFigure 4. CMCs for <strong>Lab</strong>s 5 & 6 with DMM specifications of 0.0005% Rdg + 0.0003% FS.120Expanded Uncertainty (nA)10080604020<strong>Lab</strong>oratory 5<strong>Lab</strong>oratory 7<strong>Lab</strong>oratory 6DMM Specification00% 10% 20% 30% 40% 50% 60% 70% 80% 90% 100%Percent of Full ScaleFigure 5. <strong>Lab</strong>s 5 & 6 CMCs with nearly equal gain and floor uncertainties.<strong>Cal</strong> <strong>Lab</strong>: The International Journal of Metrology28 Jan • Feb • Mar 2013
Stating Best Uncertainties Over a Range of ValuesDavid Deaverwithin the range of X values from full scale (FS) tominimum scale (MS). The corresponding uncertaintiesare UFS at full scale and UMS at minimum scale:CMC = UMS + ( UFS−UMS ) · ( X−MS ) _________( FS−MS ) (1)Equation 2 rearranges the terms into Gain and Floorterms. This allows the CMC for the range to be presentedas a Gain + Floor such as XX% + YY.CMC =____________( UFS−UMS )[ ( FS−MS ) ] · X + UMS−( UFS−UMS )·_________ MS[ ( FS−MS ) ] (2)GainFloorEquation 3 shows the calculation can be simplified alittle if the bottom of the range of values (MS) is zero.CMC MS=0=____________[ ( UFS−UMS )FS ] · X + [ UMS ] (3)GainFloorThe straight line approximation of <strong>Lab</strong>oratory 7 is alsoplotted in Figures 3 and 4. It can be seen that, becausethe point by point calculation of CMC for <strong>Lab</strong>oratory 5 isslightly curved, the straight line approximation slightlyoverstates the uncertainties near mid scale.This curve becomes more pronounced as theuncertainties that are proportional to the measuredvalue are more equal to those that are independent ofthe measured value. Figure 5 shows the CMC values forthe laboratories for the DMM with better specificationsbut with a larger Shunt Accuracy of 0.01% instead of0.001% in the previous examples. Now the linearlyapproximated CMC values of <strong>Lab</strong>oratory 7 at 25% ofthe range are reported about 20% higher than thosereported by <strong>Lab</strong>oratory 5 which calculated the CMCsfor every point. However, note that at MS, <strong>Lab</strong>oratory 6is claiming CMCs which are less than 10% of those thatshould be allowed!3.5 <strong>Lab</strong>oratory 7: Summary of Straight LineApproximation Method• <strong>Cal</strong>culate the fullscale uncertainty (UFS) perthe GUM by converting all uncertainties tocommon units and a common confidence level(1 sigma) and combine by RSS to get a standarduncertainty. Apply the appropriate coveragefactor (usually 2) to achieve a 95% confidencelevel at the full scale of the range of values.• Separate the error contributors into those thatare proportional to the reading and those thatare independent of the range of values. Thisinvolves some judgment. For uncertaintiesthat are not zero or 100% correlated, it may benecessary to separate the error estimate into aportion that is 0% correlated and a portion thatis 100% correlated with the input.• <strong>Cal</strong>culate the uncertainty at the minimum of therange of values (UMS) appropriately combiningby RSS the uncertainties that are proportionalto the range of values and those that are not.• The linear interpolation of the CMC value forany value MS ≤ X ≤ FS is given by Equation 2.If MS = 0, use Equation 3 instead of Equation 2.4. ConclusionCurve fitting and models are useful tools in simplifyingthe presentation of CMC values. However, some of themodels being used by labs currently are misrepresentingtheir actual CMC values. The author suggests that astraight line approximation of the uncertainties betweenthe minimum and maximum of the range of values isa far better approach to the method being practicedby many labs currently which treats all uncertaintiesas proportional to the value within the range exceptthe floor specification of the calibration standard.The straight line approximation will overstate theuncertainties rather than understate them as some labsare currently doing. A more sophisticated equationthan linear approximation could be used such as for<strong>Lab</strong>oratory 4 in the frequency dependent model.References1. D.K. Deaver, “A Methodology for Stating Best MeasurementCapabilities over a Range of Values,” Proceedings ofthe Measurement Science Conference, Pasadena, CA, March14-18, 2011.2. D.K. Deaver, “Stating Best Uncertainties Over a Rangeof Values,” NCSL International Workshop and Symposium,Sacramento, CA, July 29<strong>–</strong>August 2, 2012.David Deaver, Snohomish, WA, David.Deaver@Kendra.com.This paper was previously presented at the Measurement ScienceConference (MSC) in Pasadena, <strong>Cal</strong>ifornia, March 14-18, 2011.Jan • Feb • Mar 201329<strong>Cal</strong> <strong>Lab</strong>: The International Journal of Metrology