METROLOGY 101: PISTON PROVER DESIGN - Cal Lab Magazine
METROLOGY 101: PISTON PROVER DESIGN - Cal Lab Magazine
METROLOGY 101: PISTON PROVER DESIGN - Cal Lab Magazine

Create successful ePaper yourself
Turn your PDF publications into a flip-book with our unique Google optimized e-Paper software.
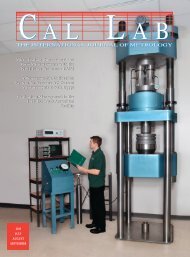
<strong>METROLOGY</strong> <strong>101</strong>: <strong>PISTON</strong> <strong>PROVER</strong> <strong>DESIGN</strong><br />
A New Primary Standard for the<br />
Realization of Pressure from 10 to 500 kPa<br />
2013<br />
APRIL<br />
MAY<br />
JUNE<br />
Metrology: Standardize and Automate!<br />
NEW FEATURE: Automation Corner
Transient Generators<br />
RFI/EMI/EMC<br />
DC Power Supplies<br />
VXI<br />
Synthesizers<br />
Electronic Loads<br />
Signal Generators<br />
Spectrum Analyzers<br />
Digital Multimeters<br />
Arbitrary Waveform Generators<br />
Curve Tracers<br />
Ground Bond<br />
ESD Test<br />
<strong>Cal</strong>ibrators<br />
Semiconductor Testers Bio-Medical Test<br />
Function Generators Megohmmeters Data Aquisition PXI<br />
Communication Analyzers LCR Meters Sweep Generators<br />
Network Analyzers<br />
AC Power Sources<br />
Noise Measuring<br />
Oscilloscopes<br />
Vector Signal Generators<br />
Pulse Generators Logic Analyzers Modulation Analyzers<br />
Impedance Analyzers Tracking Generators Frequency Counters<br />
Service Monitors<br />
Cable Locators Pattern Generators<br />
Hipot Testers<br />
Lightwave<br />
Power Meters<br />
VNA<br />
Audio Analyzers<br />
Aviation Test<br />
Amplifiers<br />
Repair Support For More Than 10,000 Different Test Equipment Products<br />
Legacy & Current Product Repair Support<br />
End-Of-Support (EOS) Repair Programs<br />
Fast, Simple Online Order Creation (RMA)<br />
Account Historical Data & Reporting Tools<br />
Single–Incident Repair Support<br />
Multi-Year Repair Agreements<br />
Post-Repair <strong>Cal</strong>ibration Available<br />
ISO 17025:2005 Accredited <strong>Cal</strong>ibration<br />
Test Equipment Repair Corporation – Industry’s Source For Repair<br />
Toll Free: (866) 965-4660<br />
customerservice@testequipmentrepair.com<br />
5965 Shiloh Rd E.<br />
Alpharetta, GA 30005
Volume 20, Number 2<br />
www.callabmag.com<br />
FEATURES<br />
22 Metrology <strong>101</strong>: Piston Prover Design with Additional Measurement<br />
Capabilities and Reduced Flow Interaction<br />
Edward Morrell<br />
26 Metrology: Standardize and Automate!<br />
Mark Kuster<br />
36 A New Primary Standard for the Realization of Pressure<br />
from 10 to 500 kPa<br />
Michael Bair, Tim Francis<br />
44 Automation Corner: Could the Tried and True IEEE 488 Communication<br />
Standard Be Nearing the End of Its Reign?<br />
Michael Schwartz<br />
DEPARTMENTS<br />
2 <strong>Cal</strong>endar<br />
3 Editor’s Desk<br />
10 Industry and Research News<br />
14 New Products and Services<br />
20 <strong>Cal</strong>-Toons by Ted Green<br />
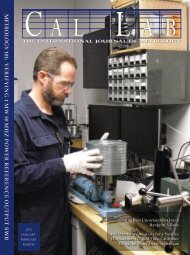
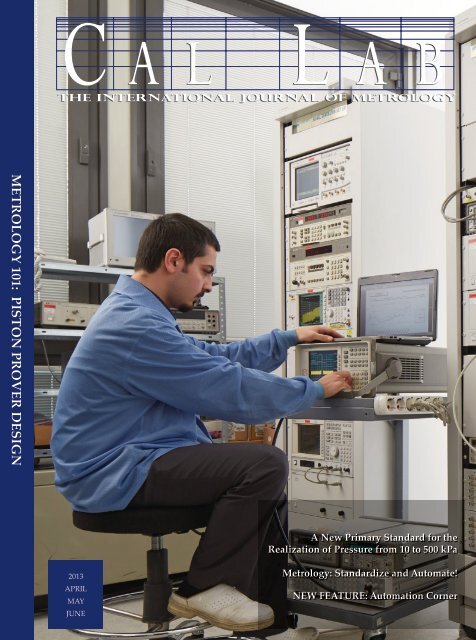
ON THE COVER: Emil Isgenderli works with a spectrum analyzer calibration setup at Spark Kalibrasyon Hizmetleri Ltd.Sti, an<br />
Agilent Authorized Service Provider in Turkey.<br />
Apr • May • Jun 2013<br />
1<br />
<strong>Cal</strong> <strong>Lab</strong>: The International Journal of Metrology
CALENDAR<br />
Jun 5-7 GAS2013. Rotterdam, The Netherlands. The 7th International<br />
Gas Analysis Symposium & Exhibition (GAS2013) topics in<br />
the parallel sessions are Natural gas & LNG; Metrology and<br />
standardization; Analytical chemistry; Health and environmental<br />
measurements. http://www.gas2013.org/<br />
Jun 7 ARFTG Microwave Measurement Conference. Seattle,<br />
WA. The 81st Microwave Measurement Conference is held in<br />
conjunction with the 2013 International Microwave Symposium.<br />
http://www.arftg.org/.<br />
Jul 14-18 NCSL International. Nashville, TN. The theme for the<br />
2013 NCSLI Workshop & Symposium is “Metrology in a Fast Paced<br />
Society.” http://ncsli.org.<br />
Jul 18-19 IMEKO/TC-4 Symposium. Barcelona, Spain. The<br />
Universitat Politècnica de Catalunya (UPC, Spain) and the<br />
International Measurement Confederation – IMEKO, are<br />
organizing the 19th IMEKO TC-4 Symposium on Measurements<br />
of Electrical Quantities. http://www.imeko2013.es/.<br />
CONFERENCES & MEETINGS 2013<br />
exhibit products and services. http://autotestcon.com/.<br />
Sep 24-26 The 16th International Flow Measurement Conference<br />
(FLOMEKO). Paris, France. Flomeko 2013 will provide the perfect<br />
opportunity for practitioners of metrology from a wide variety of<br />
industries to exchange ideas with researchers, national laboratories<br />
and academics. http://www.flomeko2013.fr/.<br />
Sep 25-27 10th International Congress on Electrical Metrology<br />
(X SEMETRO). Buenos Aires, Argentina. Organized by the<br />
Instituto Nacional de Tecnología Industrial (INTI) of Argentina<br />
and the Instituto Nacional de Metrologia, Qualidade e Tecnologia<br />
(INMETRO) of Brazil. http://www.inti.gob.ar/xsemetro/.<br />
Oct 7-10 16th International Congress of Metrology. Paris, France.<br />
This 3 day conference offers the opportunity to understand the<br />
latest technical developments in measurement, explore industrial<br />
challenges and develop solutions that will enhance innovation and<br />
performance through a varied conference program. http://www.<br />
metrologie2013.com.<br />
Sep 16-19 AUTOTESTCON. Schaumburg, IL. Military/aerospace<br />
automatic test industry and government/military acquirers and<br />
users share new technologies, discuss innovative applications, and<br />
Oct 14-18 TEMPMEKO 2013 Symposium. Madeira, Portugal. The<br />
12th Symposium on Temperature & Thermal Measurements in<br />
Industry and Science. http://www.tempmeko2013.pt.<br />
The World Leader in Temperature Metrology<br />
Isothermal Technology Limited (Worldwide)<br />
Web-site: www.isotech.co.uk<br />
E-mail: info@isotech.co.uk Phone: +44 (0) 1704 543830<br />
Isotech North America (The Americas)<br />
Web-site: www.isotechna.com<br />
E-mail: sales@isotechna.com Phone: +(802) 863-8050<br />
millisKanner (Channel Expander)<br />
• Expands milliK to a maximum of 33 Channels<br />
• Supports SPRTs, PRTs, Thermistors and TC<br />
• Universal Inputs for Flexibility<br />
Key Features...<br />
• Accuracy to 5mk (0.005°C) Over Full Range • All Sensor Types<br />
• USB Host: Mouse, Keyboard, Memory Stick • Graphical Display<br />
• Portable, Only 5 Pounds • 4-20mA Current Loop • Data Logging<br />
<strong>Cal</strong> <strong>Lab</strong>: The International Journal of Metrology<br />
2 Apr • May • Jun 2013
EDITOR’S DESK<br />
PUBLISHER<br />
MICHAEL L. SCHWARTZ<br />
EDITOR<br />
SITA P. SCHWARTZ<br />
CAL LAB<br />
PO Box 111113<br />
Aurora, CO 80042<br />
TEL 303-317-6670 • FAX 303-317-5295<br />
office@callabmag.com<br />
www.callabmag.com<br />
EDITORIAL ADVISORS<br />
CAROL L. SINGER<br />
JAY BUCHER<br />
BUCHERVIEW <strong>METROLOGY</strong><br />
CHRISTOPHER L. GRACHANEN<br />
HEWLETT-PACKARD<br />
MIKE SURACI<br />
CONSULTANT<br />
LOCKHEED MISSILES & SPACE<br />
(RETIRED)<br />
LEAD ASSESSOR, A2LA (RETIRED)<br />
MARTIN DE GROOT<br />
MARTINDEGROOT CONSULTANCY<br />
Subscription fees for 1 year (4 issues)<br />
$50 for USA, $55 Mexico/Canada,<br />
$65 all other countries.<br />
Visit www.callabmag.com<br />
to subscribe.<br />
Printed in the USA.<br />
© Copyright 2013 CAL LAB MAGAZINE.<br />
ISSN No. 1095-4791<br />
Weather vs. Metrology Speak<br />
My first draft of this issue’s Editor's Desk got r-e-j-e-c-t-e-d for a mildly<br />
flippant tone. So I will begin again. Usually, I begin with references to the<br />
weather and digress from there. This is a tactic I use with just about everything,<br />
particularly in instances such as this where I do not “speak” metrology… it's<br />
just not part of my native vocabulary. Several fellow, small business owners<br />
have commented on my previous essays—to my mortification—by which I<br />
am truly flattered since I rarely ever read the Editor’s Desk of less substantial<br />
publications that capture my interest.<br />
Now, I am at a huge loss for words, just as we go to press. The Editor’s<br />
Desk is blank—though in reality it’s a total disaster—so let’s begin with the<br />
weather… <strong>Cal</strong>ifornia was gorgeous for the Measurement Science Conference<br />
in Anaheim this past March! The pineapple guava and jasmine were in bloom.<br />
Minnie Mouse and Cinderella were captivating, as usual (this <strong>Cal</strong>ifornia girl will<br />
always have a soft spot for Disneyland), but the coffee is better in Pasadena.<br />
And hopefully, the Sequestration will have resolved itself by next year, as its<br />
effect on MSC was deeply felt. Politics prevented some from attending, even if<br />
they wanted to on their own dime/time, though I did enjoy talking with fellow<br />
attendees/exhibitors who did make it MSC!<br />
So, what do we have in this issue? We have flow, pressure, automation,<br />
and then some more automation. Edward Morrell of Mesa <strong>Lab</strong>s offers some<br />
background and introduction into high-speed piston prover design in gas flow.<br />
Michael Bair and Tim Francis of Fluke <strong>Cal</strong>ibration cover fluid pressure—“A<br />
New Primary Standard for the Realization of Pressure from 10 to 500 kPa”—<br />
introducing their piston gauge design used as a primary standard to realize<br />
pressure in gauge and absolute modes from 10 to 500 kPa. Mark Kuster steers<br />
us in another direction with “Metrology: Standardize and Automate!”<br />
In that vein, our publisher begins a new feature called “Automation Corner,”<br />
where he’ll be sounding off about all sorts of things related to the automation of<br />
metrology… starting with IEEE communication standards, when automation<br />
was still just a twinkle in an engineer’s eye.<br />
Now, if you are still reading this, my essay has not been rejected, we have gone<br />
to print, and all is well. I hope you have a fantastic spring, or what remains of it!<br />
~ Sita Schwartz<br />
Editor<br />
Find <strong>Cal</strong> <strong>Lab</strong> <strong>Magazine</strong> on LinkedIn Groups,<br />
now 1000+ members strong & growing!<br />
Apr • May • Jun 2013<br />
3<br />
<strong>Cal</strong> <strong>Lab</strong>: The International Journal of Metrology
CALENDAR<br />
SEMINARS: Online & Independent Study<br />
ASQ CCT (Certified <strong>Cal</strong>ibration Technician) Exam Preparation<br />
Program. Learning Measure. http://www.learningmeasure.com/.<br />
AC-DC Metrology– Self-Paced Online Training. Fluke Training.<br />
http://us.flukecal.com/training/courses.<br />
Basic Measurement Concepts Program. Learning Measure. http://<br />
www.learningmeasure.com/.<br />
Basic Measuring Tools – Self Directed Learning. The QC Group,<br />
http://www.qcgroup.com/sdl/.<br />
Basic RF and Microwave Program. Learning Measure. http://<br />
www.learningmeasure.com/.<br />
Certified <strong>Cal</strong>ibration Technician – Self-study Course. J&G<br />
Technology. http://www.jg-technology.com/selfstudy.html.<br />
Certified Quality Technician Preparation (CQT) – Online<br />
Training. J&G Technology. http://www.jg-technology.com<br />
Introduction to Measurement and <strong>Cal</strong>ibration – Online Training.<br />
The QC Group, http://www.qcgroup.com/online/.<br />
Intro to Measurement and <strong>Cal</strong>ibration – Self-Paced Online<br />
Training. Fluke Training. http://us.flukecal.com/training/courses.<br />
ISO/IEC 17025 Accreditation Courses. WorkPlace Training, (612)<br />
308-2202, info@wptraining.com, http://www.wptraining.com/.<br />
Measurement and <strong>Cal</strong>ibration Overview – Online Training. J&G<br />
Technology. http://www.jg-technology.com/mco.html.<br />
Measurement Uncertainty – Self-Paced Online Training. Fluke<br />
Training. http://us.flukecal.com/training/courses.<br />
Measurement Uncertainty Analysis – Online Training. The QC<br />
Group, http://www.qcgroup.com/online/.<br />
Metrology for <strong>Cal</strong> <strong>Lab</strong> Personnel– Self-Paced Online Training.<br />
Fluke Training. http://us.flukecal.com/training/courses.<br />
Metrology Concepts. QUAMETEC Institute of Measurement<br />
Technology. http://www.QIMTonline.com.<br />
Precision Dimensional Measurement – Online Training. The QC<br />
Group, http://www.qcgroup.com/online/.<br />
Precision Measurement Series Level 1 & 2. WorkPlace Training,<br />
http://www.wptraining.com/.<br />
Precision Electrical Measurement – Self-Paced Online Training.<br />
Fluke Training. http://us.flukecal.com/training/courses.<br />
Vibration and Shock Testing. Equipment Reliability Institute,<br />
http://www.equipment-reliability.com/distance_learning.html.<br />
Force and Torque <strong>Cal</strong>ibration Service<br />
Lower your test uncertainty ratios by having instruments<br />
calibrated at a more precise level of measurement certainty:<br />
Primary Force and Torque standards accurate to<br />
0.002% of applied for most capacities<br />
Hassle-Free <strong>Cal</strong>ibration Service - Morehouse<br />
does not require RMAʼs and works extensively<br />
to ensure calibrations are performed in a manner<br />
that replicates how the instruments are used<br />
Force <strong>Cal</strong>ibration performed in our laboratory to<br />
2,250,000 lbf in compression and 1,200,000 lbf<br />
in tension and equivalent SI units<br />
Torque <strong>Cal</strong>ibration performed in our laboratory<br />
to 1475 ft - lbf and equivalent SI units<br />
<strong>Cal</strong>ibrations performed in accordance with<br />
customer specifications, ASTM E74, ISO 376,<br />
ASTM E 2428 and BS 7882<br />
ISO 17025 Accredited<br />
American Association of <strong>Lab</strong>oratory<br />
Accreditation <strong>Cal</strong>ibration Cert 1398.01<br />
Prompt Delivery of 5-7 Days on Most Items. Expedited Service Available<br />
MOREHOUSE FORCE & TORQUE CALIBRATION LABORATORIES<br />
Phone: 717-843-0081 / Fax: 717-846-4193 / www.mhforce.com / e-mail: hzumbrun@mhforce.com<br />
INSTRUMENT COMPANY, INC.<br />
1742 Sixth Avenue ¥ York, PA USA<br />
<strong>Cal</strong> <strong>Lab</strong>: The International Journal of Metrology<br />
4 Apr • May • Jun 2013
Electric Voltage & Current<br />
Voltage Transducers<br />
Provide an Analog Output Signal Magnetically Isolated<br />
from the Primary Voltage Circuit<br />
• Full-scale Primary Voltages from ±500V to ±8,000V<br />
• Amplitude Accuracy to ±0.2% at dc<br />
• Amplitude Frequency Response dc to 500kHz (-3dB)<br />
Convert High Voltage Levels in Power Converters to Low Level, Low Impedance<br />
Signals that can be Used for Accurate and Safe Test<br />
Measurements<br />
Closed-Loop Hall Current Transducers<br />
Provide an Analog Output Signal Isolated<br />
from the Primary Current Circuit<br />
• Full-scale Primary Currents from ±100A to ±15,000A<br />
• Amplitude Accuracy to ±0.3% at dc<br />
• Amplitude Frequency Response dc to 300kHz (-3dB)<br />
• Common Mode Primary Voltage Isolation<br />
• Split Core Versions Available (±2% at dc)<br />
Suitable for Production Line Testing<br />
where Long-term Stability and<br />
Reliability are Critical<br />
Closed-Loop Fluxgate Current Transducers<br />
Generate a Very High-Accuracy Output Signal<br />
with Electrical Isolation from the Primary Circuit<br />
• Full-scale Primary Currents from ±60A to ±1,000A<br />
• Amplitude Linearity to ±0.3ppm at dc<br />
• Amplitude Frequency Response dc to 300kHz (-3dB)<br />
• Very Low Noise to
CALENDAR<br />
SEMINARS: Dimensional<br />
Jun 3-4 Hands-On Gage <strong>Cal</strong>ibration and Repair Workshop. Las<br />
Vegas, NV. http://www.iicttraining.com.<br />
Jun 6-7 Hands-On Gage <strong>Cal</strong>ibration and Repair Workshop. Yorba<br />
Linda, CA. http://www.iicttraining.com.<br />
Jun 10-11 Hands-On Gage <strong>Cal</strong>ibration and Repair Workshop.<br />
Phoenix, AZ. http://www.iicttraining.com.<br />
Jun 17-20 Dimensional & Thermodynamic <strong>Cal</strong>ibration<br />
Procedures. Las Vegas, CA. http://www.ttiedu.com/combos.html.<br />
Jun 18 Dimensional Metrology: Applications and Techniques.<br />
Mason, OH. http://www.mitutoyo.com/support/mitutoyoinstitute-of-metrology/.<br />
Jun 18-20 Gage <strong>Cal</strong>ibration and Minor Repair Training.<br />
Cincinnati, OH. Cincinnati Precision Instruments,Inc. http://www.<br />
cpi1stop.com/.<br />
Jun 20 Gage <strong>Cal</strong>ibration Systems and Methods. Mason, OH.<br />
http://www.mitutoyo.com/support/mitutoyo-institute-ofmetrology/.<br />
Jul 11-12 Hands-On Gage <strong>Cal</strong>ibration and Repair Workshop.<br />
Myrtle Beach, SC. http://www.iicttraining.com.<br />
Jul 15-16 Hands-On Gage <strong>Cal</strong>ibration and Repair Workshop.<br />
Atlanta, GA. http://www.iicttraining.com.<br />
Jul 18-19 Hands-On Gage <strong>Cal</strong>ibration and Repair Workshop.<br />
Nashville, TN. http://www.iicttraining.com.<br />
Jul 23 Dimensional Metrology: Application and Techniques.<br />
Westford, MA. Mason, OH. http://www.mitutoyo.com/support/<br />
mitutoyo-institute-of-metrology/.<br />
Jul 25 Gage <strong>Cal</strong>ibration Systems and Methods. Westford,<br />
MA. Mason, OH. http://www.mitutoyo.com/support/mitutoyoinstitute-of-metrology/.<br />
Aug 8-9 Hands-On Gage <strong>Cal</strong>ibration and Repair Workshop.<br />
Hartford, CT. http://www.iicttraining.com.<br />
Aug 12-13 Hands-On Gage <strong>Cal</strong>ibration and Repair Workshop.<br />
Newark, NJ. http://www.iicttraining.com.<br />
IAS <strong>Lab</strong>oratory Accreditation<br />
to ISO/IEC Standard 17025<br />
The International Accreditation Service (IAS)<br />
offers laboratories Accreditation Service Plus+<br />
+ Quick scheduling and efficient assessments<br />
+ On demand responsiveness<br />
+ True affordability<br />
+ Global recognition by ILAC<br />
+ Proof of compliance with ISO/IEC 17025<br />
Learn about the Benefits of IAS Accreditation<br />
www.iasonline.org/ca<br />
866-427-4422<br />
11-05610<br />
<strong>Cal</strong> <strong>Lab</strong>: The International Journal of Metrology<br />
6 Apr • May • Jun 2013
CALENDAR<br />
SEMINARS: Electrical<br />
Jun 3-6 MET-<strong>101</strong> Basic Hands-on Metrology. Everett, WA. Fluke<br />
<strong>Cal</strong>ibration. http://us.flukecal.com/training/courses/MET-<strong>101</strong>.<br />
Jun 13-14 Essentials of Electrical Metrology. Chicago, IL.<br />
WorkPlace Training. http://www.wptraining.com.<br />
Jun 27-28 Essentials of Electrical Metrology. Minneapolis, MN.<br />
WorkPlace Training. http://www.wptraining.com.<br />
Aug 5-8 MET-301 Advanced Hands-on Metrology. Seattle, WA.<br />
Fluke <strong>Cal</strong>ibration. http://us.flukecal.com/training/courses/MET-<br />
301.<br />
Sep 16-19 MET-<strong>101</strong> Basic Hands-on Metrology. Everett, WA. Fluke<br />
<strong>Cal</strong>ibration. http://us.flukecal.com/training/courses/MET-<strong>101</strong>.<br />
Nov 11-14 MET-<strong>101</strong> Basic Hands-on Metrology. Everett, WA. Fluke<br />
<strong>Cal</strong>ibration. http://us.flukecal.com/training/courses/MET-<strong>101</strong>.<br />
Nov 18-21 MET-301 Advanced Hands-on Metrology. Seattle, WA.<br />
Fluke <strong>Cal</strong>ibration. http://us.flukecal.com/training/courses/MET-301.<br />
SEMINARS: Flow & Pressure<br />
Jun 4-5 Wet Gas Measurement Training Course. Lima, Peru.<br />
Colorado Engineering Experiment Station, Inc. http://www.ceesi.com.<br />
Jun 6-7 Uncertainty Measurement of Natural Gas and Liquids<br />
Training Course. Lima, Peru. Colorado Engineering Experiment<br />
Station, Inc. http://www.ceesi.com.<br />
Jul 15 Fundamentals of Ultrasonic Flowmeters Training Course.<br />
Denver, CO. Colorado Engineering Experiment Station, Inc. http://<br />
www.ceesi.com.<br />
Jul 16-18 Ultrasonic Meter User’s Workshop. Denver, CO. Colorado<br />
Engineering Experiment Station, Inc. http://www.ceesi.com.<br />
Sep 10-12 Fundamentals of Flow Measurement Training Course.<br />
Loveland, CO. Colorado Engineering Experiment Station, Inc.<br />
http://www.ceesi.com.<br />
Sep 16-29 Comprehensive Flow Measurement Training Course.<br />
Loveland, CO. Colorado Engineering Experiment Station, Inc.<br />
http://www.ceesi.com.<br />
Need a better<br />
cold-temperature<br />
calibration source?<br />
The 9190A Ultra-Cool Field<br />
Metrology Well is the most stable<br />
cold-temperature dry-block<br />
calibrator on the market.<br />
Don’t get snowed by solutions that drift. With the 9190A,<br />
temperatures stay stable throughout your entire calibration.<br />
You can be confident your results are accurate.<br />
Wide temperature range from –95 °C to 140 °C<br />
Brackets the coldest and highest temperatures required for<br />
pharmaceutical, biomedical and food processing industries<br />
Best-in-class stability: ± 0.015 °C full range<br />
Ideal for applications that demand strict quality control and<br />
regulatory process compliance<br />
Get the cold hard facts about the 9190A Ultra-Cool Field<br />
Metrology Well at<br />
www.flukecal.com/snowman.<br />
Fluke <strong>Cal</strong>ibration. Precision, performance, confidence.<br />
Electrical RF Temperature Pressure Flow Software<br />
©2013 Fluke <strong>Cal</strong>ibration. Ad 4265040A_EN<br />
Specifications subject to change without notice.<br />
4265040A_EN_9190_Drywell_Half_Pg_<strong>Cal</strong>_<strong>Lab</strong>.indd 1<br />
4/23/13 8:52 AM<br />
Apr • May • Jun 2013<br />
7<br />
<strong>Cal</strong> <strong>Lab</strong>: The International Journal of Metrology
CALENDAR<br />
Sep 23-27 Principles of Pressure <strong>Cal</strong>ibration. Phoenix, AZ. Fluke<br />
<strong>Cal</strong>ibration. http://us.flukecal.com/Principles-of-Pressure.<br />
Dec 9-13 Principles of Pressure <strong>Cal</strong>ibration. Phoenix, AZ. Fluke<br />
<strong>Cal</strong>ibration. http://us.flukecal.com/Principles-of-Pressure.<br />
SEMINARS: General<br />
May 20-23 CLM-303 Effective <strong>Cal</strong> <strong>Lab</strong> Management. Everett, WA.<br />
http://us.flukecal.com/lab_management_training.<br />
Jun 10-12 <strong>Cal</strong> <strong>Lab</strong> Manager Training; Beyond 17025. Chicago, IL.<br />
WorkPlace Training. http://www.wptraining.com.<br />
Jun 24-26 <strong>Cal</strong> <strong>Lab</strong> Manager Training; Beyond 17025. Minneapolis,<br />
MN. WorkPlace Training. http://www.wptraining.com.<br />
Sep 4-6 Instrumentation for Test and Measurement. Las Vegas,<br />
NV. Technology Training, Inc. http://www.ttiedu.com.<br />
Oct 14-15 <strong>Cal</strong> <strong>Lab</strong> Benchmark Challenge Boot Camp. Boca Raton,<br />
FL. WorkPlace Training. http://www.wptraining.com.<br />
Nov 4-7 CLM-303 Effective <strong>Cal</strong> <strong>Lab</strong> Management. Everett, WA.<br />
http://us.flukecal.com/lab_management_training.<br />
<strong>Cal</strong> <strong>Lab</strong> Mag 6.5x4.75_2012 5/23/12 2:36 PM Page 1<br />
SEMINARS: Industry Standards<br />
Jul 23-24 Risk Assessments for Cleanrooms and Controlled<br />
Environments. Arlington Heights, IL. Institute of Environmental<br />
Sciences and Technology (IEST). http://www.iest.org.<br />
SEMINARS: Measurement Uncertainty<br />
Jun 18-19 Measurement Uncertainty. Dallas/Ft. Worth, TX.<br />
WorkPlace Training http://www.wptraining.com.<br />
Jun 24-27 Measurement Uncertainty. Las Vegas, NV. Technology<br />
Training, Inc. http://www.ttiedu.com/schedule.html.<br />
Jul 16-17 Estimating Measurement Uncertainty. Westford,<br />
MA. http://www.mitutoyo.com/support/mitutoyo-institute-ofmetrology/.<br />
Aug 27-28 Introduction to Measurement Uncertainty. Baltimore,<br />
MD. WorkPlace Training. http://www.wptraining.com.<br />
Sep 23-25 Measurement Uncertainty Training Course. Loveland,<br />
CO. Colorado Engineering Experiment Station, Inc. http://www.<br />
ceesi.com.<br />
On-site calibration and adjustment.<br />
HygroGen2<br />
• Generates stable humidity and temperature conditions<br />
• Increased calibration productivity<br />
• Stable humidity values within 5 to 10 minutes<br />
• <strong>Cal</strong>ibrates up to 5 sensors simultaneously<br />
• Integrated sample loop for use with Reference Hygrometers<br />
• Integrated desiccant cell and digital water level monitoring<br />
• Easy-to-use graphical user interface<br />
Visit www.rotronic-usa.com for more information or call 631-427-3898.<br />
ROTRONIC Instrument Corp, 135 Engineers Road, Hauppauge, NY 11788, USA, sales@rotronic-usa.com<br />
<strong>Cal</strong> <strong>Lab</strong>: The International Journal of Metrology<br />
8 Apr • May • Jun 2013
CALENDAR<br />
Oct 17-18 Introduction to Measurement Uncertainty. Boca Raton,<br />
FL. WorkPlace Training. http://www.wptraining.com.<br />
Oct 22-24 MET-302 Introduction to Measurement Uncertainty.<br />
Everett, WA. Fluke <strong>Cal</strong>ibration. http://us.flukecal.com/training/<br />
courses/MET-302.<br />
SEMINARS: Temperature<br />
Jun 11-13 Principles of Temperature Metrology. American Fork,<br />
UT. Fluke <strong>Cal</strong>ibration. http://us.flukecal.com/training/courses/<br />
Principles-Temperature-Metrology.<br />
Sep 17-19 Advanced Topics in Temperature Metrology. American<br />
Fork, UT. Fluke <strong>Cal</strong>ibration. http://us.flukecal.com/training/<br />
courses/Principles-Temperature-Metrology.<br />
Oct 8-10 Principles of Temperature Metrology. American Fork,<br />
UT. Fluke <strong>Cal</strong>ibration. http://us.flukecal.com/training/courses/<br />
Principles-Temperature-Metrology.<br />
SEMINARS: Vibration<br />
Jun 17-19 Vibration and Shock Test Fixture Design. Sunnyvale,<br />
CA. Equipment Reliability Institute. http://www.equipmentreliability.com.<br />
Jul 16-18 Simultaneous Multi-Axis Vibration Testing. Burlington,<br />
WA. Equipment Reliability Institute. http://www.equipmentreliability.com.<br />
Aug 5-8 Fundamentals of Vibration for Test and Design<br />
Applications. Oxnard, CA. Technology Training, Inc. http://www.<br />
ttiedu.com.<br />
Aug 20-22 Fundamentals of Random Vibration and Shock<br />
Testing, HALT, ESS, HASS (...). Santa Barbara, CA. http://www.<br />
equipment-reliability.com.<br />
8<br />
Visit www.callabmag.com<br />
for upcoming and future events!<br />
HIGH VOLTAGE STANDARD<br />
• UNIQUE MODULAR <strong>DESIGN</strong><br />
o<br />
BUILD UP IN 50 KV SECTIONS<br />
• INNOVATIVE GUARD STRUCTURE<br />
o REDUCES COUPLING ERRORS<br />
PROVIDES METERING OUTPUT<br />
o<br />
• RUGGED & TRANSPORTABLE<br />
o EASY TO SHIP<br />
• HIGH STABILITY, HIGH ACCURACY<br />
o STATE OF THE ART <strong>DESIGN</strong><br />
• ACCREDITED CALIBRATION INCLUDED<br />
o<br />
o<br />
TO 150 KV DC<br />
TO 100 KV AC 60 HZ RMS<br />
SEE WWW.OHM-LABS.COM FOR DETAILS<br />
611 E. CARSON ST. PITTSBURGH PA 15203<br />
TEL 412-431-0640 FAX 412-431-0649<br />
WWW.OHM-LABS.COM<br />
Apr • May • Jun 2013<br />
9<br />
<strong>Cal</strong> <strong>Lab</strong>: The International Journal of Metrology
INDUSTRY AND RESEARCH NEWS<br />
VSL Supports IRMM in Small Current Measurements<br />
for Radionuclide Metrology<br />
The accurate measurement of small electrical currents<br />
is essential for the measurement of ionizing radiation as<br />
generated by radionuclides. VSL has been involved in the<br />
current measurement part of the development of a new welltype<br />
ionization chamber at IRMM. This well-chamber is meant<br />
to be able to replace the ‘Système International de Référence’<br />
(SIR), the BIPM facility used for international comparisons<br />
of radioactivity measurements. If constructed according to<br />
specifications, this well-chamber should give reproducible<br />
results with an uncertainty of 0.1 % for radionuclides emitting<br />
gamma rays in the range from 20 keV to 2000 keV.<br />
To achieve this goal, accurate and traceable measurements<br />
of the ionization current are extremely important. For the<br />
prototype ionization chamber, background radiation typically<br />
produces a current of about 45 fA, whereas a relatively<br />
strong source results in a 1 nA current. IRMM contacted<br />
VSL to support the development in this part of their project.<br />
A generator equivalent to the VSL primary standard for<br />
small currents was duplicated and brought to IRMM. This<br />
generator generates a very stable and linear voltage ramp<br />
dV/dt that is fed to a capacitor C to convert it to a current I =<br />
C∙dV/dt. After some initial testing, two-day training course<br />
was organized to discuss the details of high-precision small<br />
current measurements.<br />
For small current related issues, VSL will continue to be<br />
involved in the further development of the new realization<br />
of the becquerel at IRMM. This way, the VSL expertise in<br />
electrical current measurement gives a significant contribution<br />
to the future international traceability of the becquerel.<br />
For more information on this subject, please contact Helko<br />
van den Brom, hvdbrom@vsl.nl.<br />
Schematic overview of the current generator use to calibrate electrometers.<br />
HIGH VOLTAGE<br />
CALIBRATION LAB<br />
Custom Design is our Specialty!<br />
<strong>DESIGN</strong>, MANUFACTURE, TEST &<br />
CALIBRATE:<br />
• HV VOLTAGE DIVIDERS<br />
• HV PROBES<br />
• HV RELAYS<br />
• HV AC & DC HIPOTS<br />
• HV DIGITAL VOLTMETERS<br />
• HV CONTACTORS<br />
• HV CIRCUIT BREAKERS<br />
• HV RESISTIVE LOADS<br />
• SPARK GAPS<br />
• FIBER OPTIC SYSTEMS<br />
ISO/IEC 17025:2005<br />
CALIBRATION CERT #2746.01<br />
ISO 9001:2008<br />
QMS CERTIFIED<br />
HV LAB CALIBRATION CAPABILITIES:<br />
• UP TO 450kV PEAK 60Hz<br />
• UP TO 400kV DC<br />
• UP TO 400kV 1.2x50μS<br />
LIGHTNING IMPULSE<br />
HV LAB CALIBRATION STANDARDS<br />
ISO/IEC 17025:2005 ACCREDITED<br />
ISO 9001:2008 QMS CERTIFIED<br />
N.I.S.T. TRACEABILITY<br />
N.R.C. TRACEABILITY<br />
High Voltage Dividers & Probes<br />
R<br />
OSS ENGINEERING CORPORATION<br />
540 Westchester Dr. Campbell, CA 95008<br />
www.rossengineeringcorp.com<br />
408-377-4621<br />
±<br />
<strong>Cal</strong> <strong>Lab</strong>: The International Journal of Metrology<br />
10 Apr • May • Jun 2013
INDUSTRY AND RESEARCH NEWS<br />
New NIST Measurement Tool Is On Target for the<br />
Fast-Growing MEMS Industry<br />
As markets for miniature, hybrid machines known<br />
as MEMS grow and diversify, the National Institute of<br />
Standards and Technology (NIST) has introduced a longawaited<br />
measurement tool that will help growing numbers<br />
of device designers, manufacturers and customers to see<br />
eye to eye on eight dimensional and material property<br />
measurements that are key to device performance.<br />
The NIST-developed test chips (Reference Materials<br />
8096 and 8097) are quality assurance tools that enable<br />
accurate, reliable comparisons of measurements on MEMS<br />
(MicroElectroMechanical Systems) devices made with<br />
different equipment and by different labs or companies.<br />
These capabilities will make it easier to characterize<br />
and troubleshoot processes, calibrate instruments and<br />
communicate among partners.<br />
MEMS were once considered a stepchild of the<br />
semiconductor industry and largely confined to automotive<br />
uses—primarily as accelerometers in airbag systems. But<br />
the devices have branched out into an array of applications,<br />
especially in consumer electronics markets. A high-end<br />
smart phone, for example, contains about 10 such devices,<br />
including microphones, accelerometers and gyroscopes.<br />
MEMS devices also are important components of tablet<br />
computers, game consoles, lab-on-a-chip diagnostic systems,<br />
displays and implantable medical devices.<br />
Global MEMS industry revenues are projected to grow<br />
from about $10 billion in 2011 to $21 billion in 2017, according<br />
to the June 2012 forecast by the technology consulting firm<br />
Yole Développement.<br />
Widely used reference materials and standardized<br />
measurement methods can help to improve process<br />
efficiency and to reduce the cost and time devoted to<br />
testing and inspecting MEMS devices. Industry-accepted<br />
measurements also can promote greater interoperability<br />
among devices made by different manufacturers.<br />
The new NIST reference materials are micromachined and<br />
further processed to contain miniature cantilevers, beams,<br />
stair-like step heights, microscale rulers and test structures<br />
for measuring surface-layer thickness. Specifically, the NIST<br />
test chips can be used to check customer conformity with<br />
internationally established standards for measuring elasticity<br />
(Young’s modulus), residual strain (and stress), strain (and<br />
stress) gradient, as well as thickness, step height and length.<br />
Apr • May • Jun 2013<br />
11<br />
<strong>Cal</strong> <strong>Lab</strong>: The International Journal of Metrology
INDUSTRY AND RESEARCH NEWS<br />
All dimensional and material-property measurements<br />
that NIST used to characterize the reference devices<br />
conform with SEMI and ASTM International standard<br />
test methods. These standard methods are consensus best<br />
practices developed by industry committees.<br />
“Reference materials and best-practice test methods<br />
provide industry-wide benefits,” explains NIST<br />
electronics engineer Janet Cassard. “Typically, these<br />
tools are prohibitively expensive for a single company<br />
to develop on its own. We will work with the MEMS<br />
community to facilitate widespread adoption and<br />
consistent usage of these standard test methods and<br />
reference materials.”<br />
One test chip (RM 8096) is manufactured in an<br />
integrated circuit (IC) process; the other (RM 8097) in a<br />
MEMS process. The test chips are supported by a user’s<br />
guide, data analysis sheets for each measurement, and<br />
other materials accessible via the NIST Data Gateway with<br />
the keyword “MEMS <strong>Cal</strong>culator.”<br />
For more information, go to: http://www.nist.gov/srm/<br />
index.cfm.<br />
Source: NIST Tech Beat - April 30, 2013, http://www.nist.<br />
gov/public_affairs/tech-beat/index.cfm#mems.<br />
New NIST Time Code to Boost Reception for<br />
Radio-Controlled Clocks<br />
The National Institute of Standards and Technology<br />
(NIST) is changing the way it broadcasts time signals<br />
that synchronize radio-controlled “atomic” clocks and<br />
watches to official U.S. time in ways that will enable<br />
new radio-controlled timepieces to be significantly more<br />
robust and reliable.<br />
This new time broadcast protocol will not only<br />
improve the performance of new radio-controlled clocks<br />
and watches, but will encourage the development of<br />
new timekeeping products that were not practical with<br />
the old broadcast system because of local interference<br />
or other limitations. For example, appliances such as<br />
refrigerators, microwave ovens and thermostats, as well<br />
as traffic light timers and sprinkler systems will be able to<br />
take advantage of this new phase modulation broadcast.<br />
Popular radio-controlled timekeepers, which range<br />
from wristwatches to wall clocks, are not really atomic<br />
clocks—though that’s often in their name—but they do<br />
set themselves by listening to low-frequency AM time<br />
broadcasts from the NIST radio station WWVB in Fort<br />
Collins, Colo. Those broadcasts are synchronized to the<br />
NIST atomic clock ensemble in nearby Boulder, Colo.<br />
However, sometimes the radio-controlled clocks have<br />
difficulty accurately picking up the WWVB time signal<br />
because of the clock’s location, local radio interference,<br />
effects of buildings, and other problems. Moreover, a<br />
time broadcast from England on the same frequency also<br />
interferes with devices on the east coast of the United<br />
States that rely on the NIST broadcast, according to John<br />
Lowe, station manager for WWVB.<br />
To solve these problems, Lowe says, NIST has<br />
developed, tested and is now beginning to implement the<br />
new phase-modulation WWVB signal. Like a traditional<br />
AM radio station, time information is encoded in the<br />
WWVB broadcast by changes in the strength or amplitude<br />
of the radio signal. Phase modulation adds an additional<br />
layer of information encoded by shifting the phase of the<br />
carrier wave. (The crests of two waves that are “in phase”<br />
pass a point at the same time. If one is phase-shifted, the<br />
crest will arrive a little before or after the other.)<br />
This change significantly improves signal reception and<br />
overall performance of new products that are designed<br />
to utilize this new protocol. Legacy clocks and watches<br />
will still continue to function as they have because the<br />
amplitude modulation remains the same, but they will<br />
not benefit from the increased performance of the new<br />
phase modulation protocol, Lowe said.<br />
These new products and non-networked systems will<br />
be able to take advantage of the improved NIST broadcast<br />
format thanks to next generation receiver chips that will<br />
begin entering the marketplace in 2013.<br />
For more on radio-controlled clocks work with WWVB,<br />
see www.nist.gov/pml/div688/grp40/radioclocks.cfm.<br />
Source: NIST Tech Beat, March 5, 2013, http://www.nist.<br />
gov/public_affairs/tech-beat/tb20130305.cfm#wwvb.<br />
WorkPlace Training Metrology Academy<br />
WorkPlace Training, Emc3 Solutions and Quality<br />
Systems <strong>Lab</strong>oratory announce the opening of a World<br />
Class ISO 17025 accredited training facility in Boca Raton<br />
FL. Our new 11,600 sq ft facility contains the most state of<br />
the art measurement instruments and standards available.<br />
By attending our workshops you will receive hands on<br />
metrology training curriculum designed and delivered by<br />
WorkPlace Trainings Chief Technical Officer, Dilip Shah.<br />
Mr. Shah will lead the training and be assisted by Edward<br />
Brown and the staff at QSL. These 2 day workshops will<br />
be offered each year in the fall and winter. In addition,<br />
workshops can be scheduled throughout the year for your<br />
calibration staff by appointment.<br />
WPT Supports your training before the event with<br />
of elearning prerequisite; during the workshop with<br />
focused classroom and hands on demonstrations with<br />
check, working and reference standards; and after the<br />
workshop with telephone support. ASQ Recertification<br />
Units eligible.<br />
Check our website (www.wptraining.com) for more<br />
topics, learning objectives, audience, costs and dates.<br />
<strong>Cal</strong> <strong>Lab</strong>: The International Journal of Metrology<br />
12 Apr • May • Jun 2013
Since elementary school, you’ve had<br />
to show your work. Make sure your<br />
calibration provider does too.<br />
When it comes to calibration, a simple<br />
pass/fail answer isn’t enough. You need a<br />
full report of tests conducted — including<br />
accuracy. And if the test results were out of<br />
spec, how far? A certifi cate alone is not the<br />
answer to calibration. Ask to see the work.<br />
Understand more about<br />
calibration. Scan or visit<br />
http://qrs.ly/2y2kkco<br />
for videos.<br />
Not all calibrations are created equal,<br />
see why “the work” matters:<br />
www.agilent.com/find/SeeTheWork<br />
© Agilent Technologies, Inc. 2013 u.s. 1-800-829-4444 canada: 1-877-894-4414
NEW PRODUCTS AND SERVICES<br />
New Precision Temperature<br />
Controller<br />
Oven Industries features a Temperature<br />
Controller with easy-to-use software.<br />
Model 5R7-388 RoHS Compliant<br />
controller is a bi-directional control for<br />
independent thermoelectric modules or in<br />
conjunction with auxiliary or supplemental<br />
resistive heaters for both cooling and<br />
heating applications. The “H” bridge<br />
configuration of the solid state MOSFET<br />
output devices allows for the bi-directional<br />
flow of current through the thermoelectric<br />
modules. Highly efficient N-channel<br />
output devices are used for this control<br />
mode.<br />
This controller is PC programmable via<br />
an RS232 communication port for direct<br />
interface with a compatible PC. The easily<br />
accessible communications link permits a<br />
variety of operational mode configurations.<br />
Field selectable parameters or data<br />
acquisition in a half duplex mode can be<br />
performed. This controller will accept a<br />
communications cable length in accordance<br />
with RS232 interface speciations. Once the<br />
desired set parameters are established,<br />
the PC may be disconnected and Model<br />
5R7-388 becomes a unique, stand-alone<br />
controller. All parameter settings are<br />
retained in non-volatile memory.<br />
FEATURES<br />
• Full H-Bridge<br />
• 36VDC Output using split supply<br />
• P,I,D or On/Off Control<br />
• PC Configurable Alarm Circuit<br />
• RS232 Communication Port<br />
• “T” Thermocouple -328°F - 500°F<br />
From industrial temperature controllers<br />
to programmable sensors, Oven Industries<br />
creates many detailed and customized<br />
solutions for clients, designed by an<br />
expertly trained staff of engineers.<br />
For more information about<br />
the 5R7-388 controller, visit<br />
http://www.ovenind.com/bv/<br />
Products/Temperature-Controller-5R7-<br />
388__5R7-388.aspx.<br />
R&S SMW200A High-End Vector<br />
Signal Generator<br />
The new R&S SMW200A high-end<br />
vector signal generator from Rohde &<br />
Schwarz combines a baseband generator,<br />
RF generator and MIMO fading simulator<br />
in a single instrument. The vector signal<br />
generator covers the frequency range from<br />
100 kHz to 3 GHz or 6 GHz and features<br />
an I/Q modulation bandwidth of 160<br />
MHz with internal baseband. Exceptional<br />
modulation and RF characteristics make it<br />
ideal for developing high-end components,<br />
modules and complete products for<br />
wideband communications systems such as<br />
LTE-Advanced and WLAN IEEE 802.11ac.<br />
The generator performs especially well<br />
when it comes to the verification of 3G and<br />
4G base stations as well as aerospace and<br />
defense applications.<br />
The R&S SMW200A can be equipped<br />
with an optional second RF path for<br />
frequencies up to 6 GHz and with a<br />
maximum of two baseband and four<br />
fading simulator modules, giving users<br />
two full-featured vector signal generators<br />
in a single unit.<br />
In addition to the two internal RF paths<br />
provided, highly compact R&S SGS100A<br />
signal generator modules can be connected<br />
as additional RF sources and remotely<br />
controlled by the R&S SMW200A. This<br />
solution takes up only five height units<br />
for 4x4 MIMO receiver tests and provides<br />
correctly encoded baseband signals,<br />
realtime channel simulation, AWGN<br />
generation and, if required, phase-locked<br />
coupling of multiple RF paths.<br />
The excellent signal quality of the R&S<br />
SMW200A ensures high accuracy in spectral<br />
and modulation measurements. The SSB<br />
phase noise is –139 dBc (typ.) at 1 GHz<br />
(20 kHz offset). The R&S SMW200A also<br />
comes with a cleverly devised operating<br />
concept. The new touchscreen allows<br />
users to control the instrument even more<br />
intuitively with the tried and tested Rohde<br />
& Schwarz block diagram as key operating<br />
element to visualize the signal flow.<br />
Help functions are provided to quickly<br />
achieve success. Presets are provided for<br />
all important digital standards and fading<br />
scenarios. LTE and UMTS test case wizards<br />
simplify complex base station conformance<br />
testing in line with the 3GPP specification.<br />
The new high-end R&S SMW200A<br />
vector signal generator is now available<br />
from Rohde & Schwarz: http://www.rohdeschwarz.com.<br />
On Time Support Tools<br />
New Releases<br />
On Time Support is proud to announce<br />
the release of four new products<br />
based on our dramatically improved<br />
METDaemon application server.<br />
Unlock the hidden potential of your MET/<br />
TRACK database:<br />
• BC Mobile is an add-on product to<br />
Barcode Magician 1.7.1 (BCM) Plus.<br />
It is a browser based application<br />
that automates repetitive database<br />
entry tasks such as checking in/out<br />
equipment, or changing equipment<br />
status simply and consistently for<br />
quantities of assets by entering an<br />
Action Code.<br />
• New METDaemon Responder is<br />
the ideal application for creating<br />
and presenting web-based forms<br />
for collection and storage of a user’s<br />
submissions in a database for easy<br />
retrieval and analysis.<br />
• Used in conjunction with Email<br />
Notification, it’s a great value that<br />
gives any organization the ability to<br />
convert “old fashion” paper forms<br />
- that are hard to store and retrieve<br />
- into modern web-based forms to<br />
capture, record and maintain vital<br />
information.<br />
• The new METDaemon Report<br />
Viewer enables you to publicly<br />
display real-time activity to both<br />
lab users and management. The<br />
METDaemon Viewer executes and<br />
displays SQL or Crystal Reports in<br />
a web page. You can easily create<br />
activity reports for your lab and use<br />
METDaemon Viewer to display a lab<br />
status dashboard.<br />
If you use printed barcodes in your<br />
business documents, you know how<br />
difficult it is to select and use special<br />
barcode fonts and provide a sufficiently<br />
high resolution image to be readable<br />
consistently. Now you can generate<br />
barcodes (Code 128, Code 39 or 2D Data<br />
Matrix) “on the fly” for any SQL or Crystal<br />
reports (including web-based) and reports<br />
exported to a PDF format, WITHOUT THE<br />
USE OF SPECIAL INSTALLED FONTS.<br />
Adding these bar-codes to your document<br />
is a simple matter of defining the code type<br />
and supplying the text to be encoded.<br />
For more information on these products<br />
please contact OTS: 281.296.6066 or visit<br />
http://www.ontimesupport.com/.<br />
<strong>Cal</strong> <strong>Lab</strong>: The International Journal of Metrology<br />
14 Apr • May • Jun 2013
NEW PRODUCTS AND SERVICES<br />
Fluke <strong>Cal</strong>ibration 9190A Ultra-Cool<br />
Field Metrology Well<br />
Fluke <strong>Cal</strong>ibration, a leader in precision<br />
calibration instrumentation and software,<br />
introduces the 9190A Ultra-Cool Field<br />
Metrology Well, a small, lightweight,<br />
and accurate dry-block calibrator with<br />
best-in-class stability.<br />
The 9190A is ideal for pharmaceutical,<br />
biomedical and food processing<br />
applications that demand strict<br />
quality control and regulatory process<br />
compliance, including on-location<br />
validation and calibration of RTDs,<br />
thermocouples, thermometers, and other<br />
temperature sensors.<br />
The 9190A conforms to EURAMET<br />
cg-13 guidelines for best measurement<br />
practices for temperature dry-block<br />
calibrators. This ensures that the 9190A<br />
specifications for accuracy, stability,<br />
axial (vertical) uniformity, radial<br />
(well-to-well) uniformity, loading, and<br />
hysteresis have been thoroughly and<br />
carefully defined and tested.<br />
It has a wide temperature range (-95 to<br />
140 degrees Celsius) to cover the coldest<br />
and warmest temperatures required in<br />
pharmaceutical, biomedical and food<br />
processing applications, operating at<br />
ultra-cold temperatures not typically<br />
available with a calibration bath. The<br />
9190A uses no bath fluids, keeping<br />
clean rooms clean, making it easier to<br />
transport, and delivering faster heating/<br />
cooling rates. It offers best-in-class<br />
temperature stability (plus-or-minus<br />
0.015 degrees Celsius) for consistent,<br />
accurate results.<br />
The 9190A with “process” option<br />
features 4-20 mA connectors, a reference<br />
thermometer input, 4-wire PRT/RTD<br />
input with an accuracy of plus-or-minus<br />
0.02 degrees Celsius, and a reference<br />
sensor control to minimize the effects of<br />
the axial gradient when a reference PRT<br />
is aligned with short sensors.<br />
For more information, visit: http://<br />
us.flukecal.com/products/temperaturecalibration/industrial-calibrators/fieldmetrology-wells/9190a-ultra-cool-field.<br />
www.entegra-corp.com<br />
240-672-7645<br />
Providing Reference Pulse Generators for Oscilloscope <strong>Cal</strong>ibrations<br />
Entegra’s Pulse Generators:<br />
Models available for calibrating the step response of 12 GHz,<br />
20 GHz, and 50 GHz bandwidth oscilloscopes<br />
Transition durations down to 9 ps (10 % - 90 %) and both the<br />
positive and negative transitions are fast<br />
550 mV step amplitude typical<br />
Differential output model available<br />
Apr • May • Jun 2013<br />
15<br />
<strong>Cal</strong> <strong>Lab</strong>: The International Journal of Metrology
NEW PRODUCTS AND SERVICES<br />
Agilent High-Sensitivity Multiport<br />
Optical Power Meters<br />
The two- channel N7747A and fourchannel<br />
N7748A bring the industry-leading<br />
sensitivity of the 81634B sensor module to<br />
the compact multichannel N77 platform,<br />
with updated memory size and datatransfer<br />
speed.<br />
The Agilent N7747A and N7748A optical<br />
power meters enable engineers to make<br />
parallel multiport measurements and<br />
monitor weak signals and small signal<br />
changes with high precision in, for example,<br />
communications or sensing applications.<br />
The meters can detect power levels down<br />
to -110 dBm and log data at intervals<br />
down to 25 μs with up to 1 million points<br />
per channel. An equally large data buffer<br />
supports simultaneous measurement and<br />
data transfer.<br />
With these features and specifications,<br />
the meters make it easy for engineers to<br />
monitor signal stability and transient events<br />
for long periods. Up to eight power-meter<br />
channels fit in a single 19-inch rack-height<br />
unit. Each channel also has a front-panel<br />
BNC connector that delivers analog output<br />
voltage proportional to the measured<br />
signal.<br />
Like the faster N7744A and N7745A,<br />
these new power meters can be used with<br />
N77xx viewer software for simple control<br />
and reading and are programmable with<br />
the same set of SPCI commands as the rest<br />
of Agilent’s optical power-meter portfolio.<br />
The latest version of the popular 816x VXI<br />
plug&play driver also adds support for<br />
these products. Computer interfaces are<br />
provided for USB 2.0, LAN and GPIB.<br />
In addition to high sensitivity, low noise<br />
and solid stability, the N7747A and N7748A<br />
also provide high relative accuracy like<br />
the 81634B modules, with extremely low<br />
polarization dependence and spectral<br />
ripple as well as specified linearity. This<br />
combines to make these power meters an<br />
excellent choice in setups for measuring<br />
insertion loss and lowest PDL in passive<br />
optical components.<br />
Additional information about Agilent’s<br />
new high-sensitivity optical power meters is<br />
available at www.agilent.com/find/N7747A<br />
and www.agilent.com/find/N7748A.<br />
Rohde & Schwarz NRP-Z58<br />
Coaxial Power Sensor<br />
Users working with a frequency range<br />
over 67 GHz now also benefit from the<br />
unique features of the thermal power<br />
sensors from Rohde & Schwarz. The new<br />
R&S NRP-Z58 is the world’s first power<br />
sensor that covers the frequency range<br />
continuously from DC to 110 GHz.<br />
Rohde & Schwarz has added the R&S<br />
NRP-Z58 to its successful portfolio of power<br />
sensors. The sensor’s high measuring speed<br />
of over 300 measurements per second<br />
in buffered mode allows especially fast<br />
power measurements. With a range of<br />
55 dB (–35 dBm to 20 dBm), it offers the<br />
largest dynamic range (DC to 110 GHz) of<br />
any thermal power sensor on the market.<br />
When performing relative measurements<br />
such as amplification and reflection<br />
measurements, the R&S<br />
NRP-Z58 delivers extremely precise<br />
measurement results thanks to its high<br />
linearity of 0.01 dB. The ball bearing<br />
1.00 mm coaxial plug can be screwed<br />
conveniently and securely onto the<br />
jack of the measuring instrument to<br />
provide extremely high measurement<br />
reproducibility.<br />
Like all thermal power sensors from<br />
Rohde & Schwarz, the R&S NRP-Z58 can<br />
be connected directly to a PC via a USB<br />
interface in order to analyze measurement<br />
results.<br />
For users of the R&S ZVA110 network<br />
analyzer, the power sensor is the perfect<br />
addition. It comes equipped with the<br />
appropriate 1 mm socket for connecting<br />
the R&S NRP-Z58. The power sensor<br />
makes it possible to achieve a consistent<br />
power calibration up to 110 GHz using a<br />
single instrument and without any adapter.<br />
Before, this required multiple power<br />
sensors and various adapters.<br />
In addition, the power sensor helps users<br />
working in development, production and<br />
maintenance to determine the average<br />
power of CW signals, pulsed signals or<br />
even complex digitally modulated signals.<br />
The new R&S NRP-Z58 thermal power<br />
sensor is now available from Rohde &<br />
Schwarz.<br />
The Modal Shop 9110D<br />
The 9110D Digital Portable Vibration<br />
<strong>Cal</strong>ibrator is the newest product in the<br />
9100 Series Portable Accelerometer<br />
<strong>Cal</strong>ibrators from The Modal Shop,<br />
a PCB Group Company. The 9110D<br />
stands out with new features that enable<br />
users to take that extra step in portable<br />
calibration, including generating ISO<br />
17025-compliant calibration certificates.<br />
The 9110D Digital Portable Vibration<br />
<strong>Cal</strong>ibrator is a compact, battery-powered<br />
and completely self-contained vibration<br />
reference source which can be conveniently<br />
used to calibrate individual sensors,<br />
vibration switches and data collectors, as<br />
well as to validate the entire measurement<br />
channel of a condition monitoring or<br />
recording system.<br />
Designed for use in-situ, including<br />
on the manufacturing plant floor, the<br />
unit calculates and displays test sensor<br />
sensitivity on the readout screen in real time.<br />
It also has built-in ICP® input for common<br />
piezoelectric accelerometers and can save<br />
up to 500 calibration records directly to the<br />
unit’s internal memory. Users can copy<br />
records to the included USB flash drive<br />
with Report Generation Workbook via the<br />
unit’s USB port. Saved calibration data is<br />
then transferred to a computer where the<br />
user can easily generate and print an ISO<br />
17025-compliant customizable calibration<br />
certificate. This product provides enhanced<br />
stability and superior vibration calibration<br />
over an extended 7 Hz (420 CPM) to 10<br />
kHz (600,000 CPM) frequency range, at<br />
amplitudes up to 20 g pk (196 m/s²).<br />
The 9110D features an integral precision<br />
quartz reference accelerometer and closedloop<br />
level control, packaged in a rugged<br />
Pelican® Storm case with two press and<br />
pull latches. The 9110D is always ready<br />
for travel to industrial test sites or bringing<br />
laboratory accuracy to the field.<br />
Visit our calibration web page at www.<br />
modalshop.com/calibration.<br />
<strong>Cal</strong> <strong>Lab</strong>: The International Journal of Metrology<br />
16 Apr • May • Jun 2013
NEW PRODUCTS AND SERVICES<br />
Low-Temperature Benchtop Chillers<br />
from PolyScience<br />
A line of compact, powerful, and highly<br />
affordable low-temperature chillers are<br />
available from PolyScience. Designed to<br />
maximize bench space, LS-Series / LM-<br />
Series / MM-Series Chillers provide up<br />
to 1290 watts of cooling at 20°C, making<br />
them ideal for use with rotary evaporators,<br />
jacketed incubators, small reaction vessels,<br />
spectrophotometers, chromatography<br />
columns, condensers, and other devices<br />
that require robust heat removal.<br />
Three different models of PolyScience<br />
compact chillers are available: The LS-<br />
Series, which has a working temperature<br />
range of -20° to +40°C and provides 475<br />
watts of cooling at -10°C; the LM-Series,<br />
with a working temperature range of -10°<br />
to +30°C and a 230 watt cooling capacity<br />
at -10°C; and the MM-Series, which has a<br />
working temperature range of -5° to +50°C<br />
and provides 129 watts of cooling at -5°C.<br />
All three models control temperature with<br />
±0.1°C stability and are equipped with a low<br />
flow rate alarm, user-adjustable high and<br />
low temperature alarms, a top-mounted fill<br />
port with built-in fluid filter, lighted fluid<br />
level indicator, and washable rigid-frame<br />
air filter.<br />
LS-Series Chillers are available with<br />
either a centrifugal or turbine pump. LMand<br />
MM-Series Chillers are available with<br />
two different centrifugal pumps. For more<br />
information, visit the PolyScience website<br />
at www.polyscience.com.<br />
LaserLinc SmartLinc Processor<br />
The SmartLinc processor integrates easily<br />
into the line control system communicating<br />
via Ethernet or serial port to the PLC. A<br />
single unit provides a communications<br />
link for one, two, or three of LaserLinc’s<br />
full line of single, dual, and triple-axis laser<br />
scanning micrometers.<br />
To simplify communication<br />
management, the processor transmits data<br />
to the PLC at user-defined intervals and<br />
to user-specified locations in the PLC via<br />
tags. Once configured and integrated, the<br />
SmartLinc provides unattended and reliable<br />
operation.<br />
Easy-to-use configuration and<br />
diagnostics tools enable the user to access<br />
and manage all SmartLinc devices over<br />
the plant network, or by Ethernet cableconnection<br />
from a laptop directly to a<br />
SmartLinc device.<br />
LaserLinc is the preeminent manufacturer<br />
of accurate and adaptable non-contact laser<br />
and ultrasonic systems for OD, ID, wall<br />
thickness, eccentricity, and concentricity<br />
across many industries including wire,<br />
cable, medical and other tubing, hose, pipe<br />
and fiber.<br />
LaserLinc’s systems can provide a time-topayoff<br />
in months, even weeks by reducing<br />
scrap and waste, shortening startup times,<br />
ensuring product quality, and through<br />
process improvement and optimization.<br />
www.laserlinc.com.<br />
New METDaemon Suite Released<br />
from On Time Support®<br />
Expanding the capabilities of MET/TRACK systems.<br />
(New) METDaemon Responder<br />
Create Web Forms for managing data collection that can be analyzed within the<br />
database. Combined with Email Notification you can close the loop when<br />
reporting Out Of Tolerance Notifications, Due Date Extensions, Customer<br />
Surveys, and other processes that require notifications.<br />
(New) METDaemon Report Viewer<br />
View SQL reports on a schedule and Crystal Reports<br />
on demand. Provides enhanced report formatting<br />
capabilities with color and sorting.<br />
(New) BC Mobile<br />
A web based version of Barcode Magician, you can<br />
use existing action codes and implement database<br />
changes from a browser. It will even run from some<br />
portable Android based devices.<br />
(New) METDaemon Barcode Generator<br />
Print barcodes on reports emails and other documents without the hassle of<br />
installing special fonts, drivers, or special report templates.<br />
(Improved) Metrology Xplorer 2<br />
We help you get the most from your calibration software!<br />
Contact On Time Support for more information.<br />
2812966066<br />
www.ontimesupport.com<br />
Agilent Technologies E5810A<br />
LAN/GPIB/USB Gateway<br />
Agilent Technologies Inc. announced the<br />
Agilent E5810B LAN/GPIB/USB gateway,<br />
the next-generation replacement for the<br />
E5810A with added USB capability. The<br />
new gateway allows users to connect and<br />
control, over a standard local-area network,<br />
up to 14 GPIB instruments, up to four USB<br />
instruments via a self-powered hub, and an<br />
RS-232 instrument.<br />
With the gateway’s improved GPIB<br />
transfer rate of 1.2 MB/s, engineers can<br />
reduce test time and improve production.<br />
The E5810B supports 1000BASE-T (1<br />
Gigabit) LAN/Ethernet as well as 100BASE-<br />
TX and 10BASE-T to meet the demands of<br />
higher network bandwidth.<br />
Designed for ease of use, the E5810B<br />
comes with a built-in LCD display, allowing<br />
users to check the IP address of the gateway<br />
for quick setup. Users can easily configure<br />
the gateway via a password-protected Web<br />
interface.<br />
The E5810B allows multiple users in<br />
different locations to access a centrally<br />
located test system. Connecting a wireless<br />
router to the E5810B enables engineers to<br />
wirelessly control instruments from a PC<br />
where LAN connection is unavailable or<br />
inconvenient.<br />
The E5810B LAN/GPIB/USB gateway is<br />
now available worldwide. Information on<br />
the E5810B is available at www.agilent.com/<br />
find/E5810B_pr.<br />
<strong>Cal</strong> <strong>Lab</strong>: The International Journal of Metrology<br />
18 Apr • May • Jun 2013
NEW PRODUCTS AND SERVICES<br />
New High Stability<br />
Hygrometer 473<br />
Rotronic Instrument Corporation<br />
New York has agreed to represent the<br />
RH Systems 473 dew point hygrometer<br />
throughout the Americas. RH Systems is<br />
a world renowned developer of precision<br />
chilled mirror hygrometers that are the<br />
first choice for standards laboratories and<br />
research organizations worldwide<br />
The 473 features a cable mounted dew<br />
point measuring head that can be directly<br />
mounted into the chamber working space.<br />
Temperature is measured with a PRT<br />
(platinum resistance thermometer) than<br />
can be directly mounted to the measuring<br />
head for simple use, or cable-mounted<br />
for easy repositioning to determine<br />
spatial temperature and %RH variations<br />
of the test environment. Dew point and<br />
temperature values are used to calculate<br />
relative humidity (%RH) or any other<br />
humidity units required by the user.<br />
Measurement data is displayed on a<br />
three line, user configurable touch-screen<br />
display in either numerical or graphical<br />
format. Serial digital and optional analog<br />
outputs allow the user to log and record<br />
data for later analysis or to meet validation<br />
requirements.<br />
The 473 provides highly precise and<br />
stable reference measurements that are<br />
essential to achieve low uncertainty<br />
calibration validation of RH generators,<br />
climatic test facilities and pharmaceutical<br />
stability chambers. With the proven long<br />
term stability and intuitive user interface,<br />
the 473 makes attaining the most precise<br />
humidity measurements possible for any<br />
user. http://rotronic-usa.com/.<br />
Micro-Dimensionair II incorporates all<br />
the benefits of the enhanced Micro-Maxum<br />
II line including: Dynamic Max, Min,<br />
TIR; two point difference measurement;<br />
Multiplier Factor for ratio measurements;<br />
indicator serial number identification;<br />
resolution to 20 µin; selectable, continuous<br />
output; and longer battery life. All standard<br />
features are retained, such as inch/metric<br />
measurement in digital or analog display;<br />
bi- and unilateral tolerances with presets;<br />
multiple data output formats; auto-zeroing;<br />
and normal/reverse settings for ID/OD.<br />
For more information visit http://www.<br />
mahr.com.<br />
Micro-Dimensionair® II<br />
by Mahr Federal<br />
Mahr Federal is introducing the new<br />
Micro-Dimensionair® II as the next<br />
generation of its well-established Micro-<br />
Dimensionair line of portable air gages.<br />
The new Micro-Dimensionair II<br />
incorporates the enhanced Micro-Maxum®<br />
II Digital Indicator and an interchangeable<br />
handle to provide accurate, convenient<br />
readouts at the measurement site. The<br />
digital dial on the new Micro-Dimensionair<br />
II rotates through 270 degrees for easy<br />
viewing, and the IP-54 rated gage provides<br />
the exceptional accuracy and repeatability<br />
Mahr Federal users have come to expect.<br />
Apr • May • Jun 2013<br />
19<br />
<strong>Cal</strong> <strong>Lab</strong>: The International Journal of Metrology
NEW PRODUCTS AND SERVICES<br />
CAL-TOONS by Ted Green teddytoons@verizon.net<br />
Digital Surf Mountains® 7<br />
Release<br />
Digital Surf announced the official<br />
release of its new Mountains® 7 software<br />
for surface imaging and metrology. New<br />
cutting-edge 3D imaging, compatible with<br />
OpenGL and Direct3D, makes it possible<br />
to visualize every detail of micrometric<br />
and nanometric surfaces in near-perfect<br />
lighting conditions. New solutions for<br />
scanning electron microscopes and Raman<br />
and FT-IR spectrometers - combined<br />
with enhanced existing solutions for<br />
3D optical microscopes, scanning probe<br />
microscopes and profilometers - mean<br />
that Mountains® 7 is the most complete<br />
surface analysis solution in its class.<br />
Furthermore, MountainsÒ 7’s new smart<br />
user environment makes metrology report<br />
creation faster and sleeker than ever.<br />
To speed up analysis report creation, the<br />
visual and analytical studies that make up<br />
the body of a report have been streamlined<br />
in Mountains® 7. All metrological results<br />
are grouped in a single results manager<br />
panel where tolerances can be specified,<br />
pass/fail status is displayed automatically,<br />
and results can be exported in Excelcompatible<br />
format. Layers in multi-layer<br />
surface data files - from multi-channel 3D<br />
optical microscopes and from scanning<br />
probe microscopes – are easily identified<br />
and selected with miniature icons that<br />
provide a preview of each layer. New<br />
functions include mapping of local surface<br />
properties and the automatic removal of<br />
outliers present on surfaces measured by<br />
3D optical microscopes.<br />
Mountains® 7 includes two major<br />
additions to the Mountains® software<br />
product line. MountainsMap® SEM is a<br />
new 3D imaging and metrology product<br />
for SEM’s and includes reconstruction of<br />
3D surfaces (x, y and z in length units)<br />
from stereo pairs, anaglyphs and quads.<br />
MountainsMap® Hyperspectral is a new<br />
product for Raman and FT-IR spectrometers<br />
that makes it possible to manipulate spectra<br />
and hypercubes interactively, filter them,<br />
generate compositional density maps<br />
and visualize “flattened” hypercubes<br />
in 3D. Key MountainsMap® SEM and<br />
MountainsMap® Hyperspectral functions<br />
are also available, respectively, in the new<br />
SEM and Spectrometry optional modules<br />
for some MountainsMap® products.<br />
Web site: www.digitalsurf.com.<br />
<strong>Cal</strong>ifornia Instruments BPS Series<br />
High-Power Converters<br />
AMETEK Programmable Power, the<br />
global leader in programmable AC<br />
and DC power test solutions (www.<br />
programmablepower.com), has released<br />
the <strong>Cal</strong>ifornia Instruments BPS Series<br />
of high-power AC sources/frequency<br />
converters.<br />
Available with outputs ranging from<br />
30 kVA to 180 kVA, the BPS is the latest<br />
series of products to use AMETEK's highperformance,<br />
pulse-width modulation<br />
(PWM) switching technology to provide<br />
cost-effective solutions for AC power test<br />
applications. The BPS Series supports<br />
four different communications busses and<br />
has a powerful AC transient generation<br />
capability, making it ideal for commercial<br />
instrumentation manufacturing, automatic<br />
test stations, AC motor test, and avionic<br />
frequency conversion.<br />
Modular architecture allows chassis<br />
to be paralleled for high power. The BPS<br />
Series offers a wide output frequency range<br />
of 16 to 819 Hz, making it well-suited for<br />
aerospace applications. For higher power<br />
requirements, users can simply parallel the<br />
BPS Series in a multi-cabinet configuration.<br />
To meet the needs of manufacturers of<br />
high-power equipment and appliances that<br />
must test their products over a wide range<br />
of input line conditions, the BPS Series<br />
offers built-in output transient generation.<br />
This feature allows users to simulate a wide<br />
variety of AC line conditions. Transient<br />
generation is independent, yet time<br />
synchronized, on all three phases. Accurate<br />
phase angle control and synchronized<br />
transient list execution provides accurate<br />
positioning of AC output events.<br />
The BPS Series combines compactness,<br />
robustness and functionality in a compact<br />
floor-standing chassis. This higher power<br />
density has been accomplished without the<br />
need to resort to elaborate cooling schemes<br />
or additional installation wiring. Users<br />
simply roll the unit to where they want<br />
it, plug it in, and the BPS Series is ready<br />
to operate.<br />
The BPS Series can be programmed<br />
manually via the front panel or remotely<br />
with USB, RS-232, IEEE-488 (GPIB) or<br />
optional Ethernet interfaces. A Graphical<br />
Users Interface Software is included with<br />
all BPS Series allowing easy programming<br />
of all functions. Users can monitor the<br />
output of an AC source on the BPS’ highcontrast<br />
6”x8” LCD display, whether or<br />
not the unit was programmed from the<br />
front panel or via one of the remote-control<br />
interfaces.<br />
To learn more about any of the<br />
company’s programmable power supplies<br />
and programmable loads, contact AMETEK<br />
Programmable Power Sales toll free at 800-<br />
733-5427, or 858-458-0223, or by email at<br />
sales.ppd@ametek.com or an authorized<br />
AMETEK Programmable Power sales<br />
representative, who can be located by<br />
visiting http://www.programmablepower.<br />
com/contact/.<br />
<strong>Cal</strong> <strong>Lab</strong>: The International Journal of Metrology<br />
20 Apr • May • Jun 2013
© 2012 Lockheed Martin Corporation<br />
MISSION SUCCESS<br />
IS OFTEN MEASURED IN PARTS-PER-MILLION<br />
Lockheed Martin <strong>Cal</strong>ibration Services. Comprehensive, affordable, highly accurate<br />
calibration support. Delivered by our experts with precision and care for 30 years.<br />
ISO/IEC 17025:2005 Accreditation, A2LA 2258.01<br />
1-800-275-3488<br />
www.lockheedmartin.com/calibration
<strong>METROLOGY</strong> <strong>101</strong><br />
Piston Prover Design with Additional<br />
Measurement Capabilities and Reduced<br />
Flow Interaction<br />
Edward Morrell<br />
Mesa <strong>Lab</strong>oratories<br />
High-speed clearance sealed piston provers for measuring gas flow rates have been available for over twenty years and<br />
have gained wide acceptance as a fast, cost-effective, primary calibration instrument for gas flow. High-speed piston<br />
provers are available for measuring flow rates from 0.5 sccm to 500,000 sccm with measurement uncertainties of up to<br />
0.15% [1, 2, 3, 4]. This paper describes new advances in high-speed piston prover design.<br />
I. Introduction<br />
Many technologies exist to measure gas flow rates. A<br />
few are:<br />
• Differential pressure instruments – measure<br />
pressure drop as gas flows past an obstruction.<br />
• Constant-volume (rate-of-rise) instruments –<br />
measure pressure and temperature rise as gas fills<br />
an evacuated volume.<br />
• Thermal based instruments – measure heat transfer<br />
as gas flows over a heated element.<br />
• Constant-pressure positive displacement<br />
instruments, such as piston provers – measure<br />
the physical displacement of a mechanical element<br />
by the flow of gas.<br />
Piston prover designs have evolved over many years.<br />
This paper discusses the latest piston prover evolution<br />
featuring a horizontal piston design, which can measure<br />
corrosive gases, and automatically apply compressibility<br />
factor correction for non-ideal gases. The horizontal<br />
design, while more complex than previous vertical tube<br />
design, allows for faster measurement speed with reduced<br />
dynamic pressure changes that can introduce measurement<br />
uncertainty. Additionally, this new unit is engineered from<br />
corrosive resistant materials allowing many non-inert gases<br />
to be measured.<br />
II. Piston Prover Design Chronology<br />
Figure 1. Mercury Seal Piston Prover.<br />
1. Mercury-sealed provers were in use for many<br />
years and featured a rigid machined piston of<br />
significant mass that utilized a mercury seal<br />
between a glass tube and the outside diameter<br />
of the piston. A significant advantage to these<br />
instruments was that the mercury provided a<br />
<strong>Cal</strong> <strong>Lab</strong>: The International Journal of Metrology<br />
22 Apr • May • Jun 2013
<strong>METROLOGY</strong> <strong>101</strong><br />
Figure 2. High-Speed Vertical Clearance-<br />
Sealed Piston Prover.<br />
Figure 3. High-Speed Horizontal Clearance-Sealed Piston Prover.<br />
gas-tight low friction seal between the glass and<br />
the tube. However, mercury has the disadvantage<br />
of toxicity and the piston speed must be kept<br />
very slow to avoid loss of the mercury seal. Most<br />
mercury sealed piston provers have by now been<br />
removed from service due to environmental<br />
concerns. Mercury piston provers required a<br />
skilled operator to adjust a valve increasing the<br />
gas pressure on the bottom of the piston to the<br />
point that the piston floats. After this adjustment,<br />
the valve was fully closed and the time required to<br />
slowly displace the piston was used to determine<br />
the volumetric gas flow rate.<br />
2. High-speed vertical clearance-sealed piston<br />
provers have been in existance for more then 20<br />
years and feature a piston machined to very tight<br />
tolerances minimizing clearance between the<br />
piston and tube, typically less than 10 microns.<br />
The tightly fitted piston reduces leakage around<br />
the piston to almost negligible rates. A 44 mm<br />
diameter piston with a measurement range of 500<br />
to 50,000 ccm will typically have a clearance leak<br />
rate of 1 ccm. Piston leakage for these instruments<br />
is measured and stored in the electronics memory<br />
and added to the flow measurement.<br />
The piston and cylinder are made of materials<br />
with matching coefficients of expansion, thus<br />
maintaining a consistant clearance dimension<br />
with changing temperature. Measurements are<br />
automated with a button push closing a bypass<br />
valve. The piston is displaced by the flowing gas<br />
through a set acceleration distance until a timing<br />
start point is reached and the time required to<br />
displace the piston through a calibrated volume<br />
is measured. After the measurement is complete,<br />
the bypass valve opens and the piston falls to<br />
the bottom of the tube at which time another<br />
measurement cycle can begin.<br />
3. High-speed horizontal clearance-sealed piston<br />
provers replace the vertical tube with a horizontal<br />
tube and a piston re-engineered for low-mass<br />
and low-friction. In comparison to the vertical<br />
tube, which requires a piston of sufficient mass<br />
to return the piston to the bottom of the tube,<br />
the horizontal tube uses a low mass, low friction<br />
piston and valves which alternate the gas flow<br />
direction in the tube. As gas flows, optical sensors<br />
measure the piston oscillation across the tube. The<br />
horizontal tube-piston requires less gas pressure to<br />
displace the piston resulting in faster bi-directional<br />
readings and reducing pressure effects on the<br />
measured flow source.<br />
Apr • May • Jun 2013<br />
23<br />
<strong>Cal</strong> <strong>Lab</strong>: The International Journal of Metrology
<strong>METROLOGY</strong> <strong>101</strong><br />
III. Clearance Seal Piston Dynamics<br />
The flow dynamics for the piston in a clearance sealed<br />
piston prover can be modeled as a combined laminar<br />
Couette – Poiseuille Flow (Figure 4).<br />
<br />
<br />
<br />
The Couette flow component represents the piston<br />
motion relative to the cylinder wall and is accounted for<br />
by setting the effective piston diameter at the mid-point<br />
between the tube inside diameter and the piston outside<br />
diameter. The Poiseuille flow component is driven by<br />
the pressure differential P displacing the piston and is<br />
accounted for by the piston leakage calibration. The piston<br />
leakage rate for a vertical piston prover is given by:<br />
where<br />
<br />
<br />
Figure 4. Piston Clearance Flow Dynamics.<br />
Q = Gas Leak Rate,<br />
P = Gas Pressure,<br />
x =Piston Height,<br />
h = Gap Clearance,<br />
W = Piston Radius, and<br />
μ = Gas Viscosity.<br />
Q = (P/x) h 3 W/12μ, (1)<br />
The gas pressure P, once the piston of mass m is fully<br />
accelerated and assuming the piston moves without drag,<br />
is given by:<br />
P = mg. (2)<br />
For the horizontal piston prover, the gas pressure P<br />
required to displace the piston is proportional to the<br />
coefficient of friction k of the piston material:<br />
P = kmg. (3)<br />
The horizontal piston prover piston was designed<br />
from materials with a coefficient of friction of 0.1 to 0.2.<br />
Additionally, the horizontal piston was engineered with<br />
a lower mass piston further reducing the pressure. As<br />
previously noted, the piston leakage with a precision fitted<br />
piston is very small. But with the lighter mass piston of the<br />
horizontal design and the use of low friction materials, the<br />
pressure reduction to displace the piston proportionally<br />
reduces the piston leak rate Q.<br />
IV. Horizontal Piston Prover<br />
Application Advantages<br />
<br />
<br />
<br />
A piston prover initiating flow reading requires the<br />
measuring piston to accelerate. This acceleration will cause<br />
a pressure pulse to occur [2,<br />
5]. For this reason, high-speed<br />
<br />
<br />
vertical pistons provers delay<br />
flow measurement to allow<br />
the piston to accelerate and<br />
the pressure pulse to subside<br />
[2]. Under typical laboratory<br />
conditions, the pressure pulse<br />
has no effect on measurement<br />
uncertainty. However, accurate<br />
flow measurements can be<br />
compromised on a system with<br />
large connecting gas volume between the source of the gas<br />
and the piston prover. The large connecting volume of gas<br />
between a flow generator and the piston prover act as storage<br />
for the gas as pressure changes occur. Many operators may<br />
be unaware of this or cannot reduce connecting volumes. For<br />
this reason, it is desirable to minimize any pressure pulses<br />
produced during flow measurement by a piston prover.<br />
The vertical design piston prover required a piston of<br />
sufficient mass to allow gravity to return the piston to<br />
the bottom of the tube after a measurement is complete.<br />
In the horizontal piston prover, the piston is displaced in<br />
both directions by the flow of the gas. Since the horizontal<br />
piston does not use gravity to reset the piston, the piston<br />
mass was reduced. In our instruments, the piston mass of<br />
the horizontal piston is approximately 50% less than the<br />
vertical piston. As previously noted for a horizontal piston,<br />
the pressure required to slide the piston is proportional to<br />
the weight of the piston times the coefficient of friction.<br />
Figure 5 shows the pressure pulse of a vertical piston prover<br />
and the reduced pressure pulse generated by the horizontal<br />
piston prover at the same flow rate.<br />
<br />
<br />
<br />
<br />
<br />
Figure 5. Piston Prover Pressure Pulse.<br />
<br />
<br />
<br />
<br />
<strong>Cal</strong> <strong>Lab</strong>: The International Journal of Metrology<br />
24 Apr • May • Jun 2013
<strong>METROLOGY</strong> <strong>101</strong><br />
V. Corrosive Gas Measurement<br />
An additional advancement made in the engineering<br />
of the horizontal piston design was to add measurement<br />
capability for many corrosive gases. Internal components<br />
were designed from corrosive resistant materials:<br />
stainless steel, borosilicate glass, Teflon, and high purity<br />
graphite. In addition, positive displacement gas flow<br />
instruments measure volumetric flow. Since gases<br />
are compressible, volumetric flow measurements are<br />
converted to standardized flow measurements. The<br />
definition of a standardized flow rate is the volume of<br />
gas transported per unit time across a boundary with the<br />
measured gas volume converted to the volume the gas<br />
would occupy at a defined pressure and temperature.<br />
To make this conversion, a temperature transducer and<br />
pressure transducer inside the piston prover measure gas<br />
temperature and gas pressure. The conversion between<br />
volumetric flow and standardized flow can be derived<br />
from the ideal gas law giving the formula:<br />
V s = V f × (<br />
_______ Pg<br />
<strong>101</strong>.325 ) × ____________<br />
( 273.15 + Ts )<br />
( 273.15 + Tg ) , (4)<br />
where V s is the flow rate for standardized conditions, V f<br />
is the measured volumetric flow rate, Pg is the measured<br />
gas pressure in kPa, Ts is the specified standardization<br />
temperature in degrees centigrade and Tg is the measured<br />
gas temperature in degrees centigrade.<br />
While the ideal gas law provides sufficient accuracy<br />
when measuring inert gases across the narrow temperature<br />
and pressure of a typical laboratory environment, corrosive<br />
gases deviate from the ideal gas law. For this reason we<br />
have added compressibility factor correction needed for<br />
the non-ideal behavior of corrosive gases. Compressibility<br />
factor is a correction for gas property deviation from ideal<br />
behavior. With compressibility factor the conversion<br />
formula becomes:<br />
V s = V f × ( Z (Ps,Ts)<br />
_______<br />
Z (Pm,Tm)<br />
) ( × _______ Pg ____________<br />
(273.15 + Ts)<br />
<strong>101</strong>.325<br />
) ×<br />
(273.15 + Tg) . (5)<br />
The additional terms: Z (Ps,Ts) is the gas compressibility<br />
factor at standardized conditions and Z (Pm,Tm) is the gas<br />
compressibility factor at the measured gas temperature<br />
and pressure. To automatically apply compressibility<br />
factor, the operator of the instrument selects the gas species<br />
being tested and a look up table in the instrument applies<br />
compressibility factor corrections. The compressibility<br />
factors used are derived from the NIST Reference Fluid<br />
Thermodynamics and Transport Properties Database<br />
(REFPROP) [6] .<br />
VI. Conclusions<br />
The horizontal design piston prover expands the use<br />
of high-speed, clearance-sealed piston prover technology<br />
by reducing dynamic measurement pressure pulses.<br />
While under controlled conditions, pressure pulses do<br />
not present measurement difficulties. Many industrial<br />
installations requiring accurate flow measurement have<br />
large connecting or even unknown connecting volumes<br />
between the flow generator and the point of flow<br />
measurement. Similarly, many industrial applications,<br />
particularly the semiconductor industry, use corrosive<br />
gases in the manufacturing process. By engineering a piston<br />
prover with corrosive resistant material, non-inert gases can<br />
now be measured where previously measurements could<br />
only be done with great difficulty or with less accurate<br />
measurement technologies.<br />
References<br />
[1] H. Padden, “High-speed Prover System for Cost-<br />
Effective Mass Flow Meter and Controller <strong>Cal</strong>ibrations,”<br />
NCSL International Workshop and Symposium, San<br />
Diego, CA, August 4-8, 2002.<br />
[2] H. Padden, “Development of a 0.2% High-Speed Dry<br />
Piston Prover,” Measurement Science Conference,<br />
Anaheim, CA, January 16-17, 2003.<br />
[3] H. Padden, “Extending the Range of Gas Piston<br />
Provers,” 7th Annual Symposium for Fluid Flow<br />
Measurement.<br />
[4] H. Padden, “Development of a Ultra Low Flow Fast<br />
Primary Gas Prover,” Measurement Science Conference,<br />
Anaheim, CA, January 16-17, 2003.<br />
[5] J. Kutin, G. Bobovnik, and I. Bajsic, “Dynamic Effects<br />
In a Clearance-Sealed Piston Prover for Gas Flow<br />
Measurements,” Metrologia 48 (2011).<br />
[6] E.W. Lemmon, M.L. Huber, M.O. McLinden, NIST<br />
Standard Reference Database 23: Reference Fluid<br />
Thermodynamic and Transport Properties-REFPROP,<br />
Version 9.0, National Institute of Standards and<br />
Technology, Standard Reference Data Program,<br />
Gaithersburg, 2010.<br />
Edward Morrell, Mesa <strong>Lab</strong>oratories, 10 Park Place, Butler,<br />
NJ 07405 USA, emorrell@mesalabs.com.<br />
Apr • May • Jun 2013<br />
25<br />
<strong>Cal</strong> <strong>Lab</strong>: The International Journal of Metrology
Metrology:<br />
Standardize and Automate!<br />
Mark Kuster<br />
Pantex Metrology<br />
Metrology revolves around standards—measurement standards, normative standards, standard measurement practices,<br />
etc.—to achieve consistent quality results. To remain competitive, metrology, like other industries, also depends on<br />
automation and standardized interoperability to attain and enhance that quality at reduced cost. Witness the long history<br />
of automated calibration software and the more recent laboratory management systems. But metrology encompasses<br />
more than just calibration and workload management: Consider documentation, uncertainty analysis, conformance testing<br />
risk analysis, service procurement, accreditation, interlaboratory comparisons and proficiency tests, specification use and<br />
development, product inspections, etc. How many tasks have we standardized and automated, and how many consume<br />
resources at every repetition? Why do we still handle paper calibration certificates and their PDF cousins, and manually<br />
search accreditation scopes? Why don’t our certificates contain full traceability chains? Do we provide customers obviously<br />
valuable services or just increase their overhead costs? This paper highlights some technological opportunities that the<br />
measurement community has not embraced widely, if at all, and suggests that more aggressive standardized information<br />
infrastructure adoption would help meet global economic and quality challenges.<br />
Introduction<br />
Ask yourself the following questions:<br />
• Why do we still handle paper calibration certificates<br />
or their PDF cousins and manually extract their<br />
content?<br />
• Why do we manually search and interpret<br />
accreditation scopes and instrument specifications?<br />
• Why do our certificates not include full traceability<br />
chains to the SI and itemize each intermediate<br />
measurement process uncertainty contributor?<br />
• Why do we manually create and maintain uncertainty<br />
budgets for the thousands of unique test points a<br />
typical laboratory supports?<br />
• Why do we provide customers a list of calibration<br />
points but do not quantify their instrument’s<br />
measurement quality over its full range and function<br />
set?<br />
• Why do some (most?) customers consider metrology<br />
an unavoided overhead cost rather than a valuable<br />
service?<br />
This paper and a recent Metrologist article [1] suggest an<br />
answer: Our computing machinery (potential automation)<br />
does not “talk shop”; it shares no standard language<br />
(semantic structure) by which to record and interpret<br />
metrology information, and thus the machine servants<br />
leave many routine tasks to their supposed masters.<br />
The same article introduced and discussed a Metrology<br />
Information Infrastructure (MII or MI 2 ) concept: A set of<br />
normative standards, data structures, and communication<br />
protocols to advertise, communicate, share, and leverage<br />
the gold mine of information generated by everyday<br />
metrology operations. In such a paradigm, data-filled,<br />
machine-readable electronic versions of calibration<br />
certificates, instrument spec sheets, accreditation scopes<br />
and other metrology communication vehicles would<br />
seamlessly carry information with known meaning<br />
between organizations and down the traceability chain.<br />
As discussed below, an MII might increase analytical rigor,<br />
improve traceability, its transparency, and understanding<br />
thereof, clarify instrument specifications, link customer<br />
measurement quality at arbitrary test points to historical<br />
calibration points, and reduce product test errors.<br />
While many of the preceding possibilities await<br />
normative standards for data formats and communication,<br />
and software to implement them, other initiatives also await<br />
research and recommended practices. This paper illustrates<br />
some technical problems that standards and software<br />
would solve and introduces avenues that may approach<br />
the recommended practices we lack. First, we consider<br />
the difference between human and automated shortcuts.<br />
Metrology Made Easy?<br />
When we face complexity, we often make economic or<br />
conservative choices and take analytical shortcuts. For<br />
example, when we calculated on abaci, slide rules and<br />
napkins, multi-digit numbers inconvenienced us and<br />
we invented significant-figures rules to make life easier.<br />
Sooner or later though, shortcuts incur penalties. Consider<br />
the skeleton uncertainty budget in Table 1 for a nominal<br />
10.00000 unit measurand at full resolution:<br />
<strong>Cal</strong> <strong>Lab</strong>: The International Journal of Metrology<br />
26 Apr • May • Jun 2013
Metrology: Standardize and Automate!<br />
Mark Kuster<br />
Error Source<br />
Uncertainty<br />
Measurement Standards 0.00050<br />
Resolution 0.0000029<br />
Stability 0.0000<br />
Combined 0.000501<br />
95 % Confidence Interval: ±0.001<br />
Table1. Example Uncertainty Budget.<br />
Say we apply this budget to numerous calibrations over<br />
a multi-year period, and per whatever significant-figures<br />
rules we follow, report values in the format XX.XXX.<br />
Afterward, we learn that someone grossly overestimated<br />
the measurement standards uncertainty or we otherwise<br />
refine that component estimate to 0.000005, applicable<br />
to past calibrations. At 95 %, the new confidence interval<br />
would come to ±0.000011, but we suspect that the<br />
previously under-investigated repeatability and stability<br />
might affect that. To update our estimate, we review the<br />
historical data and unfortunately find all values either<br />
10.000 or 9.999. The significant-figures rules effectively<br />
inflated our resolution uncertainty to 0.00029, swamped<br />
out the important uncertainty information, and undercut<br />
years of calibration work. So, we expend resources on a<br />
new stability study and make our metrology “cost center”<br />
that much less attractive.<br />
With the right infrastructure, computing resources<br />
save us from inconvenience—and complexity-driven<br />
shortcuts. Unlike humans, CPUs save nothing by<br />
rounding; in fact, rounding just increases CPU time,<br />
numeric errors, software complexity, and bug likelihood.<br />
So what if we had a standard to delineate inclusion of<br />
machine-readable data in calibration certificates? An MIIbased<br />
electronic calibration certificate would imbed full<br />
precision measurement results and uncertainties for the<br />
next machine’s computing pleasure and still present us<br />
humans conveniently formatted values on the surface. An<br />
MII would give certificates and other documents depth and<br />
substance beneath their shiny surfaces.<br />
A more serious shortcut, misinterpreting instrument<br />
specs, may have originally caused our uncertainty<br />
estimation error. Perhaps we conveniently took a reputable<br />
manufacturer’s warranted specification on a complex<br />
multifunction instrument as a k = 2 confidence interval.<br />
Or worse, we committed the uniform (rectangular)<br />
distribution misapplication sin and used an even more<br />
conservative k = 1.7. In reality, in order to keep warranty<br />
costs low, the manufacturer conservatively specified the<br />
instrument such that all its functions would reliably remain<br />
in tolerance for a long interval under strenuous usage,<br />
meaning that each individual function would have an intolerance<br />
probability far closer to 100 %. The coverage factor<br />
for a single measurement may come closer to k = 15, even<br />
without considering meticulous laboratory instrument<br />
care. We will see how an MII might prevent this problem<br />
later, but let us discuss uncertainty analysis shortcuts first.<br />
Some laboratories may see few reasons beyond<br />
accreditation scope competitiveness to perform rigorous<br />
uncertainty analyses. Full analyses drive support costs<br />
higher than desired. Simplified, conservative uncertainty<br />
analyses suffice to ensure adequate accuracy for uncertainty<br />
ratios (or false accept risk) and proficiency tests. If we<br />
overestimate measurement process uncertainty, then we<br />
underestimate ratios and more safely claim sufficiently high<br />
ratios. Likewise, our E n = |x us – x them | /u c proficiency test<br />
(PT) scores will more likely pass muster. However, inflated<br />
uncertainties stealthily drive up costs. Inventory and<br />
maintenance costs increase when conservative uncertainty<br />
estimates push laboratory instruments to the next price<br />
and accuracy level to support the same product test limits.<br />
Consequence costs increase when conservative uncertainty<br />
estimates cause widened product tolerances or less<br />
competitive accreditation scopes. Inaccurate uncertainties<br />
lead to inaccurate risk estimates and inefficient operating<br />
points, and derail the end-to-end cost analyses [2] that<br />
would demonstrate and quantify metrology’s value to<br />
management or customers.<br />
A MII may not rectify PT bias, 1 but it might significantly<br />
reduce analytical costs. To reduce uncertainty budget<br />
maintenance, analytical metrology and lab management<br />
software would import upstream uncertainties directly from<br />
the calibration certificates and relate them electronically to<br />
the calibration points in the laboratory’s central database.<br />
That would eliminate separate spreadsheets and other<br />
files of individual analyses that humans manually update<br />
every time new uncertainties flow down the chain. Some<br />
laboratory software 2 [3, 4, 5] and in-house solutions [6] have<br />
ventured down this path and already include measurement<br />
standard specification ↔ calibration point relations.<br />
Standardized uncertainty calculation software libraries<br />
that any application package might use would encourage<br />
more software developers to include such functionality in<br />
their laboratory management systems, analysis software,<br />
automated calibration software, etc. Ubiquitous automated<br />
uncertainty calculations would alleviate pressures to take<br />
shortcuts. If software handled such complexities as error<br />
1 Presumably to protect the calibration service customer, the current accreditation scheme penalizes low, but not high,<br />
uncertainty estimates (E n > 1) and thus biases uncertainty estimates upward. If we calculated our uncertainties and E n scores<br />
accurately, we would expect to have E n > 1 about 5 % of the time. Then, only when that rate signicantly deviated from 5 %<br />
(either way!) would it impact accreditation status.<br />
2 Though this paper credits known prior work, it endorses no specific products or companies.<br />
Apr • May • Jun 2013<br />
27<br />
<strong>Cal</strong> <strong>Lab</strong>: The International Journal of Metrology
Metrology: Standardize and Automate!<br />
Mark Kuster<br />
distribution details, sensitivity coefficients, correlations,<br />
correct (as opposed to convenient) coverage factors,<br />
t-distribution-based confidence intervals, Bayesian and<br />
Monte Carlo approaches as appropriate, multiple-output<br />
matrix methods, all the related shortcuts would evaporate,<br />
whether they cause significant error or not. The GUM [7]<br />
and its relatives already established the standards in this<br />
case, and many uncertainty analysis applications already<br />
exist; at most, we lack collecting them into standard<br />
libraries and a validation process that the industry widely<br />
accepts.<br />
Standardized measurement scenario uncertainty<br />
templates would save resources also and avoid shortcuts<br />
related to which uncertainty components to include.<br />
A finite, though increasing, number of quantities and<br />
measurement methods underlie all our work, so a bit of<br />
effort and cooperation, and perhaps a web site to collect<br />
and discuss them, might soon produce standardized<br />
and extensible templates that cover most combinations.<br />
The NCSLI RP-12 working group has discussed such<br />
a possibility already. Most metrology organizations<br />
use uncertainty budgets, and though some uncertainty<br />
components in similar scenarios matter more or less at<br />
different traceability levels, why should every analyst<br />
reinvent the budget structures and components? Also, if<br />
software calculates the results, practitioners may include<br />
all components without worry as to their significance—no<br />
shortcuts.<br />
In similar fashion, we may standardize and automate<br />
other analytical processes. Bottom line: When we take<br />
shortcuts to “make metrology easy” we simply pass costs<br />
on to customers. Instead, we should standardize and<br />
automate to eliminate the costs and obviate the shortcuts.<br />
Traceability Improvements<br />
As discussed previously, MII-based certificates would<br />
pass unadulterated data down the traceability chain<br />
and avoid information loss, not to mention accumulated<br />
rounding errors. However, current calibration certificates<br />
omit much more valuable information than extra digits,<br />
information that MII-based certificates might include.<br />
Currently, we often reduce multiple traceability chains into<br />
a single measurement result and report the requisite boileddown<br />
information: some subset of uncertainty, coverage<br />
factor, confidence interval, and degrees of freedom (DOF).<br />
Unfortunately, the typical calculation and reporting process<br />
discards upstream information that downstream analysts<br />
have no way to recover and use; information on individual<br />
uncertainty components combined at one traceability link<br />
rarely survives past the next calibration certificate. When<br />
traceability chains converge in a measurement process,<br />
then diverge and merge again, correlations between chains<br />
become relevant.<br />
One MII solution would have the certificate imbed<br />
or point to full traceability information, including all<br />
uncertainty contributors, correlations, and DOF from each<br />
traceability link back to the SI unit realizations. GUIDs<br />
(Globally Unique IDentifiers) or URIs (Uniform Resource<br />
Identifiers) might distinguish uncertainty components<br />
in order to identify common contributors appearing in<br />
different traceability tree branches. We humans might<br />
consider that information overload or just a curiosity, but<br />
our computing systems would use it transparently for<br />
our benefit.<br />
An Example Traceability Problem<br />
Review the GUM’s example 3 H.2.4 [7], which we have<br />
extended to include DOF and 95 % confidence intervals: 4<br />
A primary lab measures the voltage across and the current<br />
through a component, and the voltage phase relative to the<br />
current. From that, the lab computes resistance, reactance,<br />
and impedance. Table 2 collects the pertinent information.<br />
The customer requested resistance and reactance, so the<br />
calibration certificate only contains those two lines from<br />
Table 2. Later however, the customer wishes to know the<br />
component’s impedance and phase angle and so backcalculates<br />
those values, uncertainties, and DOF from the<br />
certificate data. Table 3 shows the customer’s first attempt.<br />
Ideally, the customer results match the data the lab<br />
used to generate the certificate (but did not include!).<br />
Unfortunately, only the values agree; the uncertainty, DOF,<br />
and confidence limits have large errors. In this case, the<br />
primary lab failed to include the −0.588 resistance-reactance<br />
correlation coefficient, a common omission—especially<br />
when certifying multiple values over a range—even though<br />
the GUM recommends reporting all relevant data. The<br />
customer, having no correlation information, assumed<br />
independence between the values, or perhaps took that<br />
shortcut for simplicity. Unity correlation, usually another<br />
easy assumption, causes trouble with the phase uncertainty<br />
in this case, so zero makes an easier choice.<br />
After some expense and time, the customer notices the<br />
overestimated uncertainties, calls the primary lab, and<br />
eventually discovers the problem. After accounting for<br />
the correlation, the new customer calculation yields the<br />
Table 4 results.<br />
We notice that that fixed the uncertainty but left the DOF<br />
3 The example considers only some Type A errors and does not constitute a full uncertainty analysis but serves to<br />
illustrate the concept.<br />
4 See the GUM for the detail not included here. Since neither the GUM nor this paper imbed any MII features, not all<br />
the least signicant digits shown here match. To reproduce the results, calculate everything from the example’s source data<br />
without intermediate rounding.<br />
<strong>Cal</strong> <strong>Lab</strong>: The International Journal of Metrology<br />
28 Apr • May • Jun 2013
<br />
with fundamental uncertainties and DOF<br />
unique identifiers for the particular dissemination. Null<br />
3.274 mV<br />
GUIDs indicate quantities independently and identicallydistributed<br />
(iid) over time that did not provide traceability<br />
u f<br />
= 379.1 µrad ( (2)<br />
6.251 µA<br />
) , v f ( = 4.0<br />
0.6<br />
) . 5<br />
−2.3<br />
for more than one simultaneous measurement and thus<br />
Metrology: Standardize and Automate!<br />
Mark Kuster<br />
Quantity Value Uncertainty DOF 95 % Confidence Limits may use the same fundamental<br />
information to eliminate all correlation<br />
Voltage, magnitude 4.9990 V 3.2 mV 4 ±8.9 mV<br />
and DOF discrepancies. An MII that<br />
Current, magnitude 19.6610 mA 9.5 µA 4 ±26.3 µA revealed such information would<br />
Phase, ϕ have saved the customer analysis<br />
V − ϕ I 1.044 46 rad 0.75 mrad 4 ±2.09 mrad<br />
and consequence errors, calls to the<br />
Resistance 127.732 Ω 0.071 Ω 4.4 ±0.190 Ω<br />
primary lab, and perhaps a repeat<br />
Reactance 219.847 Ω 0.296 Ω 5.1 ±0.756 Ω calibration. Furthermore, if in a<br />
Impedance 254.260 Ω 0.236 Ω 6.0 ±0.577 Ω complete analysis, the resistance and<br />
impedance have common elements<br />
Table 2. Primary <strong>Lab</strong>oratory <strong>Cal</strong>ibration Data.<br />
among their traceability chains (likely),<br />
Quantity Value Uncertainty DOF 95 % Confidence Limits<br />
an MII would have exposed that to<br />
all parties’ software for automatic<br />
Impedance 254.260 Ω 0.488 Ω 5.9 ±1.201 Ω handling. Some efforts have begun: A<br />
Phase, ϕ V − ϕ I 1.044 46 rad 1.41 mrad 9.4 ±3.158 mrad<br />
recent uncertainty analysis application<br />
[11] has built fundamental uncertainty<br />
Table 3. Customer Impedance and Phase Results, Attempt 1.<br />
information into its storage format<br />
Quantity Value Uncertainty DOF 95 % Confidence Limits<br />
in order to correctly propagate<br />
uncertainties.<br />
Impedance 254.260 Ω 0.236 Ω 5.3 ±0.597 Ω<br />
Vector Uncertainty Analysis<br />
Phase, ϕ V − ϕ I 1.044 46 rad 0.75 mrad 5.6 ±1.870 mrad<br />
In the above example, we posited<br />
Table 4. Customer Impedance and Phase Results, Attempt 2.<br />
and confidence limits wrong; the certificate combined the<br />
upstream DOF and correlations into those (fewer) values<br />
reported. To prevent DOF propagation errors, certificates<br />
should include the original upstream information for<br />
all uncertainty contributors [8, 10, 11]. Note that Table<br />
2 and Table 4 include DOF calculated for correlated<br />
errors, something the GUM does not cover. A recent<br />
paper [8] surveys and evaluates several published ways<br />
to perform that calculation, one of which NCSLI RP-12<br />
[9] now includes. In this case, we calculated the Table 2<br />
output quantities’ DOF as if the primary lab had analyzed<br />
the measurement and determined three fundamental<br />
(independent) error sources that explain the observed<br />
an MII that would pass co-variances<br />
down the traceability chain to resolve<br />
traceability problems. That would work, but at least<br />
one simpler solution exists. To sketch it out, suppose<br />
we imagine a fundamental (orthogonal) vector space<br />
whose dimensions correspond to the independent<br />
uncertainties comprising a traceability chain. Dimension<br />
candidates would include a small independent SI unit<br />
and CODATA 6 constant set, plus the random uncorrelated<br />
errors that arise in measurements. BIPM 7 , CODATA, and<br />
measurement process owners might publish GUIDs to<br />
uniquely identify these unit vectors. So, for example,<br />
Table 5 describes some components of a fundamental<br />
uncertainty vector space for length measurements, along<br />
with sensitivities and DOF for a particular measurement.<br />
errors and correlations according to the relation<br />
The GUID list alone defines the vector space. The notation<br />
e GUID[x] represents the GUID assigned to the error source<br />
(1) x. Some measurements will propagate the same random<br />
(<br />
V<br />
<br />
e I e ϕ<br />
) = 0.9799 0.1997 V/rad<br />
f<br />
2.209 mΩ<br />
( −1.0726 S 16.32 mA/rad −0.9999<br />
)<br />
0.1997 rad/V −0.9797 −16.21 mrad/A (<br />
1<br />
<br />
∙ f 2<br />
<br />
f 3<br />
) ,<br />
error to multiple traceability chains, say, through GPS<br />
time signals, and thus those uncertainty sources have<br />
Using that fundamental per [8] will reproduce the<br />
correct results. The customer, or anyone downstream,<br />
will not correlate with an uncertainty from any other<br />
measurement at any time or place. Note that the meter<br />
5 We would typically avoid fundamentals with negative DOF to prevent potential problems downstream. The negative DOF<br />
indicates that the example DOF and covariance data or this ad hoc fundamental structure do not represent physically real<br />
measurements. However, this fundamental does produce completely consistent results for this example. See [8] for ways<br />
to avoid and handle negative DOF.<br />
6 The Committee on Data for Science and Technology, www.codata.org.<br />
7 Bureau International des Pois et Mesures, www.bipm.org.<br />
Apr • May • Jun 2013<br />
29<br />
<strong>Cal</strong> <strong>Lab</strong>: The International Journal of Metrology
Metrology: Standardize and Automate!<br />
Mark Kuster<br />
Quantity Dimension ID Ex. Uncertainty Ex. DOF<br />
Time GUID[BIPM second] 0 s ∞<br />
Velocity, Light in Vacuum GUID[CODATA c] 0 m/s ∞<br />
Allan Variance GUID[NIST-F1(timestamp)] 10 -14 s/s 10 5<br />
Unique Random Error NULL 10 -7 s/s 50<br />
.<br />
. . . . . . .<br />
Table 5. Example Independent Uncertainties for a Length Measurement.<br />
Equation 1’s matrix, which we<br />
now denote C pf , gives the voltage,<br />
current, and phase sensitivities to the<br />
fundamental uncertainty vector; each<br />
sensitivity vector lies in one matrix row.<br />
To specify an uncertainty in the vector<br />
space, we multiply its sensitivities by the<br />
fundamental uncertainties componentby-component.<br />
So in vector form, the<br />
primary lab voltage measurement has<br />
the uncertainty vector<br />
<br />
<br />
<br />
does not appear in the list, except in the CODATA light<br />
velocity constant; all length measurements will trace back<br />
0.9799 ∙ 3.274 mV 3.208 mV<br />
to time or frequency.<br />
u V<br />
= 0.1997 V/rad ∙ 379.1 µrad (<br />
2.209 mΩ ∙ 6.251 µA<br />
) ( = 75.71 µV<br />
) .<br />
13.81 nV<br />
As long as we reference all uncertainty calculations to<br />
(5)<br />
3.274 mVµ 0 µrad 0 µA<br />
where C zf = C zm C mf . Of course, a smart package would<br />
U f<br />
= 0 mVµ 379.1 µrad 0 µA<br />
(4)<br />
( ) . use the phase information already present rather than<br />
0 mVµ 0 µrad 6.251 µA<br />
recalculating it but we find it comforting to know the<br />
such an orthogonal vector space, we have no correlations<br />
to worry about. Every measurement has a certain<br />
sensitivity to one or more components in the vector space,<br />
the sensitivities determined by the derivatives of its<br />
measurement equation with respect to each component.<br />
We may represent a particular measurement’s uncertainty<br />
Thus we have the first uncertainty vector in the primary<br />
lab’s results. The numeric values mean nothing, however<br />
without the fundamental vector space definition. We may<br />
compute all uncertainty vectors at once as columns in a<br />
matrix by the simple propagation<br />
vector in that space with the component-by-component<br />
product of its sensitivities and uncertainties. To calculate<br />
U y<br />
= U x<br />
C yx<br />
T , (6)<br />
measurement uncertainty we compute the uncertainty<br />
vector’s magnitude (Euclidean length), u = ‖u‖ = √ ____<br />
u T u , which defines a new vector space, though not orthogonal<br />
just the root-mean-square of its components. To combine unless C yx<br />
has a diagonal form. So the primary voltagecurrent-phase<br />
uncertainty space becomes<br />
multiple uncertainty vectors further down the traceability<br />
chain, we simply multiply each by the measurement’s<br />
sensitivity to that quantity’s error and add the resulting<br />
3.208µmV −3.512 µA 0.6539µmrad<br />
vectors—no correlation complications, just multiply and U p<br />
= U f<br />
C pf<br />
T = 75.71 µV 6.189 µA 0.3714µmrad<br />
<br />
( ) .<br />
add. 8 13.81 nV −6.250 µA −0.<strong>101</strong>3 µrad<br />
The combined uncertainty then just becomes the<br />
(7)<br />
length of the final vector (see Figure 1).<br />
To illustrate, let us compute the GUM H.2.4 example At the next traceability level we have the resistancereactance<br />
space<br />
by vector analysis. We note here that all the following<br />
calculations, though they take different forms, equate<br />
exactly to the GUM procedure. First, we define our<br />
U m<br />
= U f<br />
C mf<br />
T = ( 38.97 −263.9<br />
−43.39 113.3<br />
) mΩ,<br />
orthogonal vector space by the primary lab’s independent 9<br />
−40.63 −69.87<br />
(8)<br />
uncertainty components, u f , and denote the corresponding<br />
where C<br />
error sources f 1 , f 2 , f 3 . The individual basis vectors take the<br />
mf = C mp C pf and C mp contains the sensitivity<br />
coefficients from the measurement equations relating<br />
form<br />
resistance and reactance to voltage, current, and phase.<br />
Finally, the customer computes the desired impedance<br />
3.274<br />
magnitude-phase uncertainty space<br />
u f 1<br />
= ( 0<br />
) mV, u = 0<br />
(3)<br />
f 2 (<br />
379.1<br />
) µrad, u = 0<br />
f 3 ( 0<br />
) µA,<br />
0 0 6.251<br />
−208.6 mΩµ −653.9 µrad<br />
U (9)<br />
and comprise our fundamental vector space<br />
z<br />
= U f<br />
C z f<br />
T = 76.19 mΩµ 371.4 µrad<br />
( ) ,<br />
−80.82 mΩµ <strong>101</strong>.3 nrad<br />
calculation will agree with prior data in all aspects.<br />
8 Digital signal processor (DSP) chips love to multiply and add; with vector methods, they would make short work of even<br />
massive uncertainty problems.<br />
9 This example has no SI traceability to correlate voltage, phase, and current errors.<br />
<strong>Cal</strong> <strong>Lab</strong>: The International Journal of Metrology<br />
30 Apr • May • Jun 2013
Metrology: Standardize and Automate!<br />
Mark Kuster<br />
Figure 1. Combining two uncertainty vectors (blue) in an orthogonal uncertainty vector space (red).<br />
The reader may verify all the above uncertainty vectors by computing their magnitudes (lengths-RSS the components<br />
in each column) and comparing to the uncertainties in the previous example. For DOF, we use the standard Welch-<br />
Satterthwaite (W-S) formula—we have no correlation issues as long as we retain and compute from the fundamental<br />
DOF. Therefore, we use the sensitivity coefficients from the quantity of interest to the fundamental quantities. For<br />
example, the impedance has fundamental sensitivity coefficients<br />
and so after the units cancel out, the W-S formula yields<br />
C Z f<br />
= ( −63.71 A −1 201.0 Ω/rad −12.93 kΩ A −1 ), (10)<br />
___________________________________________________<br />
0.236<br />
v Z<br />
= <br />
4 <br />
____________________<br />
( −63.71 ∙ 3.274 × 10 −3 ) 4 __________________<br />
3.9956<br />
+ ( 201.0 ∙ 3.791 ×10⁻⁴ ) 4 <br />
0.5565<br />
+ ( −12.93 ∙ 6.251 × = 6.0. (11)<br />
____________________ 10−6 ) 4 <br />
−2.2996<br />
If we ever want the correlation between two error sources, we may calculate the “co-linearity” or normalized dot<br />
product of the two associated uncertainty vectors as<br />
u i<br />
∙ u j<br />
<br />
ρ i , j<br />
=<br />
________<br />
‖u i<br />
‖ ‖u j<br />
‖ . (12)<br />
Note that the equation yields zero for any two fundamental uncertainty vectors. For the resistance-reactance correlation,<br />
the formula works out to<br />
0.03897 ∙ −0.2639 + −0.04339 ∙ 0.1133 + −0.04063 ∙ −0.0699<br />
ρ R , X<br />
= ___________________________________________<br />
0.07107 ∙ 0.29558 = −0.588. (13)<br />
To recover any covariance matrix from an uncertainty vector set U, for example to use the GUM matrix uncertainty<br />
framework [14], we calculate all the vector lengths and cross-lengths by the single matrix product<br />
Σ = U T U. (14)<br />
To implement this method, an MII certificate would store or point to the nominal values, vector space definition,<br />
fundamental uncertainties and DOF, along with the sensitivity coefficients between each measurement and the fundamental<br />
in full precision. It might optionally store them in sparse or compact array format. A more sophisticated tactic would<br />
optionally store the measurement equations instead of the sensitivity coefficients. Either way, software would then<br />
Apr • May • Jun 2013<br />
31<br />
<strong>Cal</strong> <strong>Lab</strong>: The International Journal of Metrology
Metrology: Standardize and Automate!<br />
Mark Kuster<br />
Quantity Dimension ID Uncertainty DOF<br />
Voltage, source and meter stability GUID[f 1] 3.274 mV 4.0<br />
Phase, component and meter repeatability GUID[f 2] 379.1 µrad 0.6<br />
Current, component and meter repeatability GUID[f 3] 6.251 µA -2.3<br />
Table 6. MII Certificate Data, Fundamental Uncertainty.<br />
Dimension ID GUID[f 1] GUID[f 2] GUID[f 3]<br />
GUID[V] 0.9799 0.1997 V/rad 2.209 mΩ<br />
GUID[I] -1.0726 S 16.32 mA/rad -0.9999<br />
GUID[ϕ] 0.1997 rad/V -0.9797 -16.21 mrad/A<br />
GUID[R] 11.90 A -1 -114.4 Ω/rad -6.499 kΩ A -1<br />
GUID[X] -80.60 A -1 298.9 Ω/rad -11.18 kΩ A -1<br />
GUID[|Z|] -63.71 A -1 201.0 Ω/rad -12.93 kΩ A -1<br />
Table 7. MII Certificate Data, Sensitivities.<br />
consistently and accurately re-compute all other quantities<br />
on demand rather than store them. Tables 6 and 7 lay out the<br />
encapsulated uncertainty data from all the stages discussed<br />
(rounded for human consumption). Table 6 contains no<br />
more than the fundamental because we simply calculated<br />
derived quantities without further measurements; normally<br />
each successive traceability link would add a basis vector<br />
for each independent error source. A further table would<br />
provide nominal values and names for each GUID.<br />
Instrument Specifications<br />
Next, we break from math and think about how to<br />
capture instrument specifications electronically in a format<br />
with semantic meaning. Such a format would ideally also<br />
describe accreditation scopes and measurands of all types.<br />
Paraphrasing, the VIM [12] indicates that measurand<br />
specifications should include the measured quantity,<br />
the state of the associated item, and the measurement<br />
conditions. We suggest here that we may capture almost all<br />
such descriptors numerically. For example, the specification<br />
• Measurand: Voltage Indication, RMS, Channels<br />
1-4, 1 V, 10 V and 100 V Ranges, 20 Hz to 1000 Hz,<br />
Voltage Offset −1 V to 1 V<br />
• Tolerance: (0.01 % of stimulus + 1 μV + 1 LSD 10 )<br />
has obvious numeric attributes to which we might attach<br />
semantic meaning to enable automatic tolerance calculations,<br />
matching measurands to specifications, automated<br />
calibration quality checks, etc. Past [6] and ongoing [3]<br />
work has proven this concept’s effectiveness in proprietary<br />
formats. We may extend such formats indefinitely to<br />
handle measurand qualifiers regarding<br />
any influence quantity: temperature,<br />
pressure, humidity, power quality,<br />
noise, vibration, etc. One such existing<br />
arrangement [3] hierarchically organizes<br />
instrument features into measurement<br />
functions of multiple ranges, each with<br />
numeric qualifiers and specifications.<br />
A problem yet unsolved remains:<br />
How to properly interpret warranted<br />
specifications as confidence intervals and<br />
hence convert them to uncertainties. The<br />
MII for specifications should address<br />
this and incorporate the data (realistic<br />
coverage factors or confidence levels,<br />
probably other data) that software<br />
(and humankind!) now lacks. An MII<br />
would allow companies to market<br />
their equipment specifications while<br />
including true uncertainty information<br />
below the surface for metrologists. NCSLI currently has a<br />
Recommended Practice RP-5 (specifications) under revision;<br />
perhaps it will lay some groundwork for a solution.<br />
The SI and the VIM already specify meaning for<br />
measurement units and quantities. ISO-IEC 80000 [13]<br />
series standards exhaustively detail quantities for multiple<br />
measurement disciplines. We do not lack much beyond a<br />
common data structure for electronic storage; ISO has even<br />
developed standards for developing standardized meta<br />
data, storage formats, and data exchange techniques. This<br />
MII element appears ripe for tackling.<br />
If we incorporate a standard specification format into<br />
our MII, we would realize many benefits. For example,<br />
manufacturers might publish instrument specifications<br />
electronically, enabling MII-aware software to automatically<br />
search for equipment meeting detailed criteria. Accreditation<br />
scopes published in MII formats would allow similar<br />
searches for qualified calibration services.<br />
A General Instrument Model<br />
If we establish MII elements that communicate<br />
specifications between systems, what about actual<br />
instrument performance? Why not enable software to not<br />
only interpret specifications, but also understand instrument<br />
performance, automatically select test points, and build<br />
calibration procedures per specified calibration quality<br />
requirements? This subject deserves considerable research<br />
on its own but we describe one possibility at high level here.<br />
Every instrument, whether a simple gage block or a<br />
complex spectrum analyzer, has a set of intrinsic parameters<br />
corresponding to physical or virtual user settings, device<br />
physics, environmental inputs, and adjustments. With or<br />
10 Least Significant Digit, or count.<br />
<strong>Cal</strong> <strong>Lab</strong>: The International Journal of Metrology<br />
32 Apr • May • Jun 2013
Metrology: Standardize and Automate!<br />
Mark Kuster<br />
against the designer’s intention, each parameter will vary,<br />
and thus has some statistical distribution or uncertainty in<br />
its value at any given time.<br />
From the user’s perspective, the instrument offers a<br />
set of black-box measurands with specified accuracy or<br />
uncertainty. From a metrology perspective, the external<br />
measurands relate in some manner to the intrinsic<br />
parameters. For instance, a dimensional end standard’s<br />
measurands (e.g., length, flatness, parallelism, surface<br />
roughness) depend on its rough dimensions, material<br />
characteristics, surface condition, calibration corrections,<br />
etc. A spectrum analyzer offers many measurements whose<br />
accuracy depends on internal component stabilities, user<br />
settings, and mathematical correction coefficients. We<br />
may use that relationship during calibration and adjust<br />
the intentionally variable parameters to bring measurands<br />
closer to nominal. We may also turn a blind eye and treat<br />
the instrument as a black box to determine its before- or<br />
after-adjustment state.<br />
Unfortunately, we rarely determine an instrument’s<br />
complete state for the customer, but rather its state at a finite<br />
set of test points. In some cases, this satisfies the customer<br />
completely as they will use it only at those points. In other<br />
cases, we simply assume that passing the test points means<br />
the instrument meets all specifications over all its ranges.<br />
Substituting, deleting, or adding test points will likely<br />
alter the instrument’s specification conformity across the<br />
measurand space in a way we presently do not quantify.<br />
To provide our test and measurement customers<br />
higher quality services, we should quantify instrument<br />
measurement quality across the entire measurand space of<br />
interest and communicate that information electronically<br />
for testing software to discover and use. Metrics we might<br />
supply include measurand bias, uncertainty, or false accept<br />
risk—measurement reliability—relative to specifications. Let<br />
us examine how an MII might assist us.<br />
A Proposal<br />
First, we want some way to quantify quality at points<br />
we have not tested. Given a vector of intrinsic parameters,<br />
x int<br />
, and a vector of measurand values, m, we assume some<br />
unknown functional relation F exists that determines the<br />
measurand errors, namely<br />
e m<br />
= F ( m, x int ) , (15)<br />
and that we may approximate that relationship with<br />
a vector function, f, and vector error (determined at<br />
calibration), ϵ, such that<br />
e m<br />
= f ( m, x int ) + ϵ . (16)<br />
The vector function f has one component for each<br />
measurand and constitutes a general instrument model that<br />
predicts external measurands from intrinsic parameters. If<br />
we knew the uncertainties and interrelationships between<br />
the intrinsic parameters, we might form their covariance<br />
matrix, Σ int , and propagate that uncertainty through f per<br />
the GUM. This takes the form [14, 15]<br />
Σ m<br />
= C m, int<br />
Σ int<br />
C m,int<br />
T + Σ ϵ<br />
, (17)<br />
C m,int<br />
= ∇f ( m,x int ) <br />
_____<br />
m,x int<br />
.<br />
Once we have the instrument uncertainty at arbitrary<br />
points, we may imbed the model, values determined at<br />
calibration, and uncertainties into the calibration certificate<br />
for the user’s testing or analysis software. Combined with<br />
an instrument accuracy specification, calibration or testing<br />
software may also calculate false accept risk, beginning-ofperiod<br />
(BOP) measurement reliability, calibration ratios, or<br />
other quality metrics that interest the laboratory or customer.<br />
Model Creation and Validation<br />
Fine and dandy, but where do we get instrument models?<br />
Ideally, since engineering and design information defines the<br />
internal-external parameter relationships, the manufacturer<br />
would provide models with their instruments. However,<br />
this assumes a number of things, including a standard<br />
methodology and data format (MII) we currently lack.<br />
Lacking a model handed to us, or for that matter, if we<br />
have this task as a manufacturer, what then? A cooperative<br />
project between NIST and Fluke Corporation provided one<br />
answer [16]. Essentially, the method boils down to type<br />
testing—we would take measurements densely covering<br />
the measurand space, guided by instrument knowledge<br />
and metrology experience. Once we have a large enough<br />
superset of predicted points we may apply linear algebra<br />
to decompose the data set and determine a subset of points<br />
for calibration that capture all significant instrument errors,<br />
very similar to decomposing a covariance matrix to find a<br />
fundamental set of error sources. Along the way we get a<br />
numeric model. So, applying singular value decomposition,<br />
( C m,int<br />
, Σ int<br />
, C m,int ) = SVD ( Σ m ) , (18)<br />
and eliminating noise, we get the model sensitivities and<br />
internal co-variances we sought. Note that this procedure<br />
provides the long-sought connection between instrument<br />
specifications and uncertainty: Having the uncertainty at any<br />
measurement point and the manufacturer’s specification,<br />
we may calculate the actual coverage factors or confidence<br />
levels associated with the specifications.<br />
No matter who develops the model, or by what<br />
method, it has no value without validation. As part of type<br />
testing, we may take the calibration point subset and use<br />
those measurements and the model to predict the other<br />
measurands and compare to actual results, refining the test<br />
points, measurement procedure, or model as appropriate,<br />
all the while keeping an eye on maintaining a quality<br />
calibration process.<br />
Apr • May • Jun 2013<br />
33<br />
<strong>Cal</strong> <strong>Lab</strong>: The International Journal of Metrology
Metrology: Standardize and Automate!<br />
Mark Kuster<br />
Uncertainty Growth<br />
Problem over? Not quite. The equipment owner will use<br />
the instrument over the calibration interval and we should<br />
not expect the instrument’s uncertainty, reliability, or other<br />
quality metrics to remain constant during that time. NCSLI<br />
Recommended Practice RP-1 [17] provides many reliability<br />
and uncertainty growth estimation tools and models. If we<br />
extend our instrument type testing over a suitable period we<br />
may detect and characterize drift in the measurands and use<br />
the model in reverse to calculate intrinsic parameter drift.<br />
Then we may adjust our model accordingly for time after<br />
calibration, t: f (m, x int , t). Though third-party testing may<br />
become viable, manufacturers likely have the most resources<br />
and incentive for such characterization. But again, we should<br />
further research this topic and establish MII elements to<br />
handle it.<br />
Conclusion<br />
We all look for the easiest or most effective way to meet<br />
our quality goals. When we do not automate, we achieve<br />
“easy” by taking shortcuts that sacrifice rigor for “close<br />
enough.” Automation changes that. The right standards<br />
and software combination would obviate current shortcuts<br />
and still contain costs. As a practical matter, standardization<br />
and automation will likely advance by small steps so we<br />
will likely maintain “easy” and gradually replace human<br />
shortcuts with automated quality. “Metrology made easy”<br />
shortcuts have contributed to customers and management<br />
perceiving metrology as overhead to minimize, a cost center<br />
in the accountant’s eye. On the other hand, “Metrology<br />
made easy” automation should lead to ways to tangibly<br />
demonstrate metrology’s value and turn the metrology lab<br />
into a cost savings and revenue center.<br />
Moreover, a widely-implemented and standardized MII<br />
applied to instrument specifications, accreditation scopes,<br />
and calibration certificates would streamline general<br />
operations, from equipment and service procurement to<br />
analysis and traceability. Storing uncertainties as vectors<br />
referenced to orthogonal bases would simplify uncertainty<br />
computations without sacrificing correctness and improve<br />
uncertainty estimation accuracy. Validated instrument<br />
models would harden multi-parameter instrument<br />
traceability, quantify customer measurement quality, and<br />
allow optimized calibration point selection.<br />
This paper hit a few high points among a potential MII’s<br />
elements. I encourage everyone to find a role to play and<br />
contribute to this venture.<br />
Acknowledgments<br />
I acknowledge Danny Wilhelm, Pantex Metrology<br />
Department Manager, and my wife, Cherine, for their<br />
support.<br />
References<br />
[1] M. Kuster, “Toward a Metrology Information Infrastructure—Standardize<br />
and Automate,” Metrologist,<br />
vol. 6, no. 1, 2013.<br />
[2] H. Castrup, “Applying Measurement Science to Ensure<br />
End Item Performance,” Measurement Science Conference<br />
Proceedings, Anaheim, March 12-14, 2008.<br />
[3] MudcatsTM Metrology Suite, Edison ESI.<br />
[4] METBENCH, Metrology Bench-Top Software, Corona<br />
Division, Naval Surface Warfare Center, US Navy.<br />
[5] MET/CAL® <strong>Cal</strong>ibration Management Software, Fluke<br />
<strong>Cal</strong>ibration.<br />
[6] <strong>Cal</strong>ibration Quality Control System, Pantex Metrology,<br />
1996-2008.<br />
[7] “Evaluation of Measurement Data—Guide to the<br />
Expression of Uncertainty in Measurement,” 1st ed.<br />
(GUM 1995 with minor corrections), JCGM, 100:2008.<br />
[8] M. Kuster, “Applying Welch-Satterthwaite to Correlated<br />
Errors,” Measure, vol. 8, no. 1, 2013.<br />
[9] NCSLI, “Recommended Practice RP-12 - Determining<br />
and Reporting Measurement Uncertainty,” NCSLI<br />
Measurement Practices Committee, 2nd ed., 2013.<br />
[10] R. Willink, “An inconsistency in uncertainty analysis<br />
relating to effective degrees of freedom,” Metrologia,<br />
vol. 45, pp. 63-67, 2008.<br />
[11] M. Zeier, J. Hoffmann, and M. Wollensack, “Metas.<br />
UncLib—A Measurement Uncertainty <strong>Cal</strong>culator for<br />
Advanced Problems,” Metrologia, vol. 49, pp. 809-815,<br />
2012.<br />
[12] “International Vocabulary of Metrology—Basic and<br />
General Concepts and Associated Terms (VIM) ,” 3rd<br />
ed., JCGM 200:2012.<br />
[13] ISO and IEC, “Quantities and Units,” e.g., ISO 80000-<br />
1:2009/Cor 1:2011.<br />
[14] “Evaluation of Measurement Data—Supplement 2 to<br />
the `Guide to the Expression of Uncertainty in Measurement’—Extension<br />
to Any Number of Output<br />
Quantities,” JCGM, 102:2011, October.<br />
[15] M. Kuster, “Enough Is Enough: Selecting Points for<br />
Range <strong>Cal</strong>ibration,” Measure, vol. 6, no. 3, 2011.<br />
[16] A. D. Koffman and T. M. Souders, “Application of the<br />
NIST Testing Strategies to a Multirange Instrument,”<br />
Measurement Science Conference Proceedings, Pasadena,<br />
CA, January 27-28, 1994.<br />
[17] NCSLI, “Recommended Practice RP-1 – Establishment<br />
and Adjustment of <strong>Cal</strong>ibration Intervals,” NCSLI Measurement<br />
Practices Committee, 4th ed., 2010.<br />
Mark Kuster, Pantex Metrology, Amarillo TX 79120,<br />
mkuster@pantex.com.<br />
This paper was previously presented at the Measurement Science<br />
Conference (MSC), Anaheim, CA, March 18-22, 2013.<br />
<strong>Cal</strong> <strong>Lab</strong>: The International Journal of Metrology<br />
34 Apr • May • Jun 2013
SOLUTIONS<br />
Fusing Software With Metrology<br />
MET/CAL ®<br />
MUDCATS<br />
AUTOMATION<br />
INCREASES<br />
EFFICIENCY<br />
PS-CAL ®<br />
.NET<br />
WEB TOOLS<br />
Better, cheaper, and faster is the name of the game<br />
when it comes to calibration. Whether you’re a<br />
big lab, small lab, internal or third party, you<br />
have to increase your accuracy, productivity and<br />
repeatability on a limited budget.<br />
<strong>Cal</strong> <strong>Lab</strong> Solutions is your technology partner and we<br />
help labs around the world increase their efficiency.<br />
Our engineers are experts in automation technologies<br />
and know how to apply these technologies to make<br />
your lab more efficient and productive, without<br />
breaking the bank.<br />
For more information on what we do, and how we<br />
do it, visit us online at www.callabsolutions.com, or<br />
call us at 303-317-6670.<br />
PO Box 111113 • Aurora, Colorado 80042 • USA<br />
Telephone 303.317.6670 • Facsimile 303.317.5295 • sales@callabsolutions.com
A New Primary Standard for the<br />
Realization of Pressure from 10 to 500 kPa<br />
Michael Bair<br />
Tim Francis<br />
Fluke <strong>Cal</strong>ibration<br />
Fluid pressure is a derived measurand (N/m 2 ) that is realized primarily through manometers and piston gauges at the NMI<br />
level. Piston gauges are becoming more useful as primary standards due to the ability to characterize the effective area,<br />
the most difficult variable to measure in a piston gauge, with enough confidence and low enough uncertainty to support<br />
the needs of an NMI or private laboratories with the need to resolve pressure at the highest level [1].<br />
Fluke <strong>Cal</strong>ibration has introduced a piston gauge to be used as a primary standard to realize pressure in both gauge and<br />
absolute modes from 10 to 500 kPa called a PG9607. All variables in the pressure equation for a piston gauge were<br />
addressed in the design of the piston gauge to ensure the lowest uncertainty in pressure that could be attained.<br />
This paper discusses the design of the piston gauge and the projected uncertainties than can be resolved with a fundamental<br />
characterization.<br />
I. Piston Gauge Design<br />
A. Overview<br />
The piston gauge is a pressure reference that uses a<br />
close fit piston-cylinder, aligned with the direction of<br />
gravitational acceleration. The piston or the cylinder<br />
floats when the pressure to be measured applied to the<br />
area of the piston-cylinder equals the downward force of<br />
mass being accelerated by gravity. The PG9607 is of a less<br />
frequent design where the cylinder floats and the piston<br />
is stationary. When the cylinder floats it is rotated at a<br />
rate from approximately 5 to 40 RPM min -1 (rpm) so the<br />
gyroscopic effect can equalize very small horizontal forces<br />
and to center the cylinder on and around the piston. No<br />
rotation would cause the cylinder to “tip over” and touch<br />
the outer diameter of the piston and sensitivity would be<br />
lost. When floating, rotating and stable, the measured<br />
pressure is calculated using the equation:<br />
where<br />
_____<br />
Mg l<br />
( 1− ρ (air)<br />
ρ (mass)<br />
) + πDT<br />
_____________________________<br />
A (20,0)<br />
[ 1 + (α p<br />
+ α c<br />
)(θ − 20) ] (1 + λP)+ Vac − (ρ (fluid) − ρ (air) )g l h<br />
M = Total true mass load [kg],<br />
g l = Local acceleration due to gravity [m/s 2 ],<br />
ρ (air) = Density of air [kg/m 3 ],<br />
ρ (mass) = Average density of mass load [kg/m 3 ],<br />
T = Surface tension (considered 0 with gas) [N/m],<br />
(1)<br />
D = 2 √ _____<br />
A (20,0)<br />
<br />
_____<br />
π Diameter of the piston [m],<br />
ρ (fluid) = Density of the test medium (gas or oil) [kg/m 3 ],<br />
h = Difference in height between PG9000 reference level<br />
and test reference level [m],<br />
Vac = Back pressure in bell jar (absolute with vacuum) [Pa],<br />
A (20,0) = Piston-cylinder effective area at 20 °C and 0 gauge<br />
pressure [m 2 ],<br />
α p = Linear thermal expansion coefficient of piston [°C -1 ],<br />
α c = Linear thermal expansion coefficient of cylinder [°C -1 ],<br />
θ = Temperature of the piston-cylinder [°C],<br />
λ = Elastic deformation coefficient of the piston-cylinder<br />
[Pa -1 ], and<br />
P = Pressure applied to the piston-cylinder [Pa].<br />
In the case of the PG9607, the fluid medium is always<br />
gas. The gas can be air, nitrogen or helium. The correction<br />
for surface tension can be ignored since the surface tension<br />
for gas is negligible. This equation applies to both absolute<br />
and gauge modes so long as the term for the density of<br />
ambient air is zero in absolute mode and the VAC term is<br />
ignored in gauge mode.<br />
Figure 1 shows the main components of the PG9607<br />
platform. The sections that follow discuss these components<br />
and the role that improvements in design play in lower<br />
uncertainties in pressure.<br />
B. Piston-Cylinder<br />
The piston-cylinder designed to be used with the PG9607<br />
is a nominal 20 cm 2 area, made of tungsten carbide and is<br />
a floating cylinder on a stationary piston. A picture of the<br />
piston cylinder is shown in Figure 2.<br />
<strong>Cal</strong> <strong>Lab</strong>: The International Journal of Metrology<br />
36 Apr • May • Jun 2013
A New Primary Standard for the Realization of Pressure from 10 to 500 kPa<br />
Michael Bair and Tim Francis<br />
BASE<br />
Figure 1. PG9607 Platform Main Components.<br />
The design is the same used in the PTB project described<br />
in [2]. The cylinder mass is 1.3 kg which is larger than the<br />
20 cm 2 cylinder previously available which is 0.7 kg. The<br />
larger cylinder wall size allows for better cylinder geometry<br />
than the lighter cylinder since there is less deformation from<br />
the cap installed on the top of the cylinder. The tolerance<br />
on dimensional roundness for both the piston and the<br />
cylinder is 100 nm peak to peak. This is an improvement<br />
of 150 nm from the previous cylinder design and minimizes<br />
uncertainties due to imperfect geometry in a dimensional<br />
characterization.<br />
In addition to the improved geometry, the thicker walled<br />
cylinder also provides for lower elastic deformation. The<br />
theoretical deformation coefficient is 4.57 x 10 -6 MPa -1 .<br />
This is equivalent to 2.3 parts in 10 6 change in effective<br />
are over its pressure range of 500 kPa. If the 2.3 parts in<br />
10 6 were represented completely as a change in gap size,<br />
the change in gap from 0 to 500 kPa would be only 28 nm.<br />
This is advantageous because the predictions of effective<br />
area based on dimensional data must include the pressure<br />
distribution at a specific pressure. The dimensional data<br />
can only be taken at zero pressure so the assumption that<br />
the dimensions are the same at higher pressures should<br />
not introduce significant uncertainty to the prediction. A<br />
change in gap of 28 nm would not significantly change<br />
the integration of the pressure distribution discussed in<br />
section II.A.<br />
The mounting post is a controlled clearance mounting<br />
post where a separate pressure of up to 3 MPa can be<br />
applied to the inside surface of the piston to control the gap<br />
of the piston-cylinder. This can be used for studies of the<br />
elastic distortion coefficient. Figure 3 shows a drawing of<br />
the piston-cylinder installed in the mounting post.<br />
C. Mass Load<br />
The mass set defined with the PG9607 is a 100 kg binary<br />
mass set. Mass loading is automated using the AMH<br />
automated mass handler that allows for the exchange of<br />
mass while under a vacuum. This is significant since a very<br />
low vacuum can be applied while making multiple pressure<br />
measurements at different mass loads. The predecessor<br />
to the PG9607 would only allow 38 kg of mass to work<br />
inside a vacuum. Table 1 shows the breakdown of the<br />
masses in the set.<br />
Figure 2. Picture of the 20 cm 2 area piston-cylinder.<br />
Figure 3. Drawing of piston-cylinder assembly and mounting post.<br />
Apr • May • Jun 2013<br />
37<br />
<strong>Cal</strong> <strong>Lab</strong>: The International Journal of Metrology
A New Primary Standard for the Realization of Pressure from 10 to 500 kPa<br />
Michael Bair and Tim Francis<br />
AMH Mass Set Breakdown<br />
(9 each) main mass of 10.1 kg<br />
6.4 kg binary<br />
3.2 kg binary<br />
1.6 kg binary<br />
0.8 kg binary<br />
0.4 kg binary<br />
0.2 kg binary<br />
0.1 kg binary<br />
0.8 kg mass carrying bell assembly<br />
Table 1. AMH-100 Mass Set.<br />
The minimum mass is 2.1 kg defined by a cylinder<br />
mass of 1.3 kg and a mass carrying bell assembly of 0.8<br />
kg. The actual full scale mass load is approximately 105<br />
kg which provides a nominal range of 10.5 to 525 kPa in<br />
gauge or absolute mode, or 110.5 to 625 kPa in absolute by<br />
addition of atmospheric pressure mode. The resolution<br />
of the automated masses is 100 g providing a pressure<br />
resolution of 0.5 kPa. There is a mass tray that allows some<br />
trim masses to be loaded manually if desired to improve<br />
the resolution.<br />
The only time the AMH mass set is handled is when<br />
the piston-cylinder needs to be exchanged or cleaned.<br />
Since the PG9607 only allows one piston-cylinder size the<br />
frequency of handling the mass set is greatly reduced. This<br />
significantly improves the stability of the mass set.<br />
D. Piston Gauge Base, Terminal and<br />
Remote Electronics Module<br />
With the exception of the motor drive assembly used to<br />
automatically rotate the cylinder and mass load, all heat<br />
producing electronics are kept outside of the base. This<br />
was designed this way to ensure there was as little heating<br />
of the piston-cylinder and masses as possible.<br />
The Remote Electronics Module, which in the PG9607<br />
predecessor was inside the base, is external to the base and<br />
has the following functions:<br />
• Supplies power to the motor drive and AMH<br />
• Reads dual piston-cylinder temperature<br />
• Reads ambient humidity, temperature and<br />
pressure<br />
• Connects and reads the residual vacuum sensor<br />
• Connects to the user interface terminal<br />
• Performs all calculations<br />
• Provides remote interfaces for automated control<br />
Because of the inherent precision and expected lower<br />
uncertainties of the PG9607, the system was designed with<br />
dual platinum resistance thermometers that are installed in<br />
the mounting post on opposite sides of the mounting post.<br />
There are two reasons for the dual PRT arrangement. One<br />
is for redundancy of the same temperature measurement<br />
to help reduce type A uncertainties. The other is to better<br />
predict the piston-cylinder temperature by measuring each<br />
side of the mounting post and account for the possibility<br />
of small gradients.<br />
E. Residual Vacuum Sensor<br />
When in absolute mode the residual vacuum sensor is<br />
measured by a 13.3 Pa (100 mTorr) capacitance diaphragm<br />
gauge (CDG). The default vacuum sensor in the predecessor<br />
to the PG9607 was a thermal conductivity gauge (TCG).<br />
The CDG has a significantly lower uncertainty than the<br />
TCG. The REM discussed in 2.3 allows for the configuration<br />
of other types of vacuum transducers as well.<br />
The residual vacuum sensor and its display can be seen<br />
in figure 4 which is a photograph of the complete system<br />
and the complete system with the vacuum bell jar removed.<br />
Note that the bell jar does not have to be removed to<br />
measure gauge pressure.<br />
F. Reference Level<br />
The reference level of the PG9607 is close to the top of<br />
the cylinder. This reference level is not easily accessible<br />
to compare head height measurements with the AMH<br />
loaded and especially with the bell jar on. To help with<br />
this a precise height difference between the reference level<br />
and the base plate, which is accessible with all components<br />
installed, is documented.<br />
Figure 4. Picture of PG9607 complete (above) and with vacuum<br />
bell jar removed (below).<br />
<strong>Cal</strong> <strong>Lab</strong>: The International Journal of Metrology<br />
38 Apr • May • Jun 2013
A New Primary Standard for the Realization of Pressure from 10 to 500 kPa<br />
Michael Bair and Tim Francis<br />
II. Uncertainties<br />
The PG9607 can be fundamentally characterized to<br />
realize pressure. To accomplish this, all the parts of the<br />
pressure equation must be fundamentally characterized.<br />
This primarily includes mass, gravity and effective area and<br />
change of effective area with temperature and pressure.<br />
A PG9607 delivered from Fluke <strong>Cal</strong>ibration will not<br />
be fundamentally characterized but will have a product<br />
uncertainty that is the lowest available from Fluke. This<br />
uncertainty specification is still significantly conservative<br />
compared to what is possible if a laboratory seeks the<br />
lowest uncertainty in pressure through fundamental<br />
characterization. This section concentrates more on what<br />
is possible, yet very reasonable for a laboratory to achieve.<br />
A. Effective Area<br />
The dimensional fundamental characterization of<br />
effective area for a large diameter piston-cylinder is<br />
no longer considered to be reserved for just high end<br />
national metrology institutes. Many NMIs and non-<br />
NMI laboratories are able to perform the proper steps to<br />
dimensionally characterize a piston-cylinder and perform<br />
a proper uncertainty analysis.<br />
What does seem to be less standardized is a specific<br />
procedure to perform the dimensional characterization and<br />
also to perform the uncertainty analysis. PTB (Germany)<br />
in their efforts to realize the Boltzmann constant have<br />
produced what seems to be the most comprehensive<br />
method for dimensional characterization [2], [4].<br />
This method involves producing a three dimensional<br />
model of the piston-cylinder by combining diameter,<br />
straightness and roundness measurements for each piece.<br />
This is done by ensuring the measurements connect at<br />
strategic points in the z axis and orthogonal position.<br />
The amount of measurements to take is not specifically<br />
defined, but should ensure that all significant deviations in<br />
cylindrical geometry are covered. For the PG9607, 50 mm<br />
diameter piston-cylinder there has been enough experience<br />
that 10 diameter measurements, 5 on each orthogonal<br />
plane, 5 roundness measurements and 4 straightness<br />
measurements provide sufficient data to characterize the<br />
effective area. Roundness measurements are made at the<br />
same z axis coordinates and straightness measurements<br />
are made at the four orthogonal positions the diameters<br />
were taken. Figure 5 is a graphical representation of<br />
this dimensional measurement scheme. This figure<br />
shows measurements at 7 z axis locations and is just to<br />
demonstrate the concept.<br />
The measurements can then be related by least squares<br />
to both the radii needed to calculate the effective area<br />
at pressure and also to determine the uncertainty of the<br />
effective area based on dimensional measurements. The<br />
equations to calculate effective area at pressure are given<br />
by Dadson [3] and are:<br />
Figure 5. Example of three dimensional characterization using<br />
diameters, straightness and roundness measurements.<br />
A P<br />
= πr 2 __<br />
0 { 1 + h<br />
0 _________ 1<br />
r0<br />
+<br />
r 0<br />
(P 1<br />
− P 2<br />
) ∫ 1 ________ d(u + U)<br />
(P − P<br />
0 2<br />
) dx<br />
dx } .<br />
And<br />
where<br />
[<br />
x 1__<br />
∫ 0 <br />
P = P 1<br />
2 − ( P 1<br />
2 − P 2<br />
2 ______<br />
)<br />
h 3 dx<br />
½<br />
∫ l 0<br />
1__<br />
h 3 dx ] <br />
r 0<br />
= Piston radius at gap entrance [m],<br />
h 0<br />
= Gap at entrance [m],<br />
U = Cylinder radius deviation [m],<br />
u = Piston radius deviation [m],<br />
P 1<br />
= Pressure at gap exit [Pa],<br />
P 2<br />
= Pressure at gap entrance [Pa],<br />
l = P-C engagement length [m],<br />
x = Axial coordinate in engagement length [m], and<br />
P = Pressure at axial coordinate [Pa].<br />
What is advantageous about PTB’s dimensional method<br />
is that the diameter measurements do not have to be made<br />
at z coordinate positions based on the integration method<br />
used. Instead, evenly spaced diameter measurements can be<br />
interpolated from the three dimensional model developed.<br />
It should be noted that Equations 2 and 3 are intended<br />
for viscous flow and are not necessarily for molecular<br />
or transitional flow that can occur at low pressures in<br />
absolute. However the deviations from using this method<br />
are considered to be minimal.<br />
A method for calculating uncertainty in effective area<br />
based on this method is also proposed by PTB [2], [4]. The<br />
method uses the uncertainty in diameter measurements<br />
(2)<br />
(3)<br />
Apr • May • Jun 2013<br />
39<br />
<strong>Cal</strong> <strong>Lab</strong>: The International Journal of Metrology
A New Primary Standard for the Realization of Pressure from 10 to 500 kPa<br />
Michael Bair and Tim Francis<br />
and the deviations found between the diameter and<br />
roundness measurements and the diameter and straightness<br />
measurements.<br />
u(r S<br />
) = { [ u(D) ____<br />
u(r R<br />
) = { [ u(D) ____<br />
2<br />
2 ]+ δ 2 (r D−S<br />
) + δ 2 (r R−S<br />
) } <br />
2<br />
In these equations, u(D) are the uncertainty in diameter<br />
measurements, δ(r D−R<br />
) is the difference between the diameter<br />
and roundness measurements, δ(r R−S<br />
) the difference of the<br />
roundness and straightness and δ(r D−S<br />
) the difference<br />
between diameter and straightness measurements. A<br />
more thorough discussion of the least squares method and<br />
uncertainty analysis is given in [4].<br />
Equations 4 and 5 are unique in that they capture the<br />
uncertainty of the full three dimensional model. With<br />
the dimensional measurement capabilities of most NMI<br />
dimensional laboratories, and the manufacturers tolerance<br />
on geometry of the 50 mm piston-cylinder it is not<br />
unreasonable to assume an uncertainty of ±2 parts in 10 6<br />
with a 95% confidence can be attained.<br />
B. Change In Effective Area With Pressure<br />
The PG9607 piston-cylinder uses a theoretical deformation<br />
coefficient developed by Fluke <strong>Cal</strong>ibration. The value is<br />
4.57 x 10 -6 MPa -1 and is considered to have a conservative<br />
uncertainty of 10%. Even if this is considered a rectangular<br />
distribution one standard uncertainty is equal to 0.13 parts<br />
in 10 6 for 500 kPa and introduces very little uncertainty to<br />
the final uncertainty in pressure.<br />
Though this value is theoretical, as was previously stated<br />
the PG9607 is a controlled clearance piston gauge and<br />
allows for further studies of the validity of the theoretical<br />
deformation coefficient.<br />
C. Change In Effective Area With Temperature<br />
The thermal expansion coefficient for tungsten carbide<br />
piston cylinders has been well documented to be 9 x 10 -6<br />
˚C -1 . A conservative estimate in uncertainty of 5% provides<br />
a 1 standard uncertainty of 0.22 parts in 10 6 for each degree<br />
of correction.<br />
The temperature of the piston-cylinder for a PG9607 is not<br />
measured directly. However, the design of the mounting<br />
post is such that two platinum resistance thermometers are<br />
placed in close proximity to the inner piston wall. During<br />
the development of the PG9607 studies were performed by<br />
comparing the piston-cylinder mounting post PRTs with a<br />
PRT placed in the internal bore of the mounting post where<br />
the cylinder would normally be positioned. The agreement<br />
was within ±0.03 ˚C.<br />
What helps significantly in the assumption that the pistoncylinder<br />
is the same as the mounting post temperature is the<br />
stability of temperature. This is one of the primary reasons<br />
for designing as much heat producing electronics outside<br />
0.5<br />
0.5<br />
2 ]+ δ 2 (r D−R<br />
) + δ 2 (r R−S<br />
) } <br />
(4)<br />
(5)<br />
of the platform. Figure 6 is a chart showing the difference<br />
between ambient and piston-cylinder temperature in a<br />
lengthy test of a PG9607 and another commercial piston<br />
gauge offered by Fluke <strong>Cal</strong>ibration (PG7601). The tests<br />
were performed automatically in absolute mode with an<br />
automated mass handler and were performing the exact<br />
same test on the same device.<br />
The difference between the ambient temperature and the<br />
piston-cylinder temperature is significantly higher for the<br />
PG7601. Note that this effect is usually only noticed in long<br />
automated absolute tests using automated mass handlers<br />
and does not jeopardize the uncertainty in pressure for a<br />
PG7601. Whereas for the PG9607 there was no detectable<br />
ramp in piston-cylinder temperature over the course of the<br />
test. This offers confidence that the temperature is stable<br />
and has equalized well between the mounting post and<br />
piston-cylinder temperatures.<br />
The uncertainty of the temperature of the piston-cylinder<br />
depends on the uncertainty of the device making the<br />
measurement and the assumption that the piston-cylinder is<br />
the same as the temperature of the mounting post. With the<br />
capabilities of high end temperature laboratory to calibrate<br />
over a very short range of 20 to 25 ˚C, it is reasonable<br />
to assume an uncertainty of ±0.05 ˚C in piston-cylinder<br />
temperature measurement or one standard uncertainty of<br />
0.22 parts in 10 6 .<br />
26<br />
25<br />
24<br />
23<br />
22<br />
16:04:48 17:16:48 18:28:48 19:40:48 20:52:48<br />
27<br />
26<br />
25<br />
24<br />
23<br />
7:55:12 9:07:12 10:19:12<br />
Figure 6. Piston-cylinder temperature (red) and ambient<br />
temperature (blue) of a PG9607 (top) and a PG7601 (bottom)<br />
performing the same pressure test.<br />
<strong>Cal</strong> <strong>Lab</strong>: The International Journal of Metrology<br />
40 Apr • May • Jun 2013
A New Primary Standard for the Realization of Pressure from 10 to 500 kPa<br />
Michael Bair and Tim Francis<br />
D. Other Uncertainties Associated With The Piston-Cylinder<br />
Other uncertainties that are normally included and<br />
are associated with the piston-cylinder are linearity and<br />
stability.<br />
Linearity is an uncertainty associated with the assumption<br />
that the effective area is linear over its range. Though the<br />
uncertainty of the elastic deformation encompasses much<br />
of this, there is still a possibility that the effective area is<br />
not linear due to gap modelization effects not mechanical<br />
linearity errors in the elastic deformation. One standard<br />
uncertainty for this influence is estimated to be 0.23 parts<br />
in 10 6 .<br />
It has always been difficult to predict what the stability<br />
of a 50 mm tungsten carbide piston-cylinder is. Fluke<br />
<strong>Cal</strong>ibration has been using one of these piston-cylinders<br />
as a primary reference for approximately 10 years. The<br />
three determinations of effective area for this reference<br />
have not changed more than 1 part in 10 6 . So one standard<br />
uncertainty of 0.5 parts in 10 6 is used as an estimate.<br />
E. Mass<br />
Uncertainty in mass for piston gauge applications has<br />
traditionally been relatively easy to maintain. This was<br />
primarily because the uncertainty in effective area was so<br />
high that it was not worth putting in the effort to reduce<br />
mass uncertainties. But with the expected low uncertainties<br />
of a PG9607, mass uncertainty becomes a significant focus.<br />
The main contributors to mass uncertainty are the method<br />
and reference used to calibrate the mass, the uncertainty<br />
in density, and the uncertainty due to changes over time.<br />
One of the most significant attributes of an automated<br />
mass handler (AMH) is the fact that there is virtually no<br />
wear. The amount of movement required to load a mass<br />
is only a few mm. This is significant especially when<br />
compared to a manual mass set where it is almost impossible<br />
not to scrape masses when loading and unloading along<br />
the entire length of the bell assembly. For an AMH used<br />
with a PG9607, this would only occur when the pistoncylinder<br />
needs to be removed. Because of this, an estimated<br />
uncertainty due to stability of the masses is ±2 parts in 10 6<br />
and a standard uncertainty of 1 part in 10 6 .<br />
The Fluke <strong>Cal</strong>ibration mass measurement uncertainty<br />
is accredited to an uncertainty of approximately 3 parts in<br />
10 6 . The product uncertainty analysis assumes 5 parts in 10 6<br />
and is valid for 2 years for an AMH mass set. However, it is<br />
reasonable to assume the AMH masses could be calibrated<br />
to a level of ±2 parts in 10 6 at 95% confidence.<br />
The density of the AMH mass set is stated to be 7920 kg/<br />
m 3 ± 40 kg/m 3 , k=2, for all the main and binary masses. The<br />
cylinder mass has a density of 11 988 kg/m 3 ± 100 kg/m 3<br />
and the mass carrying bell assembly has a density of 4537<br />
kg/m 3 ± 100 kg/m 3 . The higher uncertainties for the bell<br />
and the cylinder are due to the fact they are a combination<br />
of different materials, primarily tungsten for the cylinder<br />
and primarily titanium for the mass carrying bell. For the<br />
main and binary masses one standard uncertainty is listed<br />
as a relative uncertainty of 0.38 parts in 10 6 . One standard<br />
uncertainty for the mass carrying bell assembly and the<br />
cylinder density is listed in pressure and is 0.023 Pa. Note<br />
that these uncertainties are listed in absolute mode and not<br />
in gauge mode. This is because the masses are calibrated in<br />
ambient air, so the error due to the mass density is greater<br />
as conditions change from the calibration. Since the worst<br />
case condition is when the ambient air is removed, as is the<br />
case in absolute mode, then the uncertainty is the greatest<br />
there and insignificant when ambient air is reasonably close<br />
to calibration conditions as it is in gauge mode.<br />
An additional uncertainty is added to account for<br />
Krytox grease lubrication on the threads that connect the<br />
mass carrying bell assembly. If the proper procedure is<br />
followed to apply the lubrication, approximately 15 to 20<br />
mg of the grease will be on the threads when calibrated.<br />
Measurements have shown that the grease will reduce<br />
its mass by 5 to 10 mg over the course of one year. Using<br />
±10 mg as an uncertainty in pressure and one standard<br />
uncertainty is approximately 0.025 Pa.<br />
One possible uncertainty contribution of the AMH mass<br />
set is the fact that the masses loaded are physically very close<br />
to the masses that are unloaded. If there were undefined<br />
forces from magnetism this could affect the uncertainty in<br />
pressure. The masses are manufactured using non-magnetic<br />
stainless steel and recent magnetic susceptibility tests have<br />
shown this influence to be minimal. However, for this<br />
level of uncertainty, if it is available, it is recommended to<br />
perform magnetic susceptibility tests at the time of mass<br />
determination.<br />
F. Residual Vacuum<br />
The residual pressure measured inside the bell jar is<br />
performed by an MKS 100 mTorr (13.3 Pa) unheated<br />
capacitive diaphragm gauge. The uncertainty is expanded<br />
to ±0.5% of reading + 0.05 Pa, whichever is greater. History<br />
has shown that this specification is easily met without<br />
regular zeroing for one year. This is with the condition that<br />
the sensor is isolated with a vacuum valve and continually<br />
kept under a vacuum.<br />
Since the system operates in absolute without having<br />
to break the vacuum to change mass, and assuming a<br />
sufficient vacuum pump is used, the residual pressure is<br />
more frequently below 0.5 Pa. In this case one standard<br />
uncertainty is 0.025 Pa.<br />
G. Type A<br />
Type A uncertainty is estimated from crossfloats<br />
maintained to support the Fluke <strong>Cal</strong>ibration piston cylinder<br />
pressure calibration chain. This was also verified in crossfloats<br />
performed with the piston-cylinders manufactured for<br />
the PTB Boltzmann constant determination project. All<br />
crossfloats at various mass loads were well within ±2 parts<br />
in 10 6 and one standard uncertainty of 1 part in 10 6 .<br />
Apr • May • Jun 2013<br />
41<br />
<strong>Cal</strong> <strong>Lab</strong>: The International Journal of Metrology
A New Primary Standard for the Realization of Pressure from 10 to 500 kPa<br />
Michael Bair and Tim Francis<br />
Variable or<br />
Parameter<br />
Absolute<br />
Gauge<br />
Full Mass Load 100 kg 100 kg<br />
(relative unc’s) [parts in 10 6 ] [parts in 10 6 ]<br />
Mass (M) 1 1<br />
Local G 0.5 0.5<br />
Air Density n/a 0.38<br />
Mass Density 0.38 n/a<br />
Head (height) 0.35 0.35<br />
Head (density) 0.23 0.23<br />
Resolution 0.29 0.29<br />
PC Temp 0.22 0.22<br />
Verticality 0.1 0.1<br />
Effective Area 1 1<br />
Linearity 0.23 0.23<br />
Elastic Deformation 0.23 0.23<br />
Thermal Expansion 0.22 0.22<br />
Stability Mass 0.5 0.5<br />
Stability Ae 0.5 0.5<br />
Sensitivity 0.14 0.14<br />
Type A 1 1<br />
COMBINED<br />
EXPANDED<br />
2.1 ppm + 2.1 ppm +<br />
0.042 Pa 0.025 Pa<br />
4.2 ppm + 4.2 ppm +<br />
0.08 Pa 0.05 Pa<br />
(absolute unc’s) [Pa] [Pa]<br />
Vacuum 0.025 n/a<br />
Sensitivity 0.002 0.002<br />
Mass Bell Grease 0.025 0.025<br />
Bell Assembly<br />
Density<br />
0.023 n/a<br />
Table 2. Proposed Uncertainty Budget of a Fundamentally<br />
Characterized PG9607 Piston Gauge.<br />
H. Sensitivity<br />
The uncertainty due to the sensitivity of a piston-cylinder<br />
used in a piston gauge is similar to resolution. What is<br />
detected as sensitivity is considered a full width uncertainty<br />
at 95% confidence and is therefore reduced by a factor of the<br />
square root of 12 to represent one standard uncertainty. The<br />
sensitivity has been measured to be 0.005 Pa + 0.5 parts in<br />
10 6 . Since it is given as the sum of a pressure and a relative<br />
value it is entered twice in the uncertainty budget after being<br />
reduced by the square root of 12.<br />
I. Combined and Expanded Uncertainty<br />
Table 2 provides an uncertainty budget listing all<br />
uncertainties. Many of the influences are not discussed here<br />
and are easy to maintain. These include gravity, fluid head<br />
correction, ambient air density, resolution and verticality. Table<br />
2 is structured so that all relative uncertainties are listed above<br />
the combined and expanded values and all the uncertainties<br />
listed in pressure are below. The uncertainty analysis does<br />
not combine the relative and pressure uncertainties. However<br />
being careful to avoid any correlation, these uncertainties could<br />
be root-sum-squared at specific pressures.<br />
The uncertainty budget in Table 2 is not a Fluke <strong>Cal</strong>ibration<br />
product uncertainty budget. An explanation of the product<br />
uncertainty budget can be found in [5]. The uncertainty<br />
budget shown in Table 2 is a very reasonable estimate of what<br />
a laboratory could maintain with this system as discussed<br />
throughout this paper.<br />
Conclusion<br />
Following a strict and well founded procedure and<br />
uncertainty analysis for the dimensional characterization of<br />
the piston-cylinder allows the PG9607 to be used as a primary<br />
standard for pressure for either an NMI or any metrology<br />
laboratory wanting pressure realized at the highest levels.<br />
The uncertainties should be lower than what is currently used<br />
for mercury manometers and extends to a range that is higher<br />
than the mercury manometer in absolute and gauge modes.<br />
References<br />
[1] M.Bair, R. Haines, “<strong>Cal</strong>culation Of Effective Area And<br />
Uncertainty For A Dimensionally Characterized 50<br />
mm Piston-Cylinder Used As A Primary Reference<br />
For Pressure,” Measure, May 2008.<br />
[2] O. Jusko , M. Neugebauer , H. Reimann, W. Sabuga,<br />
T. Priruenrom, “Dimensional <strong>Cal</strong>ibration Techniques<br />
For Pressure Balances to Be Used In The New Determination<br />
Of The Boltzmann Constant,” Informative<br />
Bulletin Of The Interamerican Metrology System – OAS,<br />
PTB, August 2009.<br />
[3] R. Dadson, S. Lewis, and G. Peggs, The Pressure Balance:<br />
Theory and Practice, London: HMSO, 1982.<br />
[4] W. Sabuga, T. Priruenrom, “An Approach to the Evaluation<br />
of Dimensional Measurements on Pressure<br />
Measuring Piston-Cylinder Assemblies,” IMEKO 20th<br />
International Conference, October 2007.<br />
[5] “Typical Pressure Measurement Uncertainty for a<br />
PG9607 and PG9602 Piston Gauge,” Fluke <strong>Cal</strong>ibration,<br />
http://download.flukecal.com/secure/4061467A_w.pdf.<br />
Michael Bair and Tim Francis, Fluke <strong>Cal</strong>ibration, Phoenix,<br />
AZ.<br />
This paper was previously presented at the Measurement Science<br />
Conference (MSC), Anaheim, CA, March 18-22, 2013.<br />
<strong>Cal</strong> <strong>Lab</strong>: The International Journal of Metrology<br />
42 Apr • May • Jun 2013
Have Confidence<br />
in your Measurements…<br />
…So Your Customers can have Confidence in You.<br />
- NVLAP Accredited - ISO 17025 Requirements*<br />
- Largest Dedicated Quality and Technical Research Team<br />
in the Industry<br />
- Uniform Data Taken Across the Full Range and Functionality<br />
of Instruments<br />
- Extensive Reference Level <strong>Cal</strong>ibration Capabilities<br />
- North American Coverage through Multiple <strong>Lab</strong> Network<br />
- Compliance Services: Analytical Qualification,<br />
Validation, Remediation<br />
*Access each location’s lab code and scope at transcat.com/locations<br />
<strong>Cal</strong>ibration and Compliance Services<br />
TRANSCAT.COM • 800.828.1470
AUTOMATION CORNER<br />
Could the Tried and True IEEE 488<br />
Communication Standard Be Nearing the<br />
End of Its Reign?<br />
Michael Schwartz<br />
<strong>Cal</strong> <strong>Lab</strong> Solutions, Inc.<br />
Today, less and less test equipment<br />
comes standard with a GPIB<br />
communication interface. Many don’t<br />
even offer it as an option. It wasn’t<br />
that long ago manufacturers included<br />
a GPIB interface standard on most test<br />
equipment. If you wanted to sell your<br />
electronic test equipment and get top<br />
dollar, it had to be GPIB compatible.<br />
But not anymore!<br />
For more than 40 years, GPIB was the<br />
defacto standard for instrumentation<br />
control. It was simple to set up, easy<br />
to use, cross platform compatible. It<br />
controlled everything—not just test<br />
equipment; printers, hard drives, and<br />
all kinds of computer peripherals had<br />
GPIP versions at one time. At 8MB/S,<br />
it was also screaming fast running,<br />
supporting up to 15 instruments<br />
at one time and communicating<br />
with a device as far as 20 meters<br />
away. It also supported bi-directional<br />
communications, as well as instrument<br />
to instrument communications.<br />
When I was first introduced to the<br />
General Purpose Interface Bus (GPIB),<br />
I thought it was amazing. I was new<br />
to automation, and computers at that<br />
time were not user friendly. Low level<br />
programming in C was the norm, and<br />
instrument control commands were<br />
more like cryptography. What has<br />
stuck in my mind all these years was<br />
when an engineer I was working with<br />
told me when they created the HPIB<br />
standard back in the late 60s, 8MB/S<br />
was theoretical. At that time, I was<br />
programming on a 286 computers<br />
with a top speed of 6 MHz.<br />
GPIB gave us more than just<br />
communications; its simplicity<br />
allowed engineers to easily rack up<br />
a set of test equipment. Before, most<br />
calibration labs had all their standards<br />
located on their work bench. GPIB<br />
allowed us to take test equipment from<br />
different manufacturer’s, rack them<br />
up into a single system, and have it<br />
all work.<br />
Interconnecting cables used with interface<br />
system have dual connectors. These can<br />
be stacked to accommodate variety of<br />
physical layouts by allowing more than<br />
one cable to be attached to any device.<br />
Photo and caption used with permission<br />
of Hewlett-Packard. Source: HP Journal,<br />
October 1972.<br />
But in today’s fast paced world<br />
standards, GPIB is slow. Today’s<br />
computers are running Quad Core<br />
3.4GHz microprocessor—multitasking,<br />
streaming videos, surfing the<br />
web, and crunching numbers—then<br />
they have to change gears, by slowing<br />
down to push data through GPIB cable<br />
that is 400 times slower. If you have<br />
ever tried to upload a signal to an<br />
arbitrary waveform generator or pull<br />
a trace from an oscilloscope, you know<br />
what I am talking about.<br />
The demise of GPIB is not just<br />
going to be speed; economics is also<br />
one of the driving forces. GPIB chips<br />
are expensive, because they lack the<br />
economy of scale compared to other<br />
more predominate communication<br />
chips like TCP/IP. The average GPIB<br />
cards cost over $350 dollars, whereas<br />
a USB and network interface cards are<br />
under $5 bucks.<br />
Today, we are witnessing a change<br />
in instrumentation standards and<br />
computer technologies. As test<br />
equipment and computers become<br />
more hybridized, we will continue<br />
to see more of the innovations in<br />
computing technologies spill over<br />
into test equipment. USB and TCP/<br />
IP is just the start of this evolution—<br />
soon, things like Blue Tooth and<br />
even WiFi enable test equipment<br />
will be common. Everything new in<br />
computing technology will eventually<br />
be integrated into test equipment.<br />
As communication standards like<br />
LXI and USB-UTMC are adopted by<br />
the industry, GPIB is slowly becoming<br />
a relic of the past. Technicians of<br />
tomorrow will be both measurement<br />
experts and information technology<br />
professionals. They will have to<br />
understand TCP/IP configuration for<br />
both LAN & WAN configurations—<br />
security, virus protection, computer<br />
backup operations, as well as imaging<br />
a full computer system. They will<br />
need full administrative privileges to<br />
install USB instruments. In a sense,<br />
your calibration labs will become<br />
a microcosm of computer support<br />
specialists.<br />
<strong>Cal</strong> <strong>Lab</strong>: The International Journal of Metrology<br />
44 Apr • May • Jun 2013
Edison<br />
Mudcats<br />
TM<br />
Metrology Software<br />
COMPREHENSIVE SOFTWARE<br />
FOR TODAY’S <strong>METROLOGY</strong> CHALLENGES<br />
CALIBRATION TOOLS<br />
<strong>Cal</strong>ibration Data Collection<br />
Automation and Scripting<br />
GPIB/RS-232 Automated Data Sheets<br />
Automatic OOT Detection<br />
Multi-Channel Data Collection<br />
Communicate with other Software<br />
via COM<br />
ENGINEERING TOOLS<br />
Specification Tracking<br />
Automated EMU/TAR/TUR<br />
Interval Analysis<br />
Standards Failure Analysis<br />
Conformance Testing<br />
Guard Banding<br />
Reverse Traceability to Test<br />
Point Level<br />
REPORTING TOOLS<br />
Integrated Custom Reports<br />
Report Management System<br />
Multiple Alternate User Reports<br />
Turn-around Time Reports<br />
Margin Reports<br />
MANAGEMENT TOOLS<br />
Production Tracking<br />
Status and Scheduling<br />
Workload Planning/Management<br />
Vendor Tracking<br />
Intralab Communications<br />
Customer Status Reports<br />
<strong>Cal</strong>ibration Asset Management<br />
Process Control<br />
Standards Utilization Tracking<br />
ADMINISTRATION TOOLS<br />
Robust Security and Audit Trail<br />
Documents/Reports<br />
Shipping and Invoicing Functions<br />
Revision Control<br />
<strong>Cal</strong>ibration Cost Tracking<br />
Paperless <strong>Cal</strong>ibration History<br />
Remote Operation<br />
GENERAL FEATURES<br />
U.S. Patent #7406388<br />
Barcode Compatible<br />
E-Sign Password Transaction Protection<br />
Integrated Email Profiles<br />
<strong>Cal</strong>l Us Today: 800-266-2299<br />
Or Visit Online: edisonmudcats.com
Discover the<br />
“Blue Box”<br />
Difference <br />
The MI Product you’ve been waiting for...<br />
Fall 2013<br />
www.mintl.com