METROLOGY 101: PISTON PROVER DESIGN - Cal Lab Magazine
METROLOGY 101: PISTON PROVER DESIGN - Cal Lab Magazine
METROLOGY 101: PISTON PROVER DESIGN - Cal Lab Magazine

Create successful ePaper yourself
Turn your PDF publications into a flip-book with our unique Google optimized e-Paper software.
Metrology: Standardize and Automate!<br />
Mark Kuster<br />
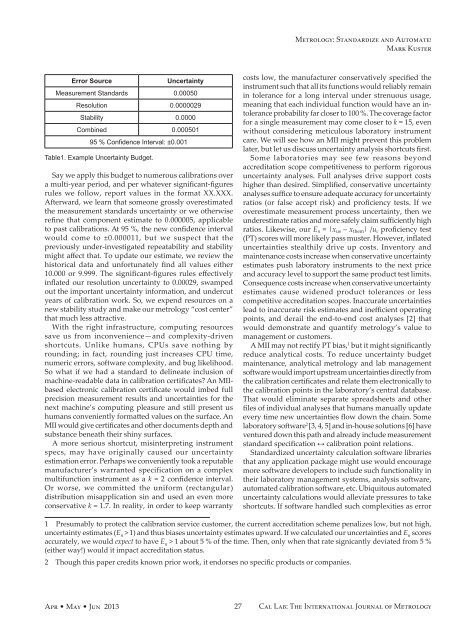
Error Source<br />
Uncertainty<br />
Measurement Standards 0.00050<br />
Resolution 0.0000029<br />
Stability 0.0000<br />
Combined 0.000501<br />
95 % Confidence Interval: ±0.001<br />
Table1. Example Uncertainty Budget.<br />
Say we apply this budget to numerous calibrations over<br />
a multi-year period, and per whatever significant-figures<br />
rules we follow, report values in the format XX.XXX.<br />
Afterward, we learn that someone grossly overestimated<br />
the measurement standards uncertainty or we otherwise<br />
refine that component estimate to 0.000005, applicable<br />
to past calibrations. At 95 %, the new confidence interval<br />
would come to ±0.000011, but we suspect that the<br />
previously under-investigated repeatability and stability<br />
might affect that. To update our estimate, we review the<br />
historical data and unfortunately find all values either<br />
10.000 or 9.999. The significant-figures rules effectively<br />
inflated our resolution uncertainty to 0.00029, swamped<br />
out the important uncertainty information, and undercut<br />
years of calibration work. So, we expend resources on a<br />
new stability study and make our metrology “cost center”<br />
that much less attractive.<br />
With the right infrastructure, computing resources<br />
save us from inconvenience—and complexity-driven<br />
shortcuts. Unlike humans, CPUs save nothing by<br />
rounding; in fact, rounding just increases CPU time,<br />
numeric errors, software complexity, and bug likelihood.<br />
So what if we had a standard to delineate inclusion of<br />
machine-readable data in calibration certificates? An MIIbased<br />
electronic calibration certificate would imbed full<br />
precision measurement results and uncertainties for the<br />
next machine’s computing pleasure and still present us<br />
humans conveniently formatted values on the surface. An<br />
MII would give certificates and other documents depth and<br />
substance beneath their shiny surfaces.<br />
A more serious shortcut, misinterpreting instrument<br />
specs, may have originally caused our uncertainty<br />
estimation error. Perhaps we conveniently took a reputable<br />
manufacturer’s warranted specification on a complex<br />
multifunction instrument as a k = 2 confidence interval.<br />
Or worse, we committed the uniform (rectangular)<br />
distribution misapplication sin and used an even more<br />
conservative k = 1.7. In reality, in order to keep warranty<br />
costs low, the manufacturer conservatively specified the<br />
instrument such that all its functions would reliably remain<br />
in tolerance for a long interval under strenuous usage,<br />
meaning that each individual function would have an intolerance<br />
probability far closer to 100 %. The coverage factor<br />
for a single measurement may come closer to k = 15, even<br />
without considering meticulous laboratory instrument<br />
care. We will see how an MII might prevent this problem<br />
later, but let us discuss uncertainty analysis shortcuts first.<br />
Some laboratories may see few reasons beyond<br />
accreditation scope competitiveness to perform rigorous<br />
uncertainty analyses. Full analyses drive support costs<br />
higher than desired. Simplified, conservative uncertainty<br />
analyses suffice to ensure adequate accuracy for uncertainty<br />
ratios (or false accept risk) and proficiency tests. If we<br />
overestimate measurement process uncertainty, then we<br />
underestimate ratios and more safely claim sufficiently high<br />
ratios. Likewise, our E n = |x us – x them | /u c proficiency test<br />
(PT) scores will more likely pass muster. However, inflated<br />
uncertainties stealthily drive up costs. Inventory and<br />
maintenance costs increase when conservative uncertainty<br />
estimates push laboratory instruments to the next price<br />
and accuracy level to support the same product test limits.<br />
Consequence costs increase when conservative uncertainty<br />
estimates cause widened product tolerances or less<br />
competitive accreditation scopes. Inaccurate uncertainties<br />
lead to inaccurate risk estimates and inefficient operating<br />
points, and derail the end-to-end cost analyses [2] that<br />
would demonstrate and quantify metrology’s value to<br />
management or customers.<br />
A MII may not rectify PT bias, 1 but it might significantly<br />
reduce analytical costs. To reduce uncertainty budget<br />
maintenance, analytical metrology and lab management<br />
software would import upstream uncertainties directly from<br />
the calibration certificates and relate them electronically to<br />
the calibration points in the laboratory’s central database.<br />
That would eliminate separate spreadsheets and other<br />
files of individual analyses that humans manually update<br />
every time new uncertainties flow down the chain. Some<br />
laboratory software 2 [3, 4, 5] and in-house solutions [6] have<br />
ventured down this path and already include measurement<br />
standard specification ↔ calibration point relations.<br />
Standardized uncertainty calculation software libraries<br />
that any application package might use would encourage<br />
more software developers to include such functionality in<br />
their laboratory management systems, analysis software,<br />
automated calibration software, etc. Ubiquitous automated<br />
uncertainty calculations would alleviate pressures to take<br />
shortcuts. If software handled such complexities as error<br />
1 Presumably to protect the calibration service customer, the current accreditation scheme penalizes low, but not high,<br />
uncertainty estimates (E n > 1) and thus biases uncertainty estimates upward. If we calculated our uncertainties and E n scores<br />
accurately, we would expect to have E n > 1 about 5 % of the time. Then, only when that rate signicantly deviated from 5 %<br />
(either way!) would it impact accreditation status.<br />
2 Though this paper credits known prior work, it endorses no specific products or companies.<br />
Apr • May • Jun 2013<br />
27<br />
<strong>Cal</strong> <strong>Lab</strong>: The International Journal of Metrology