METROLOGY 101: PISTON PROVER DESIGN - Cal Lab Magazine
METROLOGY 101: PISTON PROVER DESIGN - Cal Lab Magazine
METROLOGY 101: PISTON PROVER DESIGN - Cal Lab Magazine

You also want an ePaper? Increase the reach of your titles
YUMPU automatically turns print PDFs into web optimized ePapers that Google loves.
<br />
with fundamental uncertainties and DOF<br />
unique identifiers for the particular dissemination. Null<br />
3.274 mV<br />
GUIDs indicate quantities independently and identicallydistributed<br />
(iid) over time that did not provide traceability<br />
u f<br />
= 379.1 µrad ( (2)<br />
6.251 µA<br />
) , v f ( = 4.0<br />
0.6<br />
) . 5<br />
−2.3<br />
for more than one simultaneous measurement and thus<br />
Metrology: Standardize and Automate!<br />
Mark Kuster<br />
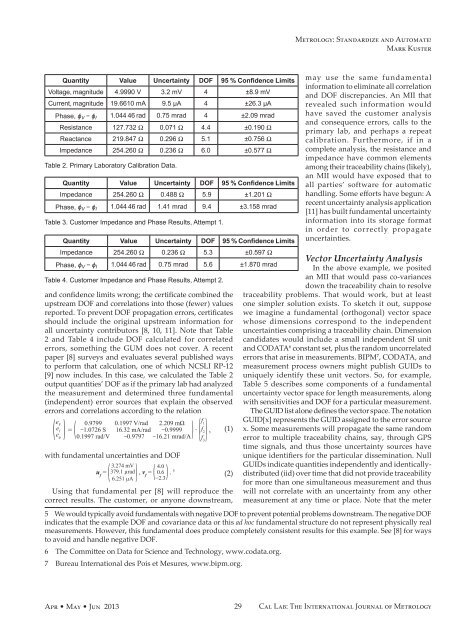
Quantity Value Uncertainty DOF 95 % Confidence Limits may use the same fundamental<br />
information to eliminate all correlation<br />
Voltage, magnitude 4.9990 V 3.2 mV 4 ±8.9 mV<br />
and DOF discrepancies. An MII that<br />
Current, magnitude 19.6610 mA 9.5 µA 4 ±26.3 µA revealed such information would<br />
Phase, ϕ have saved the customer analysis<br />
V − ϕ I 1.044 46 rad 0.75 mrad 4 ±2.09 mrad<br />
and consequence errors, calls to the<br />
Resistance 127.732 Ω 0.071 Ω 4.4 ±0.190 Ω<br />
primary lab, and perhaps a repeat<br />
Reactance 219.847 Ω 0.296 Ω 5.1 ±0.756 Ω calibration. Furthermore, if in a<br />
Impedance 254.260 Ω 0.236 Ω 6.0 ±0.577 Ω complete analysis, the resistance and<br />
impedance have common elements<br />
Table 2. Primary <strong>Lab</strong>oratory <strong>Cal</strong>ibration Data.<br />
among their traceability chains (likely),<br />
Quantity Value Uncertainty DOF 95 % Confidence Limits<br />
an MII would have exposed that to<br />
all parties’ software for automatic<br />
Impedance 254.260 Ω 0.488 Ω 5.9 ±1.201 Ω handling. Some efforts have begun: A<br />
Phase, ϕ V − ϕ I 1.044 46 rad 1.41 mrad 9.4 ±3.158 mrad<br />
recent uncertainty analysis application<br />
[11] has built fundamental uncertainty<br />
Table 3. Customer Impedance and Phase Results, Attempt 1.<br />
information into its storage format<br />
Quantity Value Uncertainty DOF 95 % Confidence Limits<br />
in order to correctly propagate<br />
uncertainties.<br />
Impedance 254.260 Ω 0.236 Ω 5.3 ±0.597 Ω<br />
Vector Uncertainty Analysis<br />
Phase, ϕ V − ϕ I 1.044 46 rad 0.75 mrad 5.6 ±1.870 mrad<br />
In the above example, we posited<br />
Table 4. Customer Impedance and Phase Results, Attempt 2.<br />
and confidence limits wrong; the certificate combined the<br />
upstream DOF and correlations into those (fewer) values<br />
reported. To prevent DOF propagation errors, certificates<br />
should include the original upstream information for<br />
all uncertainty contributors [8, 10, 11]. Note that Table<br />
2 and Table 4 include DOF calculated for correlated<br />
errors, something the GUM does not cover. A recent<br />
paper [8] surveys and evaluates several published ways<br />
to perform that calculation, one of which NCSLI RP-12<br />
[9] now includes. In this case, we calculated the Table 2<br />
output quantities’ DOF as if the primary lab had analyzed<br />
the measurement and determined three fundamental<br />
(independent) error sources that explain the observed<br />
an MII that would pass co-variances<br />
down the traceability chain to resolve<br />
traceability problems. That would work, but at least<br />
one simpler solution exists. To sketch it out, suppose<br />
we imagine a fundamental (orthogonal) vector space<br />
whose dimensions correspond to the independent<br />
uncertainties comprising a traceability chain. Dimension<br />
candidates would include a small independent SI unit<br />
and CODATA 6 constant set, plus the random uncorrelated<br />
errors that arise in measurements. BIPM 7 , CODATA, and<br />
measurement process owners might publish GUIDs to<br />
uniquely identify these unit vectors. So, for example,<br />
Table 5 describes some components of a fundamental<br />
uncertainty vector space for length measurements, along<br />
with sensitivities and DOF for a particular measurement.<br />
errors and correlations according to the relation<br />
The GUID list alone defines the vector space. The notation<br />
e GUID[x] represents the GUID assigned to the error source<br />
(1) x. Some measurements will propagate the same random<br />
(<br />
V<br />
<br />
e I e ϕ<br />
) = 0.9799 0.1997 V/rad<br />
f<br />
2.209 mΩ<br />
( −1.0726 S 16.32 mA/rad −0.9999<br />
)<br />
0.1997 rad/V −0.9797 −16.21 mrad/A (<br />
1<br />
<br />
∙ f 2<br />
<br />
f 3<br />
) ,<br />
error to multiple traceability chains, say, through GPS<br />
time signals, and thus those uncertainty sources have<br />
Using that fundamental per [8] will reproduce the<br />
correct results. The customer, or anyone downstream,<br />
will not correlate with an uncertainty from any other<br />
measurement at any time or place. Note that the meter<br />
5 We would typically avoid fundamentals with negative DOF to prevent potential problems downstream. The negative DOF<br />
indicates that the example DOF and covariance data or this ad hoc fundamental structure do not represent physically real<br />
measurements. However, this fundamental does produce completely consistent results for this example. See [8] for ways<br />
to avoid and handle negative DOF.<br />
6 The Committee on Data for Science and Technology, www.codata.org.<br />
7 Bureau International des Pois et Mesures, www.bipm.org.<br />
Apr • May • Jun 2013<br />
29<br />
<strong>Cal</strong> <strong>Lab</strong>: The International Journal of Metrology