A6 Interpreting distance–time graphs - Great Maths Teaching Ideas
A6 Interpreting distance–time graphs - Great Maths Teaching Ideas
A6 Interpreting distance–time graphs - Great Maths Teaching Ideas

Create successful ePaper yourself
Turn your PDF publications into a flip-book with our unique Google optimized e-Paper software.
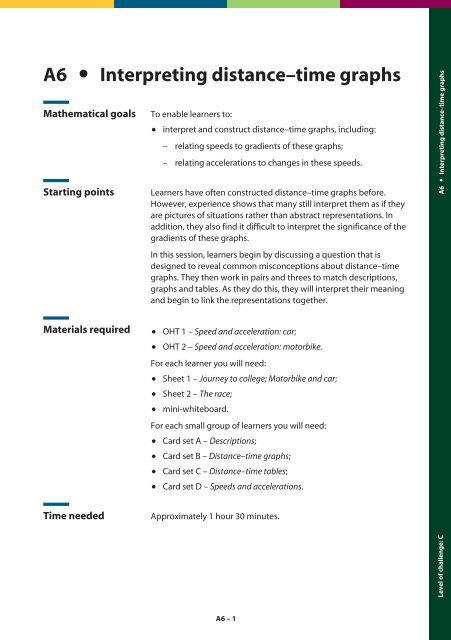
Level <strong>A6</strong> of challenge: C<strong>A6</strong>Mathematical goalsStarting pointsMaterials requiredTime needed<strong>Interpreting</strong> <strong>distance–time</strong> <strong>graphs</strong>To enable learners to: interpret and construct <strong>distance–time</strong> <strong>graphs</strong>, including:– relating speeds to gradients of these <strong>graphs</strong>;– relating accelerations to changes in these speeds.Learners have often constructed <strong>distance–time</strong> <strong>graphs</strong> before.However, experience shows that many still interpret them as if theyare pictures of situations rather than abstract representations. Inaddition, they also find it difficult to interpret the significance of thegradients of these <strong>graphs</strong>.In this session, learners begin by discussing a question that isdesigned to reveal common misconceptions about <strong>distance–time</strong><strong>graphs</strong>. They then work in pairs and threes to match descriptions,<strong>graphs</strong> and tables. As they do this, they will interpret their meaningand begin to link the representations together. OHT 1 – Speed and acceleration: car; OHT 2 – Speed and acceleration: motorbike.For each learner you will need: Sheet 1 – Journey to college; Motorbike and car; Sheet 2 – The race; mini-whiteboard.For each small group of learners you will need: Card set A – Descriptions; Card set B – Distance–time <strong>graphs</strong>; Card set C – Distance–time tables; Card set D – Speeds and accelerations.Approximately 1 hour 30 minutes.Level of challenge: C <strong>A6</strong> <strong>Interpreting</strong> <strong>distance–time</strong> <strong>graphs</strong><strong>A6</strong>–1
Level of challenge: C <strong>A6</strong> <strong>Interpreting</strong> <strong>distance–time</strong> <strong>graphs</strong>Suggested approachBeginning the sessionAsk learners to tackle the two questions on Sheet 1 – Journey tocollege and Motorbike and car, working in pairs. Both questions asklearners to interpret <strong>distance–time</strong> <strong>graphs</strong>.As you listen to pairs tackling the first question, watch for evidenceof misconceptions such as the following:When she gets out she starts walking fast to the bus stop,then she slows down, then she picks up speed again, andthen the speed goes constant.Jane walked along a road for 100 m. Instead of walkinganother 30 m she took a short cut down an alleyway whichtook her 20 minutes. She walked very quickly then she caughtthe bus to her college which took about 50 minutes.In the second question, many learners assume that the vehicles aretravelling at the same speed at the point where the <strong>graphs</strong> cross.Encourage learners to discuss their answers with other pairs. Do notcomment at this stage. After a few have shared their ideas, begin tochallenge them for more details, such as the speed at each point onthe <strong>graphs</strong>. Ask learners to describe the evidence for each aspect oftheir description. If the errors in the two stories quoted above donot arise naturally, read the stories out and ask learners to explainthe mistakes.Finally, use OHTs 1 – Speed and acceleration: car and 2 – Speed andacceleration: motorbike to describe how the speeds andaccelerations are related to the gradients of the <strong>graphs</strong>.Working in groupsAsk learners to work in groups of two or three and give out Cardsets A – Descriptions and B – Distance–time <strong>graphs</strong>.Ask learners to take it in turns to match pairs of cards from each set.This is not a one-to-one matching. If learners think that any cardsare missing, they should create their own.When learners have had enough time to tackle the task, give outCard sets C – Distance–time tables and D – Speeds and accelerations.These should be matched to the cards already on the table.Although there are no scales on the <strong>graphs</strong> on Card set D, learnersmay be able to work out the correct matching by considering thedifferences between successive terms in the tables.<strong>A6</strong>–2
Level of challenge: C <strong>A6</strong> <strong>Interpreting</strong> <strong>distance–time</strong> <strong>graphs</strong>BLANK PAGE FOR NOTES<strong>A6</strong>–4
<strong>A6</strong> Sheet 1 – Journey to college; Motorbike and carJourney to college<strong>A6</strong> <strong>Interpreting</strong> <strong>distance–time</strong> <strong>graphs</strong>Every morning Jane walks along a straight road to a bus stop 160 metres from her home,where she catches a bus to college.The graph shows her journey on one particular day.Write a description of what may have happened.You should include details such as how fast she walked.Motorbike and carThis graph shows a vintage car and a motorbike travelling along a country road.Write a description of what is happening. At what time are they travelling at the samespeed?<strong>A6</strong>–5
<strong>A6</strong> OHT 1 – Speed and acceleration: car<strong>A6</strong> <strong>Interpreting</strong> <strong>distance–time</strong> <strong>graphs</strong>Time (s) 0 1 2 3 4 5 6Distance (m) 10 20 30 40 50 60 70→ → → → → →+10 +10 +10 +10 +10 +10Car travels at a constant speed of 10 m s –1 .<strong>A6</strong>–6
<strong>A6</strong> OHT 2 – Speed and acceleration: motorbike<strong>A6</strong> <strong>Interpreting</strong> <strong>distance–time</strong> <strong>graphs</strong>Time (s) 0 1 2 3 4 5 6Distance (m) 0 5 15 30 50 75 ?→ → → → → →+5 +10 +15 +20 +25 +?Each second, the average speed of the bike increases by 5 m s –1 .Acceleration is 5 m s –2 .<strong>A6</strong>–7
<strong>A6</strong> Card set A – DescriptionsTravels towardshomeTravels awayfrom home<strong>A6</strong> <strong>Interpreting</strong> <strong>distance–time</strong> <strong>graphs</strong>Goes at a steady,slow speedNotmovingImpossiblejourneyGoes at a steady,fast speedStopssuddenlySlows down andstopsSpeedsup<strong>A6</strong>–8
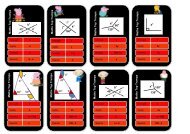
<strong>A6</strong> Card set B – Distance–time <strong>graphs</strong><strong>A6</strong> <strong>Interpreting</strong> <strong>distance–time</strong> <strong>graphs</strong><strong>A6</strong>–9
<strong>A6</strong> Card set C – Distance–time tablesATime 0 1 2 3 4 5Distance 0 45 80 105 120 125BTime 0 1 2 3 4 5<strong>A6</strong> <strong>Interpreting</strong> <strong>distance–time</strong> <strong>graphs</strong>Distance 125 120 105 80 45 0CTime 0 1 2 3 4 5Distance 0 5 20 45 80 125DTime 0 1 2 3 4 5Distance 125 80 45 20 5 0ETime 0 1 2 3 4 5Distance 50 50 50 50 50 50FTime 0 1 2 3 4 5Distance 0 25 50 75 100 125GTime 0 1 2 3 4 5Distance 125 117 109 101 93 85<strong>A6</strong>–10
<strong>A6</strong> Card set C – Distance–time tablesHTime 0 1 2 3 4 5Distance 85 93 101 109 117 125ITime 0 1 2 3 4 5<strong>A6</strong> <strong>Interpreting</strong> <strong>distance–time</strong> <strong>graphs</strong>Distance 125 100 75 50 25 0JTime 0 1 2 3 4 5Distance<strong>A6</strong>–11
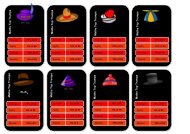
<strong>A6</strong> Card set D – Speeds and accelerationsSpeedAcceleration25 m s –1 10 m s –2<strong>A6</strong> <strong>Interpreting</strong> <strong>distance–time</strong> <strong>graphs</strong>SpeedDeceleration8 m s –1 10 m s –2SpeedAcceleration0 m s –1 0 m s –2<strong>A6</strong>–12
<strong>A6</strong> Sheet 2 – The race<strong>A6</strong> <strong>Interpreting</strong> <strong>distance–time</strong> <strong>graphs</strong>The graph shows the motion of two racing cars as they approach and go round a bend ona racetrack.1. How far along the track is the bend?2. Make tables to show how the distance travelled by each car changes with time.3. How does the distance between the two cars vary?4. How does the time interval between the two cars vary?5. Can you work out the deceleration and acceleration of each car?6. During motor racing events, it seems that the car in front loses some of its leadwhen it approaches a bend, and then opens up a gap again afterwards. Why isthis? Are the chasing cars really catching up?<strong>A6</strong>–13