A6 Interpreting distance–time graphs - Great Maths Teaching Ideas
A6 Interpreting distance–time graphs - Great Maths Teaching Ideas
A6 Interpreting distance–time graphs - Great Maths Teaching Ideas
Create successful ePaper yourself
Turn your PDF publications into a flip-book with our unique Google optimized e-Paper software.
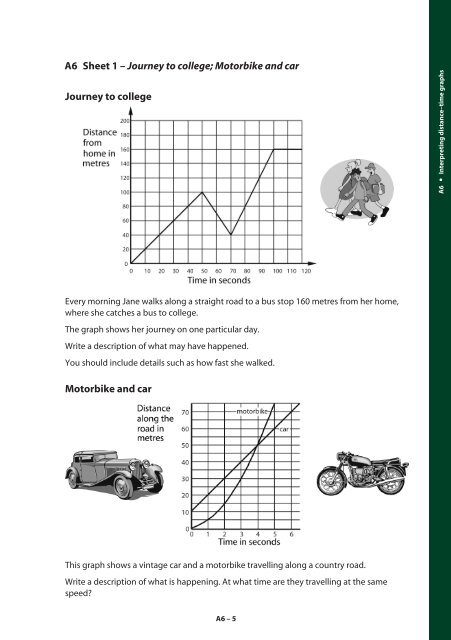
<strong>A6</strong> Sheet 1 – Journey to college; Motorbike and carJourney to college<strong>A6</strong> <strong>Interpreting</strong> <strong>distance–time</strong> <strong>graphs</strong>Every morning Jane walks along a straight road to a bus stop 160 metres from her home,where she catches a bus to college.The graph shows her journey on one particular day.Write a description of what may have happened.You should include details such as how fast she walked.Motorbike and carThis graph shows a vintage car and a motorbike travelling along a country road.Write a description of what is happening. At what time are they travelling at the samespeed?<strong>A6</strong>–5


