A6 Interpreting distance–time graphs - Great Maths Teaching Ideas
A6 Interpreting distance–time graphs - Great Maths Teaching Ideas
A6 Interpreting distance–time graphs - Great Maths Teaching Ideas
SHOW LESS

Create successful ePaper yourself
Turn your PDF publications into a flip-book with our unique Google optimized e-Paper software.
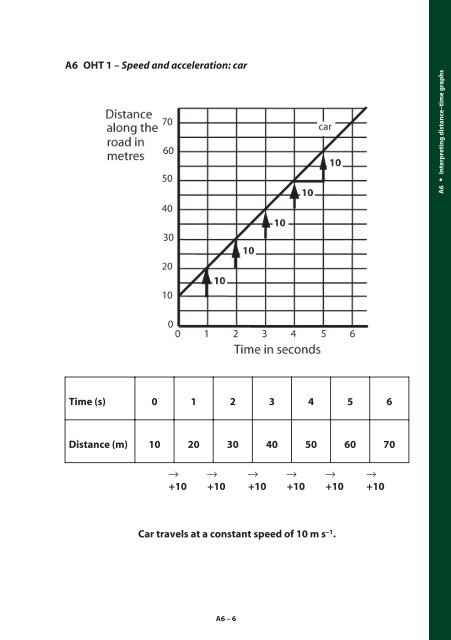
<strong>A6</strong> OHT 1 – Speed and acceleration: car<strong>A6</strong> <strong>Interpreting</strong> <strong>distance–time</strong> <strong>graphs</strong>Time (s) 0 1 2 3 4 5 6Distance (m) 10 20 30 40 50 60 70→ → → → → →+10 +10 +10 +10 +10 +10Car travels at a constant speed of 10 m s –1 .<strong>A6</strong>–6