A6 Interpreting distance–time graphs - Great Maths Teaching Ideas
A6 Interpreting distance–time graphs - Great Maths Teaching Ideas
A6 Interpreting distance–time graphs - Great Maths Teaching Ideas

You also want an ePaper? Increase the reach of your titles
YUMPU automatically turns print PDFs into web optimized ePapers that Google loves.
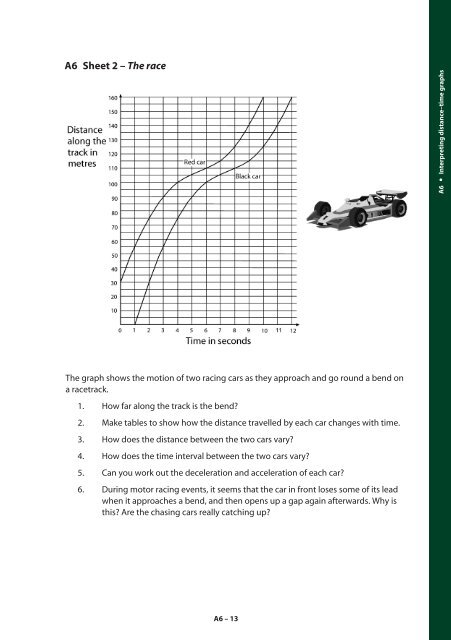
<strong>A6</strong> Sheet 2 – The race<strong>A6</strong> <strong>Interpreting</strong> <strong>distance–time</strong> <strong>graphs</strong>The graph shows the motion of two racing cars as they approach and go round a bend ona racetrack.1. How far along the track is the bend?2. Make tables to show how the distance travelled by each car changes with time.3. How does the distance between the two cars vary?4. How does the time interval between the two cars vary?5. Can you work out the deceleration and acceleration of each car?6. During motor racing events, it seems that the car in front loses some of its leadwhen it approaches a bend, and then opens up a gap again afterwards. Why isthis? Are the chasing cars really catching up?<strong>A6</strong>–13