Sensitivity of Radioluminography using 14C-Labeled Tracers in ...
Sensitivity of Radioluminography using 14C-Labeled Tracers in ...
Sensitivity of Radioluminography using 14C-Labeled Tracers in ...

Create successful ePaper yourself
Turn your PDF publications into a flip-book with our unique Google optimized e-Paper software.
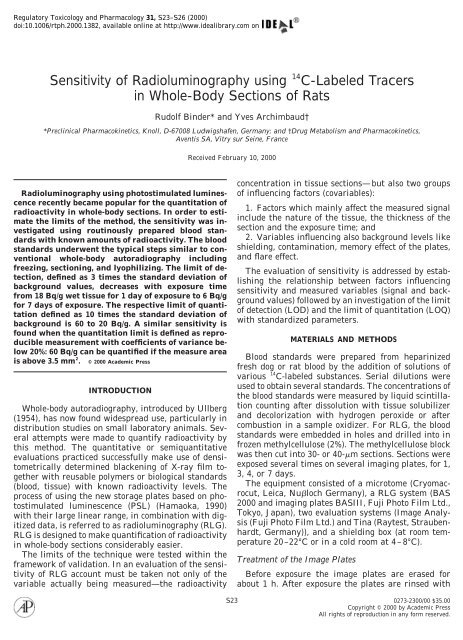
Regulatory Toxicology and Pharmacology 31, S23–S26 (2000)<br />
doi:10.1006/rtph.2000.1382, available onl<strong>in</strong>e at http://www.idealibrary.com on<br />
<strong>Sensitivity</strong> <strong>of</strong> <strong>Radiolum<strong>in</strong>ography</strong> <strong>us<strong>in</strong>g</strong> 14 C-<strong>Labeled</strong> <strong>Tracers</strong><br />
<strong>in</strong> Whole-Body Sections <strong>of</strong> Rats<br />
Rudolf B<strong>in</strong>der* and Yves Archimbaud†<br />
*Precl<strong>in</strong>ical Pharmacok<strong>in</strong>etics, Knoll, D-67008 Ludwigshafen, Germany; and †Drug Metabolism and Pharmacok<strong>in</strong>etics,<br />
Aventis SA, Vitry sur Se<strong>in</strong>e, France<br />
<strong>Radiolum<strong>in</strong>ography</strong> <strong>us<strong>in</strong>g</strong> photostimulated lum<strong>in</strong>escence<br />
recently became popular for the quantitation <strong>of</strong><br />
radioactivity <strong>in</strong> whole-body sections. In order to estimate<br />
the limits <strong>of</strong> the method, the sensitivity was <strong>in</strong>vestigated<br />
<strong>us<strong>in</strong>g</strong> rout<strong>in</strong>ously prepared blood standards<br />
with known amounts <strong>of</strong> radioactivity. The blood<br />
standards underwent the typical steps similar to conventional<br />
whole-body autoradiography <strong>in</strong>clud<strong>in</strong>g<br />
freez<strong>in</strong>g, section<strong>in</strong>g, and lyophiliz<strong>in</strong>g. The limit <strong>of</strong> detection,<br />
def<strong>in</strong>ed as 3 times the standard deviation <strong>of</strong><br />
background values, decreases with exposure time<br />
from 18 Bq/g wet tissue for 1 day <strong>of</strong> exposure to 6 Bq/g<br />
for 7 days <strong>of</strong> exposure. The respective limit <strong>of</strong> quantitation<br />
def<strong>in</strong>ed as 10 times the standard deviation <strong>of</strong><br />
background is 60 to 20 Bq/g. A similar sensitivity is<br />
found when the quantitation limit is def<strong>in</strong>ed as reproducible<br />
measurement with coefficients <strong>of</strong> variance below<br />
20%: 60 Bq/g can be quantified if the measure area<br />
is above 3.5 mm 2 . © 2000 Academic Press<br />
INTRODUCTION<br />
Whole-body autoradiography, <strong>in</strong>troduced by Ullberg<br />
(1954), has now found widespread use, particularly <strong>in</strong><br />
distribution studies on small laboratory animals. Several<br />
attempts were made to quantify radioactivity by<br />
this method. The quantitative or semiquantitative<br />
evaluations practiced successfully make use <strong>of</strong> densitometrically<br />
determ<strong>in</strong>ed blacken<strong>in</strong>g <strong>of</strong> X-ray film together<br />
with reusable polymers or biological standards<br />
(blood, tissue) with known radioactivity levels. The<br />
process <strong>of</strong> <strong>us<strong>in</strong>g</strong> the new storage plates based on photostimulated<br />
lum<strong>in</strong>escence (PSL) (Hamaoka, 1990)<br />
with their large l<strong>in</strong>ear range, <strong>in</strong> comb<strong>in</strong>ation with digitized<br />
data, is referred to as radiolum<strong>in</strong>ography (RLG).<br />
RLG is designed to make quantification <strong>of</strong> radioactivity<br />
<strong>in</strong> whole-body sections considerably easier.<br />
The limits <strong>of</strong> the technique were tested with<strong>in</strong> the<br />
framework <strong>of</strong> validation. In an evaluation <strong>of</strong> the sensitivity<br />
<strong>of</strong> RLG account must be taken not only <strong>of</strong> the<br />
variable actually be<strong>in</strong>g measured—the radioactivity<br />
Received February 10, 2000<br />
S23<br />
concentration <strong>in</strong> tissue sections—but also two groups<br />
<strong>of</strong> <strong>in</strong>fluenc<strong>in</strong>g factors (covariables):<br />
1. Factors which ma<strong>in</strong>ly affect the measured signal<br />
<strong>in</strong>clude the nature <strong>of</strong> the tissue, the thickness <strong>of</strong> the<br />
section and the exposure time; and<br />
2. Variables <strong>in</strong>fluenc<strong>in</strong>g also background levels like<br />
shield<strong>in</strong>g, contam<strong>in</strong>ation, memory effect <strong>of</strong> the plates,<br />
and flare effect.<br />
The evaluation <strong>of</strong> sensitivity is addressed by establish<strong>in</strong>g<br />
the relationship between factors <strong>in</strong>fluenc<strong>in</strong>g<br />
sensitivity and measured variables (signal and background<br />
values) followed by an <strong>in</strong>vestigation <strong>of</strong> the limit<br />
<strong>of</strong> detection (LOD) and the limit <strong>of</strong> quantitation (LOQ)<br />
with standardized parameters.<br />
MATERIALS AND METHODS<br />
Blood standards were prepared from hepar<strong>in</strong>ized<br />
fresh dog or rat blood by the addition <strong>of</strong> solutions <strong>of</strong><br />
various 14 C-labeled substances. Serial dilutions were<br />
used to obta<strong>in</strong> several standards. The concentrations <strong>of</strong><br />
the blood standards were measured by liquid sc<strong>in</strong>tillation<br />
count<strong>in</strong>g after dissolution with tissue solubilizer<br />
and decolorization with hydrogen peroxide or after<br />
combustion <strong>in</strong> a sample oxidizer. For RLG, the blood<br />
standards were embedded <strong>in</strong> holes and drilled <strong>in</strong>to <strong>in</strong><br />
frozen methylcellulose (2%). The methylcellulose block<br />
was then cut <strong>in</strong>to 30- or 40-�m sections. Sections were<br />
exposed several times on several imag<strong>in</strong>g plates, for 1,<br />
3, 4, or 7 days.<br />
The equipment consisted <strong>of</strong> a microtome (Cryomacrocut,<br />
Leica, Nu�loch Germany), a RLG system (BAS<br />
2000 and imag<strong>in</strong>g plates BASIII, Fuji Photo Film Ltd.,<br />
Tokyo, Japan), two evaluation systems (Image Analysis<br />
(Fuji Photo Film Ltd.) and T<strong>in</strong>a (Raytest, Straubenhardt,<br />
Germany)), and a shield<strong>in</strong>g box (at room temperature<br />
20–22°C or <strong>in</strong> a cold room at 4–8°C).<br />
Treatment <strong>of</strong> the Image Plates<br />
Before exposure the image plates are erased for<br />
about 1 h. After exposure the plates are r<strong>in</strong>sed with<br />
0273-2300/00 $35.00<br />
Copyright © 2000 by Academic Press<br />
All rights <strong>of</strong> reproduction <strong>in</strong> any form reserved.
S24 BINDER AND ARCHIMBAUD<br />
FIG. 1. Dependency <strong>of</strong> signal and background values on exposure time at room temperature and under cool<strong>in</strong>g conditions (�8°C).<br />
ethanol, erased for about 1 h, and stored <strong>in</strong> the shield<strong>in</strong>g<br />
box until they are used aga<strong>in</strong>.<br />
Evaluation<br />
The radioactivity concentrations were calculated<br />
from the measurements (PSL/mm 2 ) with the aid <strong>of</strong> a<br />
calibration curve generated by fitt<strong>in</strong>g radioactivity concentrations<br />
(Bq/g) and relative <strong>in</strong>tensities (PSL-bkg/<br />
mm 2 ) <strong>us<strong>in</strong>g</strong> a l<strong>in</strong>ear or logarithmic l<strong>in</strong>ear regression<br />
method. The effective radiation response (PSL-bkg)<br />
was derived by subtraction <strong>of</strong> background from the<br />
PSL value measured.<br />
Different approaches for determ<strong>in</strong><strong>in</strong>g the limit <strong>of</strong><br />
detection and <strong>of</strong> quantitation were used. One is based<br />
on the standard deviation <strong>of</strong> the background and the<br />
other is based on the coefficient <strong>of</strong> variation <strong>of</strong> radioactivity<br />
concentrations.<br />
The limit <strong>of</strong> detection was def<strong>in</strong>ed as 3 times the<br />
standard deviation <strong>of</strong> background values. The limit <strong>of</strong><br />
quantitation was def<strong>in</strong>ed either as 10 times the standard<br />
deviation <strong>of</strong> background values or as the radioactivity<br />
concentration for which the coefficient <strong>of</strong> variation<br />
was less than 20%.<br />
RESULTS<br />
Influenc<strong>in</strong>g Factors<br />
The values obta<strong>in</strong>ed <strong>in</strong> quantitative radiolum<strong>in</strong>ography<br />
varied with the nature <strong>of</strong> the tissue, section thickness,<br />
area <strong>of</strong> the section be<strong>in</strong>g <strong>in</strong>tegrated, the imag<strong>in</strong>g<br />
plates, and the conditions <strong>of</strong> exposure.<br />
Nature <strong>of</strong> the Tissue and Section Thickness<br />
Thicker sections produce a stronger signal and thus<br />
<strong>in</strong> pr<strong>in</strong>ciple allow higher sensitivity, but the sensitivity<br />
improvement is limited by the nonl<strong>in</strong>earity <strong>of</strong> this relationship<br />
ow<strong>in</strong>g to self-absorption (Maas et al., 2000,<br />
Kle<strong>in</strong> at al., 2000).<br />
Exposure Time<br />
The measured signal <strong>in</strong>creased proportionally with<br />
the <strong>in</strong>crease <strong>of</strong> duration <strong>of</strong> exposure from 1 to 7 days,<br />
for both room temperature and refrigerated conditions.<br />
The measured signal then plateaued after 7 days at<br />
room temperature, but cont<strong>in</strong>ued to <strong>in</strong>crease <strong>in</strong> the<br />
presence <strong>of</strong> cool<strong>in</strong>g (Fig. 1).<br />
Shield<strong>in</strong>g<br />
Lead shield<strong>in</strong>g reduces the blank value especially for<br />
longer exposure times and thus greatly improves the<br />
signal/background ratio.<br />
Contam<strong>in</strong>ation and Memory Effect<br />
Three k<strong>in</strong>ds <strong>of</strong> contam<strong>in</strong>ation artifacts may be dist<strong>in</strong>guished:<br />
1. Contam<strong>in</strong>ation due to carryover: Lyophilized material<br />
may adhere to the imag<strong>in</strong>g plates by means <strong>of</strong><br />
electrostatic charge.<br />
2. Permanent contam<strong>in</strong>ation <strong>of</strong> the imag<strong>in</strong>g plates:<br />
Strongly lipophilic compounds may penetrate <strong>in</strong>to the<br />
protective layer <strong>of</strong> the image plates, dur<strong>in</strong>g previous<br />
exposures. Contam<strong>in</strong>ation can <strong>of</strong>ten be prevented by<br />
<strong>us<strong>in</strong>g</strong> a protective film.
TABLE 1<br />
Limit <strong>of</strong> Detection for Imag<strong>in</strong>g Plates after 1, 3, 4,<br />
and 7 Days <strong>of</strong> Exposure<br />
Unit<br />
3. Memory effects: Exposures with high radiation<br />
doses can produce long last<strong>in</strong>g images especially if the<br />
plates are not adequately erased.<br />
All three effects can adversely affect the sensitivity<br />
<strong>of</strong> the method by several orders <strong>of</strong> magnitude. Although<br />
contam<strong>in</strong>ation can be reduced by standardiz<strong>in</strong>g<br />
the procedures, a careful evaluation <strong>of</strong> each <strong>in</strong>dividual<br />
exposure is necessary, e.g., on the basis <strong>of</strong> background<br />
noise.<br />
Flare Effect<br />
With many scanners (<strong>in</strong>clud<strong>in</strong>g the Fuji BAS 2000<br />
used here) a flare effect <strong>in</strong> the scan direction occurs as<br />
a result <strong>of</strong> the scann<strong>in</strong>g mechanism. In flare-affected<br />
regions quantitative evaluation is strongly hampered<br />
or even impossible.<br />
LOD and LOQ under Selected Conditions<br />
Limit <strong>of</strong> Detection<br />
Area<br />
(mm 2 ) 1 day 3 days 4 days 7 days<br />
3 times SD <strong>of</strong><br />
background<br />
PSL/mm 2<br />
1.3 0.75<br />
10 0.22 0.49 0.34 0.32<br />
42 0.39<br />
66 0.20 0.43 0.32 0.38<br />
Bq/g 42 7<br />
10 and 66 18 15 8 6<br />
Note. The limit <strong>of</strong> detection was def<strong>in</strong>ed as 3 times the standard<br />
deviation <strong>of</strong> the background values and is given as PSL/area or as<br />
Bq/g <strong>of</strong> wet tissue.<br />
Signals are classified as detectable if they can be<br />
differentiated from background noise with a sufficient<br />
degree <strong>of</strong> reliability, i.e., if they are at least 3 standard<br />
deviations above the background level. Then, the limit<br />
<strong>of</strong> detection was def<strong>in</strong>ed as 3 times the standard deviation<br />
<strong>of</strong> the background values. The limit <strong>of</strong> detection<br />
was calculated for each imag<strong>in</strong>g plate, <strong>us<strong>in</strong>g</strong> 10 background<br />
values with an area <strong>in</strong>tegrated <strong>of</strong> 10 or 66 mm 2 .<br />
The results are presented <strong>in</strong> the Table 1. There was an<br />
<strong>in</strong>crease <strong>of</strong> the standard deviation <strong>of</strong> the background<br />
values between 1 and 3 days <strong>of</strong> exposure. Then the<br />
standard deviation <strong>of</strong> the background was relatively<br />
stable between 3 and 7 days <strong>of</strong> exposure. The limit <strong>of</strong><br />
detection was lower when the exposure time <strong>in</strong>creased<br />
(18, 15, 8, and 6 Bq/g after 1, 3, 4, and 7 days <strong>of</strong><br />
exposure, respectively). The limit <strong>of</strong> detection was <strong>in</strong>dependent<br />
<strong>of</strong> area <strong>in</strong>tegrated, when the area was 10,<br />
SENSITIVITY OF RADIOLUMINOGRAPHY<br />
42, or 66 mm 2 , but dependent on area <strong>in</strong>tegrated, when<br />
the area was 1.3 mm 2 .<br />
Limit <strong>of</strong> Quantitation<br />
The limit <strong>of</strong> quantitation was def<strong>in</strong>ed as 10 times the<br />
standard deviation <strong>of</strong> background values or as the radioactivity<br />
concentration for which the coefficient <strong>of</strong><br />
variation was less than 20%.<br />
LOQ def<strong>in</strong>ed as 10 times the standard deviation <strong>of</strong><br />
background values. The limit <strong>of</strong> quantitation was calculated<br />
for each imag<strong>in</strong>g plate, for each exposure <strong>us<strong>in</strong>g</strong><br />
10 background values with an area <strong>in</strong>tegrated <strong>of</strong> 10 or<br />
66 mm 2 . The limit <strong>of</strong> quantitation decreased when the<br />
exposure time <strong>in</strong>creased (60, 50, 26, and 20 Bq/g after<br />
1, 3, 4, and 7 days <strong>of</strong> exposure, respectively). The limit<br />
<strong>of</strong> quantitation was <strong>in</strong>dependent <strong>of</strong> area <strong>in</strong>tegrated,<br />
when the area was 10 or 66 mm 2 (Table 2).<br />
LOQ def<strong>in</strong>ed as the radioactivity concentration for<br />
which the coefficient <strong>of</strong> variation was less than 20%.<br />
The limit <strong>of</strong> quantitation was determ<strong>in</strong>ed with standard<br />
blood calibration curves for each imag<strong>in</strong>g plate,<br />
after several exposures by measurements <strong>of</strong> blood areas<br />
<strong>of</strong> different sizes. Examples <strong>of</strong> mean, standard deviation,<br />
and coefficient <strong>of</strong> variation <strong>of</strong> signals or radioactivity<br />
concentrations <strong>of</strong> different blood standard<br />
sections <strong>of</strong> different region sizes exposed several times<br />
are presented <strong>in</strong> Table 3.<br />
The coefficient <strong>of</strong> variation was less than 20% for all<br />
the blood standards, except for the 17 Bq/g blood standard,<br />
and the limit <strong>of</strong> quantitation was equal to 60 Bq/g<br />
after 4 days <strong>of</strong> exposure <strong>us<strong>in</strong>g</strong> an area <strong>of</strong> <strong>in</strong>tegration <strong>of</strong><br />
42 or 3.5 mm 2 . For an area <strong>of</strong> <strong>in</strong>tegration <strong>of</strong> 1.3 mm 2 ,<br />
the limit <strong>of</strong> quantitation was equal to 265 Bq/g after 4<br />
days <strong>of</strong> exposure. In general the limit <strong>of</strong> quantitation<br />
was higher when the area <strong>of</strong> <strong>in</strong>tegration was smaller.<br />
TABLE 2<br />
Limit <strong>of</strong> Quantitation for Imag<strong>in</strong>g Plates after 1, 3, 4,<br />
and 7 Days <strong>of</strong> Exposure<br />
Unit<br />
Area<br />
(mm 2 ) 1 day 3 days 4 days 7 days<br />
10 times SD <strong>of</strong><br />
background Bq/g 10 and 66 60 50 26 20<br />
Bq/g 10 64 54 28 18<br />
Bq/g 66 56 47 26 22<br />
CV � 20% Bq/g 10 and 66 74 65 33 24<br />
Bq/g 42 or 3.5 60<br />
Bq/g 1.3 264<br />
S25<br />
Note. The limit <strong>of</strong> quantitation is given as Bq/g wet tissue and was<br />
def<strong>in</strong>ed either as 10 times the standard deviation <strong>of</strong> the background<br />
values or as the radioactivity concentration for which the coefficient<br />
<strong>of</strong> variation was less than 20%.
S26 BINDER AND ARCHIMBAUD<br />
TABLE 3<br />
Mean, Standard Deviation (SD), and Coefficient <strong>of</strong> Variation (CV) <strong>of</strong> Measured Signals (PSL/mm 2 )<strong>of</strong><br />
Different Blood Standard Sections <strong>of</strong> Various Region Sizes Exposed Several Times for 4 Days below 8°C<br />
Activity<br />
(Bq/g)<br />
Mean<br />
(PSL/mm 2 )<br />
Region size 42 mm 2<br />
SD<br />
(PSL/mm 2 )<br />
DISCUSSION<br />
CV<br />
(%)<br />
Mean<br />
(PSL/mm 2 )<br />
The limit <strong>of</strong> detection and quantitation were determ<strong>in</strong>ed<br />
with fixed parameters as the section thickness<br />
(30 or 40 �m) and variable parameters (as area <strong>in</strong>tegrated<br />
and exposure time). The limit <strong>of</strong> quantitation<br />
was lower when the exposure time <strong>in</strong>crease from 1 to 7<br />
days and was <strong>in</strong>dependent <strong>of</strong> the area <strong>in</strong>tegrated from<br />
3.5 to 66 mm 2 . Therefore, to have the highest sensitivity<br />
a long exposure time (e.g., 7 days) and an <strong>in</strong>tegrated<br />
area larger than 3.5 mm 2 is recommended.<br />
Whatever method was selected to determ<strong>in</strong>e the<br />
limit <strong>of</strong> quantitation (def<strong>in</strong>ed as 10 times the standard<br />
deviation <strong>of</strong> background values or as the radioactivity<br />
concentration for which the coefficient <strong>of</strong> variation is<br />
less than 20%), the results were similar (60, 50, 26, and<br />
20 Bq/g or 74, 65, 33, and 24 Bq/g after 1, 3, 4, and 7<br />
days <strong>of</strong> exposure, respectively). Nevertheless, to determ<strong>in</strong>e<br />
the limit <strong>of</strong> quantitation <strong>us<strong>in</strong>g</strong> the radioactivity<br />
concentration for which the coefficient <strong>of</strong> variation was<br />
less than 20%, several exposures <strong>of</strong> the same imag<strong>in</strong>g<br />
plates conta<strong>in</strong><strong>in</strong>g the blood standard sections, with a<br />
wide range <strong>of</strong> concentrations, should be performed. A<br />
LOQ, obta<strong>in</strong>ed for one imag<strong>in</strong>g plate after several exposures,<br />
varied with the blood standard sections used.<br />
On the other hand, when <strong>us<strong>in</strong>g</strong> the standard deviation<br />
<strong>of</strong> background values, the LOQ is obta<strong>in</strong>ed for each<br />
imag<strong>in</strong>g plate after each exposure. Therefore, the latter<br />
method to determ<strong>in</strong>e the LOQ can be used as an <strong>in</strong><br />
process control.<br />
Region size 3.5 mm 2<br />
SD<br />
(PSL/mm 2 )<br />
CV<br />
(%)<br />
Mean<br />
(PSL/mm 2 )<br />
CONCLUSION<br />
The sensitivity <strong>of</strong> RLG is <strong>in</strong>fluenced by a large number<br />
<strong>of</strong> factors, some <strong>of</strong> which like exposure time or<br />
temperature can be controlled by standardiz<strong>in</strong>g the<br />
procedure; others like contam<strong>in</strong>ation and flair effect<br />
must be carefully estimated for each <strong>in</strong>dividual measurement.<br />
Under rout<strong>in</strong>e conditions <strong>of</strong> whole-body radiolum<strong>in</strong>ography<br />
reliable quantification can be performed<br />
at least down to 60 Bq/g wet tissue or even<br />
below. Concentrations <strong>of</strong> 6 Bq/g wet tissue can be well<br />
detected.<br />
ACKNOWLEDGMENTS<br />
The authors acknowledge the excellent technical assistance <strong>of</strong> Mr.<br />
Christophe Gros and Ms. Ina Mairh<strong>of</strong>er.<br />
REFERENCES<br />
Region size 1.3 mm 2<br />
SD<br />
(PSL/mm 2 )<br />
17.3 1.4 0.3 22.1 1.5 0.3 22.2 1.7 0.7 39.4<br />
60.1 3.9 0.2 6.0 4.5 0.5 11.5 3.9 0.7 18.4<br />
186.1 11.3 0.4 3.4 11.8 1.6 13.3 12.9 2.8 21.9<br />
264.9 15.2 0.7 4.8 16.0 0.7 4.2 15.5 1.6 10.5<br />
2041.3 116.4 5.9 5.1 125.1 8.0 6.4 124.8 8.9 7.2<br />
6683.7 395.9 10.3 2.6 405.8 9.5 2.3 431.4 55.6 12.9<br />
20246.9 1066 39.7 3.7 1047 37.3 3.6 1109 88.9 8.0<br />
CV<br />
(%)<br />
Hamaoka, T. (1990). Autoradiography <strong>of</strong> new era replac<strong>in</strong>g traditional<br />
X-ray film. Cell Technol. 9, 456–462.<br />
Kle<strong>in</strong>, O., B<strong>in</strong>der, R., and Ste<strong>in</strong>ke, W. (2000). Quantification <strong>of</strong> tissue<br />
self-absorption <strong>of</strong> weak �-radiation <strong>in</strong> lyophilized whole-body sections<br />
<strong>of</strong> rats. Regul. Toxicol. Pharmacol. 31, S27–S31.<br />
Maas, J., B<strong>in</strong>der, R., and Ste<strong>in</strong>ke, W. (2000). Quantitative wholebody<br />
autoradiography: Recommendations for the standardization<br />
<strong>of</strong> the method. Regul. Toxicol. Pharmacol. 31, S15–S21.<br />
Ullberg, S. (1954). Studies on the distribution and fate <strong>of</strong> 35 S-labelled<br />
benzylpenicill<strong>in</strong> <strong>in</strong> the body. Acta Radiol. Suppl. 118, 1–110.