Strategic Approaches to Process Optimization and Scale-up - Almac
Strategic Approaches to Process Optimization and Scale-up - Almac
Strategic Approaches to Process Optimization and Scale-up - Almac

Create successful ePaper yourself
Turn your PDF publications into a flip-book with our unique Google optimized e-Paper software.
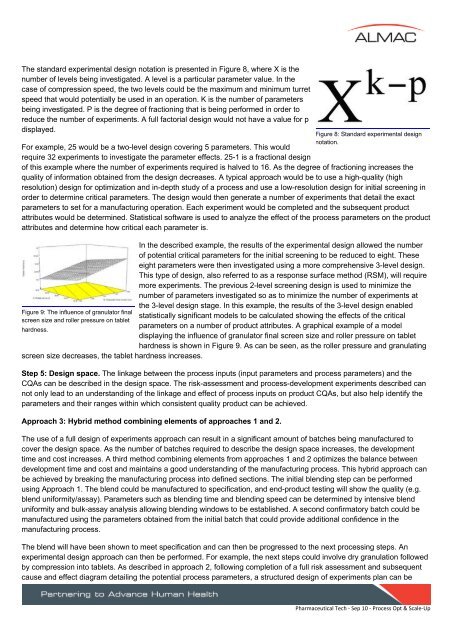
The st<strong>and</strong>ard experimental design notation is presented in Figure 8, where X is thenumber of levels being investigated. A level is a particular parameter value. In thecase of compression speed, the two levels could be the maximum <strong>and</strong> minimum turretspeed that would potentially be used in an operation. K is the number of parametersbeing investigated. P is the degree of fractioning that is being performed in order <strong>to</strong>reduce the number of experiments. A full fac<strong>to</strong>rial design would not have a value for pdisplayed.For example, 25 would be a two-level design covering 5 parameters. This wouldrequire 32 experiments <strong>to</strong> investigate the parameter effects. 25-1 is a fractional designof this example where the number of experiments required is halved <strong>to</strong> 16. As the degree of fractioning increases thequality of information obtained from the design decreases. A typical approach would be <strong>to</strong> use a high-quality (highresolution) design for optimization <strong>and</strong> in-depth study of a process <strong>and</strong> use a low-resolution design for initial screening inorder <strong>to</strong> determine critical parameters. The design would then generate a number of experiments that detail the exactparameters <strong>to</strong> set for a manufacturing operation. Each experiment would be completed <strong>and</strong> the subsequent productattributes would be determined. Statistical software is used <strong>to</strong> analyze the effect of the process parameters on the productattributes <strong>and</strong> determine how critical each parameter is.Figure 9: The influence of granula<strong>to</strong>r finalscreen size <strong>and</strong> roller pressure on tablethardness.screen size decreases, the tablet hardness increases.In the described example, the results of the experimental design allowed the numberof potential critical parameters for the initial screening <strong>to</strong> be reduced <strong>to</strong> eight. Theseeight parameters were then investigated using a more comprehensive 3-level design.This type of design, also referred <strong>to</strong> as a response surface method (RSM), will requiremore experiments. The previous 2-level screening design is used <strong>to</strong> minimize thenumber of parameters investigated so as <strong>to</strong> minimize the number of experiments atthe 3-level design stage. In this example, the results of the 3-level design enabledstatistically significant models <strong>to</strong> be calculated showing the effects of the criticalparameters on a number of product attributes. A graphical example of a modeldisplaying the influence of granula<strong>to</strong>r final screen size <strong>and</strong> roller pressure on tablethardness is shown in Figure 9. As can be seen, as the roller pressure <strong>and</strong> granulatingStep 5: Design space. The linkage between the process inputs (input parameters <strong>and</strong> process parameters) <strong>and</strong> theCQAs can be described in the design space. The risk-assessment <strong>and</strong> process-development experiments described cannot only lead <strong>to</strong> an underst<strong>and</strong>ing of the linkage <strong>and</strong> effect of process inputs on product CQAs, but also help identify theparameters <strong>and</strong> their ranges within which consistent quality product can be achieved.Approach 3: Hybrid method combining elements of approaches 1 <strong>and</strong> 2.Figure 8: St<strong>and</strong>ard experimental designnotation.The use of a full design of experiments approach can result in a significant amount of batches being manufactured <strong>to</strong>cover the design space. As the number of batches required <strong>to</strong> describe the design space increases, the developmenttime <strong>and</strong> cost increases. A third method combining elements from approaches 1 <strong>and</strong> 2 optimizes the balance betweendevelopment time <strong>and</strong> cost <strong>and</strong> maintains a good underst<strong>and</strong>ing of the manufacturing process. This hybrid approach canbe achieved by breaking the manufacturing process in<strong>to</strong> defined sections. The initial blending step can be performedusing Approach 1. The blend could be manufactured <strong>to</strong> specification, <strong>and</strong> end-product testing will show the quality (e.g.blend uniformity/assay). Parameters such as blending time <strong>and</strong> blending speed can be determined by intensive blenduniformity <strong>and</strong> bulk-assay analysis allowing blending windows <strong>to</strong> be established. A second confirma<strong>to</strong>ry batch could bemanufactured using the parameters obtained from the initial batch that could provide additional confidence in themanufacturing process.The blend will have been shown <strong>to</strong> meet specification <strong>and</strong> can then be progressed <strong>to</strong> the next processing steps. Anexperimental design approach can then be performed. For example, the next steps could involve dry granulation followedby compression in<strong>to</strong> tablets. As described in approach 2, following completion of a full risk assessment <strong>and</strong> subsequentcause <strong>and</strong> effect diagram detailing the potential process parameters, a structured design of experiments plan can bePharmaceutical Tech ‐ Sep 10 ‐ <strong>Process</strong> Opt & <strong>Scale</strong>‐Up