Research and Technology 1998 Annual Report - Kennedy Space ...
Research and Technology 1998 Annual Report - Kennedy Space ...
Research and Technology 1998 Annual Report - Kennedy Space ...

Create successful ePaper yourself
Turn your PDF publications into a flip-book with our unique Google optimized e-Paper software.
NASA Technical Memor<strong>and</strong>um 208545<strong>Research</strong> <strong>and</strong> <strong>Technology</strong><strong>1998</strong> <strong>Annual</strong> <strong>Report</strong>John F. <strong>Kennedy</strong> <strong>Space</strong> Center
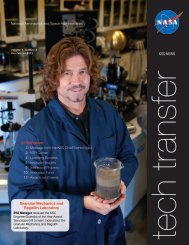
About the CoverThe three technology links to access space are the Launch <strong>and</strong> LaunchVehicle Processing Systems, the Payload <strong>and</strong> Payload Carrier ProcessingSystems, <strong>and</strong> the L<strong>and</strong>ing <strong>and</strong> Recovery Systems. These technology linkssupport KSC’s Strategic Roadmap to the Future. The center illustrationdepicts KSC as the future <strong>Space</strong>port <strong>Technology</strong> Center.Cover art: by Caroline ZafferyDynacs Engineering Co., Inc.Engineering Development Contract
NASA <strong>Research</strong> Technical Memor<strong>and</strong>um <strong>Technology</strong> 208545 <strong>1998</strong><strong>Research</strong> <strong>and</strong> <strong>Technology</strong><strong>1998</strong> <strong>Annual</strong> <strong>Report</strong>John F. <strong>Kennedy</strong> <strong>Space</strong> Centeri
<strong>Research</strong> <strong>and</strong> <strong>Technology</strong> <strong>1998</strong>ForewordAs the NASA Center responsible for preparing<strong>and</strong> launching space missions, theJohn F. <strong>Kennedy</strong> <strong>Space</strong> Center (KSC) isplacing increasing emphasis on its advancedtechnology development program.KSC is transitioning from an operations toa spaceport technology developmentcenter. Our technology developmentencompasses the efforts of the entire KSCteam, consisting of Government <strong>and</strong> contractorpersonnel, working in partnershipwith academic institutions <strong>and</strong> commercialindustry. This edition of the KSC <strong>Research</strong><strong>and</strong> <strong>Technology</strong> <strong>1998</strong> <strong>Annual</strong> <strong>Report</strong> covers the efforts of these contributorsto the KSC advanced technology development program, as well as our technologytransfer activities.Gale Allen, Associate Director of KSC’s <strong>Technology</strong> Programs <strong>and</strong> Commercializationorganization, (407) 867-6226, is responsible for publication of thisreport <strong>and</strong> should be contacted for any desired information regarding theadvanced technology program.Roy D. Bridges, Jr.Directori/ii iii
<strong>Research</strong> <strong>and</strong> <strong>Technology</strong> <strong>1998</strong>CONTENTSLIFE SCIENCES ................................................................................................................................................................................. 1C<strong>and</strong>idate Crop Evaluation for Advanced Life Support <strong>and</strong> Gravitational Biology <strong>and</strong> Ecology................................................... 2Plant Nutrient Delivery Systems .................................................................................................................................................... 4Plant Lighting Systems ....................................................................................................................................................................... 5Microbial Ecology of Bioregenerative Life Support Systems for <strong>Space</strong> Exploration.......................................................................... 6MECHANICAL ENGINEERING ..................................................................................................................................................... 9Insulation Testing Using a Cryostat Apparatus With Sleeve......................................................................................................... 10Development of a Multipurpose Cryostat for Insulation Testing ................................................................................................... 12Cryogenics Test Laboratory ............................................................................................................................................................. 13Verification Test Article Project ...................................................................................................................................................... 14Liquid Nitrogen Feed System <strong>and</strong> Subcooler for the Cryostat ........................................................................................................ 16Liquid Nitrogen Flow Test Area ...................................................................................................................................................... 17Analysis of Nonstationary Signals Using Wavelets for Extracting Resonances ........................................................................... 18ENVIRONMENTAL ENGINEERING .......................................................................................................................................... 21Habitat Management <strong>and</strong> Ecological Risk Assessment Modeling ................................................................................................. 22Threatened <strong>and</strong> Endangered Species Monitoring ........................................................................................................................... 24Pilot-Scale Evaluation of a New <strong>Technology</strong> To Control NOx Emissions From Stationary Combustion Sources ......................... 26Development of an In Situ Technique for Electrokinetic Remediation of Soils Contaminated With Heavy Metals ...................... 28Enhanced In Situ Zero-Valent Metal Permeable Treatment Walls ................................................................................................. 30Installation of a New Scrubber Liquor for the Nitrogen Tetroxide Scrubbers That Produces a Commercial Fertilizer ................. 32Less Toxic Orbiter TPS Rewaterproofing Agent Study .................................................................................................................. 34Supercritical Air-Powered Environmental Control Unit for SCAPE ............................................................................................ 36ADVANCED SOFTWARE ............................................................................................................................................................... 37Mars ISPP Autonomous Controller ................................................................................................................................................ 38JView Internet Display of Shuttle Real-Time Data Using Java ....................................................................................................... 40Automation of OMI S9002 for Orbiter Processing ......................................................................................................................... 42Web-Based Work Tracking Systems ................................................................................................................................................. 44ATMOSPHERIC SCIENCE ............................................................................................................................................................. 47Hurricane Wind Sensor ................................................................................................................................................................... 48Single-Station Accurate Location of Lightning Strikes ................................................................................................................... 50viii
ContentsCONTENTS (cont)MATERIALS SCIENCE ................................................................................................................................................................... 53Study of Electrostatic Charging <strong>and</strong> Discharging of Materials in a Simulated Martian Environment .......................................... 54Investigation of Water Soluble Polyaniline as a Replacement for Chromate Coatings on Aluminum Alloys ................................ 56Qualified Materials Listings for Plastic Films <strong>and</strong> Adhesive Tapes ................................................................................................. 57Determination of Sodium in Colloidal Silica .................................................................................................................................... 58Radiant Heating Facility ................................................................................................................................................................... 60X-33 Rocket System Fuel Tank Electrostatic Coating ..................................................................................................................... 61Analysis of Chloropel by Direct Pyrolysis/FTIR ............................................................................................................................. 62Hydrolytic Degradation of Polyimide Wire Insulation .................................................................................................................... 64Epoxy Bonding Agents .................................................................................................................................................................. 66Cryogenic Insulation Systems for Soft Vacuum .............................................................................................................................. 68Permanent Antistatic SCAPE Suit Coating.................................................................................................................................... 70NONDESTRUCTIVE EVALUATION .......................................................................................................................................... 71Condition Monitoring <strong>and</strong> Fault Identification in Rotating Machinery (CONFIRM) .................................................................... 72Evolved Expendable Launch Vehicle (EELV) Hydrogen Testing ....................................................................................................... 74Thermography for Nondestructive Evaluation <strong>and</strong> Laser Shearography .......................................................................................... 76PROCESS/INDUSTRIAL ENGINEERING .............................................................................................................................. 77Management Support Systems: Goal Performance Evaluation System ....................................................................................... 78Management Support Systems: Organizational Change Models for Strategic Management ..................................................... 80Management Support Systems: Methodology To Harvest Intellectual Property at KSC ............................................................ 82Management Support Systems: KSC Customer Focus Process Development ............................................................................... 84Management Support Systems: Balanced Scorecard Metrics ......................................................................................................... 86Management Support Systems: Program Corporate Memory — a Knowledge Repository for KSC ........................................... 88Human Factors Engineering: Root-Cause Analysis System .......................................................................................................... 90Human Factors Engineering: Applications in the Checkout <strong>and</strong> Launch Control System ............................................................ 92Human Factors Engineering: Human Error <strong>Research</strong> in Shuttle Processing <strong>and</strong> Aircraft Maintenance Operations .................. 94Work Methods <strong>and</strong> Measurement: Expert System To Generate Job St<strong>and</strong>ards .............................................................................. 96Work Methods <strong>and</strong> Measurement: Electronic Portable Information Collection .............................................................................. 98Work Methods <strong>and</strong> Measurement: Work Instruction Task Team ................................................................................................. 100Work Methods <strong>and</strong> Measurement: Industrial Engineering Decision Support Tool ..................................................................... 102General: Center for Applied <strong>Research</strong> in Industrial <strong>and</strong> Systems Engineering ........................................................................... 104General: Key Characteristics in Manufacturing <strong>and</strong> Maintenance.............................................................................................. 106iv vi
<strong>Research</strong> <strong>and</strong> <strong>Technology</strong> <strong>1998</strong>CONTENTS (cont)General: Searchable Answer Generating Environment — A Knowledge Management System ToSeek Experts in the Florida State University System .................................................................................................... 108Process Analysis <strong>and</strong> Modeling: Statistical Process Control Techniques for Variable Shuttle System Performance Data .......... 110Process Analysis <strong>and</strong> Modeling: Intelligent Assistant for Optimization Modeling .................................................................... 112Process Analysis <strong>and</strong> Modeling: Vision <strong>Space</strong>port Model Development ..................................................................................... 114Process Analysis <strong>and</strong> Modeling: Intelligent Synthesis Environment .......................................................................................... 116Process Analysis <strong>and</strong> Modeling: Virtual Shuttle Processing Model ............................................................................................ 118AUTOMATION AND ROBOTICS .............................................................................................................................................. 119Advanced Life Support Automated Remote Manipulator (ALSARM) ......................................................................................... 120Advanced Payload Transfer Measurement System (APTMS) ...................................................................................................... 122Automated Umbilical Mating <strong>Technology</strong> ..................................................................................................................................... 124Payload Ground H<strong>and</strong>ling Mechanism (PGHM) Automation ..................................................................................................... 126Cable <strong>and</strong> Line Inspection Mechanism (CLIM) ............................................................................................................................. 128OmniBot Mobile Base .................................................................................................................................................................... 130Electro-Mechanical Actuator ......................................................................................................................................................... 131Solid Rocket Motor (SRM) Stacking Enhancement Tool (SSET) .................................................................................................. 132ELECTRONICS AND INSTRUMENTATION ....................................................................................................................... 135<strong>Space</strong> Shuttle Integrated Vehicle Health Management (IVHM) Flight Experiment ..................................................................... 136Orbiter Jack <strong>and</strong> Leveling Operations ............................................................................................................................................. 138Leak Detection <strong>and</strong> Visualization Using Laser Shearography ........................................................................................................ 140Support of the Linear Aerospike SR-71 Experiment (LASRE) ........................................................................................................ 142Ferroelectric Camera for Infrared Fire Imaging ............................................................................................................................... 1446U VME Universal Signal Conditioning Amplifier (USCA) Interface Module ........................................................................... 146Medical Aeronautical Communications System ............................................................................................................................. 147Portable Magnetic Field Sensor for Measuring Lightning Effects ................................................................................................. 148Inline Gas Analyzer for Cryogenic Hydrogen ................................................................................................................................ 150<strong>Space</strong> Shuttle Orbiter to External Tank Mating Tool ..................................................................................................................... 152Main Three Contamination Monitoring Cart ................................................................................................................................ 154Thermographic Inspection of Subsurface Voids in Composite Structures ...................................................................................... 156Automatic Calibration Station for the Universal Signal Conditioning Amplifier (USCA) .......................................................... 158v/vi vii
<strong>Research</strong> <strong>and</strong> <strong>Technology</strong> <strong>1998</strong><strong>Technology</strong> Programs<strong>and</strong> CommercializationIntroductionJohn F. <strong>Kennedy</strong> <strong>Space</strong> Center (KSC) maintains avigorous applied development program in support ofits designation as the NASA Center of Excellence forLaunch <strong>and</strong> Payload Processing. In accordance withthis mission, KSC is establishing its <strong>Space</strong>port <strong>Technology</strong>Center (STC) that supports the development <strong>and</strong>utilization of technologies required to access space.The STC is composed of three pillars, Launch <strong>and</strong>Launch Vehicle Processing Systems, Payload <strong>and</strong>Payload Carrier Processing Systems, <strong>and</strong> L<strong>and</strong>ing <strong>and</strong>Recovery Systems. The STC forms the foundation forKSC’s growth into its future role as a developmentcenter for support of the Nation’s increasingly commercialspace initiatives. Having focused historicallyon applied development programs supporting industrial-leveloperations <strong>and</strong> processes, KSC technology<strong>and</strong> expertise are uniquely suited to support the developmentof commercial products <strong>and</strong> services. Bothrapid-turnaround problemsolving <strong>and</strong> design techniques<strong>and</strong> long-term investment in critical operationstechnology form the core of KSC’s research <strong>and</strong> developmentprograms.KSC aggressively seeks industry participation inits research initiatives <strong>and</strong> proactively seeks to transferits innovative expertise <strong>and</strong> technology to commercialspace initiatives <strong>and</strong> the nonaerospace commercialsector. Programs <strong>and</strong> commercialization opportunitiesavailable to American industry <strong>and</strong> other institutionalorganizations are described in the <strong>Technology</strong> Programs<strong>and</strong> Commercialization Office Internet Web siteat http://technology.nasa.gov.vii/viii ix
<strong>Research</strong> <strong>and</strong> <strong>Technology</strong> <strong>1998</strong>LifeSciencesThe Life Sciences research <strong>and</strong>technology program at the JohnF. <strong>Kennedy</strong> <strong>Space</strong> Center (KSC)primarily supports the development ofadvanced technologies for applicationin life support for long-term humanhabitation in space. The near-termfocus of the Advanced Life Support(ALS) project is biomass productionimprovement, resource recovery development,<strong>and</strong> system engineering.Plant Gravitational Biology is investigatinglighting <strong>and</strong> nutrient-deliveryhardware systems, the effects of environmentalconditions (i.e., carbondioxide <strong>and</strong> temperature) on plantsgrowing in flight-type chambers, <strong>and</strong>microgravity effects on plant growth<strong>and</strong> development. These efforts aredirected toward evaluating <strong>and</strong> integratingcomponents of bioregenerativelife support systems <strong>and</strong> investigatingthe effects of a space environment onphotosynthesis <strong>and</strong> carbon metabolismin higher plants.1
Life SciencesC<strong>and</strong>idate Crop Evaluation forAdvanced Life Support <strong>and</strong>Gravitational Biology <strong>and</strong> EcologyRice cv. Ai Nan Tsio (grown in the BPC to determine the effectof atmospheric contaminants on productivity <strong>and</strong> suitabilityfor advanced life support applications)The primary objective of this task is to defineenvironmental conditions <strong>and</strong> horticulturalmethodologies to optimize edible biomass productionin c<strong>and</strong>idate crop species. This task includescoordination of NASA-supported tasks at the NewJersey NASA Specialized Center of <strong>Research</strong> <strong>and</strong>Training (NJNSCORT) for tomato <strong>and</strong> salad crops,at the Tuskegee Institute for peanut <strong>and</strong> sweetpotato, at Utah State University for wheat <strong>and</strong>soybean, <strong>and</strong> at NASA <strong>Research</strong> Announcement(NRA) grant recipients for other c<strong>and</strong>idate crops.This task involves the screening of different cultivars<strong>and</strong> the compilation of all crop growth data forinclusion in a crop h<strong>and</strong>book. This effort will use ast<strong>and</strong>ardized testing procedure for all c<strong>and</strong>idatecrop species that were selected from the CropSelection Meeting held at KSC in May 1997. Thistask will develop crop management strategies forreuse of nutrient solutions with a special emphasison biologically active organic materials that mayaccumulate in the nutrient solution.The development of a bioregenerative lifesupport system requires that the horticulturalmethodologies <strong>and</strong> the range of suitable environmentalconditions for various c<strong>and</strong>idate crops bewell understood. This is an integrated activityrequiring coordination with several research organizations<strong>and</strong> ongoing Advanced Life Support (ALS)tasks in order to maximize the benefit to the ALSprogram.The c<strong>and</strong>idate crop research <strong>and</strong> technologydevelopment conducted at KSC during <strong>1998</strong> included:2
<strong>Research</strong> <strong>and</strong> <strong>Technology</strong> <strong>1998</strong>• Rice: A large-scale test of rice,cultivar Ai Nan Tsio, obtainedfrom Utah State University,was evaluated in the BiomassProduction Chamber (BPC)under filtered <strong>and</strong> unfilteredatmospheres (see the figure).• Dry Bean: Tests to determinethe suitability of a dry bean(Etna) <strong>and</strong> snap bean (Hystyle)for hydroponic productionunder elevated carbon dioxideconditions were initiated incollaboration with CornellUniversity.• Radish: Tests to determine theeffect of narrow-b<strong>and</strong> spectralradiation delivered throughlight-emitting diodes (LED’s)were initiated in collaborationwith the ALS lighting task.• Chard: Tests were conductedin collaboration with thenutrient delivery task to comparethe results of the nutrientfilm technique to solid substrates,including variouszeolite formulations.• Table Beet: Tests were conductedin collaboration withthe National <strong>Research</strong> Council(NRC) on the ability of tablebeet to accumulate sodium(Na) in the leaf tissue.• Spinach: Tests to determine theeffect of narrow-b<strong>and</strong> spectralradiation delivered throughLED’s were initiated in collaborationwith the ALS lightingtask.• Sweetpotato: A comparison ofthe nutrient managementsystem developed at KSC wascompared with that ofTuskegee Institute.• White Potato: Tests wereconducted in collaborationwith the ALS lighting task todetermine the maximumamount of light that can beperceived by potatoes duringthe dark cycle without inhibitingtuber formation.• Wheat: Tests were conductedin collaboration with theresource recovery-water recoverytask to determine the effectof gray water additions to thenutrient solution on growth<strong>and</strong> development of wheat.• Lettuce: Tests were conductedin collaboration with theresource recovery-water recoverytask, to determine the effectof gray water additions to thenutrient solution on growth<strong>and</strong> development of lettuce.Key accomplishments:• 1997: ALS program CropSelection Meeting hosted byKSC in May. C<strong>and</strong>idate croptesting in the BPC test bed ofthe Breadboard Project wascompleted in December.• <strong>1998</strong>: Nine peer-reviewedarticles were either publishedor accepted for publication.Key milestones:• 1999: First edition of theh<strong>and</strong>book for ALS c<strong>and</strong>idatecrops.• 2000: 100-percent improvementin productivity of soybean<strong>and</strong> peanut.Contact: Dr. J.C. Sager (John.Sager-1@ksc.nasa.gov), JJ-G, (407) 853-5142Participating Organizations: DynamacCorporation (Dr. G.W. Stutte), UtahState University (Dr. B. Baugbee),Cornell University (D. DeVillers), NRC(Dr. G. Subbarao), <strong>and</strong> TuskegeeUniversity3
Life SciencesPlant Nutrient Delivery SystemsDuring long-term space missions, a reliablenutrient delivery system (NDS) is required tocultivate plants that yield a satisfactory quantity ofedible biomass. Many plant nutrient deliverysystems used on Earth will not function effectivelyin space. An effective plant nutrient deliverysystem for spaceflight must provide adequateamounts <strong>and</strong> uniform distribution of water, nutrient,<strong>and</strong> oxygen in the root zone, while at the sametime, prevent release of free nutrient solution to theatmosphere. The ultimate goal is to design a nutrientdelivery system that is capable of sustainingplants for long periods under spaceflight conditionsyet requires minimal system maintenance <strong>and</strong>limited dem<strong>and</strong>s on crew time. For extended plantcultivation in space, root-zone media will requiremore than just an initial loading of water <strong>and</strong>nutrients due to losses from plant evapotranspiration<strong>and</strong> nutrient uptake. Recent plant testing forspaceflight has begun to explore active nutrientdelivery concepts in which water <strong>and</strong> nutrients arereplenished on a continuous basis for long-termplant growth. At KSC, a series of ground-basedtests are being conducted on various recirculatingnutrient delivery systems that are proposed forextended space expeditions. The merits of eachnutrient delivery system are largely based upon theperformance of different shoot <strong>and</strong> root-zone cropsin terms of edible biomass yield from completegrowth cycles. To date for several crop species,these nutrient delivery systems were characterizedwith respect to plant water use, ion uptake, <strong>and</strong>nutrient solution pH changes over time.Key accomplishments:• Developed <strong>and</strong> tested recirculating nutrientdelivery systems that accommodate a range ofshoot <strong>and</strong> root-zone crops.• Explored nutrient buffered concepts to simplifysystem management, particularly for spaceflight.• Developed a protocol for continuous salad cropproduction for the Lunar-Mars Life Support TestProject Phase III at Johnson <strong>Space</strong> Center <strong>and</strong>conducted comparative studies with salad cropswith zeoponic media, porous tubes, <strong>and</strong> nutrientthin-film hydroponic nutrient delivery systems.Contacts: Dr. W.M. Knott (William.Knott-1@ksc.nasa.gov),Dr. J.C. Sager, <strong>and</strong> Dr. R.M. Wheeler; JJ-G; (407) 853-5142Participating Organization: Dynamac Corporation(Dr. G.D. Goins)ASTROCULTURE (Subirrigated Porous Tube System) RootTray With Lettuce Plants at 8, 15, <strong>and</strong> 22 Days After Seeding inARABASKETS Filled With Zeoponic Growing Media4
<strong>Research</strong> <strong>and</strong> <strong>Technology</strong> <strong>1998</strong>Plant Lighting SystemsAmajor challenge to growingplants in space will be controlling<strong>and</strong> supplying sufficientquantity <strong>and</strong> quality of light. Theprimary objective of this task is tosignificantly improve the efficiencyof converting electricalenergy into edible plant biomass.<strong>Technology</strong> development effortsare focusing on obtaining lightsources to increase electricalconversion efficiency of lightingsystems <strong>and</strong> methods of collecting,transporting, <strong>and</strong> distributionof photosynthetically activeradiation (PAR) to the cropcanopy. Current research includesinvestigations of lightsources <strong>and</strong> methods that deliverPAR to crop plants that willproduce food for the space inhabitants.Two new sources thatshow great promise in deliveringPAR to the plant canopy includemicrowave lamps <strong>and</strong> lightemittingdiodes (LED’s). Microwavelamps are a new technologythat use microwave energy toenergize an electrode-less sulfurfilledelement. It has a spectralMature USU-SuperDwarf Wheat Plants Growing Under an Array of600-Nanometer Red Aluminum-Gallium-Arsenide (GaAlAs) LED’soutput similar to other high-intensity discharge sources but uses 20 to30 percent less energy for comparable output. LED’s are a promisingelectric light source for space-based plant growth chambers <strong>and</strong>bioregenerative advanced life support because of their small mass <strong>and</strong>volume, solid state construction, safety, <strong>and</strong> longevity.Key accomplishments:• Completed LED experiments with different food crops to investigatecarbon exchange <strong>and</strong> stomatal conductance differences betweenlight treatments <strong>and</strong> species.• Determined low-level irradiance requirements during the darkperiod for photoperiodic-induced tuberization of potato.• Evaluated solid-state magnetron microwave lamp systems.Contacts: Dr. W.M. Knott (William.Knott-1@ksc.nasa.gov), Dr. J.C. Sager, <strong>and</strong> Dr.R.M. Wheeler; JJ-G; (407) 853-5142Participating Organization: Dynamac Corporation (Dr. G.D. Goins, N.C. Yorio,<strong>and</strong> G. Koerner)5
Life SciencesMicrobial Ecology of BioregenerativeLife Support Systems for <strong>Space</strong> ExplorationThe stability of microbial communitieswithin closed bioregenerativesystems is an importantcomponent of overall systemstability due to the risk of humanor plant disease <strong>and</strong> the reliance onmicrobially based reactors for wasteprocessing. Effective managementof microbial communities requiresan improved underst<strong>and</strong>ing of thecomplex interactions among microorganismswithin Advanced LifeSupport (ALS) systems that, in turn,depend on advancements in rapid<strong>and</strong> reliable monitoring techniques.The purposes of this work are todevelop monitoring tools that allowfor a better underst<strong>and</strong>ing of themicrobial risks associated withbioregenerative life support systems<strong>and</strong> to evaluate the suitability ofthese tools for use in Moon or Marsbases. Experiments with prototypeALS subsystems under developmentat KSC (e.g., plant productionsystems <strong>and</strong> bioreactors) will assessthe ability of different techniques toidentify changes in the overallstability of microbial communities<strong>and</strong> detect the presence of specifichuman or plant pathogens beforethe health of the system is adverselyaffected. These efforts will helpidentify the best approaches formanaging microbial risks within thesystems in addition to evaluatingspecific sensor technology.The primary effort this yearinvolved the development ofadvanced analytical software for arapid, simple monitoring methodbased on functional profiling ofmicrobial communities. Thisapproach, which was developed bythe Dynamac staff, detects respirationof 95 separate carbon sourcesusing a redox sensitive dye. Initialtesting indicated that the community-levelphysiological profiles(CLPP’s) can detect small changesin microbial communities associatedwith prototype ALS systems. Thenew software enables automatedanalysis of the kinetic profile of dyereduction for each of the 95 separatecarbon sources based on nonlinearregression. The parameters of thenonlinear curve (lag, maximumrate, asymptote, <strong>and</strong> integral) can beautomatically exported into thestatistical software for subsequentmultivariate analysis.Another major effort this yearinvolved assessment of the effects ofbacterial diversity (the number <strong>and</strong>relative abundance of bacterialtypes) in prototype ALS systems onthe survival of introduced opportunistichuman pathogens. Ecologicaltheory suggests that greater diversitymay decrease the likelihood ofpotentially deleterious organisms,such as opportunistic humanpathogens, from growing in microbialhabitats within ALS systems. Incollaboration with scientists fromthe University of South Florida, theUniversity of Virginia, <strong>and</strong> MichiganState University, the relativesurvival of opportunistic humanpathogens in systems with differentlevels of diversity was evaluated.Such studies will be important indefining effective approaches forinoculating bioregenerative lifesupport systems.A third focal area involved thedevelopment of molecular tools forassessing microbial communities inbioregenerative ALS. Severalprofiling techniques based on thedetection of genetic variation withinbacterial communities were used tocharacterize ALS systems, includingTerminal Restriction FragmentLength Polymorphisms (T-RFLP’s),R<strong>and</strong>omly Amplified PolymorphicDNA (RAPD), <strong>and</strong> AmplifiedFragment Length Polymorphism(AFLP). All of these methodsinvolve amplification of genes usingthe polymerase chain reaction(PCR). T-RFLP analyses wereperformed at Rutgers Universitywhile the other approaches wereperformed at KSC in collaborationwith the University of Virginia.Key accomplishments (<strong>1998</strong>):• Submitted a new technologyreport for the CLPP technique.• Developed the CLPP analysissoftware.• Completed the report comparingthe effectiveness of the differentanalytical approaches on classifyingmicrobial communities fromplant production systems <strong>and</strong>bioreactors.• Completed studies evaluating theeffect of community diversity onthe survival of human pathogensin plant production systems <strong>and</strong>bioreactors.• Completed the analysis <strong>and</strong>preliminary report on T-RFLPanalysis of samples from ALSbiomass production systems.• Established molecular microbialecology facilities at KSC <strong>and</strong>completed the preliminaryanalysis of ALS samples usingRAPD <strong>and</strong> AFLP.Key milestones (1999):• Complete the testing of the CLPPsoftware, including the publicationof the results <strong>and</strong> the distributionof the product to interestedresearch organizations.• Exp<strong>and</strong> the molecular microbialecology infrastructure at KSC,including the purchase of a DNAsequencer.6
<strong>Research</strong> <strong>and</strong> <strong>Technology</strong> <strong>1998</strong>• Develop <strong>and</strong> test miniaturized biosensors basedon bioluminescent bioreporter integrated circuit(BBIC) technology in collaboration with theUniversity of Tennessee.• Complete the initial assessment of the effects ofdiversity on the microbial risks associated withthe growth of opportunistic human pathogens.Contact: Dr. J.C. Sager (John.Sager-1@ksc.nasa.gov), JJ-G, (407)853-5142Participating Organizations: Rutgers University (Dr. L. Kerkhof),University of Virginia (Dr. A. Mills), University of Tennessee(Dr. G. Saylor), University of South Florida, Michigan StateUniversity, <strong>and</strong> Dynamac Corporation (Dr. J. Garl<strong>and</strong>)1.8A1.61.41.210.8µ mNonlinearRegression(x 95)0.60.40.2λ00 20 40 60 80 100 120Monitoring/ControlRapidMetabolicProfilingMicrobial Systems(Bioreactors, Plants)Microbial Monitoring for the ALS7/87
<strong>Research</strong> <strong>and</strong> <strong>Technology</strong> <strong>1998</strong>MechanicalEngineeringThe Mechanical Engineering programat the John F. <strong>Kennedy</strong> <strong>Space</strong> Center(KSC) supports the development oftechnology with analysis, design, <strong>and</strong>operation of launch <strong>and</strong> ground supportequipment for space flight vehicles.<strong>Technology</strong> is advanced by a broadvariety of analysis including structuraldeflection, dynamic response, stress,dynamic data requirements, reduction,<strong>and</strong> processing. Also included are single<strong>and</strong> multiphase flow, cryogenic fluidflow <strong>and</strong> storage, thermal insulationdevelopment, <strong>and</strong> fracture mechanics.Launch-induced environments are predicted<strong>and</strong> evaluated with test spectra,modal testing, portable dynamic dataacquisition, <strong>and</strong> analysis. MechanicalEngineering also covers system <strong>and</strong>mechanism troubleshooting, componenttesting, <strong>and</strong> development of tools, devices,<strong>and</strong> systems for fabricating systems<strong>and</strong> obtaining required cleanliness.9
Mechanical EngineeringInsulation Testing Using a Cryostat Apparatus With SleeveThe method <strong>and</strong> equipment oftesting continuously rolledinsulation materials was developedat the KSC Cryogenics TestLaboratory in <strong>1998</strong>. The testing ofblanket <strong>and</strong> molded products isfacilitated by the technology.Materials are installed around acylindrical copper sleeve using awrapping machine. Large sizeinsulation test articles that are6.69 inches inside diameter by 36inches long by up to 2 inches inthickness can be fabricated <strong>and</strong>tested. The sleeve is slid onto thevertical cold mass of the cryostat.The gap between the cold mass<strong>and</strong> the sleeve measures 0.035inch. The cryostat apparatus (seefigure 1) is a liquid nitrogenboiloff calorimeter system thatTemperature (kelvin)350300250200150100500Cold Mass Sleeve Layer 2(0.106”)Layer 4(0.212”)LayersLayer 8(0.424”)Layer 18(0.953”)Figure 2. Layer Temperature Profiles for Different Vacuum Levels(Cryostat 1, Test Series C114)CVP=0.13CVP=10CVP=100CVP=1000CVP=10000Shroudenables direct measurement of the apparent thermalconductivity (k-value) of the insulation system at anyvacuum level between 5x10 -5 <strong>and</strong> 760 torr.Figure 1. Cryostat Apparatus — Liquid NitrogenBoiloff Colorimeter SystemSensors are placed between layers of the insulation toprovide complete temperature-thickness profiles. Thetemperatures of the cold mass [maintained at 77.8 kelvin(K)], the sleeve [cold boundary temperature (CBT)], theinsulation outer surface [warm boundary temperature(WBT)], <strong>and</strong> the vacuum chamber (maintained at 315 K bythe thermal shroud) are measured. Layer temperatureprofiles as a function of the vacuum level, as shown infigure 2, indicate the three ranges (radiation, gas conduction,<strong>and</strong> convection) of dominant heat transfer modes.Heat leak through to the ends of the cryostat is reduced toa negligible amount by the use of liquid nitrogen filledchambers on the top <strong>and</strong> bottom. The cryostat apparatusis supplied with liquid nitrogen subcooled to approximately77.8 K. The upper guard chamber is kept at aslightly higher pressure (0.150 ±0.050 pound per squareinch differential) than the test chamber to preclude thecondensation of any boiloff gas as it is exiting through thecenter of the guard. During the boiloff replenish phase,10
<strong>Research</strong> <strong>and</strong> <strong>Technology</strong> <strong>1998</strong>the guard chambers must be maintained at 0.6 ±0.1 pound per squareinch gage for minimum heat leak. Steady-state boiloff conditions areachieved in 6 to 12 hours after an initial chilldown <strong>and</strong> thermal stabilizationperiod of at least 24 hours. Typical plots of flow rate <strong>and</strong>k-value are shown in figure 3. (Note that the end of the first plateau isthe point at which the replenish of the guard chambers is terminated.)The vacuum pumping system consists of a combination ofturbopumps <strong>and</strong> mechanical pumps plus a finely metered gaseousnitrogen supply for controlling the pumping speed. All measurementsare recorded on a National Instrument Field Point data acquisitionsystem using LabView software.Flow (st<strong>and</strong>rd cubic centimeters per minute)800700600500400300200100Flowk04 5 6 7 8 9 10 11 12Time (hours)Figure 3. Liquid Nitrogen Boiloff Test Perfomance[Cryostat 1, Test Series C114, Run 10 (0.1 micron)]Thermal Conductivity - k (milliwatt per meter-kelvin)For this cryostat apparatus,the measurable heat gainis from 0.2 to 20 watts (whichcorresponds to a boiloff flowrate of 50 to 5,000 st<strong>and</strong>ardcubic centimeters perminute). The surface area fora typical 1-inch-thick insulationtest article is 969 squareinches. The steady-statemeasurement of the insulationperformance is madewhen all temperatures <strong>and</strong>the boiloff flow are stable.The k-value of the insulationis directly computed from theboiloff rate, the cold massgeometry, <strong>and</strong> the deltatemperature (WBT-CBT).Contact: J.E. Fesmire (James.Fesmire-1@ksc.nasa.gov), MM-J2,(407) 867-7969Participating Organization:Dynacs Engineering Co., Inc.(S. Augustynowicz)11
Mechanical EngineeringDevelopment of a Multipurpose Cryostatfor Insulation TestingAmultipurpose cryostatapparatus (Cryostat-2) wasdesigned <strong>and</strong> fabricated at theKSC Cryogenics Test Laboratory.The apparatus can be used fortesting insulation materials orcryogenic couplings <strong>and</strong> seals.Using custom h<strong>and</strong>ling fixtures,the inner assembly is easily <strong>and</strong>quickly removable for installationon an 18-inch-wide insulationwrappingmachine. Alternatively,the lower thermal guard can beremoved for the testing of flatplateconfigurations. The stainless-steelinner vessel is a cylinder5.2 inches in diameter by 10.5inches in length. The overalldimensions of the vacuum chamberare 12 inches in diameter <strong>and</strong>26 inches in length. The figureshows the inner assembly on itswork st<strong>and</strong> adjacent to thevacuum chamber assembly.Thermal guarding of each end isprovided by a 5-inch-diameter by5-inch-long stack of aerogelcomposite disks with silveredfilm layers between each disk. Asingle 1/2-inch diameter by 19-inch-long fluid feed-throughconstructed from thin-wallbellows <strong>and</strong> a VCR couplingallow for liquid nitrogen filling,venting, <strong>and</strong> boiloff. The entireinner assembly is suspended bythree Kevlar threads that areattached to the flange of thevacuum chamber. The designmaximum heat leak for thesystem is 0.025 watt at a highvacuum level to 0.050 watt at asoft vacuum level. The surfacearea for a typical 1-inch-thickinsulation test article is 969square inches. The measurableheat gain is estimated to be from0.100 to 40 watts (which correspondsto a boiloff flow rate of 25to 9,666 st<strong>and</strong>ard cubic centimetersper minute). The operatingtemperature range is 77 to 373kelvin while the operating pressurerange is 1x10 -6 torr to 1,000torr. Cryostat-2 is currently beingused for testing continuouslyrolled insulation materials.Contact: J.E. Fesmire (James.Fesmire-1@ksc.nasa.gov), MM-J2, (407) 867-7969Participating Organization: Dynacs EngineeringCo., Inc. (S. Augustynowicz)12
<strong>Research</strong> <strong>and</strong> <strong>Technology</strong> <strong>1998</strong>Cryogenics TestLaboratoryThe KSC Cryogenics TestLaboratory is located at theNASA Development TestingLaboratory (Building M7-581). Avariety of industry, aerospace,<strong>and</strong> research activities in the areaof cryogenics <strong>and</strong> propellantsystems is supported. Theseactivities include design, fabrication,testing, analysis, field testing,<strong>and</strong> engineering evaluation.The laboratory facilities include aliquid nitrogen flow test area, avalve test cell, a high-vacuumworkstation, <strong>and</strong> a liquid nitrogenboiloff calorimeter (Cryostat-1). Cryogenic insulation systemdevelopment is the main line ofwork at this time. The areas ofexpertise include:• Cryogenic insulation systems• Cryogenic valves <strong>and</strong> devices• Connectors, seals, <strong>and</strong> sealmaterials• High vacuum <strong>and</strong> leakage• Design concepts <strong>and</strong> prototypefabrication• Flow testing <strong>and</strong> analysisPlans for 1999 include:• Activation of a multipurposecryostat apparatus (Cryostat-2)• Conversion to National InstrumentsFieldPoint data acquisitionsystems• Addition of instrumentation<strong>and</strong> controls to the flow testarea• Enhancement of valve test cellThe renovation of a 5,000-square-foot facility to house test,checkout, <strong>and</strong> research activitiesis also being planned for completionin late 1999.Contact: J.E. Fesmire (James.Fesmire-1@ksc.nasa.gov), MM-J2, (407) 867-7969Participating Organization: DynacsEngineering Co., Inc. (S. Augustynowicz)13
Mechanical EngineeringVerification TestArticle ProjectDuring a Shuttle launch,ground support equipment<strong>and</strong> structures in the proximity ofthe launch pad are subjected tointense vibration due to acousticpressure generated by rocketexhausts. Continuous monitoringof launch-critical loads (acoustics)<strong>and</strong> simultaneous structuralresponse (vibration <strong>and</strong> strain) isvital for design of new <strong>and</strong>proactive maintenance of existingstructures. By the end of 1996,the collection of acoustic, vibration,<strong>and</strong> strain data from sevenlaunches from Launch Pad 39Awas completed on a cantileverbeam, called the Verification TestArticle (VETA). Analyzed datafrom these launches was crucialfor validating a r<strong>and</strong>om vibrationresponse model based on thedeterministic approach developedat KSC. A detailed reportoutlining the validation methodologywas released in 1997.VETA measurements provedextremely valuable in characterizingtwo separate zones of acousticloading on the ground supportequipment. Tests showed theliftoff peak acoustics (betweenT+2 to T+7 seconds) are oftenovershadowed by a significantsecondary peak (between T+10<strong>and</strong> T+17 seconds). This secondpeak, the “plume impingement”peak, is directly attributable tothe Shuttle roll maneuver. Theliftoff peak is composed primarilyof high-frequency componentsabove 50 hertz. The secondaryplume impingement effect contributessignificantly to thestructural resonances because ofits low-frequency composition.Limited launches <strong>and</strong> failedsensors restricted analysis effortsto evaluate effects of launchtrajectory, multimodal contribution,<strong>and</strong> effects of higher modeson the overall response <strong>and</strong>prediction confidence intervals.Key accomplishments:• <strong>1998</strong>: Several lectures onrocket noise <strong>and</strong> vibration werepresented at the Universities ofPerth <strong>and</strong> Adelaide in Australia.The acoustibox conceptwas tested on several launches<strong>and</strong> results were positive. Torecord launch-induced acoustics,a totally self-containedacoustibox (operates on batteries)was installed on the launchpad <strong>and</strong> has (1) the capabilityto “wake up” prior to launch<strong>and</strong> to store the recorded data<strong>and</strong> (2) postlaunch retrievalsoftware.Key milestone:• 1999: Efforts will be aimedtoward developing a totallyindigenous unit for use by KSCoperations, in line with NASApolicy of “better, faster,cheaper.”Contact: R.E. Caimi (Raoul.Caimi-1@ksc.nasa.gov), MM-J2, (407) 867-3748Participating Organizations: DynacsEngineering Co., Inc. (R.N. Margasahayam),United <strong>Space</strong> Alliance(F. Walker), <strong>and</strong> Information Dynamics,Inc. (O. Varosi <strong>and</strong> L. Albright)14
<strong>Research</strong> <strong>and</strong> <strong>Technology</strong> <strong>1998</strong>Self-Contained Acoustibox on the Launch Pad15
Mechanical EngineeringLiquid Nitrogen Feed System <strong>and</strong> Subcooler for the CryostatAspecial liquid nitrogen feedsystem for the insulation testcryostat (Cryostat-1) was designed<strong>and</strong> constructed at theKSC Cryogenics Test Laboratory.The cryostat requires a stablesupply of liquid nitrogen near thenormal boiling point (77.36 kelvinat atmospheric pressure) for runtimes of up to 12 hours. The feedsystem consists of an adjustablepressure phase separator (APPS)unit, a 1/2-inch vacuum-jacketedpipeline with cryo-vent devices,<strong>and</strong> a subcooler unit. The APPSunit maintains a supply of liquidnitrogen saturated at 19 ±1 poundper square inch gage <strong>and</strong> allowsinsulation testing to be performedindependent of other tests usingthe main supply dewar. Thesubcooler unit provides 11 ±0.5pound per square inch gageliquid nitrogen conditioned atapproximately 77.8 kelvin to thecryostat inlet manifold. Theliquid reservoir of the subcoolerconsists of a stainless-steel vessel10.75 inches in diameter by 24inches tall that is enclosed by anouter shell. The annular space isfilled with excess liquid from theinner vessel <strong>and</strong> vented to theatmosphere. The levels in theliquid reservoir <strong>and</strong> outer shellare maintained by an adjustmentof a control valve from the mainsupply line. Tube fittings on thetop allow for simple installationor removal. The exposed fittingsare quenched in the liquid nitrogenoverflow from the outer shellto eliminate a heat leak. Anoverall view of the subcooler unitis shown in the figure.Contact: J.E. Fesmire (James.Fesmire-1@ksc.nasa.gov), MM-J2, (407) 867-796916
<strong>Research</strong> <strong>and</strong> <strong>Technology</strong> <strong>1998</strong>Liquid Nitrogen FlowTest AreaThe liquid nitrogen flow testarea was activated at the KSCCryogenics Test Laboratory. Thearea includes a 6,000-gallondewar that supplies liquid to lowflow<strong>and</strong> high-flow test sections.The low-flow section, fed by anadjustable pressure phase separator<strong>and</strong> a 1/2-inch vacuumjacketedpipeline, can provide 0to 100 pounds per square inchgage at up to15 gallons perminute. An inline density meterbuilt by Dynacs Engineering Co.,Inc., is included to monitor flowconditions <strong>and</strong> transients duringa test. The high-flow sectionincludes run piping with 3-inch<strong>and</strong> 6-inch diameter test sectionsthat are adaptable to any sizecomponent up to a 12-inch nominalpipe size. The high-flowsection provides flow rates of upto 1,000 gallons per minute at 250pounds per square inch gage.Instrumentation <strong>and</strong> controls aretailored to the requirements for agiven test using the new NationalInstruments FieldPoint equipment<strong>and</strong> LabView software forthe data acquisition system. Anoverall view of the test area isshown in the figure.Contact: J.E. Fesmire (James.Fesmire-1@ksc.nasa.gov), MM-J2, (407) 867-7969Participating Organization: DynacsEngineering Co., Inc. (Z. Nagy)17
Mechanical EngineeringAnalysis of Nonstationary Signals UsingWavelets for Extracting ResonancesTo determine the frequencycomposition of a signal formechanical analysis, signalprocessing tools such as the FastFourier Transform (FFT) <strong>and</strong> theShort Time Fourier Transform(STFT) are used. However, theuse of Fourier analysis for frequencycomponent extraction isrestricted to b<strong>and</strong>-limited stationarysignals. Thus, small transientsmay not be detected due toa smoothing effect of the FFT, orthe FFT spectrum may besmeared due to frequency rampingor discontinuities in thesignal. <strong>Space</strong> Shuttle launchinducedacoustic <strong>and</strong> vibrationsignals can be classified asnonstationary r<strong>and</strong>om <strong>and</strong>exhibit features of a very shortduration transient. Varioustechniques have been employedto overcome the limitations of theFFT for nonstationary data.These techniques include windowedFourier Transform (Gaboror STFT), synchronous samplingto remove revolutions-per-minuteramp effects, Wigner-Ville analysis,<strong>and</strong> wavelet analysis.Wavelet analysis is based on afundamentally different approachin which the signal is decomposedon a series of special-basisfunctions called wavelets, whichare localized in time <strong>and</strong> have anintegral value of zero. Waveletanalysis can pinpoint local phenomenain nonstationary signals<strong>and</strong> provide the capability tocompress or de-noise a signalwithout appreciable degradation,while preserving both highfrequency<strong>and</strong> low-frequencycomponents. Wavelet techniquescan be extended to detect <strong>and</strong>analyze impending bearingfailure in rotating machinery (seethe graphs). Planned developmentswill use the MATLABplatform, a commercially availablesoftware.Key accomplishments:• <strong>1998</strong>: The wavelet analysismethods were applied to <strong>Space</strong>Shuttle launch-induced acoustic<strong>and</strong> vibration signals tohighlight key low-frequencycomponents affecting structuralresonance. The waveletanalysis methods were appliedto liquid oxygen pump rotatingmachinery analysis for conditionmonitoring, machinediagnostics, <strong>and</strong> bearing faultdetection <strong>and</strong> prediction.Key milestones:• A comparative evaluation ofthe FFT <strong>and</strong> wavelets isplanned. Effectiveness ofdifferent wavelet techniqueswill be studied.Contact: R.E. Caimi (Raoul.Caimi-1@ksc.nasa.gov), MM-J2, (407) 867-3748Participating Organizations: DynacsEngineering Co., Inc. (R.N. Margasahayam)<strong>and</strong> Information Dynamics,Inc. (O.J. Varosi)18
<strong>Research</strong> <strong>and</strong> <strong>Technology</strong> <strong>1998</strong>Stationary FailureOnset ofNonstationaryFailureTime Domain Signal for Impending Bearing FailureSteady StateBefore FailureMalvar DWTUseful DuringNonstationaryIntervalFFT NotUseful DuringNonstationaryIntervalComparison of DWT <strong>and</strong> FFT19/20
<strong>Research</strong> <strong>and</strong> <strong>Technology</strong> <strong>1998</strong>EnvironmentalEngineeringThe John F. <strong>Kennedy</strong> <strong>Space</strong> Center(KSC) is located on the MerrittIsl<strong>and</strong> National Wildlife Refuge.Therefore, KSC has always approachedits mission with an awarenessof the impact on the environment. As asociety, Americans have become increasinglyconcerned about the effect their actionshave on the environment. With thisawareness, KSC has increased its efforts to develop technologiesthat are environmentally oriented <strong>and</strong> proactive.The projects presented this year cover a wide range of environmentaltechnologies. An innovative method of scrubbing emissionsfrom boilers is being developed that will reduce the amountof pollutants produced by power plants that burn fossil fuels. Alsounder development are methods to clean solvent-contaminatedgroundwater using in situ techniques that could reduce cleanupcosts significantly.Another area of interest is the geographical information requiredto make environmental decisions. A development is continuingto integrate geographical databases that provide easy access to thedata used for planning purposes.A project to plan controlled burns is also underway. The burns arean important tool for restoration of endangered species habitat <strong>and</strong>reduction of the danger of wildfire in operational areas.21
Environmental EngineeringHabitat Management <strong>and</strong> Ecological RiskAssessment ModelingMonitoring <strong>and</strong> definition ofhabitat quality forbiodiversity, threatened <strong>and</strong>endangered species, <strong>and</strong> environmentalrisk assessment requirestate-of-the-art informationcollection <strong>and</strong> analysis capabilitiesto minimize costs. L<strong>and</strong>management practices in manyecosystems, including KSC, arebased on controlled burning forhabitat enhancement <strong>and</strong> reductionof wildfire fuels. Availableecosystem models <strong>and</strong> fire <strong>and</strong>smoke models provide someguidance; however, no systemcurrently exists that incorporatesthese tools with operationalschedules such as a payload orvehicle processing system, realtimemeteorological data, <strong>and</strong>remote sensing data for use inenvironmental decision support<strong>and</strong> risk assessment.The approach to this projectinvolves development of a diverseset of information toolsincluding rule-based expertsystems, numerical models, timeseries analysis, <strong>and</strong> fusion of avariety of data collection systems<strong>and</strong> databases to enhance thedecision process. The projectwill:• Provide data <strong>and</strong> informationto optimize the management ofresources at KSC <strong>and</strong> theMerritt Isl<strong>and</strong> National WildlifeRefuge.• Incorporate NASA remotesensing <strong>and</strong> advanced GIStechnology into local-scale,decisionmaking processes.• Provide information <strong>and</strong>methods to reduce the potentialfor wildfires at KSC.• Enhance NASA’s capabilities tocomply with Federal <strong>and</strong> Stateenvironmental laws such as theEndangered Species Act.Key accomplishments:• 1996: Obtained a high spectralresolution image of the KSCarea using the NASA AVIRISsensor. Initiated developmentof a deterministic model forestimating plant canopy biochemical<strong>and</strong> biophysicalcharacteristics.• 1997: Conducted an experimentalcontrol burn at KSC inassociation with the U.S. Fish<strong>and</strong> Wildlife Service, LosAlamos National Laboratory,United States Air Force, <strong>and</strong>Los Angeles County FireDepartment to develop data onfire spread, intensity, <strong>and</strong>smoke production. Obtainedhigh spatial resolution images(1 to 2 meters) of KSC. Obtainedfield measurements ofplant canopy biophysical <strong>and</strong>biochemical features <strong>and</strong> plantcanopy <strong>and</strong> leaf spectralcharacteristics for modeldevelopment <strong>and</strong> parameterization.• <strong>1998</strong>: Developed a Web-baseddecision support tool thatintegrates payload schedules,Shuttle operations schedules,facility locations, <strong>and</strong> controlledburn prescriptions tominimize conflicts <strong>and</strong> maximizemanagement of wildfirefuels <strong>and</strong> endangered wildlifehabitat. Integrated plantbiophysical features such asleaf area, leaf angle distribu-22
<strong>Research</strong> <strong>and</strong> <strong>Technology</strong> <strong>1998</strong>tion, canopy closure, canopy height,<strong>and</strong> bottom reflectance into a two-flowirradiance model for radiative transferin plant canopies.Key milestones:• 1996: Initiated GIS database integrationin Oracle <strong>and</strong> development ofimage processing methods for use ofhigh spectral resolution data in wildlifehabitat mapping. Presented twopapers at the Eco-Informa Conferencein Orl<strong>and</strong>o, Florida, on remote sensingmodeling in plant canopies.• 1997: Coordinated a multiagencyexperimental controlled burn to obtaindata on fire <strong>and</strong> smoke behavior incoastal environments.• <strong>1998</strong>: Enhanced communicationsbetween the U.S. Fish <strong>and</strong> WildlifeService <strong>and</strong> NASA Shuttle <strong>and</strong> PayloadsOperations through developmentof a Web-based Schedule AnalysisSystem for controlled burns at KSC.Contact: Dr. W.M. Knott (William.Knott-1@ksc.nasa.gov), JJ-G, (407) 867-7411Participating Organization: DynamacCorporation (R. Schaub <strong>and</strong> C. Hall)Example Output From the Web-Based Decision Support Tool ShowingIntegration of Fire Management <strong>and</strong> KSC Operational Areas• Individual controlled burn events are plotted on separate maps.• Only facilities with potentially critical smoke-sensitive operationsare plotted.• Half-mile buffer zones are plotted around each potentiallycritical smoke-sensitive operation to facilitate viewing of thelarge-scale map.• Shuttle operations occur within the Shuttle L<strong>and</strong>ing Facility,Vehicle Assembly Building, <strong>and</strong> launch pad regions.• Payload operations occur within the KSC Industrial Area <strong>and</strong>Cape Canaveral Air Station Industrial Area.• The smoke management area defines the region in which smokemay occur based on desired winds (smoke may also occurdownwind of this area).23
Environmental EngineeringThreatened <strong>and</strong> Endangered Species MonitoringThe habitats on KSC representan area of biological diversityunsurpassed among Federalfacilities. Under the EndangeredSpecies Act <strong>and</strong> the NationalEnvironmental Policy Act, alloperations require evaluation <strong>and</strong>impact minimization. Approximately100 wildlife species on theMerritt Isl<strong>and</strong> National WildlifeRefuge are vulnerable to extinction.Monitoring focuses oncombining field <strong>and</strong> remotesensing data with predictive/interpretive models on marineturtles, gopher tortoises, indigosnakes, wading birds, shorebirds,scrub jays, beach mice, <strong>and</strong>manatees. These studies contributedto more than 20 scientificjournal articles <strong>and</strong> were used todevelop rangewide speciesrecovery efforts.The influence of habitat onhabitat use <strong>and</strong> demographicsuccess is quantified at differentspatial scales. Monte Carlosimulation models are used toquantify the influence of habitatquality, population size, <strong>and</strong>catastrophes on populations.Declining habitat quality wasfound to be a critical factorinfluencing extinction risk, somore frequently prescribed firesare needed.Key accomplishments:• 1991: Developed habitat mapsof the most important areas atKSC for scrub jays, wadingbirds, <strong>and</strong> other species.• 1992: Developed a scrubrestoration <strong>and</strong> monitoringprogram.• 1993: Developed a wetl<strong>and</strong>srestoration program plan.• 1994: Developed a KSC biologicaldiversity evaluationsummary.• 1995: Developed techniques tomap habitat suitability.• 1996: Developed models topredict demographic successusing maps.• 1997: Tested the ability ofmaps <strong>and</strong> models to predictpopulations.• <strong>1998</strong>: Developed rapid assessmenttools for environmentalmanagers.Key milestones:• 1995: Population <strong>and</strong> habitatstatus trends summarized forgopher tortoise, wading birds,<strong>and</strong> scrub jays.• 1996: Development of scrubjay population recovery strategy.• 1997: Biological diversityprioritization analyses published.• <strong>1998</strong>: Habitat analysis procedurespublished.Contact: Dr. W.M. Knott (William.Knott-1@ksc.nasa.gov), JJ-G, (407) 867-7411Participating Organization: DynamacCorporation (D.R. Breininger)24
<strong>Research</strong> <strong>and</strong> <strong>Technology</strong> <strong>1998</strong>Height Classes of Florida Scrub Jay Territories at KSC From 1988 to 1997(Habitat classes are used for rapid assessment of scrub habitat quality.)Height ClassDescriptionMinimum Mapping UnitsShortShort/optimal mixTall mixTallEntire territory was 170 cm) <strong>and</strong> short <strong>and</strong>/oroptimal scrubEntire territory was >170 cm tallNo patch taller than 120 cm was≥0.4 hectare (ha) (1 acre)At least 1 patch of optimal scrubwas ≥0.4 ha <strong>and</strong> at least 1 patch ofshort scrub was ≥0.4 ha; no patchof tall scrub was ≥0.4 haAt least 1 patch of tall scrub was≥0.4 ha; at least 1 patch of short oroptimal scrub was ≥0.4 haNo scrub
Environmental EngineeringPilot-Scale Evaluation of a New <strong>Technology</strong> To Control NO xEmissions From Stationary Combustion SourcesTo ExhaustStack/Outside AirFlue GasBoiler No. 2InjectionReaction ZoneSamplesQuenchGas-to-LiquidScrubberExhaustSamplesconducted by UCF researchersindicated this technology wouldbe competitive with technology(selective catalytic reduction)currently available to powerplants if nitric oxide (NO) conversionefficiencies above 90 percentcould be achieved at a hydrogenperoxide feed rate of 1.37 molesof hydrogen peroxide per mole ofNO converted (to acid). ThePhase I results of this technologyshow 96 percent NO conversionswere achieved at a molar ratio of1.0.Key accomplishments:As a result of the implementationof the Clean Air ActAmendments of 1990, partiesresponsible for stationary combustionsources emitting nitrogenoxides (NO x) are looking formethods to meet regulatoryrequirements. NASA entered intoa 3-year cooperative agreementwith the University of CentralFlorida (UCF) to perform a pilotscalestudy of a new controltechnology for NO xemissionsfrom industrial-sized boilers (seefigure 1). Hydrogen peroxide isinjected into the flue gas streamto oxidize the NO xto nitrogenacids. This step is followed byliquid scrubbing, which producesa nitrogen-rich, water-basedwaste stream. This study was ascale-up on the order of 1,000times from lab-scale studiespreviously conducted at UCF. Ascale-up from this pilot plant to aFigure 1. Conceptual Design of the Systempower plant would be on thesame order of magnitude. NASA<strong>and</strong> UCF are joined by industrypartner EKA Chemicals, Inc., onthis research <strong>and</strong> developmentproject. EKA Chemicals brings tothe project extensive engineeringexpertise on various hydrogenperoxide applications.A data acquisition systemusing a personal computer <strong>and</strong>LabView software (see figure 2) istied into the entire system toallow for control, automaticemergency shutdown, <strong>and</strong> recordingof 21 points at a rate of 1sample per second. Over 100tests were conducted during thepast year resulting in over 6million data points.The primary result from thefirst phase of this study is shownin figure 3. A feasibility study• 1997: Phase I design, installation,<strong>and</strong> preliminary testingcomplete.• <strong>1998</strong>: Phase I testing, dataanalysis, <strong>and</strong> reports complete.Presentations at the Air <strong>and</strong>Waste ManagementAssociation’s Pacific Northwest<strong>and</strong> Southern Statessection meetings.Key milestones:• 1999: Present Phase I results atthe Air <strong>and</strong> Waste ManagementAssociation’s annualconference. Phase II design,testing, data analysis, <strong>and</strong>reports to be completed.Contact: M.M. Collins (Michelle.Collins@ksc.nasa.gov), JJ-D, (407) 867-4270Participating Organizations: Universityof Central Florida (Dr. C.D. Cooper; Dr.C.A. Clausen, III; <strong>and</strong> Dr. J.D. Dietz)<strong>and</strong> EKA Chemicals, Inc. (J. Tenney <strong>and</strong>D. Bonislawski)26
<strong>Research</strong> <strong>and</strong> <strong>Technology</strong> <strong>1998</strong>NOX Emission Reduction Test1BOILEREvent CounterThe event indicatorhas been depressedAux. NOBurnerT1 175.1 Deg F TI 1T1T3 174.9 Deg F T5 185.0 Deg F T7 161.4 Deg FT2T9 193.4 Deg FT3T5T7T9PC1CV12 3 4 5 6CV2CV1CV2CV11MFM MFM 76 SFPMTI 2NOX Flow0.11SLPMFC6FC3NO0 Vdc (5=On, 0=Off)0times during this run.Control PanelInput 0-100for percentage7CV2CV11 CV6 CV4CV7CV8CV3T11T4T6T8IMT4 180.0 Deg F T6 183.4 Deg F T8 168.1 TFMIDeg FWater SupplyTFM1 0.003 gpm T11 94.2Deg FSO2 Flow0.05 FC4SLPMGO 2Data FilenameFC-1File Name0 100.00 0.00 0.00 0.00 80.00 0.00Valve Act.FC-2NOX Flow% of F.S.FO4Water SupplyFC-3SO2 Flow% of F.S.FC-4Not UsedT10 110.4 Deg FFC-5Fan Speed% of F.S.VaporCircle SupplyFC-6NaturalGasBurner9SCRUBBERRecordSTOPALARMST10PHFC3Vent to OutsideFANVFD -0.0 %F.S.T11 CV11 P210P2 0.8 in W.C.F1TFM2TFM2-0.0 gpmH 2 O 2TANKW1 0.000 lbsT10P1P1 -0.1 in W.C.MI8????PH1 6.8 phOV14VaporWaterFigure 2. Front Panel of the PC Software Used To Collect Data From Points in the System100%% NO Conversion80%60%40%20%%NO Conversion0%0.0 0.5 1.0 1.5 2.0 2.5H 2 O 2 :NOFigure 3. Percent NO Conversions for Inlet NO x of 400 ppm <strong>and</strong>Tests Conducted Within the Temperature Range of 912 to 939°F27
Environmental EngineeringConcentration (mg/L)120100806040200Development of an In Situ Technique for ElectrokineticRemediation of Soils Contaminated With Heavy MetalsBecause of the costs <strong>and</strong> limitationsof the current remediationmethods, considerable effortis being directed toward thedevelopment of in situ treatmentmethods. An innovative method,electrokinetic remediation, offersa way for soils with a variety ofhydraulic conductivities to beremediated in situ. Electrokineticshas been used for decades toremove water from soils <strong>and</strong> inthe oil recovery industry, but insitu applications to remediatecontaminated soils is new. Electrokineticsis a process thatseparates <strong>and</strong> extracts certainheavy metals, radionuclides, <strong>and</strong>organic contaminants fromsaturated or unsaturated soils,sludges, <strong>and</strong> sediments. A lowintensitydirect current is appliedacross electrode pairs that havebeen implanted in the ground oneach side of the contaminated soilmass. The electrical currentEffect of Potential Effluent Concentrate(01/26/98 to 01/29/98, 20 V, 55 mA)lead zinc0 20 40 60 80Time (hours)Lead <strong>and</strong> Zinc Concentrations in Effluent With Applied Voltagecauses electroosmosis, ion migration,<strong>and</strong> electrophoresis, whichremoves bound ions from solidparticles <strong>and</strong> moves the aqueousphase contaminants in the subsurfacefrom one electrode to theother.Laboratory studies at theUniversity of Central Floridahave been used to evaluate theefficiency of this process <strong>and</strong> itslikelihood of success at KSC.Initially, studies were carried outin a 12-inch-long, 4-inch-diameterPlexiglas cell that was loadedwith 2,000 grams (dry weight) ofa synthetic soil mixture. The soilwas spiked with lead (Pb) <strong>and</strong>zinc (Zn) to concentrations up to2,000 milligrams per kilogram ofsoil, then the metals were immobilizedusing a sodium hydroxiderinse. Graphite electrodes (placedeither perpendicular or parallel tothe flow) were used with appliedvoltages ranging from 15 to 48volts <strong>and</strong> a constant current of100 milliamperes. A conditioningsolution of dilute lactic (0.1 to 0.5percent) acid was introduced atthe anode <strong>and</strong> removed at thecathode. This conditioning fluidserved as an additional liquid forcurrent flow <strong>and</strong> to keep the pHin an acceptable operating rangenear the cathode region.It was shown from theseexperiments that both Pb <strong>and</strong> Znwere quickly removed to 10percent of their original concentrations(within 7 days). A comparisonof the ion removal effi-28
<strong>Research</strong> <strong>and</strong> <strong>Technology</strong> <strong>1998</strong>ciency with <strong>and</strong> without anapplied voltage is shown in thefigure. As voltage was applied,the concentrations of Pb <strong>and</strong> Znin the effluent solution increased.In another experiment, removalefficiency was shown to bedependent on the addition oflactic acid. With only water as aconditioning fluid, extractionefficiency was low but, with theintroduction of a very low concentrationof lactic acid (as low as0.1 percent), the ion concentrationsin the effluent solutionbegan to increase dramatically.The effects of electrode positionwere studied by constructinga rectangular cell <strong>and</strong> positioningtwo pairs of electrodes at differentdistances. Experiments haveshown that electrodes positioned18 to 22 inches apart providedeffective movement of ions invarious soil types. This informationwas used to develop themost efficient electrode arrangementfor a field application. Ahexagonal array of anodes with asingle cathode placed directly inthe center was found to yieldefficient removal of metal ionswhile reducing the number ofpumping stations (cathodes)required.Additionally, a telephone line,an extension cord, <strong>and</strong> varioustypes of weathered pipe wereburied in the soil for a period of 3weeks to determine if the processwould interfere with communicationsor other subsurface electricalconduits. During this time,there was no disruption of communicationor electrical use <strong>and</strong>the pipes showed no pitting.Key accomplishments:• June <strong>1998</strong>: Laboratory studieswere completed.• August <strong>1998</strong>: Field demonstrationsite was selected at KSC.• September <strong>1998</strong>: Field designwas completed.Key milestone:• Laboratory data used to designthe field demonstration wascompleted, with field implementationto begin in January1999.Contact: J.W. Quinn (Jacqueline.Quinn-1@ksc.nasa.gov), JJ-D, (407)867-4265Participating Organization: Universityof Central Florida (Department ofChemistry <strong>and</strong> Departments of Civil <strong>and</strong>Environmental Engineering)29
Environmental EngineeringEnhanced In Situ Zero-Valent MetalPermeable Treatment WallsContaminant PlumeConfining UnitReactionWallPermeable Treatment WallChlorinated solvents have beenwidely used by NASA <strong>and</strong>others in the aerospace industryfor over three decades. Theyhave primarily been used asnonflammable degreasers <strong>and</strong>dryers for electronic parts. Historically,the disposal practices forspent chlorinated solvents includeddischarges to surfacewater <strong>and</strong> groundwater. It is,therefore, not surprising to findgroundwater solvent contaminationat 791 of the 1,300 NationalPriority List sites.Contaminant-FreeWaterTo date, the most commonlyused treatment method for thecleanup of chlorinated solventshas been the pump-<strong>and</strong>-treatmethod. With this method, thegroundwater is pumped to thesurface, <strong>and</strong> the contaminants areeither oxidized or removed withan air stripper. Although thepump-<strong>and</strong>-treat method wasoriginally thought to be a competentremediation tool, it hasshown itself to be most effectivein groundwater plume capture<strong>and</strong> containment. In general, itcan be said that the significantoperation <strong>and</strong> maintenance costsassociated with pump-<strong>and</strong>-treatsystems eliminate this remediationtechnique for large-scalecleanups.Within the last 5 years, asubstantial amount of researchfocused on the use of zero-valentmetals to catalytically enhancethe abiotic degradation of chlorinatedsolvents. Of the zerovalentmetals available <strong>and</strong> tested(iron, cobalt, zinc, <strong>and</strong> nickelprophyrins), iron is the mostattractive due to its low cost <strong>and</strong>availability. With this technology,iron filings are mixed with s<strong>and</strong><strong>and</strong> placed below the l<strong>and</strong> surface<strong>and</strong> downgradient of thecontaminant source. Naturalgroundwater gradient transportsthe contaminated groundwaterthrough the iron/s<strong>and</strong> permeabletreatment wall. As the contaminantcomes into contact with theiron filings, catalytic degradationof the chlorinated species beginswith what appears to be thesimultaneous oxidation of iron bywater <strong>and</strong> the subsequent reductivedechlorination of the contaminant.In March <strong>1998</strong>, a 40-foot-long<strong>and</strong> 4-foot-wide permeabletreatment wall was installed atLaunch Complex 34 at CapeCanaveral Air Station to a depthof 40 feet below l<strong>and</strong> surface. Thedemonstration project tested anew construction technique thatuses deep-soil mixing with vibroinstallationas a method forgetting the reactive iron into the30
<strong>Research</strong> <strong>and</strong> <strong>Technology</strong> <strong>1998</strong>subsurface. Preliminary analytical results indicate thatcontaminants such as cis-1,2 dichloride have droppedfrom an inlet concentration of greater than 13,000 µg/L toless than 60 µg/L, which is the Florida drinking waterst<strong>and</strong>ard.Key accomplishments:• September 1997: Patent application submitted.• August 1997: Field-scale design completed.• March <strong>1998</strong>: Construction completed.Key milestones:• Wall monitoring will continue over the next year withparticular attention on contaminant degradation <strong>and</strong>groundwater geochemistry changes.• Ultrasound field testing will be conducted on the wallduring the next year (see the KSC <strong>Research</strong> <strong>and</strong> <strong>Technology</strong>1997 <strong>Annual</strong> <strong>Report</strong>), <strong>and</strong> a tracer study will beinitiated to examine groundwater flow patterns.Contact: J.W. Quinn (Jacqueline.Quinn-1@ksc.nasa.gov), JJ-D,(407) 867-4265Participating Organization: University of Central Florida(Departments of Civil <strong>and</strong> Environmental Engineering <strong>and</strong> theDepartment of Chemistry)Field Application of Deep Soil MixingField Application of Vibroinsulation31
Environmental EngineeringInstallation of a New Scrubber Liquor forthe Nitrogen Tetroxide Scrubbers ThatProduces a Commercial FertilizerNASA, in conjunction withDynacs Engineering Co.,Inc., <strong>and</strong> United <strong>Space</strong> Alliance, isinstalling a prototype of the newscrubber-liquor control systemthat converts nitrogen tetroxide(the hypergolic oxidizer) to afertilizer. The fertilizer producedby this process will be used onthe citrus groves at KSC. Thisproject is in Phase V of a fivephaseprogram to comply withExecutive Orders 12856 <strong>and</strong>12873, the Right-to-Know Laws,<strong>and</strong> the Recycling <strong>and</strong> WastePrevention Law. Hypergolicpropellants are used in spacecraftsuch as the <strong>Space</strong> Shuttle, TitanIV, Delta II, <strong>and</strong> other vehicles<strong>and</strong> payloads launched at KSC<strong>and</strong> Cape Canaveral Air Station.Monomethylhydrazine (MMH),nitrogen tetroxide (N 2O 4or NTO),<strong>and</strong> hydrazine (N 2H 4or HZ) arethe main propellants of concern.Fueling <strong>and</strong> deservicing spacecraftconstitute the bulk of operationsin which environmentalemissions of nitrogen oxide (NO x)occur. The scrubber liquor wastegenerated by the oxidizer scrubbers(approximately 311,000pounds per year) is the secondlargest waste stream at KSC. Thedisposal cost for this oxidizerscrubber liquor waste is approximately$0.227 per pound or$70,600 a year.The new process will convertthe scrubber liquor to a highgradefertilizer (see the flowchart).The process reacts N 2O 4with hydrogen peroxide <strong>and</strong>potassium hydroxide <strong>and</strong> producespotassium nitrate, a majoringredient in commercial fertilizers.This process avoids thegeneration of the hazardouswastes, which occurs whensodium hydroxide is used as thescrubber liquor. A patent applicationthat covers the process hasbeen filed with the U.S. Patent<strong>and</strong> Trademark Office.A feature of the new processis lower NO xemissions, since thenew scrubber is more efficient atcapturing nitrogen tetroxide thanthe current scrubber liquor. Forexample, when the two scrubberliquors were compared undersimilar test conditions, the emissionsfrom the new scrubberliquor were only 1 to 10 percentof the emissions from the currentscrubber liquor. A major effect oflower NO xemission will be toreduce the size of the area aroundthe oxidizer scrubbers that mustCurrent ProcessModified ProcessNitrogenTetroxideNitrogenTetroxideHydrogenPeroxideControlSystemOxidizerScrubberOxidizerScrubberSodiumHydroxideWaterPotassiumHydroxideByproducts are ahazardous waste thatmust be disposed ofSodium HydroxideSodium NitrateSodium NitriteNitric OxideWaterByproduct is a high-gradefertilizer that can besprayed on the groundPotassium NitrateProcess Converting Nitrogen Tetroxide Wastes to Potassium Nitrate, a Commercial Fertilizer32
<strong>Research</strong> <strong>and</strong> <strong>Technology</strong> <strong>1998</strong>corrected during the current installation by changingthe point of addition of the reagents.In summary, this change in the scrubber liquorhas eliminated the second largest hazardous wastestream at KSC <strong>and</strong> produced a product that isapproved for application as fertilizer to the lawns<strong>and</strong> citrus groves at KSC. This new scrubber liquoris a 15-weight-percent potassium nitrate solutionwith 0- to 1-weight-percent hydrogen peroxide <strong>and</strong>a pH of 7. The system is more efficient <strong>and</strong> lessexpensive than the current 25-weight-percentsodium hydroxide, when all factors including wastedisposal, fertilizer replacement, <strong>and</strong> h<strong>and</strong>ling ahazardous waste (the spent oxidizer scrubberliquor) are considered.Control Panel for the Oxidizer ScrubberControl Systembe cleared during operations, thus reducing theimpact of toxic hypergolic oxidizer emissions onadjacent operations.The new scrubber liquor <strong>and</strong> control system wastested with nitrogen dioxide (NO 2) concentrationsfrom low parts per million to pure vapor. To simulateoperations at KSC where aspirators are used tocapture NO 2vapor, up to 500 st<strong>and</strong>ard cubic feetper minute of gaseous nitrogen (GN 2) were addedto the NO 2stream. In addition, approximately 90pounds of oxidizer (vapor <strong>and</strong> liquid) were addedover a 1- to 9-minute period to the scrubber. Underall of these test conditions, the new scrubber-liquorsystem performed well <strong>and</strong> produced lower emissions.The only problem encountered during thefield tests, which will require slight modifications tothe scrubber, was due to inadequate mixing in thescrubber sump. These mixing problems are beingKey accomplishments:• Developed a method to eliminate the secondlargest waste stream at KSC (oxidizer scrubberliquorwaste).• Developed internal diagnostics that monitor theperformance of the control system.• Developed a production process for potassiumnitrate, a fertilizer currently purchased by KSCfor use on lawns <strong>and</strong> citrus groves.• Demonstrated that the process control system isrobust <strong>and</strong> can withst<strong>and</strong> field operations.• Demonstrated that the scrubber liquor is moreefficient with only 1 to 10 percent of the emissionsfound with the current 25-weight-percent sodiumhydroxide scrubber liquor.Contacts: R.C. Young (Rebecca.Young-1@ksc.nasa.gov) <strong>and</strong>D.E. Lueck, MM-G2, (407) 867-4439Participating Organization: Dynacs Engineering Co., Inc.(C.F. Parrish, C.J. Schwindt, T.R. Hodge, <strong>and</strong> P.H. Gamble)33
Environmental EngineeringLess Toxic Orbiter TPSRewaterproofing Agent StudyThe present orbiter ThermalProtection System (TPS)rewaterproofing agent,dimethylethoxysilane (DMES),performs exceptionally well inpreventing water absorption inceramic, silica-based materials.DMES reacts with the surface ofglass fibers in the tile or the fabricin blankets <strong>and</strong> deposits a film oforganic material that repels water.Although the tiles <strong>and</strong> blanketsare waterproofed when fabricated,reentry burns out the agentwhen temperatures reach 1,050degrees Fahrenheit or greater,thus requiring rewaterproofingafter each Shuttle mission. Theaction of waterproofing resultsfrom the bonding of dimethylsilanol, an unstable reactionintermediate, with hydroxyls onthe silica fiber surfaces. When atypical 6- by 6- by 2-inch Orbitertile is rewaterproofed, 2 cubiccentimeters (cm 3 ) of DMES isinjected with a needleless guninto a small hole in the center ofthe tile.The threshold limit value(TLV) for DMES is 0.5 part permillion (ppm). Some workerscomplained of throat irritation<strong>and</strong> light headedness after beingexposed to low-ppm levels ofDMES. Orbiter Processing Facility(OPF) ventilation systemmodifications were made tominimize this problem. In thecourse of applying DMES beforea launch, toxic vapor emissions tothe OPF high bay are significantenough to require the use ofprotective gear <strong>and</strong> a breathingapparatus. The bay must becleared of all nonessential personnel<strong>and</strong> cannot be reopened forother vehicle work until theDMES vapors measure 0.5 ppm.Therefore, rewaterproofing mustbe performed on the third workshift <strong>and</strong> on weekends.A KSC Shuttle upgradesproject was initiated to find analternative, less toxic rewaterproofingagent to DMES butmaintain acceptable waterproofingperformance. Screening testswere performed with 2-inchLI-900 tile coupon cubes by injectingthem with 0.5 cm 3 ofwaterproofing agent. Also,material compatibility tests wereperformed with both types ofroom-temperature-vulcanizing(RTV) adhesives used in theorbiter TPS bonding process. Thecoupon screening tests uncoveredno waterproofing agent betterthan DMES. However, fivecarrier solvents [n-pentane; 2,3-dimethlybutane (DMB); 2,3-dimethyl pentane (DMP); acetone;<strong>and</strong> perfluorocyclobutane(PFCB)] were down-selected todilute the DMES (decrease itseffective toxicity) <strong>and</strong> to enhanceits dispersion throughout thesilica fibers in the orbiter TPS.Solutions of DMES in thesesolvents were injected into 6- by6- by 2-inch deep LI-900, reactioncuredglass (RCG) coated orbitertiles at various concentrations,<strong>and</strong> the resulting water uptakewas measured. Rewaterproofingresidue weight pickup was alsomeasured over a number ofcycles, <strong>and</strong> the results afterseveral injections showed insignificantaccumulative weightgains on the order of 0.2 percentor less. Another test series, tileoff-gassing detection, was performedto measure the concentration<strong>and</strong> duration of the emittedvapors. RCG-coated tiles wereinjected with DMES/solventmixtures while the tiles were in aPlexiglas chamber. This procedurewas used to compare theemission <strong>and</strong> decay rate of 100-percent DMES versus DMES/solvent combinations using theFoxboro Miran 203 meter. AFourier Transform Infrared (FTIR)method (measures each constituentseparately), previously developedby the Toxic Vapor DetectionLaboratory for DMES carts,was used to measure the amountof solvent (ppm) detected whenthe Miran meter measured 0.5ppm. This data was compared tothe TLV of the solvent to determineif concentrations wereacceptable.Flexible insulation blanketswere also injected with the abovesolutions of DMES using a needlegun. After injection, severaldroplets of water were placed onthe surfaces of the blankets <strong>and</strong>observed for absorption. Twotests each were performed with20-percent DMES solutions inDMP, DMB, <strong>and</strong> n-pentane. Twotests were also performed with10-percent DMES in PFCB. Allblanket rewaterproofing experimentswere successful in preventingwater droplets from enteringthe blanket surface.Overall, DMES solutions at 20percent in solvents performed34
<strong>Research</strong> <strong>and</strong> <strong>Technology</strong> <strong>1998</strong>successfully in tiles (i.e., the water absorbed in tileswas less than 5 percent of the tile weight). Allsolvents were also compatible with both RTV’s.N-pentane was finally selected as the solvent forDMES due to its low toxicity <strong>and</strong> low cost, combinedwith its excellent repeatability with DMES. Intests comparing off-gassing data, a TLV equal to 0.5ppm was achieved 44 percent faster in a tile injectedwith 20/80 DMES/n-pentane versus 100-percentDMES (5.3 hours versus 9.5 hours) (see the figures).In conclusion, n-pentane is recommended as thecarrier solvent for DMES to decrease the overallagent toxicity. It has a low toxicity (TLV of 600ppm), low cost ($4 per gallon), <strong>and</strong> excellent repeatabilitywhen combined with DMES. The newrecommended rewaterproofing combination is a20/80 DMES/n-pentane mix. The benefits of usingthe recommended mix are: (1) a decrease of DMESvapors in the OPF; (2) a reduction in protectiveequipment safety criteria; (3) a decrease in the costto perform rewaterproofing due to reduced safetyrequirements, fan usage, <strong>and</strong> the cost of chemicals;(4) a chemical cost saving estimated at $147,200 peryear (based on the current 100-percent DMES versus20/80 DMES/n-pentane mix for eight flows peryear; (5) the number of clearances of the high baycould be minimized, thus reducing rewaterproofingflow impacts to long-term program manifest requirements;<strong>and</strong> (6) greater flexibility in therewaterproofing process.Contact: S.R. Cunningham (Suzanne.Cunningham-1@ksc.nasa.gov), AA-D, (407) 867-7089Participating Organizations: NASA-KSC (F. Jones, M.Cardinale, D. Lueck, <strong>and</strong> J. Branard); Comprehensive HealthServices, Inc. (J. Taffer); Boeing-Seattle (C. Newquist); DynacsEngineering Co., Inc. (R. Barile, N. Bardel, J. Curran,T. Hodge, P. Gamble, C. Mattson, B. Meneghelli, <strong>and</strong>C. Parrish); NASA-JSC (C. Schomburg); BNA-Downey(D. Bell <strong>and</strong> M. Gubbert); Ames-Elorett (J. Pallix); United<strong>Space</strong> Alliance (S. Nickell, G. Powers, R. Loeffler, <strong>and</strong>O. Torres); <strong>and</strong> KSC-BNA (R. Frittier)Tile Injection, 2 cm 3 20-Percent DMES in n-Pentane,50 Liters per Minute, M203Tile Injection, 2 cm 3 Pure DMES,50 Liters per Minute, M20335
Environmental EngineeringSupercritical Air-Powered EnvironmentalControl Unit for SCAPEKSC uses the Self-ContainedAtmospheric ProtectiveEnsemble (SCAPE) for the safeguardof personnel h<strong>and</strong>lingrocket propellants. The existingconfiguration relies upon the useof a liquid-air-powered environmentalcontrol unit (ECU) thathas seen nearly 30 years of successfuloperation in support ofNASA <strong>and</strong> Air Force missions.The Category I configuration ofthis suit provides the user withtotally encapsulating protectionfor over 2 hours. However,several problems in the use ofliquid air have been identified<strong>and</strong> remain unsolved. Training<strong>and</strong> operational monitoring <strong>and</strong>constraints have safely controlledthese problems to date.A new initiative has begun forthe development of an AdvancedProtective Suit (APS) that willmeet future mission supportneeds in an environment that isexpected to impose even lowertoxic threshold limit values forhuman exposures. Initial effortshave focused on the remediationof liquid air system problems.Specifically, these problems aredependent upon (1) an uprightdewar (storage vessel) attitude,(2) an unstable or nonhomogeneousliquid mix where theliquid nitrogen component boilsoff before the oxygen component,<strong>and</strong> (3) the determination ofdewar quantity throughout theservice life when the ECU is on aperson’s back <strong>and</strong> in motion,which often is in an unusualattitude.A feasibility study of thestorage <strong>and</strong> use of air in asupercritical phase has beensuccessfully conducted in theBiomedical Laboratory at KSC.This development was an extensionof technology gained in aSmall Business Innovation <strong>Research</strong>project conducted byAerospace Design <strong>and</strong> Development,Inc., where a supercriticalair, positive pressure dem<strong>and</strong>,self-contained breathing apparatuswas designed. The SCAPEECU is a constant-flow systemthat supports respiration <strong>and</strong>cooling of the user. The new ECUstores 6.5 pounds of supercriticalair in a high-efficiency dewar <strong>and</strong>provides the air, after conditioning,to the suit air distributionmanifold. The prototype designwill be further modified to employa more effective liquidcooledgarment in place of aircooling. Problems with attitudesensitivity, stability of the gas,<strong>and</strong> quantity measure have beensolved in this relatively lowerpressure, cryogenic, gaseoussystem.Contacts: D.F. Doerr (Don.Doerr-1@ksc.nasa.gov), JJ-3, (407) 867-3152;<strong>and</strong> M.B. Brown, FF-D2-D, (407) 867-718636
<strong>Research</strong> <strong>and</strong> <strong>Technology</strong> <strong>1998</strong>AdvancedSoftwareThe goal of the Advanced Softwareprogram at the John F. <strong>Kennedy</strong><strong>Space</strong> Center (KSC) is to investigate<strong>and</strong> develop cutting-edge advanced softwaretechnologies in support of launch <strong>and</strong>ground processing functions. New softwaretechnologies are being developed toimprove capabilities <strong>and</strong> reduce operations<strong>and</strong> maintenance costs for present <strong>and</strong>future vehicles, payloads, <strong>and</strong> launchsystems.To meet the challenge of becoming moreefficient in all aspects of KSC work, advancedsoftware technologies are beingdeveloped from the exp<strong>and</strong>ing technologicalbase; <strong>and</strong> these technologies are beingused to improve performance, save time,<strong>and</strong> increase productivity. This year’sAdvanced Software program employs abroad range of disciplines <strong>and</strong> technologies,including programs that process vastquantities of data <strong>and</strong> make the data availablefor Operation’s use through tools(such as the Internet), model-based reasoningsystems to autonomously managecomplex chemical processing systems, <strong>and</strong>advanced mathematical techniques thatenhance capabilities for imaging <strong>and</strong> waveanalysis.37
Advanced SoftwareMars ISPP Autonomous ControllerTrans-MarsSolar ArrayHeatShroudKSC’s Roadmap to the Futureplaces an emphasis onNASA’s efforts to develop thetechnologies necessary to send amanned mission to Mars. A keyelement of NASA’s strategy tosend a manned mission to Mars isthe utilization of resourcespresent in the Martian environment.This element is known asIn Situ Resource Utilization(ISRU). One component of ISRUis the production of fuel <strong>and</strong>oxidizer for the Crew AscentVehicle. This is called In SituPropellant Production (ISPP).Communication lags betweenthe Earth <strong>and</strong> Mars make itimpractical to control the ISPPplant directly from Earth. Therefore,autonomous control softwareis necessary to operate theISPP plant with little or no helpfrom ground controllers. Sincethe plant has to operate for over ayear, the control software must beadaptive. It must be able toh<strong>and</strong>le component failures aswell as degradation of the chemicalprocesses. Because of thebroad applicability of autonomouscontrol, this project willhelp increase the body of knowledgefor all control system needs— whether targeted at mannedmissions to Mars or groundlaunch systems for the Shuttle.An important aspect of thisproject is the partnerships withother centers that make it possible.Johnson <strong>Space</strong> Center (JSC)is the lead center for the developmentof ISRU technologies, butthey are partnering with othercenters to capitalize on their areasof expertise. For the ISPP project,both Ames <strong>Research</strong> Center(ARC) <strong>and</strong> KSC have experiencewith artificial intelligence (AI)software for autonomous control.For the ISPP effort, KSC willcreate the AI program for autonomouscontrol using a languagecreated by ARC. As the projectprogresses, KSC will help ARCextend the capabilities of theirlanguage to incorporate moredynamic process modelingcapabilities needed to fullyimplement the ISPP controller.HeatShieldPropellantPlant3-Descent EnginesMars ISRU Sample ReturnMars Entry VehiclePropellantLiquifaction Unit3-L<strong>and</strong>er LegSystemThe primary objective for theMars ISPP autonomous controllerproject is to develop autonomouscontrol software that will operatea prototype ISPP plant constructedat JSC. However, JSC isstill experimenting with severaltechniques for ISPP, so immediatepursuit of this objective is premature.In order to elevate AI38
<strong>Research</strong> <strong>and</strong> <strong>Technology</strong> <strong>1998</strong>technology to the necessaryreadiness level, a simplifiedautonomous control packageusing the ARC-developed languagewill be created to operate asimulated ISPP plant. This willfacilitate development of softwaremodules to communicate withthe user <strong>and</strong> interface with thehardware. It will also helpidentify enhancements the ARClanguage needed to h<strong>and</strong>lequantitative modeling issuespresented by ISPP.As these enhancement needsare identified, KSC will workwith ARC to develop solutions.Once the enhancements arecompleted, KSC will use thisenhanced language to create acomprehensive autonomouscontroller for the ISPP simulation.When the JSC ISPP prototype iscompleted, KSC will deliver theautonomous controller softwareto JSC, where it will be integratedwith their adjustable autonomytest bed. KSC will make all thenecessary modifications to adaptthe autonomous controller to theJSC prototype hardware.Key accomplishment:• <strong>1998</strong>: Demonstration of thecircuit breaker <strong>and</strong> powerdistribution control systemusing model-based reasoning.Key milestones:• 1999: Demonstration of apreliminary ISPP monitoring<strong>and</strong> control system. Continuethe development of ISPPmonitoring capabilities. Exp<strong>and</strong>the functionality toinclude quantitative <strong>and</strong>semiqualitative diagnostic <strong>and</strong>control functions.Contact: W.E. Larson (William.Larson-1@ksc.nasa.gov), MM-G1, (407) 867-674539
Advanced SoftwareJView Internet Display of ShuttleReal-Time Data Using JavaThe rapid growth of Internet access to informationsince 1995 has resulted in a significantparadigm shift in how information is accessed <strong>and</strong>the resulting expectations of users concerninginformation availability <strong>and</strong> ease of access. Duringthe past 4 years, however, the type of informationaccessed on the Web has primarily been static innature. The recent availability of Java has enabled anew class of applications that contains dynamiccontent <strong>and</strong> real-time data sources over the Internet.The use of Java for display of real-time Shuttle dataas presented here represents a demonstration ofhow existing applications at KSC could be implementedusing the Internet paradigm.The current display of real-time Shuttle datainvolves a centralized server that receives data fromthe common data buffer <strong>and</strong> sends it to Intelprocessor PC clients who display it on predefinedscreens. PC clients use MS-DOS <strong>and</strong> characterbasedgraphics with close ties to specific hardware,operating systems, network interfaces, etc. Thisimplementation has no inherent security or abilityto work globally, <strong>and</strong> the PC becomes dedicated tothe display of data.Using Java presents an ideal approach sincemuch of the effort in establishing a client/serverconnection across a local or wide area network isalready provided. Java supports implementingsolutions as both applications <strong>and</strong> applets. Theapplet was used for the client-side display of Shuttlescreens. The advantages of a Java-based solutionare geographic independence; shorter development<strong>and</strong> training; write once, run anywhere applications;security; ease of administration; <strong>and</strong> multipleShuttle displays.The initial goal for the Internet Display ofShuttle Real-Time Data Using Java project was todemonstrate the feasibility of using Java <strong>and</strong> acommercial off-the-shelf (COTS) Web browser todisplay real-time <strong>Space</strong> Shuttle data, equivalent tothe current application called PCGOAL. This wassuccessfully demonstrated in the Automated <strong>and</strong>Intelligent Systems Computer Laboratory, wheremultiple computers of differing configurationsdisplayed the following data: (1) hardware (IntelX86, Sun SPARC, <strong>and</strong> Motorola POWER PC), (2)operating system (Solaris, SunOS, WindowsNT,Windows95/98, <strong>and</strong> Macintosh Finder), <strong>and</strong> (3)Web browser (Netscape Navigator, Version 4.0+;<strong>and</strong> Internet Explorer, Version 4.0+).In addition to demonstrating a single Webbrowser/JView client display on each of sevensystems simultaneously, a test of nine different Webbrowser/JView client displays on a singleWindowsNT system was possible. The best displayresults were achieved using version 4.0 of NetscapeNavigator <strong>and</strong> Internet Explorer, which contain ajust-in-time compiler for Java, greatly improvingdisplay performance by at least an order of magnitude.The current phase involves taking the proof-ofconceptwork completed earlier <strong>and</strong> applying thetechnology to solve actual monitoring requirementsat KSC <strong>and</strong> other NASA centers. In conjunctionwith this implementation, additional system design<strong>and</strong> testing will be accomplished in the areas of(1) tuning the applet (client) <strong>and</strong> application(server) for maximum performance; (2) establishingrobust extensible class libraries of reusable softwarecomponents, applicable for present <strong>and</strong> futureprojects; (3) analyzing network b<strong>and</strong>width utilizationto support the maximum number of clients; (4)providing direct connections to data sources, bothreal-time <strong>and</strong> historical; (5) developing graphicaluser interfaces with increased display options <strong>and</strong>resizable screens; (6) developing advanced plottingcapabilities using Java “swing” technology tomaximize extensibility; <strong>and</strong> (7) extensive systemlevel testing <strong>and</strong> certification.The viability of using Java, a relatively newlanguage/runtime environment, in conjunctionwith a COTS Web browser to rapidly develop <strong>and</strong>deploy process monitoring <strong>and</strong> control applications,has been demonstrated. This new technology hasthe potential of significantly reducing the time <strong>and</strong>cost of developing <strong>and</strong> maintaining applications,given the flexibility to write the application once<strong>and</strong> run it anywhere. Use of COTS systems <strong>and</strong> aWeb browser minimizes the cost, configuration, <strong>and</strong>training issues associated with deployment of new40
<strong>Research</strong> <strong>and</strong> <strong>Technology</strong> <strong>1998</strong>applications. This type of solution has great potentialapplicability at KSC, other NASA centers, <strong>and</strong>industry technology transfer in the areas of: (1)training using live or simulated data sources, (2)real-time monitoring of live <strong>Space</strong> Shuttle data (orany type of data source), (3) expert/advisorysystems for predictive analysis, <strong>and</strong> (4) historicalreview for postmission data analysis <strong>and</strong> review.Contact: K.C. Ballard (Kim.Ballard-1@ksc.nasa.gov), MM-G3, (407) 867-1720Participating Organizations: Dynacs Engineering Co., Inc.(J.M. Dockendorf, C.H. Goodrich, S.R. Beltz, <strong>and</strong> M.S. Long),Florida Institute of <strong>Technology</strong> (Dr. R. Stansifer), PrincetonUniversity (K. Gillett), <strong>and</strong> Duke University (W. Riddle)41
Advanced SoftwareAutomation of OMI S9002 forOrbiter ProcessingThe term S9002 refers to theoperations <strong>and</strong> maintenanceinstruction (OMI) for the PosttestData Review by responsibleengineers of sensor data collectedduring the certain critical processingof orbiters from the time ofl<strong>and</strong>ing up to <strong>and</strong> includinglaunch. OMI S9002 includes anumber of subordinate OMI’s.One is S0007, the OMI for orbiterlaunch, which includes theproduction of roughly 2,500sensor readings (data products)that require review by engineersresponsible for each of theorbiter’s subsystems <strong>and</strong> supportingsubsystems (e.g., mainengines, hazardous gas systems,auxiliary power units, etc.).Data products are hard-copyprintouts of charts, plots, graphs,or listings for specific sets ofperiodic sensor readings, usuallyspecified for a predeterminedtimespan, that include a startevent <strong>and</strong> stop event. Some dataproducts are also run on dem<strong>and</strong>at the request of a responsiblesubsystem engineer (typically inthe firing room) who specifieswhich data product to produce<strong>and</strong> provides specific start <strong>and</strong>stop times. These data productsare termed “will calls.”The present S0007 processincludes the following steps.First, Data Review Room (DRR)personnel physically monitor thelaunch process for specific dataproduct start <strong>and</strong> stop events tooccur. Next, after certain stopevents occur (which may behours or days following a stopevent), DRR personnel log intothe central data system (CDS),request a specific data product tobe run, <strong>and</strong> specify the printer orplotter for the hard copy printout.The hard copy is either picked upor h<strong>and</strong> carried to the engineer(will calls). The responsibleengineer then reviews the physicaldata product, analyzes thedata for potential problems, <strong>and</strong>determines the health of thesubsystem (analysis of largelistings may take hours). Theengineer then returns to the DRRto buy off the data product forwhich he/she is responsible (thiscan be 1 to 300 data products persubsystem).The original goals of theS9002 automation project were(1) to automate the generation ofgreater than 80 percent of thedata products for OMI S0007,with emphasis on hazardous gas;(2) to enable the display, to review,<strong>and</strong> to sign off those dataproducts by responsible engineersfrom their desktop computersusing the World Wide Web;<strong>and</strong> (3) to investigate the use ofavailable commercial off-the-shelfproducts <strong>and</strong>/or rule-basedtechnologies that could assist theresponsible engineers with theanalysis of the data products.The S9002 database wasmodeled, designed, <strong>and</strong> implementedusing a full-functionRDBMS (Oracle 7) <strong>and</strong> a modernWeb server. Code was written toautomatically load the databasefrom all available legacy systemsources to include DRR Dbase IV,CDS formatted files, CDS transactionfiles, <strong>and</strong> CDS FD files.Listeners <strong>and</strong> agents were integratedinto the database server toenable a transparent interface toall other S9002 subsystems,whether local or remote, <strong>and</strong>support many language interfaces.An event monitor was designed<strong>and</strong> implemented usingthe Java language to monitor theoccurrence of start <strong>and</strong> stopevents <strong>and</strong> was interfaced to boththe Shuttle Data Center (SDC)<strong>and</strong> S9002 databases. An applicationserver module was alsodeveloped using the Java language,which communicates withthe event monitor, SDC, theanalysis module, <strong>and</strong> S9002database to h<strong>and</strong>le the scheduling<strong>and</strong> control of data productcreation, transfer to the databaseserver, <strong>and</strong> the triggering of dataproduct analysis. In parallel, theprograms that actually producethe data products (DAP’s <strong>and</strong>CAP’s) were moved from theCDS to the SDC <strong>and</strong> modified toenable production of electronicfiles. These programs also underwentsignificant coding modificationto enforce st<strong>and</strong>ardization ofinputs, options, <strong>and</strong> functionality.Tests where then performed tomake sure the new S9002 applicationserver module could successfullycall <strong>and</strong> execute these SDCresident programs.In another effort, an analysismodule was being investigated<strong>and</strong> contrived. It was decided tocreate a rule-based applicationmodule that would perform the42
<strong>Research</strong> <strong>and</strong> <strong>Technology</strong> <strong>1998</strong>S9002 automation project to datehave exceeded the original requirements.same steps as an engineer whenanalyzing a large collection ofhazardous gas sensor data. Acomplete set of rules was establishedfor several of the largestdata sets by interviewing theengineers <strong>and</strong> documenting theirthought processes. These ruleswere then organized into a Javaapplication class, <strong>and</strong> methodswere written to enable reducingthe analysis to a single pageoutput that describes if therewere any anomalies found. Ifthere were anomalies, a briefexplanation of each would beincluded along with violatedparametrics.Being developed in parallelwith the other modules was theuser interface. This module wasscoped to run on platformindependentdesktop computers,with the only requirement beingTop-Level Menu Page for Administratorsthat the platform support acommercially available Webbrowser. Two paths were takenin the development of the GUI.One implementation proposedthe use of uploadable JavaApplets for all menus <strong>and</strong>screens, which yielded compatibilityproblems with browsers,slow loading, <strong>and</strong> difficulties incoding <strong>and</strong> maintenance. Theother implementation involvedthe use of the PL/SQL languagefor the dynamic creation ofHypertext Markup Language(HTML) sent to/from the clientplatform, which yielded ahighly responsive, easy to code<strong>and</strong> use interface with dynamicscreen sizing. While bothsolutions could eventually bemade to work, the PL/SQLsolution was chosen for implementationof the S9002 automationat this time. Results of theAs a result of this project,greater than 95 percent of dataproducts for S0007 (orbiterlaunch) are run fully automatically<strong>and</strong> are typically availablefor viewing within 30 secondsafter stop events occur. The S9002database <strong>and</strong> application softwaresupports all S9002 OMI’s(approximately 5,300 data products).Engineers can run any dataproduct at any time by specifyingboth start <strong>and</strong> stop times (willcalls) <strong>and</strong> can create custom dataproducts at will <strong>and</strong> execute themimmediately. Several <strong>Space</strong>Transportation System flows canbe run simultaneously withoutconflicts. The rule-based analysisof large volumes of data forhazardous gas has proven to bevery efficient <strong>and</strong> has identifiedin near real time many interestinganomalies (gas leaks, powersupply outages, etc.) hours beforebeing discovered by the responsibleengineers using manualmethods. Responsible engineersnow have a tool to monitorsubsystem health, review discoveredanomalies, <strong>and</strong> electronicallysign off completed data productswithout leaving their desks.Contact: W.C. Jones (William.Jones-3@ksc.nasa.gov), MM-G3, (407) 867-4181Participating Organizations: DynacsEngineering Co., Inc. (W. Spiker, II; J.M.Dockendorf; <strong>and</strong> J. Zambrano), United<strong>Space</strong> Alliance (W.S. Bayles), <strong>and</strong>Boeing (D.J. Cox)43
Advanced SoftwareWeb-Based Work Tracking SystemsThe Logistics OperationsDirectorate’s Materials ScienceDivision (MSD) has a new softwaresystem running in real timeon the World Wide Web. Thissystem is named the Work TrackingSystem (WTS) <strong>and</strong> it demonstratesthe integration of commonWeb browsers with a commerciallyavailable relational databasemanagement system tocreate a single, user-friendlymeans of controlling work flow.The MSD laboratories wereestablished during the Gemini erato provide quick laboratorysupport to vehicle <strong>and</strong> facilityoperations at KSC. The MSD wasGovernment <strong>and</strong> contractoroperated but was converted to a100-percent Civil Service operationin 1968 so unbiased investigationscould be provided.Prior to this new application,each group in the MSD kept aseparate report log containingunique fields, such as investigatorname, date started, date completed,<strong>and</strong> report number. TheWTS offers a single means ofmaintaining the report log <strong>and</strong>tracking the work flow, resultingin a much more efficient operationfor both laboratory investigators<strong>and</strong> their customers. TheWTS also aids the MSD in theireffort to become ISO 9000 compliant.The benefits <strong>and</strong> features ofthe WTS are many. The system ishardware <strong>and</strong> software independenton the server side – practicallyall server manufacturers <strong>and</strong>operating systems can run it. Onthe client side, practically alldesktop computers, includingAdministrators Page44
<strong>Research</strong> <strong>and</strong> <strong>Technology</strong> <strong>1998</strong>Macintosh, PC, <strong>and</strong> UNIX workstations, can use WTS with a Webbrowser.WTS offers a full-function,relational database managementsystem (RDBMS). Featuresinclude referential integritychecking, security, transactionlogging, <strong>and</strong> a distributed database.The RDBMS selected forthe WTS implementation isOracle because of its wide usageat KSC.The Web pages are dynamicallycreated in real time based onuser inputs using ProceduralLanguage/Structured QueryLanguage (PL/SQL) that is storedin the database itself. Browsertables are also produced dynamically.The use of PL/SQL forWTS implementation results infast system response time.The WTS’s current serverconfiguration is a Sun Sparc II,running Solaris 2.5.1 (UNIX),Oracle Enterprise RDBMS, <strong>and</strong>Web server software. The clientneeds only a PC, Mac, or UNIXwork station <strong>and</strong> a Web browser(such as Netscape or InternetExplorer) to access the system.Similar systems were alsodeveloped <strong>and</strong> implemented atKSC, including the KSC Corrective<strong>and</strong> Preventive Action Systemtracking audit, nonconformity,<strong>and</strong> opportunity for improvementstatuses. Othersystems still in developmentinclude the KSC CenterwideAwards system that will track allNASA awards <strong>and</strong> the awardbudget. Other WTS demonstrablefeatures include:• Automatic e-mail to customerswith status changes, such asjob on hold, job complete• Automatic notification to MSDpersonnel for new jobs <strong>and</strong>status updates• Ad hoc reporting• Security <strong>and</strong> access controlwith password <strong>and</strong> firewall• Automatic file transfer• Transaction logging• Electronic signatures• Add <strong>and</strong> display job documentsincluding pictures <strong>and</strong>reports• Job splitting• Equipment calibration tracking• Part/material trackingContacts: W.C. Jones (William.Jones-3@ksc.nasa.gov), MM-G3, (407) 867-4181; <strong>and</strong> K.C. Ballard, MM-G3, (407)867-1720Participating Organizations: LO-G4-M(S. Murray) <strong>and</strong> Dynacs EngineeringCo., Inc. (N. Tuttle <strong>and</strong> W. Spiker)45/46
<strong>Research</strong> <strong>and</strong> <strong>Technology</strong> <strong>1998</strong>AtmosphericScienceThe Atmospheric Sciences <strong>Technology</strong>program at the John F.<strong>Kennedy</strong> <strong>Space</strong> Center (KSC)addresses the impacts of weather onground, launch, <strong>and</strong> l<strong>and</strong>ing processingwith a view to increasing safety of personnel,protecting resources, <strong>and</strong> reducinglost work time by improving detection,analysis, <strong>and</strong> prediction of weatherevents <strong>and</strong> protection from weatherevents. Many of the weather impacts areof a specialized nature, differing fromthose felt by the public <strong>and</strong> even aircraftoperations, <strong>and</strong> require studies <strong>and</strong>development that cross the lines ofconventional scientific disciplines.Weather events focused upon by theprogram include lightning <strong>and</strong> cloudelectrification, convective cloud growth,atmospheric surface <strong>and</strong> planetaryboundary layer circulations <strong>and</strong> processes,wind shear effects, severe weatherphenomena, rain, wind, <strong>and</strong> fog.47
Atmospheric ScienceHurricane Wind SensorThe objective of this project is todevelop a low-cost, highspeedwind sensor <strong>and</strong> a selfcontaineddata acquisition systemfor in situ measurement of windsfrom hurricanes <strong>and</strong> tornadoes to300 miles per hour. Scientists atthe National Oceanic <strong>and</strong> AtmosphericAdministration (NOAA)indicated a need for such asystem <strong>and</strong> have formally requestedKSC to undertake thedevelopment. When hurricaneAndrew struck South Florida in1992, there was no reliable l<strong>and</strong>based,maximum wind speedmeasurement. All known sensorsin Andrew’s path of maximumwind were destroyed, presumablyin winds short of maxima.The controversy continues todayFigure 1. New-Generation Wind Sensor Incorporates Strain Gage<strong>Technology</strong> for Compact Design <strong>and</strong> High-Speed Performancewith some scientists estimatingAndrew’s gusts at greater than200 miles per hour. High windspeed information is needed atKSC to allow engineering assessment<strong>and</strong> recertification of facilities,ground support equipment,<strong>and</strong> flight hardware should anextreme wind event occur.The high wind speed sensor(see figure 1) at KSC uses twodifferent principles of physics toprovide two independent measurementsof wind speed: (1) theaerodynamic force imparted to alow-profile, rigidly mountedcylindrical rod <strong>and</strong> (2) the vibratingfrequency of the rod asvortices are shed from the cylindricalsurface. A common set ofstrain gages is used for bothmeasurements. The force measurementis proportional to thesquare of the wind speed. Since itis a vector quantity, it can also beused to infer wind direction. Thevortex shedding frequency is ascalar quantity <strong>and</strong> is linearlyproportional to wind speed. Thedata system is battery operated,designed for unattended operation,<strong>and</strong> hermetically sealed towithst<strong>and</strong> driving rain <strong>and</strong> stormsurge flooding that is typicallyassociated with l<strong>and</strong>fall hurricanes.The system will automaticallyacquire <strong>and</strong> store at least 72hours of sustained <strong>and</strong> peakwindinformation for poststormevent analysis.A prototype data acquisitionsystem was designed <strong>and</strong> fabricated.Three generations ofprototype sensors were designed<strong>and</strong> tested with each showing48
<strong>Research</strong> <strong>and</strong> <strong>Technology</strong> <strong>1998</strong>Figure 2. Raw Data Plot of Strain Gage (SG) Anemometer Versus Turbine Air Speed Sensor(Vehicle Test at the SLF)significant improvement over its predecessor. Thefunctional characteristics revealed during preliminarywind tunnel testing of the first design wereused to refine the subsequent designs. The latterdesigns were tested to 120 miles per hour on a roadvehicle at the Shuttle L<strong>and</strong>ing Facility (SLF) (seefigure 2). Wind speed values inferred from staticstrain (force) measurements agree well with thoseobtained from a co-located turbine air speed sensor.The frequency components of the sensor output, asrelated to the probe’s mechanical resonance <strong>and</strong>vortex shedding vibration, have not been fullyanalyzed but preliminary findings show promisethat independent wind speed measurements areextractable from the frequency spectra.Key accomplishments:• Designed <strong>and</strong> fabricated a prototype data acquisitionsystem printed circuit board.• Designed, fabricated, <strong>and</strong> laboratory tested threegenerations of prototype wind sensors.• Proved that force measurement is a viablemethod of inferring wind speed <strong>and</strong> direction toat least 120 miles per hour (midcategory 3 hurricane).• Initiated an investigation of vortex sheddingfrequency as a function of wind speed.Key milestones:• Deployment of sensor during 1999 Atlantichurricane season.• Final design <strong>and</strong> completion of sensor by October1999.Contact: J.A. Zysko (Jan.Zysko-1@ksc.nasa.gov), MM-G2-A,(407) 867-6532Participating Organization: Dynacs Engineering Co., Inc.49
Atmospheric ScienceSingle-Station Accurate Location of Lightning StrikesThe objective of this project is todesign an accurate singlestationlightning location systemto aid in the detection of lightningstrikes within the launch padperimeter. This project is anupgrade to the lightning locationsystem first conceived in 1997.Existing lightning location systemsat KSC provide coverage ofa wide area extending over a 30-mile radius but have an accuracyon the order of about 500 meterswithin the KSC area. Thesesystems cannot be used to determine,for instance, whether alightning strike occurred inside oroutside the perimeter of thelaunch pads. Since electronicequipment can be damaged bythe effects of nearby lightningstrikes, the accurate knowledge ofthe striking point is important todetermine which equipment orsystem needs to be retestedfollowing a lightning strike.The fast-varying electriccurrents associated with lightningstrikes generate large electric fieldvariations. The electric fieldwaveform propagates at thespeed of light in a radial directionfrom the striking point. Thesudden heating of the air causedby the large currents associatedwith the lightning dischargeproduces a sudden expansion ofthe air near the lightning channel.This results in a sonic wave(thunder) that initially, for thefirst few meters, propagates at asupersonic speed <strong>and</strong> laterpropagates at a sonic speed. Foran observer located away fromthe striking point, the electricfield waveform arrives earliersince it travels at a speed of300,000,000 meters per second(m/s), while the sonic wavetravels at about 320 m/s. Theobserver can determine thedistance to the striking point bymeasuring the time between thearrival of the electric field waveform<strong>and</strong> the arrival of the sonicwave.The improved lightninglocation system consists of anelectric field sensor <strong>and</strong> five sonic(thunder) recorders. Four ofthese sonic sensors are located inthe perimeter of a 1- or 2-meterradiuscircle, 90 degrees apartfrom each other, with the electricfield sensor placed in the centerof the circle. The fifth sonicsensor is located 1 or 2 metersabove the plane formed by thefour sensors. Following a lightningstrike, the sonic wavearrives at each sensor withinmilliseconds of each other, sincethe distance to the striking pointis slightly different for each sonicsensor. Based on the differencesin the time of arrival of the sonicwave at each sensor, a set ofequations can be solved to determinethe angle of arrival of thesonic waveform. The differencesin the time of arrival can beprecisely measured, to better than10 microseconds, by performingreal-time digital cross-correlationsamong the signals receivedby the five sensors. The distanceto the lightning strike is determinedby the time elapsed fromthe detection of the electric fieldto the detection of the thunder50
<strong>Research</strong> <strong>and</strong> <strong>Technology</strong> <strong>1998</strong>signal, since the thunder propagates at a known speed ofabout 320 m/s.Key accomplishments:• Designed <strong>and</strong> prototyped the electric field sensor, thesonic sensors, <strong>and</strong> the microprocessor-based controller.• Developed an algorithm to combine the informationreceived from a network of sensors to determine theangle of arrival of the thunder signal.Key milestones:• Conduct field tests at the launch pads.• Evaluate the performance of the system <strong>and</strong> refine thealgorithms if needed.Contact: C.M. Ihlefeld (Curtis.Ihlefeld-1@ksc.nasa.gov), MM-G2-A,(407) 867-6747Participating Organization: Dynacs Engineering Co., Inc.(P.J. Medelius, J.D Taylor, <strong>and</strong> J.J. Henderson)51/52
<strong>Research</strong> <strong>and</strong> <strong>Technology</strong> <strong>1998</strong>MaterialsScienceThe Materials Science <strong>Technology</strong>program at the John F. <strong>Kennedy</strong><strong>Space</strong> Center (KSC) supportsadvanced technologies directed towardimproving launch site safety, operability,<strong>and</strong> maintainability. The program includesapplication materials engineering,materials testing, chemistry, <strong>and</strong> otherscience disciplines. The near-term programfocuses on Shuttle ground processingimprovement by providing materials<strong>and</strong> coatings that afford better corrosioncontrol, materials with better hazardoussystems compatibility, <strong>and</strong> improvedtesting methods <strong>and</strong> instrumentation.The long-term program will (1) investigatematerials technology that can beused to develop new launch <strong>and</strong> processingfacilities for future vehicles <strong>and</strong>payloads, (2) reduce the cost of maintenance,(3) provide higher safety <strong>and</strong>reliability, <strong>and</strong> (4) provide more environmentallyfriendly systems.53
Materials ScienceStudy of Electrostatic Charging <strong>and</strong> Discharging ofMaterials in a Simulated Martian EnvironmentThe Materials Science Laboratoryhas been studying <strong>and</strong>testing electrostatics of materialsfor the past 25 years. Electrostatics(or triboelectricity) is concernedwith the tendency ofmaterials to build up <strong>and</strong> hold apotentially dangerous staticcharge. <strong>Research</strong> efforts forelectrostatic testing of materialsunder vacuum or in extraterrestrialenvironments do not exist.The goal of this project is to testthe materials under vacuum thatwill be used for future Marsmissions <strong>and</strong> to simulate Martianconditions to determine theirtriboelectric properties. Resultsfrom this testing will guide theselection of materials not only forMartian exploration but for otherspace exploration.Vacuum ChamberThe potential issues regardingtriboelectric properties of materialshave become significant withthe recent Pathfinder mission toMars. The surface of Mars mainlyconsists of iron oxides <strong>and</strong>large amounts of very fine materialsthat are similar to talcumpowder. Particles of this sizepose special problems becausethey have increased mobility <strong>and</strong>can easily become attracted tooppositely charged surfaces fromgreater distances. The Martianenvironment is windy (30 metersper second at peak velocity) withperiods of low temperatures <strong>and</strong>extremely dry conditions. Thisprovides ideal conditions necessaryto generate triboelectriccharging.The project was initiated inMarch <strong>1998</strong>. A vacuum chamber40 inches in diameter by 60 inchesin length was purchased in April<strong>1998</strong> <strong>and</strong> is currently beingequipped with controls to simulatethe Martian environment. Arobotic triboelectric tester is beingdesigned to operate remotely inthe vacuum chamber. A Martianregolith soil simulant was obtainedfrom Johnson <strong>Space</strong> Center(JSC) for researching the possibleelectrostatic charging of Martians<strong>and</strong>s. The soil simulant isvolcanic ash from the Pu’u Nenecinder cone on the isl<strong>and</strong> ofHawaii. Consequently, a prototypewas designed <strong>and</strong> built forthe soil simulant delivery system.The prototype will simulate theMartian atmospheric movementof soil to determine if there is54
<strong>Research</strong> <strong>and</strong> <strong>Technology</strong> <strong>1998</strong>electrostatic charge generation onthe selected materials. Theresearch efforts in the upcomingyear will focus on the vacuumchamber, procuring the materialsselected for the future Marsmissions, <strong>and</strong> testing the simulantsoil <strong>and</strong> materials at ambientconditions as well as in thesimulated Martian environment.Key accomplishments:• Procured a vacuum chamber.• Obtained <strong>and</strong> analyzed theMartian regolith soil simulant.• Built <strong>and</strong> tested the first proofof-conceptprototype for a soilsimulant delivery system.• Initiated the design for therobotic triboelectric tester.• Mars electrostatic dischargeplan presented <strong>and</strong> acceptedby JSC in situ resource utilizationleads.• Collaborated with Lewis<strong>Research</strong> Center, who is developingthe methodology toremove dust from photovoltaiccell surfaces.Key milestones:• February 1999: Completemodifications to the vacuumchamber.• September 1999: Complete thetesting <strong>and</strong> calibration of theMartian Environmental Compatibilityassessment electrometerattached to the Marsrobotic mission for the JetPropulsion Laboratory.• October 1999: Determine thetriboelectric characteristics ofthe simulant soil at ambientconditions <strong>and</strong> in the simulatedMartian environment.Complete the fabrication <strong>and</strong>testing of the robotic triboelectrictester.• September 2000: Determinethe triboelectric characteristicsof the selected materials undervacuum conditions <strong>and</strong> in thesimulated Martian environment.• May 2001: Submit the contributionto the electrostaticsexperiment package on the2003 Mars robotic mission.Identify <strong>and</strong> evaluate methodsto reduce charge buildup onMars Rover mission vehicles.Contact: H.S. Kim, Ph.D. (Hae.Kim-1@ksc.nasa.gov), LO-G3-C, (407) 867-3911Participating Organizations: LO-G3-C(D. Jackson), LO-G3-T (A. Finchum, Dr.R. Gompf, Dr. R. Lee, D. Lewis,M. Parenti, <strong>and</strong> N. Salvail), LO-G4-E(J. Bayliss <strong>and</strong> J. Rauwerdink), LO-G4-M (P. Richiuso), <strong>and</strong> Sweet BriarCollege (Dr. C. Calle)55
Materials ScienceInvestigation of Water Soluble Polyaniline as a Replacement forChromate Coatings on Aluminum Alloys<strong>Research</strong> has been ongoing forover 20 years at the KSCMaterials Science Laboratory tofind coating materials to protectlaunch site structures <strong>and</strong> equipmentfrom the extremely corrosiveconditions present at thelaunch complexes. The combinationof proximity to the AtlanticOcean <strong>and</strong> acidic combustionproducts from solid rocket boostersduring launch results incorrosive stresses unique to KSC.In the mid-1980’s, researchers atthe Materials Science Laboratorybecame interested in polyanilines(PANI’s) as protective coatingsfor metallic surfaces.Several proprietary PANIbasedcoatings were tested at KSCas possible coatings for theprotection of steel from corrosion.Exposure of PANI-coated steelpanels at the KSC beach corrosiontest site <strong>and</strong> evaluation by electrochemicalimpedance spectroscopy(EIS) led to the conclusion thatthe PANI-based coatings are notsuitable as corrosion inhibitors ofstainless steel.The PANI-based coatingspreviously tested for the corrosionprotection of steel were notwater soluble. Water-solublePANI’s have been synthesizedrecently. Water solubility hasfavorable economic <strong>and</strong> environmentaladvantages in terms ofease of processing <strong>and</strong> of reducedtoxicity. Interest in new protectivecoatings for aluminum alloyshas been motivated by concernfor improved protection <strong>and</strong> theenvironment. The availability ofthe water-soluble PANI coatingslead to the idea of testing them aspossible replacements for chromatecoatings on aluminumalloys.In the present investigation,EIS was used to investigate thecorrosion-inhibiting properties ofa PANI-based coating on aluminumalloys under immersion inaerated 3.55-percent sodiumchloride. The coating was preparedby mixing a water-solublelignosulfonic acid dopedpolyaniline with a high solidsmethoxymethylated melamineresin in a 1:2 ratio. The alloysused were aluminum 2024, 6061,<strong>and</strong> 7075.Corrosion potential <strong>and</strong> EISmeasurements were gathered onthe test specimens over a 1-weekimmersion period each. Nyquistas well as Bode plots of the datawere obtained. The PANI-coatedalloys showed large fluctuationsin the corrosion potential duringthe first 24 hours of immersionthat later subsided <strong>and</strong> approacheda steadier change. TheEIS spectra of the PANI-coatedalloys were characterized by animpedance that is higher than theimpedance of the bare alloy.Changes in the EIS spectra weresimilar for PANI-coated aluminumalloys 2024 <strong>and</strong> 7075. Therewas a decrease in the rate ofcorrosion of these alloys duringthe first 24 hours of immersionfollowed by an increase. The rateof corrosion of PANI-coatedaluminum 6061 did not show theinitial decrease. The rate ofcorrosion of bare aluminum 2024decreased with immersion time.The low-frequency impedance (at0.05 hertz), Z lf, for the PANIcoatedalloys decreased withimmersion time. Visible signs ofcoating failure (in the form ofblisters) developed on aluminumalloys 2024 <strong>and</strong> 7075.Key accomplishments:• Water-soluble polyaniline wassynthesized.• A coating using water-solublepolyaniline was formulated.• Aluminum alloy panels withwater-soluble polyanilinecoating were prepared.• EIS testing of polyanilinecoatedaluminum alloy panelswas conducted.Key milestones:• Conduct tests of polyanilinecoatedaluminum alloys includingexposure at the KSCbeach corrosion test site <strong>and</strong>EIS measurements.• Perform analysis of the metalsubstrate using metalography.Contact: C.J. Bryan (Coleman.Bryan-1@ksc.nasa.gov), LO-G3-C, (407) 867-4614Participating Organizations: R<strong>and</strong>olph-Macon Woman’s College (Dr. L. Calle),LO-G4-M (L.G. MacDowell), <strong>and</strong>University of Arkansas at Little Rock(Dr. T. Viswanathan)56
<strong>Research</strong> <strong>and</strong> <strong>Technology</strong> <strong>1998</strong>Qualified Materials Listings forPlastic Films <strong>and</strong> Adhesive TapesAneed existed in 1990 at KSCfor information that couldreadily be available to engineerswho must make the choice ofwhich plastic film to use for aspecific application. Plastic filmsare commonly used to wrap flighthardware for ground processing,to package small componentsprior to delivery, or to providelimited barrier protection fromminor (leaking) amounts of liquidrocket propellant. The adhesivetapes used to assemble <strong>and</strong>secure these plastic films mustequally be readily available to theengineer. The need for qualifiedfilms <strong>and</strong> tapes was also drivenby safety requirements that areunique to KSC (which include areasonable resistance to flammability,a material that is minimalas an electrostatic generator, <strong>and</strong>total ignition resistance to hyper-golic rocket propellants). Whilevendor literature could be used todetermine the mechanical propertiesof a film or tape, there was nosuitable industry data that couldaddress the above safety concernswhich would be acceptable toKSC.In order to tailor the programfor KSC, only those materialsrequested by KSC contractorswere initially evaluated. Othermaterials that were submitted byother NASA centers or by vendorswho wished to be includedin the listings were evaluatedwhen time <strong>and</strong> resources wereavailable. An electronic databaseof test results was subsequentlyestablished from which thelistings could be created. The testmethods used to produce thesetest results were:1. Flammability testing perNASA-STD-60012. Electrostatic testing per KSC/MMA-1985-793. Hypergolic ignition penetrationtesting per KSC/MTB-175-88Each film or tape was subsequentlycategorized based on itsability to meet some or all safetyrequirements. This would enablethe user to quickly access c<strong>and</strong>idatematerials once the operationalneeds are determined. Amaterial must at least pass theflammability acceptance criteriabefore it can be included in thequalified listings. These listingsare updated on a quarterly basis.Contacts: N.P. Salvail (Napoleon.Salvail-1@ksc.nasa.gov) <strong>and</strong> R.J.Frankfort, LO-G3-T, (407) 867-140357
Materials ScienceDetermination of Sodium in Colloidal SilicaLudox AS-30, a product ofDuPont, is a colloidal silicasolution containing sodium thatis used in many aspects of theorbiter’s Thermal ProtectionSystems. Ludox is incorporatedinto thermal tile production <strong>and</strong>repair <strong>and</strong> flexible insulationblanket coatings <strong>and</strong> serves as thebasis for adhesives. The amountof sodium present in the colloidalsilica solution used for thesepurposes has a direct effect onthe level of crystallinity observeddue to the formation of cristobalite.The presence of cristobaliteis detrimental to the performanceof materials due to itstendency to exfoliate or flake.The Materials Science DivisionTest Branch has been involvedwith the development of a reliable<strong>and</strong> expedient method fordetermination of the level ofsodium present in such silicacolloids.Several methods have beenattempted in devising a quantitativeanalysis for sodium in silicacolloids. Initially, ASTM MethodC575-81, inductively coupledargon plasma (ICAP), <strong>and</strong> ionchromatography were used.None of these procedures gavereliable or reproducible results.Following consultation withchemists at DuPont, a modifiedprocedure using ICAP wasdeveloped. This method involvesdigestion of the colloidal dispersionusing hydrofluoric acid <strong>and</strong>nitric acid. After addition of theacids, the samples are heatedinside a CEM MDS 81D microwaveuntil complete dissolutionoccurs. Presumably, acid digestionunder these conditions hasthe ability to physically break thediscrete uniform spheres of silicapresent in the colloid to releasethe sodium present. Digestion ofaqueous samples (as received)was performed. The sampleswere also dried by oven heating<strong>and</strong> were digested using the sameprocedure. Verification ofmethod reliability is accomplishedby the addition of sodiumspikes at varying concentrations.The precision of the resultsobtained from the modifiedprocedure is acceptable. However,the recovery of sodiumadded as a spike is consistentlydeficient. Before considering thisprocedure reliable, this anomalyshould be understood. Literatureresearch <strong>and</strong> additional testingare ongoing.Key accomplishments <strong>and</strong> milestones:• Literature research.• Collaborated with DuPont.• Continue testing the Ludoxusing different parameters forthe digestion procedure.Contact: W. Marshall (Wayne.Marshall-1@ksc.nasa.gov.), LO-G3-C,(407) 867-3910Participating Organizations: BoeingNorth American, Inc. (K. Marshall),DuPont (J. Ramsey), <strong>and</strong> LO-G3-C(D. Jackson <strong>and</strong> L. Wellington)58
<strong>Research</strong> <strong>and</strong> <strong>Technology</strong> <strong>1998</strong>Inductively Coupled Argon Plasma Spectrometer[Thermo Jarrell Ash Corporation (TJA 61E)]59
Materials ScienceRadiant Heating FacilityIn order to perform testing onThermal Protection System(TPS) materials, a facility isrequired to simulate a variety ofsurface-heating conditions. In thecase of a vehicle reentering theEarth’s atmosphere, the heatingtakes place under low atmosphericdensity conditions.Within the Materials ScienceLaboratory, there was a need tobuild a small chamber that couldbe used to simulate reentryheating on various types of TPSmaterials. It was decided tofabricate a small 18- by 18- by 8-inch chamber that could beplaced inside an existing altitudechamber. With assistance frompersonnel at Langley <strong>Research</strong>Center <strong>and</strong> Ames <strong>Research</strong>Center, a small chamber wasdesigned <strong>and</strong> fabricated. Thechamber uses 24 infrared heatinglamps to provide high surfaceheating to reach temperatures ofover 2,200 degrees Fahrenheit.The chamber enclosure is fabricatedpartially from fused silicawith a density of 24-pound-percubic-footmaterial provided bythe Shuttle TPS facility. A powercontroller <strong>and</strong> separate temperaturecontroller allow the user toselect a ramp rate for the heating.Separate controls for the altitudechamber control the pressure inthe radiant chamber duringheating operations.Key accomplishments:• The chamber was fully activated<strong>and</strong> tested to over 2,000degrees Fahrenheit.• Extensive waterproofingburnout support was providedto the Shuttle upgrade projectby looking at reducing the useof dimethylethoxysilane duringrewaterproofing in theOrbiter Processing Facility.Contacts: N.P. Salvail (Napoleon.Salvail-1@ksc.nasa.gov) <strong>and</strong> D.C. Lewis,LO-G3-T, (407) 867-1403Participating Organizations: United<strong>Space</strong> Alliance (M. Martin) <strong>and</strong> BoeingNorth American, Inc. (M. Gordon)60
<strong>Research</strong> <strong>and</strong> <strong>Technology</strong> <strong>1998</strong>X-33 Rocket System Fuel TankElectrostatic CoatingThe X-33 rocket program willdemonstrate the key design<strong>and</strong> operational aspects of asingle-stage-to-orbit reusablelaunch vehicle. The fuel <strong>and</strong>oxidizer tanks are covered by theouter vehicle shell. This designallows a small air space betweenthese tanks <strong>and</strong> the outer shell,thus allowing a potential buildupof fuel <strong>and</strong> oxygen vapors in thespace. Just prior to constructionof the first vehicle, it was discoveredthat these tanks were coveredwith an insulating foam thathad dangerous electrostaticproperties. A search <strong>and</strong> testingsequence was then implemented.The final result was the selectionof a lightweight electrostaticcoating for all fuel <strong>and</strong> oxygentanks that would neutralize thecharge buildup in this confinedspace.The coating is in an inaccessiblelocation. The first coatingmaterial chosen was a clear,permanent, lightweight antistaticcoating. However, further investigationrevealed the coating hadto survive an elevated temperatureduring reentry <strong>and</strong> surviveas many as 25 launches withoutmaintenance. These additionalrestraints proved hard to satisfy<strong>and</strong> resulted in the testing ofmany coatings by the MaterialsScience Laboratory before asatisfactory coating was found.The final coating consisted ofsmall foam beads coated withsilver <strong>and</strong> applied with an epoxybase. The testing proved theantistatic properties under thehigh temperatures <strong>and</strong> the numberof cycles required.Contacts: R. Gompf (Raymond.Gompf-1@ksc.nasa.gov), A. Finchum,<strong>and</strong> N. Salvail; LO-G3-T; (407) 867-461961
Materials ScienceAnalysis of Chloropel by Direct Pyrolysis/FTIRInfrared spectroscopy is wellrecognized as a powerful tool inthe characterization of a widevariety of materials includingpolymers, biological substances,<strong>and</strong> semiconductors. Uniqueinfrared spectra act as a molecularfingerprint for materials.However, the information obtainedusing traditional FourierTransform Infrared (FTIR) analysismay be limited when analyzingopaque, nonvolatile, <strong>and</strong>complex polymeric samples. Forexample, signal masking <strong>and</strong>interference may make it difficultto determine the composition ofindustrial polymer systemscontaining plasticizers, modifiers,<strong>and</strong> other additives.Thermogravimetric analysiswas used to design an appropriatetemperature profile. A heatingschedule of controlled rampingat 20 degrees Celsius perminute (°C/min) <strong>and</strong> isothermalholds at 290, 445, 700, <strong>and</strong> 900 °Cwas used to isolate characteristicpyrolysates.Infrared spectra obtainedfrom the neat material usinghigh-pressure anvil diamond cell<strong>and</strong> attenuated total reflectanceyielded very similar spectra.Characteristics matching those ofa polyester plasticizer typicallyfound in polyvinyl chloride orchlorinated polymeric materialsdominate the spectra.These interferences may beovercome by combining infraredspectroscopy <strong>and</strong> pyrolysis, thethermal degradation of a materialin an inert atmosphere. As thesample is pyrolyzed, the additionof thermal energy causes moleculesto fragment according tothe relative strength of bonds. Apyroprobe inserted into the FTIRinterface places the quartz boatsample cell a few millimetersbelow the infrared beam. Materialsevolved upon heating asample pass through the infraredbeam path <strong>and</strong> are detected.The utility of direct pyrolysis/FTIR in elucidating the compositionof a complex polymericmaterial was demonstrated. Thedegradation of chloropel, a polymericfabric used in protectivesuits for hazardous operations,was investigated.Pyrolysis/FTIR providedadditional information thatfacilitated the identification ofother components in the chloropelmaterial. The spectra ofmaterials evolved at 250 °C (seethe figure) showed the loss ofhydrochloric acid (HCl) concurrentlywith the polyester plasticizer.This is evident in thedistinctive HCl pattern of sharppeaks overlapping the hydrocarbonstretching between 2,560 <strong>and</strong>3,060 wave numbers (cm -1 ).Spectra of another evolvedspecies contained characteristicsindicative of polyethylene. Residueremaining at temperaturesabove 1,000 °C indicates thepresence of an inorganic additive.In this study, components thatwere masked in traditionalinfrared analysis were identified62
<strong>Research</strong> <strong>and</strong> <strong>Technology</strong> <strong>1998</strong>Polyester <strong>and</strong> HCl Pyrolysatesusing pyrolysis/FTIR. Chloropel was found to contain a chlorinated polyethlyene polymer,polyester plasticizer, <strong>and</strong> inorganic additive such as a coloring agent.Pyrolysis/FTIR was also used to study wire insulation that had significantly degraded<strong>and</strong> resulted in a failure. Pyrolysis/FTIR can provide valuable information intothe chemical composition <strong>and</strong> degradation process of polymeric <strong>and</strong> composite materials.Key accomplishments:• Developed method parameters for pyrolysis/FTIR using a pyroprobe.• Results indicate pyrolysis can be used to study the chemical composition <strong>and</strong> degradationprocess of polymeric materials.• This technique will be used in failure investigations <strong>and</strong> polymeric research.Contacts: M.K. Williams (Martha.Williams-1@ksc.nasa.gov) <strong>and</strong> J.J. Palou, LO-G3-C, (407) 867-3910Participating Organization: C.M. Bradford, NASA Scholar (Georgia Institute of <strong>Technology</strong> <strong>and</strong> SpelmanCollege)63
Materials ScienceHydrolytic Degradation of PolyimideWire InsulationPolyimide wire insulation haslong been the coating ofchoice because of its excellentelectrical, mechanical, <strong>and</strong> chemicalproperties. The most commonamong the wire insulations usedis the polyaromatic type that isroutinely synthesized by thereaction of pyromelliticdianhydride (PMDA) <strong>and</strong>oxydianiline (ODA). Investigationscarried out in the pastseveral years showed that thepolyimide class of wiring insulationswas the subject of muchdebate. Wiring problems wereencountered in the aircraft industrywhere it was found that theuse of alkaline cleaners in contactwith polyimide materials resultedin degradation of the coatings,thus resulting in fire hazards <strong>and</strong>electrical shorts.Laboratory tests conducted atKSC revealed that polyimide wirecoatings show degradation whenexposed to hydrazine fuel. Hydrazineis used as a part of thepropulsion systems <strong>and</strong> auxiliarypower units (APU’s). The APU’sare used to power the hydraulicsystem of the Shuttle <strong>and</strong> otherspace vehicles. The hydrazinefuel has the property of acting asboth an oxidizing agent <strong>and</strong> areducing agent. It is also a weakbase.The laboratory tests conductedat KSC included reactionsof polyimide with dinitrogentetroxide, aqueous ammonia (30percent), anhydrous ammonia(100 percent), <strong>and</strong> hydrazine fuel(100 percent). Fourier TransformInfrared (FTIR) analyses wereperformed on the wire testsamples before <strong>and</strong> after exposureto the chemicals. Except forthe dinitrogen tetroxide, a reactionproduct was observed on allother test specimens. The reactionproduct consisted of a yellowpowder. Polyimides undergohydrolytic degradation whenComparison of Virgin <strong>and</strong> Exposed Polyimide (Ascending Order)64
<strong>Research</strong> <strong>and</strong> <strong>Technology</strong> <strong>1998</strong>exposed to alkaline solutions, <strong>and</strong>the yellow powder formed ischaracteristic of this reaction.The postreaction FTIR analysisof the test specimens indicatesthe presence of two spectralb<strong>and</strong>s not observed in the virginpolyimide material (see thefigure). These b<strong>and</strong>s occur atapproximately 1,650 <strong>and</strong> 1,550cm -1 . Literature references indicatethe degradation products forthis type of reaction are cyclichydrazides <strong>and</strong> amines. Thespectral b<strong>and</strong>s observed thereforecorrespond to a carbonyl functionalgroup (1,650 cm -1 ) <strong>and</strong> theamine C-NH functionality (1,550cm -1 ).Each of the alkaline solventsexposed to the polyimide insulationsproduced the same reactionproduct; however, the hydrazinefuel reacted most vigorously. Thenext series of tests included onlythe hydrazine, but the test specimenswere exposed by direct- ordrip-type application, totalimmersion, <strong>and</strong> vapor exposure.Results showed all the polyimidecoatings reacted. After dissectingthe wire insulation, it was observedthat the hydrazine vaporseven penetrated the secondpolytetrafluoroethylene (PTFE)layer <strong>and</strong> also the subsequentpolyimide layers. The PTFE layerhad a thickness of 0.001 inch (anincreased thickness would serveas a better barrier).The aircraft industry is thoroughlyinvestigating this problemin light of recent accidents <strong>and</strong>because of the increased age ofmany of the aircraft still in service.As a result of degradationcaused by many alkaline cleanersused in the aircraft industry,several manufactures of polyimidematerials are now usingmore layers of PTFE <strong>and</strong> are alsosearching for new polymermaterials that can serve as chemicalbarriers (resistance to alkaline).Key accomplishments:• Data confirmed that exposureto hydrazine (<strong>and</strong> other alkalinechemicals) results in thedegradation of polyimideinsulation.• The volume of exposure <strong>and</strong>performance of insulationshould be addressed wheninvestigating possible polyimideinsulation failures.Contacts: J.J. Palou (Jaime.Palou-1@ksc.nasa.gov) <strong>and</strong> M.K. Williams,LO-G3-C, (407) 867-3910Participating Organizations: WiltechCorporation <strong>and</strong> Langley <strong>Research</strong>Center65
Materials ScienceEpoxy Bonding AgentsEpoxy resins are characteristicallystrong <strong>and</strong> resistant toheat, water, <strong>and</strong> organic solvents.It is for these reasons that epoxyresins are used in diverse applications,one of which is attachingstrain gages to stainless-steelbolts. Since epoxy resins arecapable of crosslinking withoutthe emission of volatile components,they are particularly suitedto application on imperviousmaterials such as stainless steel,aluminum, <strong>and</strong> glass, which canthen be bonded with little or nopressure.In an investigation involvinga strain gage attached to a stainless-steelbolt, erratic voltagereadings were observed. Visualinspection revealed the presenceof red liquid pockets in the epoxymaterial. The red liquid wasanalyzed by Fourier TransformInfrared (FTIR) spectroscopy formolecular composition <strong>and</strong> wasidentified as an uncured epoxymaterial. After removal of theepoxy from the top of the straingage, more uncured liquid wasfound next to the strain gagecircuit. Further analysis determinedthat the cure of the epoxymaterial was inhibited by moistureabsorption. Moisture increasesthe pH (more alkaline) ofthe epoxy’s curing agent. Thehigher pH can have corrosiveeffects on copper components,which along with electricalsupporting data suggested thefailure mode of the strain gage.Although there are severaltypes of epoxy bonding agentsavailable, this particular type is atwo-part system in which anamine is used to induce thecrosslinking/cure process.Amines are basic materials (pH isgreater than 7). The mixinginstructions for the epoxy statethat, after the amine curing agentis added, the epoxy should bemixed for 5 minutes <strong>and</strong> allowedan additional 5 minutes beforeapplying the epoxy. Simulationsof this application process in thelaboratory still indicated thepresence of uncured epoxy(confirmed by FTIR analysis).To evaluate the root cause ofthe curing problem <strong>and</strong> to identifyany interfering components,several tests were performed toassess the application process.Contamination from the flux(rosin) material used in solderingwas found to induce no adverseeffects (acidic pH was approximately6). However, as expected,when minute quantities of waterwere added, an inhibitory effecton the epoxy cure was observed.The application of the epoxyappeared to be most successful atroom temperature when theepoxy was mixed for 5 minutes<strong>and</strong> then applied after an additional10 to 15 minutes (may varywith the temperature <strong>and</strong> humidityof the room). The additionaltime allows for the crosslinkingprocess necessary to obtain a fullcure <strong>and</strong> decreases the interferenceof the moisture. The addi-66
<strong>Research</strong> <strong>and</strong> <strong>Technology</strong> <strong>1998</strong>Note: A similar chemical pattern is exhibited in the fingerprint region of each infrared spectrum.Comparison of Liquid Amine Curing Agent <strong>and</strong> Reddish Liquid Contaminant (Descending Order)tional time will ensure a good cure <strong>and</strong> still be within the shelf life stipulated bythe manufacturer. Another recommendation for the application process is to usea nitrogen purge.Key accomplishments:• Results suggested a failure mode for the strain gage.• Recommendation for improvements in the application of epoxy used for straingages.Contacts: M.K. Williams (Martha.Williams-1@ksc.nasa.gov) <strong>and</strong> J.J. Palou, LO-G3-C,(407) 867-3910Participating Organization: LO-G4-E (J.A. Bayliss)67
Materials ScienceCryogenic Insulation Systems for Soft VacuumAcryogenic insulation systemfor an operation under a softvacuum was developed at theKSC Cryogenics Test Laboratoryin <strong>1998</strong>. Conventional insulationmaterials for cryogenic applicationscan be divided into threelevels of thermal performance, interms of apparent thermal conductivity(k-value in mW/m-K).System k-values below 0.1 can beachieved for multilayer insulationoperating at a cold vacuumpressure (CVP) below 1x10 -4 torr.For fiberglass or powder operatingat a CVP below 1x10 -3 torr,k-values of about 2 are obtained.For foam <strong>and</strong> other materials atambient pressure, k-valuesaround 30 are typical. Newindustry <strong>and</strong> aerospace applicationsrequire a versatile, robust,low-cost thermal insulation withan overall performance in themoderate range. The target forthe new composite insulationsystem is a k-value below 3 mW/m-K at a soft vacuum level (from1 to 10 torr) <strong>and</strong> boundary temperaturesof approximately 77<strong>and</strong> 293 kelvin. Many combina-tions of radiation shields, spacers,<strong>and</strong> composite materials weretested from high vacuum toambient pressure using cryostatboiloff methods. System designconsiderations included installation,outgassing, evacuation,compression, <strong>and</strong> end effects. Asshown in the figure, significantimprovement over conventionalsystems in the soft vacuum rangewas demonstrated. The newlayered composite insulationsystem was also shown to providekey benefits for highvacuumapplications as well.Optimization of the insulationsystem for specific applications(such as liquid oxygen storage onMars, liquid nitrogen conduit forsuperconducting power lines,advanced launch vehicles, <strong>and</strong>Shuttle upgrades) is planned for1999.Contact: J.E. Fesmire (James.Fesmire-1@ksc.nasa.gov), MM-J2, (407) 867-7969Participating Organization: DynacsEngineering Co., Inc. (S. Augustynowicz)68
<strong>Research</strong> <strong>and</strong> <strong>Technology</strong> <strong>1998</strong>Thermal Conductivity as a Function of Cold Vacuum Pressure[Comparison of Layered Composite Insulation (LCI) <strong>and</strong> Multilayer Insulation (MLI)]69
Materials SciencePermanent Antistatic SCAPE Suit CoatingAresearch grant was given toBell<strong>and</strong> Corporation ofAndover, Maine, to develop aneasy-to-apply, permanent, clearantistatic coating. This coating isto be applied to the Self-ContainedAtmospheric Protective Ensemble(SCAPE) used during toxic fuelingoperations at KSC. The evaluationtesting is currently being done bythe electrostatics engineers of theMaterials Science Division (MSD).The SCAPE suits presentlyused for worker protection duringShuttle fueling operations areelectrostatically capable of generatingvoltages in excess of 20,000volts. This is a high voltage capableof producing catastrophicelectrostatic discharges. Thispotential was controlled in the pastwith an application of topicalantistatic spray. This solution hasseveral disadvantages. It is onlytemporary since the solution mustbe applied to the suit every hourduring work. There is an everpresentdanger if the antistaticmaterial is rubbed off during thework <strong>and</strong> there is some concernabout exposure to the spray duringapplication. If a worker becomesinjured, the ability of the rescueteam to remove the injuredworker is difficult due to the slicknature of the spray. The potentialhazard of not using this spraywas clearly demonstrated in aprevious incident where a smallfuel fire was ignited duringOrbiter Processing Facility operationsin the Orbital ManeuveringSubsystem pods. An electrostaticdischarge from the uncoated suitmaterial was the most probablecause of the fire.Test results of one promisingversion of the coating reduced themaximum suit voltage generationfrom above 20,000 volts to below1,000 volts. At this time, thetesting is concentrating on theadhesive properties <strong>and</strong> thechemical compatibility with avariety of fuels <strong>and</strong> chemicals.These test results are encouraging,<strong>and</strong> the coating seems toimprove the suit protection forcertain fuels.Contacts: R. Gompf (Raymond.Gompf-1@ksc.nasa.gov,) LO-G3-T, (407) 867-4619; M. Parenti, LO-G3-T, (407) 867-8433; <strong>and</strong> N. Salvail, LO-G3-T,(407) 867-140470
<strong>Research</strong> <strong>and</strong> <strong>Technology</strong> <strong>1998</strong>NondestructiveEvaluationThe Nondestructive Evaluation (NDE)<strong>Technology</strong> program at the John F.<strong>Kennedy</strong> <strong>Space</strong> Center (KSC) includesthe development of inspection <strong>and</strong> verificationinstruments <strong>and</strong> techniques that canprovide information (external or internal) tohardware <strong>and</strong> component structures in anonintrusive manner. The technologyincludes, but is not limited to, laser, infrared,microwave, acoustic, structured light,other sensing techniques, <strong>and</strong> computer <strong>and</strong>software systems needed to support theinspection tools <strong>and</strong> methods.The present effort in this discipline is beingdirected toward reducing Shuttle processingcosts using these technologies. The longtermeffort of the program is to developcost-effective NDE techniques for inspecting<strong>and</strong> verifying space vehicles <strong>and</strong> theircomponents during manufacture <strong>and</strong> tocontinue validating those items duringassembly/launch <strong>and</strong> on-orbit or duringspace flight.71
Nondestructive EvaluationCondition Monitoring <strong>and</strong> Fault Identificationin Rotating Machinery (CONFIRM)Loading of the <strong>Space</strong> Shuttleexternal tank with liquidoxygen is accomplished via apump/motor/bearing assemblylocated at the northwest corner ofLaunch Complex 39. Since theassemblage is vital to the successof any mission, it is continuouslymonitored to detect, identify, <strong>and</strong>assess its condition <strong>and</strong> takeappropriate actions to minimizethe impact on launch. Conditionor health monitoring technologiesthat are being considered for usefall into two major categories:Mechanical Vibration SignatureAnalysis (MVSA) <strong>and</strong> MotorCurrent Signature Analysis(MCSA). Also, the AcousticEmission (AE) technique <strong>and</strong> aLube-Oil Analysis (LOA) will beused as early warning tools forpredicting impending failures.Mechanical, electrical, <strong>and</strong> flowinducedproblems will be addressedin this multiyear researchprogram.The present effort is directedtoward the installation of apump/motor/bearing assemblageat the Launch EquipmentTest Facility (LETF) to simulateLaunch Complex 39. This setupwill provide a test bed for research<strong>and</strong> development, testingof variable frequency drives, <strong>and</strong>h<strong>and</strong>s-on training for launch padpersonnel. The assemblage willserve as a platform for the evaluationof newer online condition/health monitoring technologies.Such online machinery monitoringwill lead to improvements inoperational efficiency, eliminateshutdowns, reduce maintenancecosts, <strong>and</strong> prevent catastrophicfailures. Early detection <strong>and</strong>correction of impending failureswill significantly improve reliabilitywhile enhancing safety.Key accomplishments:• <strong>1998</strong>: Implemented the liquidoxygen pump assemblage atthe LETF. Validated the use ofAE, MVSA, <strong>and</strong> MCSA techniquesin identifying rotatingmachinery defects.Key milestones:• 1999: Assess condition monitoringtechnologies <strong>and</strong> variablefrequency drives on the300-horsepower pump assemblage.Additionally, validatethe MCSA technique <strong>and</strong>coordinate with MVSA methods.Contact: A.F. Rodriguez (Andres.Rodriguez-1@ksc.nasa.gov), MM-J2,(407) 867-7969Participating Organizations: DynacsEngineering Co., Inc. (R.N. Margasahayam<strong>and</strong> M.J. Ynclan) <strong>and</strong>Information Dynamics, Inc. (L. Albright<strong>and</strong> O. Varosi)72
<strong>Research</strong> <strong>and</strong> <strong>Technology</strong> <strong>1998</strong>MotorPumpVibrationSensorAcousticEmissionSensorWater LoopSimulated LETF Water Pump Motor Facility73
Nondestructive EvaluationEvolved Expendable Launch Vehicle (EELV)Hydrogen TestingThis report describes the equipment, procedures, <strong>and</strong> qualificationtesting to be used to evaluatethe mixing of hydrogen <strong>and</strong>oxygen in the simulated plume ofthe EELV RS-68 engine. TheEELV engine is similar to theShuttle engine, which uses hydrogenas the fuel <strong>and</strong> oxygen as theoxidizer. These engines start theflow of hydrogen before oxygenis added during the launchsequence, <strong>and</strong> the oxygen flowstops before hydrogen upon shutdown. Both of these situationsleave hydrogen, which must beburned off before the area is safe.Therefore, this excess hydrogenmust be burned in a manner thatprecludes detonation. The procedureis to entrain oxygen from airin hydrogen to provide a combustiblemixture, then to ignite thismixture so a controlled burnoccurs.The primary objective of thistest program is to qualify acombustion ignition system thatwould burn hydrogen from anaborted launch. To simulate thefiring of the EELV engine, nitrogenwill be released into a 1/7-scale flame trench. These releaseswill last 0.7 second <strong>and</strong> willinclude hydrogen combustion aspart of the simulation. Thisproject has three phases: Phase 1requires analysis of ambientoxygen in nitrogen, Phase 2requires analysis of hydrogenadded to ambient oxygen innitrogen, <strong>and</strong> Phase 3 requiresanalysis of hydrogen burningwith ambient oxygen in nitrogen.To make these measurements,grab-samples of the atmospherewill be collected just beforerelease, during release, <strong>and</strong> justafter release. The sampler (seefigure 1) is constructed of sectionsof tubing linked between valvesso the flow rate of the samplematches the total tubing length.Therefore, each section representsa time history of the concentrationof the gases as they pass thesample inlet. The contents of thesample tubes will be analyzed bygas chromatography, a methodSample InSample OutSample TubesValvesPumpSample TubesSample FlowExhaust DuctFigure 1. Sampling Setup for One Point of Six Sample Points Across the Exhaust Duct74
<strong>Research</strong> <strong>and</strong> <strong>Technology</strong> <strong>1998</strong>Figure 2. Sampling System With EELV Test Simulation Equipmentthat can measure the concentrationof each gas at 0.2percent.The sampling systemseen in figure 2 shows thesample lines, valves, <strong>and</strong>sequencer that times theopening <strong>and</strong> closing of thevalves which separate thesamples. The procedure tobe used will clamp thesample tubing on either sideof the valves to isolate thesample. This will allow a fastturnaround of the samplingsystem, since it will onlyrequire replacing the sampletubes with new precuttubing. The samples in thetubes can be analyzed by agas chromatograph independentlyof the EELV testing.Key accomplishments:• Developed a method to measurethe concentration profileas a function of time duringEELV testing.• Designed <strong>and</strong> produced sixunits to capture the testsamples.• Developed the sample introductionsystem for the gaschromatograph.• Demonstrated that the methodcould measure the concentrationof oxygen <strong>and</strong> hydrogen toless than 1 percent in nitrogen.Contacts: R.C. Young (Rebecca.Young-1@ksc.nasa.gov) <strong>and</strong> D.E. Lueck, MM-G2 (407) 867-4439Participating Organization: DynacsEngineering Co., Inc. (C.F. Parrish, C.J.Schwindt, T.R. Hodge, <strong>and</strong> P.H. Gamble)75
Nondestructive EvaluationThermography for Nondestructive Evaluation<strong>and</strong> Laser ShearographyNASA, United <strong>Space</strong> Alliance,Boeing North American, Inc.,<strong>and</strong> Dynacs Engineering Co., Inc.,engineers <strong>and</strong> scientists performedshearography <strong>and</strong> thermographyinspection of Atlantis(OV-104) payload bay doors atPalmdale, California. The payloadbay door structure is composedmostly of graphite-epoxyhoneycomb <strong>and</strong> laminate. Noexisting inspection can adequatelyinspect this compositestructure. Two new techniques,shearography <strong>and</strong> thermography,were used to inspect about 70percent of the structure shell in 7working days (one shift). Bothtechniques worked well regardingthe rate of inspection <strong>and</strong>sensitivity. Several defects weredetected, most resulting frommaintenance-induced damage.All suspect defects were corroboratedwith ultrasonic inspectionbefore defining any repair.These results are a continuingeffort at KSC to develop a reliableinspection method for composites.Two other vehicles, Discovery(OV-103) <strong>and</strong> Endeavour (OV-105), have had similar inspectionswith good results. Boeing haswritten specifications certifyingthese techniques for use on theShuttle.Future actions include developingthe sensitivity <strong>and</strong> accuracyof each technique in variousapplications, developing operatorprocedures <strong>and</strong> certification, <strong>and</strong>extending the applications toother areas including the externaltank <strong>and</strong> solid rocket boosterthermal protection system <strong>and</strong>leak visualization.Key accomplishments:• 1996: Discovery payload baydoor inspection.• 1997: Endeavour payload baydoor inspections <strong>and</strong> shearography<strong>and</strong> thermographyspecifications published.• <strong>1998</strong>: Revised shearography<strong>and</strong> thermography specificationsto include a generalprocedure. Atlantis payloadbay door inspection.Key milestone:• 1999: Probability of detectioncurves for the most commoncomposites for the orbiter.Contact: C.K. Davis (Christopher.Davis-1@ksc.nasa.gov), PK-H, (407)861-3636Participating Organizations: United<strong>Space</strong> Alliance (K.R. Wagner), BoeingNorth American, Inc. (A.M. Koshti),<strong>and</strong> Dynacs Engineering Co., Inc.(J. Donahue)76
<strong>Research</strong> <strong>and</strong> <strong>Technology</strong> <strong>1998</strong>Process/IndustrialEngineeringNASA’s <strong>Kennedy</strong> <strong>Space</strong> Center (KSC) is developingas a world-class spaceport technologycenter. Process/industrial engineering technologiesare integral spaceport technologies. From aprocess or industrial engineering (IE) perspective,the facilities used for flight hardware processing atKSC are NASA’s premier factories. The products ofthese factories are among the most spectacularproducts in the world – safe, successful Shuttle <strong>and</strong> expendable vehicle launches carrying tremendouspayloads. The factory is also the traditional domain of the discipline of IE. IE is different in manyways from other engineering disciplines because it is devoted to process design, management, <strong>and</strong>improvement, rather than product design. IE also emphasizes the relationships of workers withsystems <strong>and</strong> processes. <strong>Space</strong>port processes have many unique aspects that require development ofinnovative IE technologies, such as complex <strong>and</strong> risky depot-level maintenance processes, highperformancesystem test <strong>and</strong> checkout procedures, <strong>and</strong> low-volume manufacturing processes.Process/industrial engineering technologies address the generic challenge of “doing more with less.”IE is typically used to optimize the operational phase of a program. IE technologies introduced earlyin the program life cycle (during concept, design, <strong>and</strong> development phases) generally deliver outst<strong>and</strong>ingresults. The <strong>Space</strong> Shuttle is NASA’s first major program with a long-term operationalphase, <strong>and</strong> many current <strong>and</strong> potential future programs (i.e., the International <strong>Space</strong> Station, X-vehicles,<strong>and</strong> human space flight to Mars) also are projected to have lengthy operational phases. Therefore,the strategic importance of process/industrial engineering research <strong>and</strong> technology developmentto NASA is rapidly increasing.Technologies include methods, tools, techniques, <strong>and</strong> processes as well as hardware <strong>and</strong> software.Most IE technologies evolved from the need to improve shop floor productivity. IE technologies arenow successfully used to design <strong>and</strong> enhance every type of process in Government agencies, productionindustries, service industries, <strong>and</strong> academia. Therefore, spaceport process/industrial engineeringtechnologies can be effectively transferred to a variety of additional organizations.The growing need to do things better, faster, cheaper, <strong>and</strong> safer has improved the potential value ofprocess/industrial engineering technologies. The articles in this section are divided into five interrelatedareas of process/industrial engineering: Management Support Systems, Human Factors Engineering,Work Methods <strong>and</strong> Measurement, General IE, <strong>and</strong> Process Modeling <strong>and</strong> Analysis. Yourfeedback to the contacts listed in these articles is appreciated.77
Process/Industrial EngineeringManagement Support Systems:Goal Performance Evaluation SystemIn 1993, Congress passed theGovernment Performance <strong>and</strong>Results Act. A key requirement ofthis legislation is that all Federalagencies develop strategic plans.A 1997 Congressional reportgraded the strategic plans thatwere submitted. The reportnoted that agencies failed toexplain how their goals linked totheir day-to-day operations <strong>and</strong>to each individual employee’sperformance plans/appraisals.NASA’s Strategic Plan statesthat each NASA Center ImplementationPlan should be “…thecommunication tool used toenable the Center’s customers tosee that their requirements arebeing addressed <strong>and</strong> to ensurethat employees underst<strong>and</strong> theircontribution to the highest levelstrategies <strong>and</strong> objectives ofNASA. The final linkage is madethrough each individual’s performanceplan appraisal” (fromNASA Strategic ManagementH<strong>and</strong>book, October 1996). TheGoal Performance EvaluationSystem (GPES) was developed tomake this “final linkage” to bringthe NASA Center ImplementationPlan to the employee <strong>and</strong> toencourage strategic linking <strong>and</strong>implementation at every level inthe organization.The potential for this researchwas to address the execution ofan agency’s strategic plan. Ultimately,the employees of anorganization are responsible forthe action planning, task execution,<strong>and</strong> accomplishments oftheir organization. However, fewtools exist that accommodatethese objectives or that focus onthe specific needs of a Federalagency. The GPES was developedto aid NASA in implementingthe Vision <strong>and</strong> StrategicObjectives outlined in the Agencyplan.The GPES was developed as aWeb-based strategic planning toolused for planning, managing, <strong>and</strong>evaluating employee contributionsto NASA Center <strong>and</strong> NASAwidestrategic objectives. Eachemployee performance plancontains objectives <strong>and</strong> strategiesderived from directorate-levelgoals <strong>and</strong> objectives. All directorateobjectives are electronicallyavailable in the GPES, includingthe links to higher level goals.The supervisor defines employeeperformance by selecting objectives<strong>and</strong> strategies from a “dropdown” menu. Since the supervisorno longer has to write jobelements <strong>and</strong> performance requirementsfor every employee,the supervisor can focus onindividual goals. Employees canenter their achievements <strong>and</strong>track them throughout the year.Status reports are available at thedirectorate <strong>and</strong> Center levels.The GPES tracks the linksfrom directorate mission objectives<strong>and</strong> mission strategies toAgency <strong>and</strong> Center strategies <strong>and</strong>links from individual performanceobjectives to directorateobjectives <strong>and</strong> strategies. Metricsare maintained for status ofperformance plans, links toobjectives <strong>and</strong> strategies, systemutilization, performance indicators,<strong>and</strong> the number of WorldWide Web accesses to relatedpromotional banners of interest toemployees.The GPES is fully operationalat KSC <strong>and</strong> is being used for the<strong>1998</strong>/99 employee appraisalperiod. The GPES was presented<strong>and</strong> well received by all NASACenter Directors <strong>and</strong> the NASAAdministrator <strong>and</strong> is currentlybeing implemented at Johnson<strong>Space</strong> Center (JSC). The GPESsoftware continues to be enhancedwith additional features,such as:• Supervisor safety <strong>and</strong> healthmetrics (via an automatedpoint system)• Supervisor 360 assessmentfeature• Online performance award/evaluation• Online collection of communityoutreach activities for employeesKey accomplishments:• <strong>1998</strong>: Successfully developed<strong>and</strong> implemented the WebbasedGPES for all Civil Servantsat KSC <strong>and</strong> implementedthe GPES for all Civil Servantsat JSC.Key milestone:• 1999: Continue deployment ofthe GPES to other Manned<strong>Space</strong> Flight Centers.78
<strong>Research</strong> <strong>and</strong> <strong>Technology</strong> <strong>1998</strong>COMMAND CENTERMANAGEMENTDefine Performance PlansConduct AppraisalPerformance AwardsOffice SummaryPerformance IndicatorsLeadership GuidePERFORMANCEInput Status & ActionsCenter Support LogEmployee <strong>Report</strong>sManage StrategiesSYSTEMChange PasswordHELPLogoffGPES Comm<strong>and</strong> Center Menu:• Automates the employee performance appraisalprocess, from planning through appraisal.• Provides a direct link between overallorganization/directorate strategic plans <strong>and</strong>employee performance.• Integrates business goals <strong>and</strong> objectives withdaily work processes.• Provides centralized data for summaryevaluation of organizational objectives.• Aligns resources toward successful achievementof overall goals/mission.• Affects behavior toward strategic thinking <strong>and</strong>implementation.Beneficial software design attributes include:• Easy customization.• Intuitive graphical user interface.• Web-based or intranet application.• Integrated application using off-the-shelf tools.Contacts: C.J. Carlson (Christopher.Carlson-1@ksc.nasa.gov), ST-B, (407) 867-6450; J.C. Kunz,ST-B, (407) 867-6411; <strong>and</strong> L.B. Roe, ST-B, (407) 867-647279
Process/Industrial EngineeringManagement Support Systems: OrganizationalChange Models for Strategic ManagementStrategicPlanningGovernment organizations, asis the case with privateorganizations, are being requiredto change their present operationsto align with the ever-changingenvironment. Often this changeneed leads to a large-scale transformationincluding a change inmission or core business. Withthe change in mission, the organizationmust also change themanner in which it completes itscore business (i.e., the processes,tools, <strong>and</strong> people). One of thefirst steps in achieving successfulchange <strong>and</strong> transformation is tocreate a vision of the future.Strategic management has beenoffered as a method to driveorganizational change. Strategicmanagement is a continuousprocess aimed at aligning everydayactions with the long-termdirection of the organizationbased on the needs of the customer.An organization can usestrategic management to achievea set of strategic thinking outcomes<strong>and</strong> produce a set ofproducts to move the organizationforward. The objective ofthis research is to underst<strong>and</strong> <strong>and</strong>demonstrate the use of the strategicmanagement process to drivelarge-scale transformation.As shown in the figure, theprocess of strategic managementincludes the functions of strategicplanning, implementation planning,execution, <strong>and</strong> performanceevaluation. KSC used this processto develop a set of products:a strategic direction, projectplans, an initial set of performancemeasures, strategic results,<strong>and</strong> lessons learned.Strategic planning is a groupprocess by which the organizationdefines or refines theorganization’s mission (corebusiness statement), vision (idealfuture state), goals, <strong>and</strong> objectives.The process involvesunderst<strong>and</strong>ing both the internal<strong>and</strong> external environments (e.g.,strengths, weaknesses, opportunities,threats, etc.). The output ofstrategic planning is an integratedset of goals, objectives, strategies,<strong>and</strong> projects to improve performance.PerformanceEvaluationCustomerSatisfactionExecutionStrategic Management ProcessImplementationPlanningFor KSC, the strategic planningprocess focused on defininga strategic direction with productsof a future state, core business,<strong>and</strong> strategic roadmap. TheCenter Director shared the messagevia a KSC-wide rolloutprocess he presented at an allh<strong>and</strong>smeeting <strong>and</strong> then visitedwith each directorate at KSC. TheStrategic Plan became real80
<strong>Research</strong> <strong>and</strong> <strong>Technology</strong> <strong>1998</strong>through the implementationplanning process.Implementation planning isthe process by which the organizationdevelops specific strategiesor actions to implement thestrategic direction <strong>and</strong> defines thespecific measures of performancethat will determine the progressof the planned actions. Implementationplanning provides thedetailed performance planning<strong>and</strong> proposed resource allocationto implement the Strategic Plan.An organization uses the implementationplan to guide day-todaybehavior or execution. Executionis the carrying out of theimplementation plan.Performance evaluation is theprocess by which the organizationunderst<strong>and</strong>s the impacts ofthe projects on the goals <strong>and</strong>objectives. The use of performancemeasurement <strong>and</strong> evaluationcreates tangible results thatcan be studied to produce lessonslearned <strong>and</strong> recommendations onhow to improve the organization<strong>and</strong> adjust the Strategic Plan.The customer satisfactionprocess is the foundation for thestrategic management process byproviding information <strong>and</strong> knowledgeabout how KSC can meet <strong>and</strong>exceed customer needs.Key accomplishments:• 1997: Conducted an internal <strong>and</strong>external research study on thesuccess factors for strategicmanagement.• <strong>1998</strong>: Conducted a cycle ofstrategic management with KSC.Key milestones:• 1999: Refinement of a set ofprocesses <strong>and</strong> integrated schedulefor strategic management.Development of a best-practicesmodel for deploying strategicmanagement.Contact: J.W. Lyons (Jennifer.Lyons-1@ksc.nasa.gov), AG, (407) 867-2512Participating Organization: University ofCentral Florida (T. Kotnour, Ph.D.)81
Process/Industrial EngineeringManagement Support Systems: MethodologyTo Harvest Intellectual Property at KSCInformation <strong>and</strong> data obtainedthrough problemsolving <strong>and</strong>decisionmaking can be convertedinto intellectual capital. The needto acquire intellectual capitalcreated the knowledge managementmovement, which aims todevelop new practices <strong>and</strong> toolsto capture knowledge. Knowledgemanagement in general triesto organize <strong>and</strong> make availableimportant know-how, wherever<strong>and</strong> whenever it is needed. Thisincludes processes, procedures,patents, reference works, formulas,“best practices,” forecasts,<strong>and</strong> fixes. One kind of knowledgemanagement project attemptsto manage knowledgeassets from a financial perspective.KSC’s focus on this projectis on intellectual capital <strong>and</strong>harvesting little-used patents <strong>and</strong>intellectual assets. As the Centerresponsible for preparing <strong>and</strong>launching space missions, KSC isplacing increasing emphasis onits technology developmentprogram. KSC maintains avigorous applied research programin support of Shuttle launchactivities. Ground supportsystems, launch <strong>and</strong> processingfacilities, <strong>and</strong> environmentalprotection all require continuedattention for KSC to remain theNation’s premier state-of-the-artspaceport. Focusing predominantlyon applied researchprompted KSC to develop newtechnologies <strong>and</strong> expertise directlyapplicable to commercialproducts <strong>and</strong> manufacturingneeds.<strong>Technology</strong> commercializationis a primary goal of NASA’s<strong>Technology</strong> Transfer Program.Patent <strong>and</strong> copyright licensingsare key mechanisms to accomplishthis goal. In order forNASA to continue to increase thenumber of successfully commercializedtechnologies, NASA mustidentify commercial applicationsfor its new technology <strong>and</strong> effectivelyseek out commercializationpartners.Key accomplishments:• 1997 <strong>and</strong> <strong>1998</strong>: Alternativecommercial applications wereidentified for 11 KSC-developedtechnologies. Fourtechnologies were analyzed inthe last half of 1997 <strong>and</strong> sevenin the first three-quarters of<strong>1998</strong>. These advanced technologydevelopment projects havebeen proposed, are currentlyunder development at KSC,have been completely developed,or have already receivedintellectual property protection.Potential markets associatedwith the new applicationswere investigated, whichprovided profiles of key companiesthat may be interestedin partnering with NASA. Thecurrent state of similar or1201011101079710078Potential Markets80604015 1238225236200TDPCBPFMLAMSRMASSGLCSTAGMAPSECABLDPGPUFSHFDCUTechnologiesPotential Markets82
<strong>Research</strong> <strong>and</strong> <strong>Technology</strong> <strong>1998</strong>applicable commercially available technology <strong>and</strong> potential fordual-use development with industry was investigated. Assistancein identifying <strong>and</strong> characterizing qualified leads associated withcommercializing NASA technologies was provided. Companieswere categorized primarily on the basis of capabilities, interests,<strong>and</strong> areas of expertise. A comprehensive report containing a synopsisof each advanced technology project as well as a review ofpossible partners <strong>and</strong> applicable commercially available technologieswas prepared. KSC was provided with 668 leads for potentialcommercialization partners <strong>and</strong> 110 new potential uses for thefollowing technologies (the figures show detailed information of thenew uses <strong>and</strong> potential commercialization partners):- Environmentally Controlled Abrasive Blastsuit (ECAB)- Hydrogen Fire Detector Calibration Unit (HFDCU)- Liquid Air Mixing System (LAMS)- Low Differential Pressure Generator (LDPG)- Mapping Analysis <strong>and</strong> Planning System (MAPS)- Particle Fallout Monitoring System (PFM)- Portable Ultraviolet Flame Simulator (PUFS)- Remote Monitoring <strong>and</strong> Alarm System (RMAS)- Supersonic Gas-Liquid Cleaning System (SGLCS)- Test Aerosol Generator (TAG)- Turbine-Driven Pipe-Cleaning Brush (TDPCB)Key milestone:• 1999: Ongoing identification ofalternative commercial applicationsfor additional NASAdevelopedtechnologies.Contact: G.A. Buckingham (Gregg.Buckingham-1@ksc.nasa.gov), HM-CIC,(407) 867-7952Participating Organizations: NASA<strong>Technology</strong> Programs <strong>and</strong> CommercializationOffice (K.W. Poimboeuf <strong>and</strong>D. Makufka) <strong>and</strong> Florida InternationalUniversity (I. Becerra-Fern<strong>and</strong>ez)2522201515“New” Uses1510107106596550TDPCBPFMLAMSRMASSGLCSTAGMAPSECABLDPGPUFSHFDCUTechnologies“New” <strong>Technology</strong> Uses83
Process/Industrial EngineeringManagement Support Systems:KSC Customer Focus Process DevelopmentAs part of the KSC Strategic Roadmap, customer satisfactionhas been identified to be both an objective <strong>and</strong> a strategy.These customer satisfaction objectives <strong>and</strong> strategies will supportthe Center’s vision <strong>and</strong> will help in achieving KSC’s statedgoal as the worldwide launch site of choice. The objectives <strong>and</strong>strategies will also drive improvements in KSC’s core capabilitiesby addressing the tools, expertise, facilities, <strong>and</strong> business processesthat support the customer. To address these customersatisfaction objectives <strong>and</strong> strategies, research was conducted incustomer satisfaction, which included customer elements fromthe Baldrige award criteria <strong>and</strong> President’s Quality Award.Based on the research, a customer focus model was developed(see the figure). The model delineates a six-element scopedefined as follows:1. Customer Knowledge: This element defines <strong>and</strong> segmentscurrent <strong>and</strong> potential strategic customers <strong>and</strong> identifies theirneeds, with additional information gathered regarding theirrequirements, expectations, <strong>and</strong> critical success factors.2. Customer Satisfaction Determination Tools <strong>and</strong> Methods:These processes include collecting feedback from multipletypes of methods over the duration of the customer experienceat KSC, feeding that information back to the appropriateorganizations, using the information to drive improvementprojects, <strong>and</strong> reporting the improvements back to the customer.3. Benchmark Best Practices: Benchmarking becomes an ongoingprocess of seeking out continual improvements in both thepractices <strong>and</strong> processes of improving customer satisfaction.4. Customer Satisfaction Leadership: This element uses theprevious element results to create a customerkeeping vision,to saturate KSC with the voice of the customer, <strong>and</strong> to developperformance expectations related to customer focus.5. Relationship Management: Relationship management usesprocesses for interfacing <strong>and</strong> supporting the customer tomaximize customer loyalty <strong>and</strong> retention <strong>and</strong> analyzes complaints<strong>and</strong> lost customers.6. Customer Satisfaction Improvement <strong>and</strong> Results: This elementdevelops <strong>and</strong> tracks customer service st<strong>and</strong>ards basedon outcomes from the previous elements, including customersatisfaction metrics <strong>and</strong> customer business results for KSC.This model is being used as theblueprint to develop <strong>and</strong> implementprocesses <strong>and</strong> leadership fora customer-driven KSC. Onceimplemented, the results of theprocesses will be used as an integralcomponent of the Center’sstrategic planning efforts.Key accomplishments:• <strong>1998</strong>: KSC customer baseidentified <strong>and</strong> segmented.Surveyed KSC management forperceived barriers <strong>and</strong> enablersof customer satisfaction. Completeda test case for the firstsegment for customer satisfactiondetermination. <strong>Report</strong>edthe test case results to seniormanagement <strong>and</strong> to thosecustomers interviewed.Key milestones:• 1999: Determine customersatisfaction baseline for allsegments. Refine processes forall customer focus elements.Develop an Integrated ManagementSystem to assimilatecustomer data. Train KSCemployees for customer awareness<strong>and</strong> underst<strong>and</strong>ing ofcustomer processes.• 2000: Implement the IntegratedManagement System. Establish<strong>and</strong> use processes for ongoingcustomer satisfaction measurement.Contact: L.K. Buckles (Linda.Buckles-1@ksc.nasa.gov), AG, (407) 867-2512Participating Organizations: Universityof Central Florida (J. Matkovich <strong>and</strong>T. Kotnour) <strong>and</strong> the KSC Customer FocusTeam (NASA, United <strong>Space</strong> Alliance, <strong>and</strong>Boeing)84
<strong>Research</strong> <strong>and</strong> <strong>Technology</strong> <strong>1998</strong>CustomerFocus Model2.CustomerSatisfactionDeterminationTools <strong>and</strong> Methods4.CustomerSatisfactionLeadership1.CustomerKnowledge• Develop tools/surveys formeasuring customersatisfaction• Drive improvement• <strong>Report</strong> to customer• Create a customerkeepingvision• Saturate KSC with thevoice of the customer• Develop performanceexpectations• Customer satisfactionreviews6.CustomerSatisfactionImprovement<strong>and</strong> Results• Determine existing <strong>and</strong>future strategic customerbase• Determine critical successfactors in meetingcustomer expectations3.BenchmarkBest Practices• Determine benchmarkcriteria• Learn from bestpractices5.RelationshipManagement• Interface issues with thecustomer• Implement a complaintmanagement process• Develop customer loyaltyprocesses• Lost customer analysis• Customer satisfactionmeasurement• Implementation projects• Customer satisfactionprocess improvements• Customer satisfactionPresident's Quality Award• Exp<strong>and</strong>ing the customerbase85
Process/Industrial EngineeringManagement Support Systems:Balanced Scorecard MetricsDue to the requirements of theGovernment Performance<strong>and</strong> Results Act of 1993, whichwas designed to improve theaccountability of Federal agencies,<strong>and</strong> to KSC’s commitment tomanage strategically, selectedindicators with performancetargets were needed to evaluatethe Center’s performance. TheKSC Strategic Roadmap had beendeveloped; however, to bring theroadmap to life, measures wereneeded to determine if thestrategy was being implemented<strong>and</strong> getting results. A lessonlearned from the National PerformanceReview study on metricssuggested that a specific frameworkshould be defined to developmeasures of organizationperformance.A team representing all areasof the Center was formed toanalyze the existing strategy <strong>and</strong>to underst<strong>and</strong> the expectedoutcomes from implementingKSC’s strategy. A review of theliterature on organizationalmeasurement systems <strong>and</strong> inputfrom experts was balanced withKSC corporate knowledge ofcurrent operations. Small groupswere used to facilitate inspectionof the category functional areas.The Agency, enterprises, <strong>and</strong>Center management were viewedas customers of the process.Seventeen high-level indicatorsthat were balanced between near-term <strong>and</strong> long-term outcomeswere selected. These metrics mapto Agency <strong>and</strong> Center goals <strong>and</strong>form the KSC balanced scorecard.As each high-level metric isdeveloped, it will be added to thechampion organization’s Web site<strong>and</strong> linked to the KSC BusinessWorld Scorecard. The scorecardwill be reviewed each quarter atan executive management review.A “drill down” to lower levelmetrics that track to root cause/individual contributors will beadded. Each organization will betasked to define a “balancedscorecard” related to its products<strong>and</strong> services.Key accomplishments:• November 1997: Senior managersreviewed each strategy inthe KSC Roadmap <strong>and</strong> attemptedto further define themwith metrics.• December 1997: 187 metricswere identified, at least one foreach strategy <strong>and</strong> objective ofthe KSC Roadmap.• January <strong>1998</strong>: A team wasformed to refine the indicatorsfor consistency <strong>and</strong> linkage.• March <strong>1998</strong>: The team beganto define a framework/approachfor KSC metrics.• April <strong>1998</strong>: Roadmap indicatorswere grouped into eightcategories <strong>and</strong> evaluated tobalance across the Kaplan <strong>and</strong>Norton model.• May <strong>1998</strong>: The Center Directorintroduced the KSC Scorecardat a Strategy Update Briefing toall employees.86
<strong>Research</strong> <strong>and</strong> <strong>Technology</strong> <strong>1998</strong>Vision <strong>and</strong> Strategy Framework MetricsNot Met80706050403020Sample MetricMilestones Not MetGoalDefinitionMetric AreaLinkage toStrategic E100JAN FEB MAR APR MAY JUN JUL AUG SEP OCT NOV DECPlannedImprovementNot Met80706050403020Sample MetricMilestones Not MetGoalDefinitionMetric AreaLinkage toStrategic E100JAN FEB MAR APR MAY JUN JUL AUG SEP OCT NOV DECPlannedImprovementNot Met80706050403020Sample MetricMilestones Not MetGoalDefinitionMetric AreaLinkage toStrategic E100JAN FEB MAR APR MAY JUN JUL AUG SEP OCT NOV DECPlannedImprovementNot Met80706050403020Sample MetricMilestones Not MetGoalDefinitionMetric AreaLinkage toStrategic E• NASA Programs• Enterprises• Customer Agreements• Support Agreement100JAN FEB MAR APR MAY JUN JUL AUG SEP OCT NOV DECPlannedImprovementKSC Organizational Performance Measurement Structure• August <strong>1998</strong>: Top-level indicators were selected for each scorecard category.• October <strong>1998</strong>: Directorates were selected to champion each top-level metric.• November <strong>1998</strong>: The KSC Scorecard was added to the Business World Web site with place holders foreach metric chart.Key milestone:• February 1999: A Center Performance Review was made using KSC Scorecard metrics.Contact: M.A. Bell (Michael.Bell-2@.ksc.nasa.gov), AG, (407) 867-2512Participating Organizations on the KSC Metrics Integrated Product Team: AF-A (G. Swanson), AB-G2 (D. Armstrong), AI(R. Sharum), BC (L. Buckles), EC-C (R. Tilley), EY-B-PA (B. Monson), FF-D1-A (R. Ponik), FF-I3-A (M. Steele), GG-C-B2(K. Buchner), HM-E (L. Boyd), JJ-5 (C. Quincy), LO (B. Franklin), LO (M. Stelzer), MM-H (A. Heard), OP-OSO(M. Krisberg), PH (S. Robling), PZ-A1 (T. Barth), <strong>and</strong> ST-B (J. Kunz)87
Process/Industrial EngineeringManagement Support Systems: Program Corporate Memory —a Knowledge Repository for KSCMany organizations depend ondecisionmakers to createmission-critical decisions that aregrounded on information fromvarious areas. The typicaldecisionmaker has a deep underst<strong>and</strong>ingof specific domains thataffect the decisionmaking processcombined with the experiencethat permits the individual toreact immediately <strong>and</strong> decisivelyon the knowledge. A prominentdecisionmaker has also gainedextensive experience <strong>and</strong> implicitknowledge from years of work insuch domains. An advancingtrend today is downsizing; manyorganizations make a consciousdecision to downsize in order tocut back spending <strong>and</strong> bettercompete in an increasinglyaggressive market. Among themany side effects of downsizingis the dissipation of the “knowledgeresources” of the organization;hence, organizations end updevitalized (e.g., decreasedmorale, commitment, quality,teamwork, productivity, <strong>and</strong>innovation). To conserve theexisting knowledge, a practicalknowledge management (KM)system dem<strong>and</strong>s that it be obtained/produced,shared, regulated,<strong>and</strong> leveraged by a steadyconglomeration of individuals,processes, information technologyapplications, <strong>and</strong> organizationalculture. KSC is currentlyfacing a wave of employee turnoveras a result of Federal Governmentdownsizing, retirement,<strong>and</strong> work redefinition. In orderto prepare for these imminentorganization challenges, KSCcommissioned a KnowledgeManagement Assessment (KMA)study.In order to assess the areas ofintellectual capital for KSC, aKMA was designed <strong>and</strong> implemented.The purpose of theKMA was to (1) identify keycompetencies for KSC, (2) performa knowledge asset inventory,(3) perform a process evaluation,(4) analyze KM culturalreadiness, (5) perform a technologyevaluation, (6) develop a KMstrategy deployment roadmap,<strong>and</strong> (7) propose the necessarynext steps.For this purpose, a series ofKM assessment interviews weredesigned <strong>and</strong> implemented withthe cooperation of representativesfrom the majority of the functionalgroups at KSC. The goal ofthe KM interview was to assistKSC in identifying key competencies<strong>and</strong> to analyze the currentknowledge architecture for theCenter. This step will ensure theappropriate methodology isrecommended at the end of thisphase. An important desired goalof this effort was to gather data toimplement a prototype that willaddress some of KSC’s KM needs.Anecdotal results of the KMAinterview for two functionaldirectorates at KSC are describedin detail in the project’s finalreport. The findings from theKMA included KM needs <strong>and</strong>possible enhancements to theexisting KM environment. Thesefindings also comprise culturalneeds, which address the promotionof a knowledge-sharingculture versus a culture where“knowledge is power.”Key accomplishments <strong>and</strong> milestones:• A KMA study was designed<strong>and</strong> implemented betweenFebruary <strong>and</strong> April <strong>1998</strong>. Inorder to accomplish the assessment,eight technical groupswere interviewed at KSC. TheKMA findings obtained fromthe groups interviewed revealedKSC’s KM needs <strong>and</strong>possible enhancements to thecurrent KM environment.• Following the KMA interviews,two directorates were selectedby KSC executives for a 3-hourdetailed second-stage drilldowninterview. The twogroups chosen were the ShuttleProcessing <strong>and</strong> the PayloadProcessing Directorates. Thepurpose of the second-stagedrill-down interviews was toidentify a focus area to serve asa test bed for a KM application.Representatives from the twofunctional directorates wereinterviewed during the secondstageKMA.• Illustrative prototypes weregenerated for each of the fourrecommendations presented toKSC executives. The prototypeswere created using datafrom the groups at KSC. Findingswere presented to theexecutive team in July <strong>1998</strong>.88
<strong>Research</strong> <strong>and</strong> <strong>Technology</strong> <strong>1998</strong>• A written report was compiled <strong>and</strong> distributed to the executive team as well as to each of theparticipating directorates in July <strong>1998</strong>. The written report also included a literary review onwhat organizations are currently doing in KM.• A number of presentations were made to some of the functional groups that participated inthis effort. Ongoing presentations are expected.• Proposals to address some of the required organizational KM systems were prepared <strong>and</strong>submitted.Contact: G.A. Buckingham (Gregg.Buckingham-1@ksc.nasa.gov), HM-CIC, (407) 867-7952Participating Organization: Florida International University (I. Becerra-Fern<strong>and</strong>ez)KMA Summary of Findings: Knowledge Management Tools(Number of Functional Groups With Need for KM Tool/Total Functional Groups Interviewed)• Expert Knowledge Elicitation <strong>and</strong> Virtual Mentoring Tools: 6/8Elicit, capture, <strong>and</strong> transfer the knowledge of experts acquired through the years of experienceat NASA• Expert Seeker: 6/8Skills database with pointers to experts with a particular background• Collaborative Tools: 6/8Internet/intranet based tools that capture knowledge as teams create it• Decision Support <strong>and</strong> Expert Systems: 5/8Enhance decisionmaking <strong>and</strong> facilitate the decision process by incorporating knowledge factorsfrom past projects• Centerwide Lessons Learned Repository: 5/8Include a synopsis of why certain decisions were made, rather than simply which decisionswere made• Knowledge Management Procedures To Harvest Knowledge: 5/8Procedures to harvest organizational knowledge• Electronic Document Storage: 4/8Would allow departments <strong>and</strong> teams to share work files <strong>and</strong> relevant data• Centerwide Self-Assessment: 1/8Tool to identify what is organizationally known <strong>and</strong> what is unknown• Translation Software: 1/8For NASA documents <strong>and</strong> Web pages89
Process/Industrial EngineeringHuman Factors Engineering: Root-Cause Analysis SystemThe Root-Cause Analysis(RoCA) system helps engineersanalyze <strong>and</strong> track the rootcauses of process anomalies dueto human factors issues at theorganizational, team, <strong>and</strong> individuallevels. Such processanomalies include incidents thatcause personnel injuries, damagefacilities, incur additional costs,or delay processing. The systemis being implemented under aPhase II Small Business Innovation<strong>Research</strong> (SBIR) contract.(RoCA is the new name of asystem originally called HF-TAS,for Human Factors Trending <strong>and</strong>Analysis System.)The development of RoCA ismotivated by the weaknesses ofexisting root-cause analysistechniques. Although statisticalquality control methods (i.e.,methods for assessing whether aprocess is in control) are quantitativelyrobust, widely used, <strong>and</strong>successful, only very simplequalitative methods (e.g.,fishbone diagrams) are availablefor root-cause analysis (underst<strong>and</strong>ingwhy a process is not incontrol). The result is that industriesfrequently spend millions ofdollars fixing the wrong processproblems. The other majormotivation for RoCA is the focuson the importance of humanfactors in industrial accidents.<strong>Research</strong> has shown that avoidablehuman errors are a significantsource of process anomaliesin many industrial processes (e.g.,aircraft manufacturing <strong>and</strong>maintenance).RoCA has many possibleKSC, NASA, <strong>and</strong> commercialapplications. The first applicationof RoCA at KSC is assisting theHuman Factors Team in investigating<strong>and</strong> analyzing the contributingcauses of Shuttle groundprocessing accidents. The majortechnical innovation of RoCA isthe anomaly process diagram(APD). The APD is a new, theoreticallywell-founded methodologyfor root-cause analysisfocused on the representation ofcausal, probabilistic relationsbetween process variables.RoCA is being developedthrough rapid prototyping withsignificant design inputs from theeventual user community (i.e., theHuman Factors team). Majorupgrades to the software weredelivered every few months in FY<strong>1998</strong>. The latest delivered versionincludes a new “qualitativeanalysis” module for graphicallyediting <strong>and</strong> relating the contributingfactors in an event investigationthrough an anomaly processdiagram. It also includes avariety of predefined, st<strong>and</strong>ardreports the user can produce withonly a few mouse clicks. Thesesoftware capabilities build uponpreviously delivered versions tohelp human factors analystsperform event analyses, communicatetheir analyses electronically,<strong>and</strong> underst<strong>and</strong> the trendsin the mishap data using on-lineanalytical processing (i.e., pivottable) technology. Future versionsof the system will extendthe qualitative analysis capabilityto perform analyses quantitatively.Key accomplishments:• 1995: Phase I SBIR contractawarded.• 1996: Completion of the PhaseI feasibility study <strong>and</strong> demonstrationsoftware.• 1997: Award of the Phase IISBIR contract. Developed <strong>and</strong>delivered the initial softwareprototypes to KSC.• <strong>1998</strong>: Delivery of the firstRoCA system for operationaluse. Commercialization successof NASA-sponsoredtechnologies through smallbusiness acquisition. KSCdecision analysis workshop.Key milestones:• 1999: Refinement of operationalprototype at KSC. Additionalcommercialization ofRoCA <strong>and</strong> anomaly processdiagram technologies. Decisionanalysis workshop atJohnson <strong>Space</strong> Center supportingthe Exploration Office.Contacts: T.S. Barth (Timothy.Barth-1@ksc.nasa.gov), PZ-Q-A, (407) 861-6663; <strong>and</strong> J.R. Boogaerts, EI-HF, (407)867-7721Participating Organizations: Prevision,Inc., which is now part of Fair Isaac, Co.(R. Fung <strong>and</strong> B. Del Favero); United<strong>Space</strong> Alliance; NASA/Ames; <strong>and</strong>NASA/KSC (Shuttle Processing <strong>and</strong>Human Factors Integration Office)90
<strong>Research</strong> <strong>and</strong> <strong>Technology</strong> <strong>1998</strong>RoCA Analysis Entry Display91
Process/Industrial EngineeringHuman Factors Engineering: Applications inthe Checkout <strong>and</strong> Launch Control SystemKSC is recognized as NASA’sCenter of Excellence forlaunch <strong>and</strong> payload processingsystems. Due to the continuallyincreasing maintenance costs,technological obsolescenceproblems, limited system flexibility,<strong>and</strong> desire for improvedShuttle processing efficiencies, anew launch system is beingdeveloped. The Checkout <strong>and</strong>Launch Control System (CLCS)will replace the current LaunchProcessing System (LPS). Byincreasing system reliability <strong>and</strong>reducing the hardware, softwarecode lines, <strong>and</strong> facility space, theteam projects a yearly operationalcost savings of 50 percent oncethe new system is fully deployed.Human factors is a specialtyconcerned with the well-being ofpeople in complex systems. Itfocuses on human beings <strong>and</strong>their interaction with products,equipment, facilities, procedures,<strong>and</strong> the environment. Threemajor human factors applicationson the CLCS project are:• Ergonomic assessment: Anergonomic assessment surveywas developed for the CLCSproject personnel. Overall, theavailability of basic ergonomicaids was determined to be low.Participants rated the intensity<strong>and</strong> frequency of pain ordiscomfort they feel in variousareas of their bodies. Thefigure summarizes the painintensity reported in the survey.Neck, shoulder, <strong>and</strong> lowerback were the areas cited withthe greatest frequency <strong>and</strong>intensity of pain among theCLCS personnel.• OMI conversion: Operations<strong>and</strong> maintenance instructions(OMI’s) are the written work25Number of Responses201510NeckShoulderForearmWristFingersLower BackLegs501 2 3 4Intensity LevelsIntensity of Pain92
<strong>Research</strong> <strong>and</strong> <strong>Technology</strong> <strong>1998</strong>instructions used to processShuttles <strong>and</strong> payloads. Theseprovide detailed step-by-stepinstructions for engineers,technicians, <strong>and</strong> inspectorsparticipating in the variousoperations <strong>and</strong> were writtenfor the existing LPS. As thenew CLCS software is implemented,the existing workinstructions will need to bemodified for the new system.A work measurement analysiswas performed to estimate thetime required to convert theseOMI’s. Approximately 950OMI’s from 24 Shuttle systemswere reviewed. Due to theuncertain nature of the conversionprocess, “best case,”“worst case,” <strong>and</strong> “most likely”scenarios were developed.• MMT console design: A significantportion of the CLCSproject is the replacement ofthe existing equipment in thefiring rooms. Several consoledesigns were considered forthe Mission Management Team(MMT) working in the firingrooms. Five ideas were developedfor the MMT consoledesigns. Console design <strong>and</strong>vendor selection is ongoing.Contact: L.K. Rupe (Linda.Rupe-1@ksc.nasa.gov), LM/CLCS, (407) 861-7323Participating Organizations: Universityof Missouri-Rolla (S. Murray) <strong>and</strong>Lockheed Martin93
Process/Industrial EngineeringHuman Factors Engineering: Human Error <strong>Research</strong> in ShuttleProcessing <strong>and</strong> Aircraft Maintenance OperationsNumerous safety studies haveshown that the causes ofaviation accidents <strong>and</strong> incidentsare more likely to be related tohuman error than mechanicalfailure. However, human errormay occur both in flight <strong>and</strong> inthe ground operations thatsupport them. Several recentaviation accidents have determinedthe probable cause to bemaintenance related.Thus, there is a growingrecognition of the importance ofmaintenance human factors <strong>and</strong>the need for operational research.Past accidents have dramaticallydemonstrated the potentialimpact of human error problemsin maintenance areas such astraining for maintenance <strong>and</strong>inspection, tracking of maintenanceresponsibility, procedures<strong>and</strong> task documentation, workenvironment conditions, verbal<strong>and</strong> written communications, <strong>and</strong>leadership <strong>and</strong> teamwork.nance task aids that will ultimatelyreduce human error <strong>and</strong>enhance safety in maintenanceoperations.Striking similarities in humanfactors issues across Shuttle <strong>and</strong>aircraft maintenance have led totechnology transfer meetings ontopics of mutual interest. Figure1 shows the Shuttle in the OrbiterProcessing Facility, which has awork environment <strong>and</strong> workprocesses similar to those indepot-level aircraft maintenancecenters (see figure 2).This Ames <strong>Research</strong> Center(ARC) <strong>and</strong> KSC collaboration isintended to (1) promote humanfactors awareness, (2) exchangeresearch information <strong>and</strong> results,<strong>and</strong> (3) when feasible, conductjoint human factors researchusing KSC’s unique technologytest bed capabilities. These goalsare being accomplished in thefollowing ways:• <strong>Technology</strong> transfer workshops:The overall goal is toidentify issues, problems, <strong>and</strong>“lessons-learned” in commoninterest areas across spacecraftprocessing <strong>and</strong> aircraft maintenance.Topics such as humanerror <strong>and</strong> incident analysis, riskanalysis techniques, humanfactors training, <strong>and</strong> humanperformance measurement areincluded.Although the aviation industryhas been innovative in developingflight training technologies,human-centered automation,multimedia information, <strong>and</strong>decision-aiding systems, theadaptation <strong>and</strong> transference ofhuman factors tools, techniques,<strong>and</strong> principles to ground operationshave been limited. The goalof this research is to better underst<strong>and</strong>human error in maintenanceoperations in order toimprove procedures, traininginterventions, <strong>and</strong> other mainte-Figure 1. <strong>Space</strong> Shuttle Orbiter Entering Its Maintenance Facility94
<strong>Research</strong> <strong>and</strong> <strong>Technology</strong> <strong>1998</strong>Figure 2. Aircraft Engine Maintenance• Human factors research: The goal is to combineresearch efforts that involve similar humanfactors goals <strong>and</strong> issues across multiple operationalsettings. KSC provides a test bed foroperations research in depot-level maintenance.These efforts demonstrate an area of synergybetween NASA’s Aeronautics enterprise <strong>and</strong> HumanExploration <strong>and</strong> Development of <strong>Space</strong>(HEDS) enterprise. In <strong>1998</strong>, the NASA AviationSafety Program initiated an element focusing onhuman factors in aircraft maintenance operations.This program is closely coordinated with the FederalAviation Association <strong>and</strong> supports manyresearch efforts that can also apply to Shuttle operations.This opportunity has been used to increasethe collaboration between ARC <strong>and</strong> KSC <strong>and</strong> lookforward to valuable results supporting the goals<strong>and</strong> objectives of both enterprises.Key accomplishments:• 1991 to 1993: Initial application of human factorstechnologies developed for flight crews to aircraftmaintenance crews. Team effectiveness researchon Shuttle maintenance crews. Memor<strong>and</strong>um ofunderst<strong>and</strong>ing between ARC <strong>and</strong> KSC signed.• 1994 to 1995: Initial collaboration with the KSCShuttle Processing Human Factors Team in thearea of human error investigation <strong>and</strong> analysis.• 1996: Incident Investigation Workshop hosted byARC. This workshop focused on the humanfactors aspects of incidents, accidents, mishaps,<strong>and</strong> close calls in spacecraft <strong>and</strong> aircraft maintenance.• 1997: Human Factors Training Workshop hostedby KSC. This workshop focused on humanfactors training issues.• <strong>1998</strong>: Written Procedures Workshop hosted byKSC. This workshop focused on work instructions<strong>and</strong> task analysis (two task areas in theAviation Safety Program, Human Factors inMaintenance) <strong>and</strong> supported the Shuttle WorkInstruction Task Team <strong>and</strong> airline <strong>and</strong> militarymaintenance operations. Memor<strong>and</strong>um ofunderst<strong>and</strong>ing between ARC <strong>and</strong> KSC updated<strong>and</strong> signed by the Center Directors.Key milestones:• 1999: Continued collaboration in incident investigation,root-cause analysis, <strong>and</strong> task analysis.Possible workshop focusing on statistical processcontrol applications to system performance datacollected during maintenance operations. Formalizethe KSC process/industrial engineeringtest bed.Contacts: T.S. Barth (Timothy.Barth-1@ksc.nasa.gov), PZ-Q-A, (407) 861-6663; <strong>and</strong> B. Kanki, ARC, (650) 604-5785Participating Organizations: United <strong>Space</strong> Alliance,Transport Canada, National Transportation Safety Board,Aerospace Safety Advisory Panel, Northwest Airlines, UnitedAirlines, Continental Airlines, U.S. Airways, Idaho NationalEngineering <strong>and</strong> Environmental Laboratories, FederalAviation Administration, <strong>and</strong> U.S. Air Force95
Process/Industrial EngineeringWork Methods <strong>and</strong> Measurement:Expert System To Generate Job St<strong>and</strong>ardsKSC industrial engineers areactively engaged in identifyingtechniques to improve theefficiency <strong>and</strong> effectiveness of<strong>Space</strong> Shuttle ground processing.One approach that has demonstrateda high potential forsuccess is the use of industrialengineering techniques to measurework. Although many workmeasurement techniques are bestsuited for short-duration, highrepetitionactivities, there are alsoapproaches to successfullymeasure the time associated withlong-duration, low-repetitiontasks like those inherent inShuttle ground processing.A challenge to work measurementpractitioners is that there isno guidance on which of severalavailable measurement techniquesto use. Practitioners mustrely on their own experience, onthe-jobtraining, previous approachesused by their predecessorsin the organization, <strong>and</strong> trial<strong>and</strong> error. These methods forchoosing a work measurementtechnique can lead to ineffectiveresults. The literature is of littlehelp <strong>and</strong> there are no referencesto guide the practitioner. KSCindustrial engineers have recognizedthis deficiency <strong>and</strong> havetaken steps to fill the void.In 1994, KSC industrialengineers <strong>and</strong> their supportcontractors began to develop anexpert system to (1) help the jobst<strong>and</strong>ards developer select anappropriate measurement technique<strong>and</strong> (2) guide the jobst<strong>and</strong>ards developer through thesteps required to develop a jobst<strong>and</strong>ard when using a work timeestimation technique. The JobSt<strong>and</strong>ards Development System(JSDS) delivered to KSC in <strong>1998</strong>asks questions relevant to techniqueselection <strong>and</strong>, on the basisof responses by the user, providesa list of techniques suitable forthe application. If desired by theuser, the JSDS will recommend aspecific technique determined tobe appropriate for the applicationdefined by the user.When estimation is the appropriatetechnique, the systemguides the user through dataacquisition from the domainexpert <strong>and</strong> computes the st<strong>and</strong>ardtime of the job. In additionto providing the st<strong>and</strong>ard time,the system provides an estimateof job duration <strong>and</strong> informationabout each resource required tocomplete the job.The JSDS has two primaryapplications. First, any organizationthat develops job st<strong>and</strong>ards(or less formal job time estimates)would benefit from the expertiseembedded in the work measurementtechnique selection moduleof the system. Second, the systemwill help organizations document<strong>and</strong> quantify skill <strong>and</strong> work timerequirements for work composedof long-duration, low-repetitiontasks. This type of work is oftenassociated with equipment <strong>and</strong>facility maintenance activities <strong>and</strong>functions. The JSDS extendssupply chain management downto the individual task level sincejob time estimates are an importantingredient to project scheduling.C<strong>and</strong>idates for commercial96
<strong>Research</strong> <strong>and</strong> <strong>Technology</strong> <strong>1998</strong>application of the JSDS includeoperations of state <strong>and</strong> localgovernments, health care facilities,public utilities, <strong>and</strong> aircraft,rail, <strong>and</strong> ship maintenance <strong>and</strong>repair facilities.Key accomplishments:• 1994: Successfully demonstratedthe prototype expertsystem to select an appropriatework measurement technique.• 1995: Identified the workmeasurement techniques toinclude in the expert system.• 1996: Conducted a small-scaletest of a work measurementtechnique in the KSC environment.• 1997: Conducted a comprehensivefield trial of the workmeasurement technique testedin 1996.• <strong>1998</strong>: Completed the developmentof the JSDS. The JSDSincludes expert systems thatselect a work measurementtechnique, guide the measurementof work when work timeestimation is appropriate, <strong>and</strong>compute the job st<strong>and</strong>ard.Key milestone:• 1999: Ongoing identification ofcommercial applications.Contact: M.M. Groh-Hammond(Marcia.Groh-Hammond-1@ksc.nasa.gov), PZ-Q-A, (407) 861-0572Participating Organizations:OMNI Engineering <strong>and</strong> <strong>Technology</strong>,Inc. (N. Schmeidler), Affinity LogicCorporation (G. Ribar), <strong>and</strong> United<strong>Space</strong> AllianceJob St<strong>and</strong>ard Summary97
Process/Industrial EngineeringWork Methods <strong>and</strong> Measurement:Electronic Portable Information CollectionWork procedures for payloadprocessing <strong>and</strong> checkoutoperations at KSC are executedusing a paper system. With thissystem, a procedure is generatedusing a word processor. Theprocedure is then printed out,copied, <strong>and</strong> distributed to membersof the task team. When thework procedure is executed, asingle master copy is kept up todate by using a pen to record thetest data <strong>and</strong> notes <strong>and</strong> by usingquality <strong>and</strong> technician ink stampsto verify the work steps as theyare performed. Test team membersmaintain their own copies ofthe procedure. Deviations to thework instructions that occurduring the execution of theprocedure must be documentedon a paper form. These deviationsrequire approval signatures.Once approved, the deviation iscopied <strong>and</strong> distributed to the taskteam. The completed masterwork procedure, includingdeviations, is scanned into acomputer <strong>and</strong> stored electronically.The Electronic PortableInformation Collection (EPIC)system was developed to automatethis procedure. EPIC wasformerly known as the PortableData Collection (PDC) System.With the EPIC system, the procedureis converted from a wordprocessor document to a database.It is then executed usingportable computers. Data isentered electronically, either witha keyboard or a pen, using h<strong>and</strong>writingrecognition. The systemdistributes this data to all otherterminals. The ink stamp isreplaced with an electronic stampthat meets the form, fit, <strong>and</strong>function of the old ink stamp. Aprogrammable memory chipinside the electronic stamp storesa unique identifier. All teammembers have their own electronicstamp.This electronic stamp adds asecure mark to a step, identifyingwho performed that step <strong>and</strong> thedate <strong>and</strong> time the step was performed.The electronic stamp isread using a stamp reader connectedto the serial communicationport of the computer. Thesystem provides protectionmechanisms to ensure data <strong>and</strong>stamp integrity. Once the procedurehas been worked to completion,it is converted to a portabledocument format (PDF) <strong>and</strong>stored electronically in a documentationsystem.The main components of theEPIC system are the central dataserver (CDS) <strong>and</strong> the portabledata terminals (PDT’s). The CDSis the main computer that servesas the network host <strong>and</strong> databaseserver. PDT’s display proceduresteps <strong>and</strong> enable users to collecttest data <strong>and</strong> stamps. The PDT’sare st<strong>and</strong>ard personal computers(PC’s) running Windows 95 orWindows for Workgroups operatingsystems. Various PC’s areused as PDT’s, including desktops,laptops, wearable computers,<strong>and</strong> pen-based tablets. TheCDS is a high-end PC running theWindows NT operating system.The project was developedjointly by Sentel Corporation <strong>and</strong>KSC, the lead center for payloadprocessing. The prototype systemwas developed under a SmallBusiness Innovation <strong>Research</strong>(SBIR) contract that was awardedto Sentel Corporation to developthe capability to capture technician<strong>and</strong> quality stamps <strong>and</strong> testdata electronically. The operationalversion was developedunder a <strong>Space</strong> Act Agreementbetween NASA <strong>and</strong> Sentel Corporation.The following benefitsare provided by the EPIC system:• All test team members seechanges to the documentinstantly, providing greaterassurance that all team membersare properly informed <strong>and</strong>the data is accurate.• Accuracy of the procedure isimproved as deviations areincorporated directly into theappropriate sequence of theprocedure. The time to process,approve, <strong>and</strong> distribute adeviation is also reduced.• Information availability isimproved. Test data can besearched <strong>and</strong> retrieved througha st<strong>and</strong>ard database.• Queries can be made formanagement reporting orincident investigations.• The need to print <strong>and</strong> distributeprocedures prior to testingis eliminated.• The need to scan the procedurefor storage is eliminated.• Emergency procedures can beaccessed immediately.• Paper usage is reduced.98
<strong>Research</strong> <strong>and</strong> <strong>Technology</strong> <strong>1998</strong>The system was modeled afterthe existing paper system usingthe existing business rules.Presently, the system is beingdeveloped to support <strong>Space</strong>Station processing. EPIC is beingmarketed to the airline industryfor use in airplane maintenance<strong>and</strong> to the electrical power industryfor use in power substationmaintenance.Key accomplishments:• 1993: Completed the Phase Istudy for the SBIR contract.• 1996: Completed Phase II ofthe SBIR contract. Demonstratedthe proof of concept forthis system. Received theNASA SBIR <strong>Technology</strong> of theYear Award in the computer/software category. Completedpilot study 1. The first pilotstudy was conducted in theOperations <strong>and</strong> CheckoutBuilding using the EPIC electronicsystem in parallel withthe paper system.• <strong>1998</strong>: Upgraded the systemfrom a prototype to an operationalsystem. In pilot study 2,tested the EPIC system in theKSC <strong>Space</strong> Shuttle Main EngineShop <strong>and</strong> <strong>Space</strong> StationProcessing Facility.Team Members Using EPICKey milestone:• 1999: Implement the EPICsystem to be used by NASA,Government contractors, <strong>and</strong>private industry.Electronic Stamp <strong>and</strong> Stamp ReaderContact: D.H. Miller (Darcy.Miller-1@ksc.nasa.gov),VC-B1, (407) 867-3523Participating Organizations: Sentel Corporation (K.L. Jackson <strong>and</strong> M.R. Kappel)<strong>and</strong> Mississippi State University (L.K. Moore)99
Process/Industrial EngineeringWork Methods <strong>and</strong> Measurement:Work Instruction Task TeamThe Shuttle Processing WorkInstruction Task Team (WITT)was chartered to develop <strong>and</strong>implement a comprehensivevision for future work instructionsused in ground processingof the <strong>Space</strong> Shuttle fleet. Thegoals of the new work instructionsystem are to improve the efficiencyof the processes used togenerate <strong>and</strong> maintain the writtenprocedures, to improve theefficiency of shop floor taskexecution using the new procedures,<strong>and</strong> to improve workplacesafety by reducing the potentialfor human errors.The team analyzed the currentwork instruction generationprocesses <strong>and</strong> products (thewritten procedures). Severalopportunities for improvementwere identified to improve thecycle time <strong>and</strong> to reduce the laborhours associated with deliveringthe work instructions to the shopfloor to support a specific task.Existing work instructions arerule based, are highly detailed,<strong>and</strong> frequently contain informationnot needed for a specific task.Examples of nonvalue-addedinformation include drawings forother orbiter vehicles <strong>and</strong> worksteps for testing only performedat specified intervals. The writtenprocedures varied widely in“look <strong>and</strong> feel” for the users,which will become increasinglyimportant as workers are morefrequently assigned to differentorbiter <strong>and</strong> ground systems ordifferent facilities.The WITT collected data fromapproximately 20 different KSCteams working on various aspectsof improving work instructionprocesses. The team also gainedvaluable information <strong>and</strong> insightthrough participation in a WrittenProcedures Workshop co-sponsoredby Ames <strong>Research</strong> Center<strong>and</strong> KSC. Finally, the teamcollected benchmark data duringsite visits to three different industryorganizations. The result ofthe team’s research was a visionfor the future of KSC work instructionsbased on the followingeight key actions:• Use a st<strong>and</strong>ardized format forthe work steps in all ShuttleProcessing procedures.• Increase shop involvement inthe authoring process.• Deliver “lean, clean workinstructions” with only theinformation needed for thecurrent task <strong>and</strong> a level ofdetail consistent with theresults of a task analysis con-St<strong>and</strong>ardFormatTask AnalysisShopInvolvementMinimize Approvals,BuyoffsComputerizeWith COTSSkill-BasedWork ForceIncorporate WorkInstruction DeviationsMinimize Nontask-Related Data CollectionFigure 1. Key Elements of the Shuttle Processing Work Instruction Vision100
<strong>Research</strong> <strong>and</strong> <strong>Technology</strong> <strong>1998</strong>sidering task frequency <strong>and</strong>criticality/complexity.• Take advantage of KSC’s skillbasedwork force.• Minimize approval, buyoff,<strong>and</strong> closure requirements.• Incorporate all permanent,successfully executed workinstruction deviations prior torelease of the next revision.• Optimize the data collectionprocesses through innovativemethods to capture nontaskrelateddata <strong>and</strong> ensuring thatall data is analyzed <strong>and</strong> used.• Use the latest commercial offthe-shelftechnologies toenhance the new work instructionprocess.Key accomplishments:• <strong>1998</strong>: Completed the work instruction vision <strong>and</strong> obtained approvalfrom KSC <strong>and</strong> <strong>Space</strong> Shuttle Program management to beginimplementation. Designed <strong>and</strong> implemented “test cases” to demonstratethe feasibility of the proposed new work instruction system.Supported a team to significantly reduce the number <strong>and</strong>complexity of the requirements for KSC work instructions. Developeda st<strong>and</strong>ardized format <strong>and</strong> writers guide (based on the Departmentof Energy’s guide) for implementation in all areas ofShuttle Processing. Developed an initial KSC task analysis procedurewith support from the University of Central Florida. Integratedefforts with several additional teams.Key milestone:• 1999: Charter implementation teams for all key vision elements.Contact: T.S. Barth (Timothy.Barth-1@ksc.nasa.gov), PZ-Q-A, (407) 861-6663Participating Organizations: NASA Shuttle Processing (R. Blackwelder,M. Wilhoit, <strong>and</strong> G. Glochick), United <strong>Space</strong> Operations (D. Blankmann-Alex<strong>and</strong>er,D. Ciccateri, R. Corsillo, S. Defillips, J. Entinger, C. Hannas, K. Jones, B. Kidd,B. McKenzie, S. Morrison, V. Neal, J. Rooker, J. Swanson, <strong>and</strong> C. Jones), <strong>and</strong>University of Central Florida (J. Pet-Edwards)The recommendations directlyaddress the root causes ofthe systemic problems associatedwith KSC’s written procedures.The relationship between theeight vision elements is shown infigure 1. The team also constructedseveral conceptualmodels showing the relationshipbetween task frequency/complexity/criticalityto the level ofdetail, skill-based training, <strong>and</strong>approval/buyoff requirements.The level of detail model isillustrated in figure 2.High TaskFrequencyLow TaskFrequency• Minimum instruction detail• Maintenance manual for reference• Moderate instruction detail• Partial rule-based instructionsLow TaskCriticality/Complexity• Moderate instruction detail• Partial rule-based instructions• Maximum instruction detail• Rule-based instructionsHigh TaskCriticality/ComplexityFigure 2. Work Instruction Level of Detail Model101
Process/Industrial EngineeringWork Methods <strong>and</strong> Measurement:Industrial Engineering Decision Support ToolThe objective of this research was to develop a methodology for auser-friendly decision support software system for the applicationof innovative industrial engineering (IE) models <strong>and</strong> technologies forcomplex processes at KSC. To illustrate the feasibility of this approach,AET, Inc., developed a model for a KSC work process usinghistorical data collected over 10 Shuttle missions.The technical approach used for the modeling was the applicationof Multiple Regression Systems (MRS’s) for estimation of indirectwork content <strong>and</strong> performance. MRS applies the statistical techniqueof multiple regression to analyze the output of one or more operatorsengaged in a variety of tasks in order to estimate the time used toproduce a single unit of output for each of the tasks. This model isshown in the equation:Hours = 9.29 + 0.278 · Seq001 + 0.235 · Seq003 - 0.08 · Seq005 + 0.547 ·Seq006 + 0.318 · Seq008 + 0.017 · Seq009 + 0.062 · Seq024The coefficients in the model equation have special significance.They may be used to estimate the average time required to complete astep in each of the sequences analyzed. For example, 0.278 man-hourwould be the expected requirement for completing a step in sequence001. For illustration purposes as well as data limitations, the assumptionthat all steps in an individual sequence require equal amounts oftime was made. This equation may be used to predict the total manhoursrequired for any number of steps performed in any of thesequences.The application of this model in the area of decision support isextremely powerful. This model can be used to support changes insequence steps. By qualitatively predicting the number of work hoursrequired, a direct link to labor cost is established. Therefore, a decisionto change a process can be supported by objective data <strong>and</strong> notjust subjective estimates. The prototype software system is shown inthe figure.102
<strong>Research</strong> <strong>and</strong> <strong>Technology</strong> <strong>1998</strong>Key accomplishments:• <strong>1998</strong>: Phase 1 Small Business Innovation <strong>Research</strong> (SBIR)project. Performed statistical analysis on data collected from astructural bonding experiment. Identified, together with KSCground operations <strong>and</strong> IE personnel, appropriate work processesfor analysis <strong>and</strong> modeling. Developed an analyticalmodel of the process under study <strong>and</strong> gathered data for estimationof model parameters. Completed a final report specifyingthe technical results achieved in this project.Key milestone:• 1999: Potential continuation of research.Contact: T.S. Barth (Timothy.Barth-1@ksc.nasa.gov), PZ-Q-A, (407) 861-6663Participating Organizations: AET, Inc. (Dr. G.T. Hess) <strong>and</strong> Lehigh University(Dr. L. Martin-Vega)KSCIEProcessModelsSTADIUM TMUser-Friendly Simulation InterfaceSimulationControlDataControlDataAnalysisShuttleMaintenance<strong>and</strong>ProcessingDataStatisticalAnalysis,Risk Analysis,<strong>and</strong>DecisionModelingProposed Software-Based Decision Support System103
Process/Industrial EngineeringGeneral: Center for Applied <strong>Research</strong> inIndustrial <strong>and</strong> Systems EngineeringApartnership was developedbetween NASA <strong>and</strong> FloridaInternational University (FIU) toestablish the Applied <strong>Research</strong> inIndustrial <strong>and</strong> Systems Engineering(ARISE) Center. The partnershipseeks to establish a combinedresearch <strong>and</strong> educationalprogram to attract <strong>and</strong> retainwomen, Hispanics, AfricanAmericans, <strong>and</strong> other individualsfrom minority groups to engineering.Students participating inthe program:• Are exposed <strong>and</strong> trained inNASA’s mission.• Are given seminars on a varietyof issues, including therealities of the workplace,diversity, <strong>and</strong> gender issues.• Participate in applied researchprojects.• Are instructed on the benefitsof pursuing postgraduatestudies in the hopes of increasingtheir chances to succeed inthe workplace as well asincreasing their stature as rolemodels for future generations.• Have a 4-week on-site internshipso they become acquaintedwith the various KSCprocesses needed to completethe projects.• Receive a stipend during theacademic year <strong>and</strong> the summerterms.An important objective of thiseffort is to foster partnershipsbetween FIU <strong>and</strong> NASA <strong>and</strong>between FIU <strong>and</strong> local industry.The initial partners in this effortwere FIU in Miami, Florida, <strong>and</strong>KSC. FIU was the lead institution,whereas KSC providedsteering guidance <strong>and</strong> was asource to implement some aspectsof the program. The initialtimeframe of this effort was 2years. In this timeframe, it wasexpected that various aspects ofthe model should be tested,rethought, <strong>and</strong> retested as neededso the model could become anappropriate model for industryuniversitypartnerships. Specifically,a proposal was developedto begin selling the model to localindustry. The proposal highlightsthe benefits local industry mayderive from the ARISE Center<strong>and</strong> the impact their sponsorshipwill have in shaping the lives offuture community leaders.Key accomplishments:• 1997:- Established an appliedresearch center where participatingstudents haveaccess to the necessary toolsto start <strong>and</strong> complete industrial<strong>and</strong> systems engineeringprojects related to NASAoperations <strong>and</strong> processes atKSC. Selected <strong>and</strong> set uphardware <strong>and</strong> software.Selected/purchased otherequipment needed for theARISE Center.- Recruited students, whichinvolved the development ofa brochure <strong>and</strong> the developmentof a Web site for adver-104
<strong>Research</strong> <strong>and</strong> <strong>Technology</strong> <strong>1998</strong>tising the existence of this opportunity(arise.eng.fiu.edu/). Students from under-representedgroups who had a grade point averageof 3.0 were identified <strong>and</strong> a letter of invitationwas sent. Eight students were selected.- Developed activities for the ARISE Center thatwere attractive to students.• <strong>1998</strong>:- Purchased computer equipment <strong>and</strong> software.The Center has one server, two networked laserprinters, <strong>and</strong> 15 PC’s. The Center has licensesfor a variety of software. The FIU industrial<strong>and</strong> systems engineering department providedlaboratory space <strong>and</strong> furniture to house theCenter.- Held six seminars, including an overview ofNASA, <strong>Space</strong> Shuttle history <strong>and</strong> assemblyprocess, <strong>and</strong> gender <strong>and</strong> racism in the workplace.- Visits to KSC for a special tour to see variousprocesses at KSC. Students participated in a 4-week internship during the summer. Thisinternship enabled them to work next to practicingengineers while developing theirprojects.- Students worked in teams of two on selectedprojects. Two projects were done for Logistics,two for Installation Operations, <strong>and</strong> one for theCheckout <strong>and</strong> Launch Control System (CLCS).- Curriculum Integration. Credit for projectswas given as part of a technical elective course.The projects were presented in the ProjectManagement course as well as in the <strong>1998</strong><strong>Annual</strong> Industry Projects Conference.- One-to-one conversations were used to let thestudents know what graduate school is allabout <strong>and</strong> how it can fit their career plans.- During the summer, a workshop was given onstatistical analysis to the Payloads office personnel.New avenues of collaboration wereinvestigated. New projects <strong>and</strong> liaisons wereidentified.- Fourteen students were recruited for the secondyear. New students will be selected inDecember <strong>1998</strong>.- A proposal was prepared <strong>and</strong> is being discussedwith local industry. The Web site iscontinuously being updated.Key milestones:• <strong>1998</strong>: Discussion of projects occurred in January,August, <strong>and</strong> December. Project developmentoccurred over the academic year. A ProjectsConference was held in April, which showcasedsome of the projects to industry. Continued theIndustrial Portfolio to recruit industrial partners.Seminars continued on a two-track level.• 1999: Projects Conference in April. A conferencepaper <strong>and</strong> journal paper will be published.Contact: M.M. Groh-Hammond (Marcia.Groh-Hammond-1@ksc.nasa.gov), PZ-Q-A, (407) 861- 5428Participating Organization: Florida International University(M. Centeno <strong>and</strong> M. Resnick)105
Process/Industrial EngineeringGeneral: Key Characteristics inManufacturing <strong>and</strong> MaintenanceKey characteristic (KC) methodologiesare used by a widevariety of companies to helpmanage variation risk in thedesign <strong>and</strong> manufacture ofcomplex products. Complexproducts can contain millions ofdimensions <strong>and</strong> characteristics(voltages, forces, etc.), each ofwhich impacts the performanceof the product. In addition, eachof these features as manufacturedwill deviate from its nominalvalue because of inherent variabilityin manufacturing, assembly,<strong>and</strong> environment. However,only a few of the millions offeatures, the KC’s of the product,will significantly affect the finalquality, performance, <strong>and</strong> cost ofthe product. The KC’s of aproduct link the product requirementsthat are variation sensitiveto the part <strong>and</strong> process characteristicsthat contribute to theirvariation.following: Allied-Signal discussedthe implications of KC’son suppliers; GE discussed thedesign for six sigma; Xerox,Kodak, <strong>and</strong> Boeing gave overviews<strong>and</strong> examples of KC implementations;<strong>and</strong> IBM gave apresentation on the implication ofstatistical tolerancing.Four strategic research <strong>and</strong>development issues emergedfrom the <strong>1998</strong> symposium: howIdentify KC'sIdentify product-KC'sSet product-KC latitudesCreate KC flowdownto take a system view of variationrisk management, the meaning ofKC’s to suppliers, a potential U.S.st<strong>and</strong>ard for KC’s, <strong>and</strong> the costimplications <strong>and</strong> benefits of KCmethodologies. In addition,working groups were formed tocontinue discussions. Thesegroups are: Costs, St<strong>and</strong>ards,Statistical Tolerancing, ProcessCapability Databases, Metrology,Supplier Relations, <strong>and</strong> Models<strong>and</strong> Tools. Information about theconferences, the working groups,<strong>and</strong> other KC resources can befound at the Web site: http://cardamom.mit.edu/KC/kc.html.KC methodologies includetools processes to identify theselect features, assess their impacton the quality of the product, <strong>and</strong>mitigate the effect of their variation.Variation mitigation techniquesinclude robust design,process control, variation reduction,<strong>and</strong> inspection. The figureshows a typical KC methodology.ProcessCapabilityDataDetermine which KC'sneed to be verifiedChart processDetermine which KC'sneed to have variation reducedReduce variationVariationModelThe first annual KC Symposiumin 1997 brought 40 peoplefrom 11 organizations together todiscuss general problems <strong>and</strong>issues surrounding KC implementation.The <strong>1998</strong> KC symposiumwas hosted by KSC. Thirteenpresentations included theDetermine which KC'sneed continual monitoringOngoing process controlTypical KC Methodology106
<strong>Research</strong> <strong>and</strong> <strong>Technology</strong> <strong>1998</strong>Additional research <strong>and</strong> technology developmentwas proposed by developing KC spinoffcommon interest groups. KSC does not have highvolumemanufacturing operations like the organizationsrepresented by most existing KC symposiumparticipants, but the fundamental principles ofstatistical quality control (SQC) <strong>and</strong> key characteristicsapply to many other areas. KC methodologiesmay require customization in order to be useful inKSC operations. Potential spinoff common interestgroups could customize <strong>and</strong> apply basic KC <strong>and</strong>SQC methodologies to different domains. Twoc<strong>and</strong>idate spinoff areas are:1. SQC applications to very low-volume or uniquespace hardware production: The potential existsto apply SQC techniques to the manufacture oflow-volume or unique hardware elements. Inthese cases, the data elements are usually operatingmeasurements of the machinery used toproduce hardware rather than the hardwareitself, since the extremely low-volume/uniqueproducts will not supply enough data for meaningfulstatistical analysis.2. SQC applications to aircraft/spacecraft maintenance(test <strong>and</strong> checkout) data: NASA <strong>and</strong>United <strong>Space</strong> Alliance system engineers arecurrently applying SQC analysis techniques toShuttle system performance data under theongoing surveillance effort. The analysis resultswill support certification of flight readiness(COFR) <strong>and</strong> identification of enhancement opportunities.The KSC COFR process now involvesverification of process stability <strong>and</strong> capability.Key characteristic methodologies can be appliedto select those system performance data sets mostimportant for determining flight readiness <strong>and</strong>opportunities for enhancements <strong>and</strong> upgrades.Based on preliminary research, it appears thatDepartment of Defense <strong>and</strong> industry aircraft maintenancecenters could also benefit from additionalapplications of SQC tools to system performancedata collected during maintenance operations.Key accomplishments:• 1997: First annual KC Symposium hosted by theMassachusetts Institute of <strong>Technology</strong>.• <strong>1998</strong>: Second KC Symposium hosted by KSC.Strategic project approved to pursue funding fordevelopment of key characteristic methodologiessupporting KSC operations.Key milestone:• 1999: Third KC Symposium to be hosted byMotorola in Phoenix, Arizona.Contact: T.S. Barth (Timothy.Barth-1@ksc.nasa.gov),PZ-Q-A, (407) 861-6663Participating Organizations: Massachusetts Institute of<strong>Technology</strong> (A. Thornton), Allied-Signal, Alcoa, BritishAerospace, Chrysler Corporation, DARPA, Eastman Kodak,Ford, Embry-Riddle Aeronautical University, GE, GM,Honeywell, IBM, IDA, ITT, Lockheed Martin, NASA, NIST,Northrop Grumman, Pratt <strong>and</strong> Whitney, Quality Associates,Raytheon, Textron, Boeing, United <strong>Space</strong> Alliance, Universityof Florida, University of Maryl<strong>and</strong>, <strong>and</strong> Xerox107
Process/Industrial EngineeringGeneral: Searchable Answer Generating Environment —a Knowledge Management System To Seek Expertsin the Florida State University SystemThe need to acquire intellectual capital has createdthe Knowledge Management (KM) movement,which aims to develop new practices <strong>and</strong> tools tocapture knowledge. An indepth examination ofcurrent KM projects revealed that a large percentattempt to create some kind of a knowledge repository.Current studies identify three types of knowledgerepositories. One of these types attempts tomanage organizational knowledge by storingpointers to those who have specific knowledgewithin the organization. In this light, this reportdiscusses the development of the Searchable AnswerGenerating Environment (SAGE) applicationprototype. The development of this applicationprototype was funded through the NASA/FloridaMinority Institution Entrepreneurial Partnership(FMIEP) grant.The purpose of this KM system is to create arepository of experts in the State of Florida StateUniversity System (SUS). Currently, each of thestate universities in Florida maintains a database offunded research, but these databases are disjointed<strong>and</strong> disparate. This application creates one singleWeb-enabled repository that can be searched in anumber of ways including research topic, investigatorname, funding agency, or university. The benefitsof SAGE are: (1) SAGE is a repository ofintellectual capital within the Florida SUS; (2) SAGEhelps locate Florida SUS researchers for collaborationwith industry <strong>and</strong> Federal agencies, thusincreasing the potential for research funding to theSUS; (3) SAGE enhances communication <strong>and</strong> grantsFlorida SUS experts more visibility, making universitiesmore marketable; <strong>and</strong> (4) SAGE combines <strong>and</strong>unifies existing data from multiple sources into oneuser Web-accessible interface.Ideally the aggregated data would be accessiblefrom one point of entry. For example, the databeing accessed may consist of multiple data typesthat have been converted to a st<strong>and</strong>ard file format.SAGE consists of the typical university-sponsoredresearch data incremented by object-oriented datasuch as research topic, investigator name, fundingagency, or university. One of SAGE’s advantagesis that there is only one point of entry or a Webenabledinterface, allowing multiple occurrences ofthe interface <strong>and</strong> giving the end user deploymentflexibility. The main interfaces on the query engine(in SAGE) use text fields to search the processeddata for key words, fields of expertise, names, orother applicable search fields. The applicationprocesses the end user’s query <strong>and</strong> returns thepertinent information. The information is collectedfrom a conglomeration of multimedia databases <strong>and</strong>then presented as queried (see the figure).Key accomplishments (<strong>1998</strong>):• The development of the SAGE database involvedan initial design followed by the incrementalimplementation phases:- The initial design phase constituted a comprehensivesurvey of available tools <strong>and</strong> methodologies.An assessment was carried out toselect the most efficient approach to datastorage <strong>and</strong> data retrieval. A middlewaredevelopment environment was selectedbecause of its significant application strengths<strong>and</strong> demonstrated database interaction capabilities.Additionally, it provided the abilityfor secure transactions.- The implementation phase of SAGE involvedthe design of the middleware modules, eachwith an assigned task. Querying moduleswere used to provide search capabilities. Eachquery interface involved several modules thatinteracted with the database.- A sample database was obtained from theFlorida International University (FIU) Division108
<strong>Research</strong> <strong>and</strong> <strong>Technology</strong> <strong>1998</strong>UWF ExtractionAlgorithmUWFFAMUFSUUNFUFUCFUSFFAMU ExtractionAlgorithmUNF ExtractionAlgorithmFSU ExtractionAlgorithmUF ExtractionAlgorithmUCF ExtractionAlgorithmSAGEMiddlewareClientSAGEDatabaseSAGEWeb ServerFGCUFAUFIUUSF ExtractionAlgorithmFAU ExtractionAlgorithmFIU ExtractionAlgorithmState University SystemSponsored <strong>Research</strong>St<strong>and</strong>ard Query Language (SQL)Compatible DatabasesFGCU ExtractionAlgorithmSAGE ArchitectureSAGE Interface (Web Browser)SAGE Applicationof Sponsored <strong>Research</strong> <strong>and</strong> Training (DSRT) toprovide a prototype data storage structure.After applying an extraction algorithm to thedata, the SAGE database was populated withFIU data.- The SAGE application was then Web-enabledon the primary server for its current wave ofbeta testing.- The SAGE prototype was then populated withthe University of Central Florida DSRT database.Some of the technical challenges facedduring the design <strong>and</strong> implementation of thisproject included the fact that databases fromFlorida SUS DSRT offices were dissimilar indesign <strong>and</strong> file format <strong>and</strong> in duplicate dataoccurrences, field names, <strong>and</strong> stored architecture.PERL scripts were used to solve thedatabase disparities, <strong>and</strong> a data dictionary wasimplemented to eliminate redundancies.Key milestones (1999):• Migration to a relational database structure iscurrently underway. This is a necessary stepbecause of its efficiency <strong>and</strong> scalability with data.The middleware source is currently beingrecoded to take advantage of the improved datastructures. This new relational architecture willalso alleviate the data inconsistency problemacross SUS platforms.• Population of the SAGE database with each of theremaining SUS DSRT databases.Contact: G.A. Buckingham (Gregg.Buckingham-1@ksc.nasa.gov), HM-CIC, (407) 867-7952Participating Organization: Florida International University(I. Becerra-Fern<strong>and</strong>ez)109
Process/Industrial EngineeringProcess Analysis <strong>and</strong> Modeling: Statistical Process ControlTechniques for Variable Shuttle System Performance DataNASA Shuttle Processing has shifted to an insightfocus requiring the use of statistical techniquesfor analyzing system performance data to evaluateCertification of Flight Readiness (COFR), to determinerequirements for enhancement/upgrades, <strong>and</strong>to evaluate contractor performance. Several casestudies were developed to demonstrate the applicationof statistical techniques to assist in the insightrole. Case studies completed during this projectanalyzed <strong>Space</strong> Shuttle system performance dataengineers identified as critical variables indicatingthe health of the associated system (see the table).The analyses provided information that could beused to determine if there is evidence to support theneed for a system enhancement/modification.One of the studies supporting an enhancementwas the potable water case study. Water is a keyingredient to a successful Shuttle mission. Waterstorage space aboard the orbiter is limited to fourpotable water tanks with a usable capacity of 165pounds. Astronauts also use water generated as abyproduct of the electrical generation system whenhydrogen <strong>and</strong> oxygen are combined in the orbiter’sfuel cells. The water produced by the fuel cells isstored in the potable water tanks for use duringflight. It is important to ensure the quality of thewater is satisfactory for human consumption. Tomonitor the quality of the water, the nickel concentrationis measured. Analysis of the nickel concentrationrequires monitoring the stability of the nickelconcentration for each vehicle. To monitor thestability of the nickel concentration, Individual X<strong>and</strong> Moving Range charts were constructed for eachvehicle at 15 (L-15) <strong>and</strong> 3 (L-3) days prior to launch.In the case of Atlantis (OV-104), the Moving Rangechart indicated a stable process, while the IndividualX chart demonstrated a statistically significantpattern indicating that the nickel concentrationshave increased significantly beginning withSTS-66. <strong>Research</strong> shows this coincided with anextended maintenance period at Palmdale, California.Prior to using the statistical analysis tools,system engineers plotted the nickel level versus themission. The resultant charts made it appear theremay have been a worsening nickel level. This casestudy, however, showed the process to be stableafter the initial step function increase was noticed.If statistical quality control techniques had beenused, systems engineers would have reconsideredthe conclusion to remove <strong>and</strong> replace the existingchilled heat exchanger because of the “apparent”continuing increase in the nickel level.Key accomplishments:• 1994: Completion of variable-form data collection<strong>and</strong> analysis on two Thermal ProtectionSystem processes.• 1995: Collaboration with USBI for analysis <strong>and</strong>improvement of solid rocket booster processes.An orbiter structural bonding process improvementeffort was initiated.• 1996: Phase II of the structured experimentationsupporting the orbiter structural bonding processimprovement was completed.• 1997: Held a series of three workshops for NASA<strong>and</strong> contractor engineers to develop skills incollecting, analyzing, <strong>and</strong> interpreting resultsfrom variable-form data.• <strong>1998</strong>: Case studies depicting the application ofstatistical techniques to evaluate COFR <strong>and</strong>determine requirements for enhancements/upgrades were developed.Key milestones:• 1999: Implementation of statistical techniquessupporting process analysis throughout ShuttleProcessing. Implementation of process improvementsrecommended through the case studies<strong>and</strong> measurement of the effectiveness of processchanges. Investigate potential technology transfer/synergyto the Orbiter Reliability-CenteredMaintenance effort, Checkout, Launch <strong>and</strong>110
<strong>Research</strong> <strong>and</strong> <strong>Technology</strong> <strong>1998</strong>Control System project, <strong>and</strong> Integrated Vehicle Health Monitoring. Investigation of key characteristicmethodologies for selecting system performance parameters on which to apply statistical process controltechniques.Contacts: T.L. O’Brien (Timothy.OBrien-2@ksc.nasa.gov), PZ-Q-A, (407) 861-3968; <strong>and</strong> T.S. Barth , PZ-Q-A, (407) 861-6663Participating Organizations: Embry-Riddle Aeronautical University (D. Osborne), NASA/KSC Shuttle Processing (S. Minute,V. Elentri, T. Draus, H. Johnson, S. Greenwell, C. Estrada, C. Mariano, <strong>and</strong> F. Jones), Boeing (T. Damoff), United <strong>Space</strong>Alliance, <strong>and</strong> University of Central Florida (Y. Hosni <strong>and</strong> R. Safford)Case Studies Demonstrating the Application of Statistical TechniquesOrbiter SystemThermal Protection SystemData <strong>and</strong> Subsystem StudiedNose l<strong>and</strong>ing gear door corner laser step <strong>and</strong> gap measurementsOrbiter processing facility dewpoint temperature measurementOrbiter StructuresGuidance, Navigation, <strong>and</strong>Control SystemMain Propulsion SystemOrbiter Maneuvering System/Reaction Control SystemEnvironmental Control <strong>and</strong>Life Support SystemOrbiter MechanismsBond pull testsADTA/AADT test set transducer data from air data systemLH 2 , LO 2 , GH 2 , GO 2 , <strong>and</strong> helium subsystem dataOMS/RCS helium isolation valve data from the helium pressurization subsystemPrimary RCS regulator data from the helium pressurization subsystemNickel concentration data from the supply <strong>and</strong> waste water management systemExtension times from the l<strong>and</strong>ing gear subsystemOrbiter/ET umbilical bolt ultrasonic measurement data from the orbiter/externaltank separation system111
Process/Industrial EngineeringProcess Analysis <strong>and</strong> Modeling: IntelligentAssistant for Optimization ModelingOver the last 40 years, theversatility of optimizationmodeling has established it as apopular decisionmaking aid.Optimization encompasses a suiteof powerful decision supportparadigms that enable the modelingof any decisionmaking environmentin terms of objectives,decisions influencing the objectives,<strong>and</strong> constraints binding thedecisions. However, the potentialof these powerful techniques hasremained largely unharnesseddue to the following inherentdifficulties in constructing optimizationmodels:1. Optimization models typicallyaddress aspects of the domainthat are often hidden or invisibleto casual observers.2. Highly specialized skills arerequired to design <strong>and</strong> generateexecutable models.3. Optimization-based decisionsupport systems typicallydepend on building customsolutions for different domainsituations.4. There are few available toolsable to leverage the expertise ofdomain experts.Preliminary research toalleviate these difficulties wasconducted under a Phase I SmallBusiness Innovation <strong>Research</strong>(SBIR) contract. The centralproduct of this effort was aprototype implementation of theOptimization Modeling Assistant(OMA). Several key Phase Iobjectives were realized duringthis initial effort. The researchteam developed a structuredmethod of optimization modeldevelopment <strong>and</strong> created astructured, ontology-basedmethod for knowledge acquisition<strong>and</strong> analysis. Another keyobjective was to develop a knowledgebase of heuristics, principles,<strong>and</strong> rules that assist inoptimization model development.Templates were created thatencapsulated the knowledge ofoptimization modeling paradigmsfor both applicationspecific<strong>and</strong> generic modeling.The Phase II technologyhardening efforts identifiedanother important factor thatlimits widespread application ofoptimization techniques topractical problems: the unavailabilityof much of the informationneeded for developing optimizationmodels. While optimizationtechniques provide analyticallysound solutions, their successhinges on the availability ofaccurate input data. Often, theinput data required to developvalid optimization models doesnot exist or is unaccessible inmost domains. Recognizing this,Knowledge Based Systems, Inc.,exp<strong>and</strong>ed the architecture of thePhase II OMA to include simulation-basedoptimization. Simulationwill be used to generate thenecessary input data, which isthen used by OMA for optimization.Using the two powerfuldecision support techniquestogether, OMA will delivercomprehensive decision supportanalysis capabilities to managers<strong>and</strong> decisionmakers. The enhancedOMA software implementationwas completed in <strong>1998</strong> (seethe figure).Phase III activities planned in1999 include (1) exercising theOMA software with KSC domaindata, (2) refining the OMA forcommercial applications, <strong>and</strong> (3)demonstrating the OMA onsustainment <strong>and</strong> remanufacturingapplications at Tinker Air ForceBase, Oklahoma City, Oklahoma,as part of another Phase II SBIRinitiative.Key accomplishments:• 1996: Completion of the PhaseI SBIR contract. Developmentof a prototype OMA. Selectionfor Phase II follow-on research.• 1997: Defined the OMA prototype<strong>and</strong> templates. DesignedOMA extensions for simulation-basedoptimization. DevelopedKSC process modelsfor the OMA application.• <strong>1998</strong>: Prototyped simulationbasedoptimization. CompletedOMA implementation.Acquired KSC domain data forthe OMA application.Key milestones:• 1999: Complete the OMAapplication at KSC. Demonstratethe OMA at Tinker AirForce Base. Commercialize theOMA.Contacts: T.L. O’Brien (Timothy.OBrien-2@ksc.nasa.gov) <strong>and</strong> D. Correa,PZ-Q-A, (407) 861-5428Participating Organization: KnowledgeBased Systems, Inc. (Dr. P.C. Benjamin)112
<strong>Research</strong> <strong>and</strong> <strong>Technology</strong> <strong>1998</strong>Knowledge AcquisitionInterrogatorProcess <strong>and</strong>Ontology CaptureExperimentCaptureTopology <strong>and</strong>Template MatcherTemplates <strong>and</strong>Mapping RulesOptimizationDesignerDomainModelsSimulationDesignerExperimentSpecificationsOMA Conceptual ArchitectureOptimization ModelingOptimizationModelsOptimizationEnginesSimulationEnginesSimulationModelsSimulationOptimizationManager113
Process/Industrial EngineeringProcess Analysis <strong>and</strong> Modeling:Vision <strong>Space</strong>port Model DevelopmentKnowledge Base • Affordability DriversConceptOperationsFactorsDem<strong>and</strong> DrivenEconomics(lb/year)Concept DesignQuestionsThere is a need for a betterunderst<strong>and</strong>ing of the interactionsthat occur between flightsystems <strong>and</strong> their requiredlaunch infrastructure (the spaceport).Visibility <strong>and</strong> underst<strong>and</strong>ingof these interactions areneeded to dramatically improvethe design of future launchsystems with a focus on reducingthe cost of access to space. Areduction in the cost can only beachieved with designs thatimprove life-cycle cost factors,one of the main objectives of theVision <strong>Space</strong>port project. TheVision <strong>Space</strong>port project has agoal to develop models that allowvehicle designers to underst<strong>and</strong>the effect of vehicle design parameterson spaceport operations.Payload/Cargo Processing FacilitiesTraffic/Flight Control FacilitiesLaunch FacilitiesL<strong>and</strong>ing/Recovery FacilitiesVehicle Turnaround FacilitiesVehicle Assembly/Integration FacilitiesVehicle Depot Maintenance Facilities<strong>Space</strong>port Support Infrastructure FacilitiesConcept-Unique Logistics FacilitiesTrans. Sys. Ops Plan. & Management Fac.Expendable Element FacilitiesCommunity Infrastructure12<strong>Space</strong>port OperationsModules/FacilityFunctionsNonrecurring Factors(Vehicle Development Cost,Purchase Costs, etc.)Module Assessment IndexDatabaseSINGLE VehicleProductivityMeasures ($, Times,Each Facility)FLEET/SPACEPORTProductivity Measures($, Times, # of Facilities,# of Vehicles)Life Cycle Measures<strong>and</strong> $/lb vs. Flight RateFigure 1. <strong>Space</strong>port Model Definition <strong>and</strong> AATe Basic StructureThe required models will providevehicle designers with criticalmeasures of performance thatdefine system costs (for example,single vehicle flight rate, the type<strong>and</strong> number of facilities required,<strong>and</strong> the cost of operations perflight).During the summer of <strong>1998</strong>, aVision <strong>Space</strong>port project taskdeveloped a prototype model thatcombined a knowledge-basedapproach with existing data. Themodel, called the ArchitecturalAssessment Tool - enhanced(AATe), is traceable to the nationalteam called the <strong>Space</strong>Propulsion Synergy Team <strong>and</strong>supports NASA’s Highly Reusable<strong>Space</strong> Transportation study.The tool uses a series of multiattributeutility functions tocorrelate concept design parametersto spaceport facility requirements.These functions capturenot only the relation of a particularchoice to the outputs but alsothe strength or importance of thebroader context being addressed.In this way, the model behaveswith some similarity to “realworld” interactions <strong>and</strong> thusreflects cost <strong>and</strong> performancecause <strong>and</strong> effect.The cost assessment for avehicle concept is based on how itinteracts with 12 generic spaceportoperational modules (figure1) that represent functional costcenters. Each module has aknowledge-based utility functionthat is calculated as the userinputs the concept vehicle (figure2). Inputs consist of a set of114
<strong>Research</strong> <strong>and</strong> <strong>Technology</strong> <strong>1998</strong>Figure 2. User Interfacequestions for the concept beingassessed, <strong>and</strong> these questions arebased on the knowledge captureof spaceport cost drivers. Thedata set used to calculate themeasures of performance includesa baseline (the Shuttle inthis case) as well as a series ofextrapolations, which are higheror lower costs <strong>and</strong> cycle times.Key accomplishments (<strong>1998</strong>):• Model methodologies thatintegrate flight architectureswith the ground infrastructure(spaceport); that correlatespaceport modules to anintegrated single vehicleperformance (flight rate,operational cost, <strong>and</strong> investmentcost); <strong>and</strong> that assess lifecyclecosts for various dem<strong>and</strong>scenarios.• Software that tested all thepreviously mentioned methodologies.Key milestones (1999 <strong>and</strong> 2000):• Working product for top-levelvehicle system architectures.• Use of the tool in space launchassessments.Contacts: C.M. McCleskey (Carey.McCleskey-1@ksc.nasa.gov), PK-K,(407) 861-3775; E. Zapata, PK-G, (407)861-3955; <strong>and</strong> R.E. Rhodes, PK-G, (407)861-3874Participating Organizations: Ames<strong>Research</strong> Center, Comm<strong>and</strong> <strong>and</strong> ControlTechnologies, Boeing, Lockheed Martin,United <strong>Space</strong> Alliance, University ofCentral Florida Center for Simulation<strong>and</strong> Training, <strong>and</strong> Florida Gulf CoastUniversity (A.J. Ruiz-Torres)115
Process/Industrial EngineeringProcess Analysis <strong>and</strong> Modeling: Intelligent Synthesis EnvironmentIn recent years, NASA has beenchallenged to perform missionsunder reduced budgets <strong>and</strong>decreased timelines. NASA hasalso recently implementedchanges in structure that reduceduplication of engineering resourcesthroughout the Agency.Centers of Excellence have beenestablished to focus technicalexpertise in response to a shrinkingwork force. Therefore, manyengineering tasks that once couldbe accomplished completelywithin one NASA center nowmust be distributed among thecenters to capture the necessarylevel of technical expertise. Thedistributed nature of NASA’stechnical expertise <strong>and</strong> the needto perform in a “faster, better,cheaper” environment havedriven the Agency to developnew capabilities. At the sametime, NASA has been asked tohelp lead U.S. companies into the21 st century through a deploymentof cutting-edge systems at alevel of affordability that has notbeen seen to this date.The Intelligent SynthesisEnvironment (ISE) program seeksto address the geographicalchallenges as well as help improvethe engineering tools,technologies, <strong>and</strong> methodologiesfor NASA <strong>and</strong> U.S. industry. Ingeneral, these have not advancedsignificantly over the past severalyears. A plan is being madewhereby technologies developedin the NASA research centers ortheir partners are deployed asprototypes across the Agency. Asthese become mature, contractorschosen to maintain the prototypeswill be able to market them toU.S. industry. With the commercialization<strong>and</strong> subsequent reductionof the cost of these systems, itis hoped the private sector will beable to benefit from the systemsengineering efforts funded byNASA.The Agency started theprocess this year by deploying aCollaborative Engineering Environment(CEE) infrastructureacross the Agency. Each centerreceived one of the Core CapabilityRooms with the option to buymore out of their own budgets.The Core Capability Roomscontain audio <strong>and</strong> videoconferencing as well as a dataconferencing capability throughnetmeeting. These rooms aremaintained through a contractorset up to h<strong>and</strong>le the Agency’sneeds.Reentry Thermal Analysis (From Langly <strong>Research</strong> Center)In the next year, the plan is todeploy the Immersive Environment(IE) or 3-D data visualizationtools as well as a data storageinfrastructure to support Agencywidereality conferencing. Withthese tools in place, the Agencywill have the capability to develop<strong>and</strong> run systems through acomplete life cycle in a syntheticenvironment. This will aid in theunderst<strong>and</strong>ing of the complexissues involved in the development<strong>and</strong> deployment of spacetechnologies without reliance onexpensive physical modeling orpaper analysis.116
<strong>Research</strong> <strong>and</strong> <strong>Technology</strong> <strong>1998</strong>International <strong>Space</strong> Station Simulation (From Langly <strong>Research</strong> Center)In the future, NASA as well as industry <strong>and</strong> academia partnerswill develop new tools <strong>and</strong> methodologies that address the flow ofinformation from initial concept through manufacturing.Key accomplishments:• <strong>1998</strong>: The NASA ISE Team was formed; the initial kickoff meetingwas held; <strong>and</strong> the initial collaborative infrastructure was deployed.Key milestone:• 1999: Install IE’s at all centers <strong>and</strong> a data storage infrastructureacross the Agency.Contacts: M.P. Conroy (Michael.Conroy-1@ksc.nasa.gov), VC-B1, (407) 867-4240;<strong>and</strong> T.E. Fredrickson, MM-G1-B, (407) 867-2970117
Process/Industrial EngineeringProcess Analysis <strong>and</strong> Modeling:Virtual Shuttle Processing ModelThe Virtual Shuttle Processing(VSP) Collaborative EngineeringEnvironment (CEE) project isdeveloping new engineering tools<strong>and</strong> capabilities at KSC. The newtechnologies allow engineers tobring their efforts to the next levelof excellence <strong>and</strong> st<strong>and</strong>ardizetheir use across all NASA centers.Level 1 consists of basic dataconferencing <strong>and</strong> is being providedthrough ODIN for KSCdesktops <strong>and</strong> some conferencerooms. Level 2 consists of audio,video, <strong>and</strong> data conferencing.Level 3 adds the immersiveenvironment <strong>and</strong> reality conferencingcapability to the audio,video, <strong>and</strong> data conferencing.The VSP model is beingdeveloped to enhance engineeringdesign, improve processing,<strong>and</strong> enhance technical training.Maintenance of the Shuttleorbiter in its processing facility isbeing modeled.Key accomplishments:• <strong>1998</strong>: Project initiation. Deliveryof Level 1 <strong>and</strong> Level 2 CEEcapabilities.Key milestone:• 1999 <strong>and</strong> beyond: Delivery ofLevel 3 CEE capabilities <strong>and</strong>multiple applications.Contacts: M.M. Groh-Hammond(Marcia.Groh-Hammond-1@ksc.nasa.gov), PZ-Q-A, (407) 861-0572; <strong>and</strong>K. Iftikhar, PZ-Q-A, (407) 861-6671Participating Organizations: United<strong>Space</strong> Alliance, Boeing Aerospace, <strong>and</strong>NASA/Ames118
<strong>Research</strong> <strong>and</strong> <strong>Technology</strong> <strong>1998</strong>Automation<strong>and</strong> RoboticsThe Automation <strong>and</strong> Robotics program at the JohnF. <strong>Kennedy</strong> <strong>Space</strong> Center (KSC) is focused on advanceddevelopment cutting-edge technologies toenhance KSC’s core mission of launch <strong>and</strong> l<strong>and</strong>ingground operations. The program also provides apartnering with other NASA research centers to demonstrateadvanced mobile base ground processing technologiesfor problems that must be addressed <strong>and</strong> solved forfuture space missions, such as remote autonomous Marsoperations. In this role, KSC is developing state-of-the-arttechnologies in sensors, mechanisms, manipulators, <strong>and</strong> mobile bases for ground operations thatcan be applied to future NASA mission scenarios. This field testing has selected space missiontechnologies that are also applicable to ground processing applications <strong>and</strong> problem areas. KSCprovides the opportunity to take these technologies out of the laboratory <strong>and</strong> apply them toactual ground operations at KSC. Technologies addressed in this section include advanced cableinspection capabilities, improved data collection <strong>and</strong> intuitive graphical user interfaces, <strong>and</strong>automation of large mechanical load-carrying devices.<strong>Technology</strong> areas that KSC is working to develop <strong>and</strong> apply include: integration of real-timecontrols with advanced information systems, obstacle-avoidance sensors <strong>and</strong> systems,multidegree-of-freedom robotic devices <strong>and</strong> systems, intelligent control systems, imbedded <strong>and</strong>distributed controls, inspection sensors <strong>and</strong> systems, integration of advanced software technologiesin control <strong>and</strong> sensor interpretation, <strong>and</strong> model- <strong>and</strong> rule-based systems for health monitoring<strong>and</strong> diagnosis. All these technologies can be applied to automating ground processing tasks.Application areas that are currently being addressed in this year’s report include the SolidRocket Motor Stacking Enhancement Tool, Automated Ground Umbilicals, <strong>and</strong> the Cable LineInspection Mechanism.119
Automation <strong>and</strong> RoboticsAdvanced Life Support Automated RemoteManipulator (ALSARM)The objective of the ALSARMproject is to develop a prototypesystem to take environmentalmeasurements inside theBiomass Production Chamber(BPC) breadboard project (alsoknown as the Controlled EcologicalLife Support System orCELSS) at KSC. The BPC isoperated by the Advanced LifeSupport project office (JJ-G). TheALSARM is performed in conjunctionwith the University ofCentral Florida (UCF). A twosemesterdesign course at UCFresulted in several concepts forthe ALSARM. KSC <strong>and</strong> UCFdecided on a final concept thatmeets all the system <strong>and</strong> BPCrequirements. The project iscomplete <strong>and</strong> operational. PhaseII of the ALSARM project (developmentof an end-effector to takeplant samples remotely) willbegin in late <strong>1998</strong>.The BPC consists of twoseparate levels used to growcrops in an almost totally enclosedenvironment. The BPCwill help NASA underst<strong>and</strong> howto grow crops in space for Moonor Mars bases. During the courseof study, technicians have to enterthe chamber to measure environmentalparameters such as airtemperature, infrared temperature,relative humidity, air velocity,<strong>and</strong> light intensity. Entry ofpersonnel into the BPC disturbsthe environment in several ways.The opening of the chamber dooraccounts for about half the chamberdaily leak rate. The technicianscontaminate the environmentby their respiration, whichexpels carbon dioxide <strong>and</strong> organicproducts. The mere presenceof technicians can modifythe air flow patterns in the BPC.The environmental measurements,which take about an hour,are performed serially. Also, it isdifficult for people to take measurementsat exactly the samepoints from one type of measurementto another or from one testto another. The ALSARM will bean automated method of takingthese measurements that willeliminate personnel entry, reducethe chamber leak rate, <strong>and</strong> allowmore consistent measurements.The ALSARM integrates stateof-the-artsystems in control,mobility, manipulation, informationmanagement, <strong>and</strong> sensortechnologies to perform the BPCenvironmental measurements.The system will be exp<strong>and</strong>ed toinclude an end-effector (or tool)on the manipulator to take plantsamples <strong>and</strong> eventually performother functions such as planting<strong>and</strong> harvesting. This end-effectorwill be developed during Phase IIof the ALSARM project thatstarted in August <strong>1998</strong>.Key design features of theALSARM include: (1) automatedcontrol via a tether cable, (2) a 3-degree-of-freedom robot manipulator,(3) multiple sensor array, (4)interfaces to existing NASAdatabases, <strong>and</strong> (5) developmentof an end-effector for plantsampling.ALSARM in the BPCThe accomplishments for <strong>1998</strong>include completion of operationaltesting at the BPC, fabrication of a120
<strong>Research</strong> <strong>and</strong> <strong>Technology</strong> <strong>1998</strong>replacement sensor array, startup of Phase II (endeffector),<strong>and</strong> development of a preliminary endeffectordesign.Completion of the preliminary end-effectordesign <strong>and</strong> fabrication of the replacement sensorarray were the major efforts for the remainder of<strong>1998</strong>.Key accomplishments <strong>and</strong> milestones:• August 1993: Project initiated <strong>and</strong> conceptdesigns evaluated.• June 1994: Final report <strong>and</strong> design conceptcompleted.• October 1994: Systems requirements reviewcompleted.• October 1994: 30% design review.• November 1994: 60% design review.• November 1994: 90% design review.• December 1994: Final review.• March 1995: Redesign of horizontal telescopingarm started.• August 1995: Redesign of horizontal telescopingarm finished.• October 1997: Fabrication of the ALSARM complete.• December 1997: Laboratory testing of theALSARM complete.• July 1997: Installation of the ALSARM into theBPC.• August 1997 to January <strong>1998</strong>: Activation <strong>and</strong>validation testing of the ALSARM.• January to August <strong>1998</strong>: Development <strong>and</strong>fabrication of a replacement end-effector.• Late <strong>1998</strong>: Development of the ALSARM endeffector.Contacts: M. Hogue (Michael.Hogue-1@ksc.nasa.gov), MM-G3, (407) 867-1720; W.C. Jones, MM-G3, (407) 867-4181;A.J. Bradley, MM-G3, (407) 867-1720; <strong>and</strong> Dr. J.C. Sager, JJ-G, (407) 853-5142Participating Organization: University of Central Florida(Dr. R. Johnson)MotorsFlexible ShaftsGripper/CutterALSARM End-Effector Preliminary Design121
Automation <strong>and</strong> RoboticsAdvanced Payload Transfer MeasurementSystem (APTMS)The objective of this project isto develop a simple, robust,centrally operated, <strong>and</strong> portablesystem to automatically measureXo, Yo, <strong>and</strong> Zo offsets betweenthe trunnions <strong>and</strong> their supportduring payload transfer operationsin the Vertical ProcessingFacility, Orbiter ProcessingFacility, Operations <strong>and</strong> CheckoutBuilding, <strong>and</strong> Payload ChangeoutRoom. Each trunnion will beinstrumented <strong>and</strong> the misalignmentwill be displayed to themove conductor. Future expansioncapabilities include fastcalculation of the next movecomm<strong>and</strong> <strong>and</strong> closed-loop controlof the operation. Key designfeatures of the APTMS include:• Quick Xo, Yo, <strong>and</strong> Zo measurement<strong>and</strong> display of data tomove the conductor• Small <strong>and</strong> portable transducer• Versatile design for use at theVertical Processing Facility,Orbiter Processing Facility,Operations <strong>and</strong> CheckoutBuilding, <strong>and</strong> PayloadChangeout Room• Off-the-shelf optical encodersfor angle measurement• Laptop computer for ease ofportable data analysis <strong>and</strong>display• Wireless port connectionbetween a laptop <strong>and</strong> dataacquisition system• Programming capability tocalculate the next move comm<strong>and</strong>• First step for payload transferautomation at the VerticalProcessing Facility <strong>and</strong> PayloadChangeout RoomBenefits of the APTMS include:• Capability enhancements• Reduction of time <strong>and</strong> cost forpayload transfer• Increase in measurementaccuracy <strong>and</strong> reliability; reductionof error opportunities• Increase in payload <strong>and</strong> techniciansafety• Avenue for payload transferautomation of four differentlocationsCommercial applications of theAPTMS include:• Crane operations• Construction• Assembly• Manufacturing• Automotive• AerospaceKey accomplishments <strong>and</strong> milestones:• Mechanical, electrical, <strong>and</strong>software system testing hasbeen completed. Furtheradjustments are in work tomeet the positioning requirementsof 0.05 inch at a 6-inchrange.• 1995: Developed prototypeunit.122
<strong>Research</strong> <strong>and</strong> <strong>Technology</strong> <strong>1998</strong>APTMS in Operation• 1996: Tested prototype unit <strong>and</strong> made modifications.• 1997: Started development of production unit, design, <strong>and</strong> fabrication.• <strong>1998</strong>: Completed production unit <strong>and</strong> tested <strong>and</strong> implemented modifications to enhanceaccuracy <strong>and</strong> ease of calibration. Developed a demonstration simulation tool for presentationto customers.Contacts: W.C. Jones (William.Jones-3@ksc.nasa.gov), MM-G3, (407) 867-4181; <strong>and</strong> E. Lopez Del Castillo <strong>and</strong>F. Soto Toro, MM-G3, (407) 867-8005123
Automation <strong>and</strong> RoboticsAutomated Umbilical Mating <strong>Technology</strong>Numerous launch vehicles, planetary systems, <strong>and</strong> rovers requireumbilical mating for fluid flow <strong>and</strong> electrical connections. Simple,reliable, autonomous mating is required to make certain missions <strong>and</strong>systems feasible (i.e., Mars methane fueled rovers) <strong>and</strong> to provide lowcost,safe launch operations. The environment for mating (temperature,humidity, dust, cost, weight, <strong>and</strong> power) varies drastically fromsystem to system. However, a common core technology <strong>and</strong> numeroussensor <strong>and</strong> mating techniques are needed to provide low-cost,common solutions for all systems. The technical approach involvesthe following:• Development of a smart umbilical with a reconnect capability (Thisproject will leverage off an existing Small Business Innovation<strong>Research</strong> (SBIR) project <strong>and</strong> additional available hardware.)• Autonomous or remote operationsusing vision systems,force feedback, miniaturizedgas detection, <strong>and</strong> state-of-theartreal-time control• Umbilical that provides thecapability to connect, disconnect,<strong>and</strong> reconnect during anypoint in the launch countdownprocess• Investigation of various sensor<strong>and</strong> mechanism concepts fordifferent mating environmentsSBIR Smart UmbilicalExisting IRB RobotUsed for Flight-SideExcursions124
<strong>Research</strong> <strong>and</strong> <strong>Technology</strong> <strong>1998</strong>The benefits to NASA missionsinvolve the following:• Autonomous methane-fueledMars exploration rovers (requiredfor Mars sample return)• Capability to connect, disconnect,<strong>and</strong> reconnect during anypoint in the countdown processfor the Reuseable LaunchVehicle (RLV), Liquid FlybackBooster (LFBB), <strong>and</strong> EvolvedExpendable Launch Vehicle(EELV) (Low-cost, high-reliabilityautonomous mating willenhance all future launchvehicles.)• Cheaper, safer launch operations• Increased launch reliabilityCurrently, a Phase II SBIRproject is investigating <strong>and</strong>developing a highly reliable, safe,<strong>and</strong> smart automated ground/flight umbilical carrier plate forremote installation <strong>and</strong> removal.The umbilical plate will containmultiple service connections forcryogenic propellants, pneumatics(gaseous nitrogen <strong>and</strong> gaseoushydrogen), environmental controlgases, <strong>and</strong> electrical power <strong>and</strong>data. The umbilical will have theability to mate, demate, <strong>and</strong>remate with little or no humanintervention. Flight side <strong>and</strong>ground side will be demonstratedwith dynamic excursions basedon real-world data.The smart umbilical matingsystem will provide for two fluidconnections <strong>and</strong> four electricalconnections. After the operatormanually drives the umbilical towithin its alignment area, thevision control system will takeover <strong>and</strong> drive the umbilical tomate with the flight-side plate.The operator has the option togive the final permission toperform each step in the matingprocess <strong>and</strong> can interrupt themating process at any time.When the mating process isinterrupted, the umbilical willreturn to the previous safe step inthe mating process or will returnto the home position, dependingon how it is interrupted.After the umbilical plate hasbeen connected <strong>and</strong> latched to theflight-side plate, the umbilicalsystem goes into a passive mode,whereby it follows the excursionsof the flight side. Then theelectrical <strong>and</strong> fluid connectionsare verified for leaks <strong>and</strong> connectivity.The operators will accesssystem controls through thesoftware loaded into the controlconsole computer. From thisconsole, the operator will havecontrol of <strong>and</strong> feedback from theentire system as well as thecamera view of the vision system.All data acquisition hardware isalso interfaced to this industrialcomputer. Additional designrequirements include:• Compliant self-aligningground-side carrier plate• Traceability to a nonsinglepoint failure design• Real-world dynamic <strong>and</strong> staticvehicle excursions• Quick <strong>and</strong> reliable remoteverification of interface integrity• IRB 90 robotic arm to mimicvehicle excursionsKey accomplishments <strong>and</strong> milestones:• June <strong>1998</strong>: Completion of theSBIR mechanical design.• October <strong>1998</strong>: Completion ofthe SBIR electrical design.• 1999: Completion of the SBIRautomated umbilical <strong>and</strong> test<strong>and</strong> modify to provide fullautomation capability.Contacts: T.C. Lippitt (Thomas.Lippitt-1@ksc.nasa.gov), MM-G3, (407) 867-1720; <strong>and</strong> W.C. Jones, MM-G3, (407)867-4181125
Automation <strong>and</strong> RoboticsPayload Ground H<strong>and</strong>ling Mechanism(PGHM) AutomationThe PGHM is located in thePayload Changeout Rooms of<strong>Space</strong> Shuttle Launch Pads A <strong>and</strong>B at KSC. The PGHM is used toremove or insert the Shuttlepayload from both the orbiterpayload bay <strong>and</strong> the payloadtransport canister. The PGHMprovides the capability to load/access payloads when the vehicleis at the launch pad. Upgrades toPGHM systems are required toprovide United <strong>Space</strong> Allianceoperations personnel the capabilityto process vertical payloads ina safer <strong>and</strong> more efficient environment.The PGHM consists ofthe following mechanisms:• Power X: coarse verticalmotion• Power X Stop Nut: redundantsafety feature of Power X• Power Y: coarse side-to-sidemotion• Payload Support Beam X(PLSB X): fine vertical motion• Payload Support Beam Z(PLSB Z): fine insert <strong>and</strong>retract motion• Stem Strain: PGHM weightdistribution stability• J-Hooks: X, Y, <strong>and</strong> Z: very finemotionThe current PGHM designuses pneumatics <strong>and</strong> manpowerfor axis actuation. Throughautomation, position feedbackcircuits, <strong>and</strong> the elimination ofhazardous manual drive systems,the proposed upgrades willprovide a safer, more efficientprocessing environment. Theproject scope will be divided intotwo major efforts:1. Automated Control of Mechanisms.The Power X, Power XStop Nut, Power Y, PayloadSupport Beam X, PayloadSupport Beam Z, <strong>and</strong> StemStrain mechanisms will beautomated using commercialoff-the-shelf electronic controlsystems. Numerous hardwarecriticalfailure points <strong>and</strong>human-intervention-dependentoperations will be eliminated.A centralized controlconsole with a graphical userinterface will be provided forthe PGHM Move Director tocomm<strong>and</strong> operations. Themain objectives are to:• Eliminate the hardware singlefailure points.• Eliminate the operations inwhich human error couldcause hardware damage orhuman injury.• Provide better control <strong>and</strong>feedback to the payload MoveDirector <strong>and</strong> technicians.• Increase the operational efficiency<strong>and</strong> reduce the numberof personnel required forpayload transfer.2. J-Hook <strong>and</strong> Orbiter-to-PayloadPosition Measurement Study.J-hook <strong>and</strong> orbiter-to- payloadposition measurement requirementswill be detailed <strong>and</strong> thesystem design approach will bedetermined in a study.Contacts: W.C. Jones (William.Jones-3@ksc.nasa.gov) <strong>and</strong> A.J. Bradley,MM-G3, (407) 867-4181Participating Organizations: United<strong>Space</strong> Alliance <strong>and</strong> Dynacs EngineeringCo., Inc.126
<strong>Research</strong> <strong>and</strong> <strong>Technology</strong> <strong>1998</strong>NTSCADAServerOfficeWorkstationWindows 95/98NTWorkstationGatewayNeuralNetWorkstationTCP/IP100BTFiberWirelessPCWithinternalI/O CardsPCWithPLCSubtiersDH+HMIModbusPassiveBackplanePC(PGHM TestPlatform)HMIEthernetMotionControllerIRDA PortFoundationField BusPLCDirectConnectionTo EthernetSLC5PLC5Ethernet I/ODevice NetWirelessEmbeddedPC ControllerCompressedVideo/AudioPLCPLCWirelessOfficeNodeIntegrated PC-BasedControl PendantMultiplexedVisionIntegrated Operations Development System127
Automation <strong>and</strong> RoboticsCable <strong>and</strong> Line Inspection Mechanism (CLIM)Biannual inspections of theseven slide-wire cables usedin the Emergency Egress Systemat both Launch Pads A <strong>and</strong> Brequire inspection crews tovisually verify the integrity of thecable as the crews are lowereddown the cable in the slide-wirebaskets. Due to the type of cableused as slide-wires (i.e., stainlesssteel), magnetic resonant devicesnormally employed to inspectcables are inadequate. This manintensive<strong>and</strong> time-consumingoperation prompted a request tothe Automated Ground SupportSystems Laboratory to develop ast<strong>and</strong>-alone system for automatedcable inspection. In addition, nomethod exists for inspection ofthe lightning cables at eachlaunch pad due to their inaccessibility.The cable failures to be identifiedby the automated system, perthe applicable Operations <strong>and</strong>Maintenance RequirementsDocument (OMRS File IV), arecharacterized by frayed str<strong>and</strong>s,bird nesting, stretching, <strong>and</strong>corrosion. The cable undergoesload testing on a periodic basis<strong>and</strong> is man rated by weightingthe egress baskets with s<strong>and</strong>bags<strong>and</strong> sending them down thecable. Consequently, this is not atask for the automated system.The inspection teams rely on avisual inspection of the surface ofthe cables with a cursory check ofthe cable diameter using a go/nogogage every 10 feet. The targetedcables were identified tohave an inclination of no morethan 45 degrees, a length ofapproximately 1,200 feet, <strong>and</strong> adiameter of 1/2 to 3/4 inch.Finally, a prototype unit hadalready been developed for theproject but required testing. Aproduction unit based on theprototype design was needed.control scheme using a radiofrequency control system forradio-controlled airplanes wasemployed. A method of measuringthe cable diameter was found.Finally, a microcomputer tocontrol the unit was used. Due tothe limited accessibility to powerover the distances involved, theunit operates on batteries.The prototype unit was testedon 300 feet of guy wire supportingthe 500-foot weather towernorth of the Vehicle AssemblyBuilding. The guy wire was 3/4inch thick <strong>and</strong> at an inclination of15 degrees. The unit was operatedon the cable until the distancesrequired for the slide-wireinspections were obtained. Thedata captured from the test wasgraphed for demonstration.Problems were identified <strong>and</strong>alternate equipment was chosen.Currently, the manufacture of aproduction unit is in process foruse by the customer. A 75-percentdrawing package has been released.Key accomplishments:• 1997: Identified customerrequirements.• <strong>1998</strong>: Tested the prototypeunit. Manufactured the productionunit.Key milestone:• 1999: Assemble, test, <strong>and</strong> turnover the production unit.Contacts: W.C. Jones (William.Jones-3@ksc.nasa.gov), MM-G3, (407) 867-4181; <strong>and</strong> R.L. Morrison, MM-G3,(407) 867-4156CLIM Cable VideoParticipating Organizations: NASAMM-G3 (R. Morrison, J. Bonner, <strong>and</strong>M. Hogue), NASA PK-J (K. Nowak),NASA MM-E (J. Richards-Gruendel<strong>and</strong> L. Parrish), <strong>and</strong> United <strong>Space</strong>Alliance (G. Hajdaj <strong>and</strong> M. Olka)128
<strong>Research</strong> <strong>and</strong> <strong>Technology</strong> <strong>1998</strong>Prototype Unit on the Test CableLaunch Pad Tower View of the Slide Wires129
Automation <strong>and</strong> RoboticsThe objective of the OmniBotproject is to develop a hazardousduty mobile base as anadvanced development test bedto research alternate technicalapproaches for remotely controlledoperations in hazardousareas. In addition, this base willbe used to test various automatedumbilical technologies for autonomousmobile vehicles. Inhazardous environments where itis too dangerous to send inunprotected personnel, a mobilebase could be used to performremote inspections, site surveys,<strong>and</strong> operations.OmniBot Mobile BaseThe OmniBot is driven withfour brushless servomotorsconnected to omnidirectionalwheels (Mechanum). This allowsfor complete 2-degree-of-freedommotion, which results in extremelyhigh maneuverability.The benefit of this motion profilecan truly be appreciated when thevehicle is operated in a teleoperationalmode.Currently the vehicle can becontrolled with a radio frequency(RF) control box or with ahardwired joystick. With thevideo transmission gear installed,teleoperation is possible up to adistance of 1,800 feet.The next phase in the projectis the construction of anoperator’s control station, asensor package, <strong>and</strong> manipulatorsystems.Key accomplishments <strong>and</strong> milestones:• January 1997: Construction ofthe motion base.• June 1997: Testing of themotion base <strong>and</strong> control system.• March <strong>1998</strong>: Construction ofthe RF control system.• August <strong>1998</strong>: Selection/procurement of the multitaskingsystem.• September <strong>1998</strong>: Installation ofthe video RF gear.Contacts: T.C. Lippitt (Thomas.Lippitt-1@ksc.nasa.gov) <strong>and</strong> W.C. Jones, MM-G3, (407) 867-4181OmniBot Mobile BaseCloseup of Omni (Mechanum) Wheels130
<strong>Research</strong> <strong>and</strong> <strong>Technology</strong> <strong>1998</strong>Electro-Mechanical ActuatorThe objective of the Electro-Mechanical Actuator(EMA) project is to evaluate <strong>and</strong> demonstratethe viability of electro-mechanical actuators toreplace pneumatic actuation for use in launchprocessing ground support equipment (GSE) atKSC. The current pneumatic actuation systems,such as the cryogenic fuel <strong>and</strong> oxidizer systems,firex systems, sound suppression system, etc.,require high maintenance <strong>and</strong> the components arebecoming old <strong>and</strong> obsolete. These systems arelocated at the launch pads <strong>and</strong> are exposed to therigors of launch <strong>and</strong> the high humidity <strong>and</strong> saltyseaside environment. Use of EMA’s has the potentialto reduce the complexity <strong>and</strong> number of componentsrequired by as much as 80 percent.Commericial off-the-shelf electro-mechanical actuatorsare being evaluated, <strong>and</strong> methods of providinghigh reliability through redundancy are beingaddressed. Higher position accuracy <strong>and</strong> repeatabilityare also potential benefits from the use ofEMA’s.The EMA system consists of one electromechanicalactuator controlled by two program-mable logic controllers (PLC’s) <strong>and</strong> two servodrivesin a parallel configuration for highly reliableoperation. Commercial use of single-string controlusing PLC’s <strong>and</strong> servo-drives for EMA’s has proventhese system components to be highly reliable,accurate, <strong>and</strong> economical. Once studied <strong>and</strong> provenfor dual-control redundancy, the concept couldprovide the same benefits for critical systems.Key accomplishments <strong>and</strong> milestones:• April <strong>1998</strong>: Design <strong>and</strong> layout of the EMA testplan.• June <strong>1998</strong>: Procurement <strong>and</strong> mounting of AllenBradley PLC’s <strong>and</strong> servo-drives.• September <strong>1998</strong>: Procurement of Class I, DivisionI, electro-mechanical actuators manufactured byExlar Corporation.• January 1999: Testing <strong>and</strong> evaluation of EMAconfigurations, operating characteristics, <strong>and</strong>reliability <strong>and</strong> repeatability.Contacts: W.C. Jones (William.Jones-3@ksc.nasa.gov), MM-G3, (407) 867-4181; <strong>and</strong> T.H. Miller, MM-G3, (407) 867-4156Participating Organizations: NASA Process EngineeringDirectorate <strong>and</strong> United <strong>Space</strong> Alliance131
Automation <strong>and</strong> RoboticsSolid Rocket Motor (SRM) StackingEnhancement Tool (SSET)The NASA Automated GroundSupport Systems Lab (MM-G3) of the Engineering DevelopmentDirectorate is developingthe SSET, a mobile data acquisitionsystem used to monitor the<strong>Space</strong> Shuttle solid rocket motorstacking process in the VehicleAssembly Building (VAB) at KSC.Four SRM segments are matedtogether to form a solid rocketbooster, with two completedboosters used for each <strong>Space</strong>Shuttle. SRM segments areattached to a four-point liftingbeam, a device that can vary theload of each of its attachmentpoints <strong>and</strong> modify the segmentshape to match that of its partner.The entire assembly is thenLifting Beamhoisted by a crane <strong>and</strong> loweredonto the SRB under construction.The segment junction points, orfield joints, are critical interconnectionswhose failure couldcause a catastrophe.The stacking process takesmany hours <strong>and</strong> is manpowerintensive, so delays due to systemfailures are costly. The SSETreplaces <strong>and</strong> combines the functionsof two antiquated systemsalready in use, the Temposonicsmeasurement system <strong>and</strong> thelifting beam load panel. TheTemposonics measurementsystem is composed of four onedimensional(1D) sensors (whichare located at 90-degree intervalsbetween the two segments) <strong>and</strong> adata acquisition computer system(used to display <strong>and</strong> record thenumerical measurements). Themeasurements are used to determinethe distance to mate, levelness,<strong>and</strong> lowering rate. Thelifting beam load panel uses sixstrain-gage-type load cells locatedin the SRM lifting beam to measurethe loads <strong>and</strong> levelnessforces of the suspended segment.Currently, no data recording isavailable for the loads.The SSET provides currenttechnology data acquisitionequipment to measure the existingsensors. Some benefits of theSSET are:• A single display unit reducesthe number of equipment items(figure 1).• The information is displayedon an intuitive graphical userinterface <strong>and</strong> is easy to interpret(figure 2).DTM SensorsSSET Panel• All measurement data will berecorded.• The modular design allows forsystem modifications <strong>and</strong>updates.Connector PanelFigure 1. SRM Stacking Enhancement ToolControlPanelUPSPowerPlugGroundLug• The onboard uninterruptiblepower supply (UPS) guardsagainst data loss due to powerfailure.• Advisory functions helpoperators maintain segmentlevelness.• Built-in test ports allow foreasy troubleshooting.132
<strong>Research</strong> <strong>and</strong> <strong>Technology</strong> <strong>1998</strong>Figure 2. Graphical User Interface• All operator events <strong>and</strong> configuration values are logged for future reference.• Up to 1 hour of real-time data is maintained for review during stacking.• Data review software is provided for posttest analysis.Three production units are fabricated <strong>and</strong> undergoing certification at KSC. SSEToperational readiness is scheduled for early 1999.Key milestones:• Completed proof-of-concept shadowing operation of an SRM stacking <strong>and</strong> destacking.• Completed electromagnetic interference susceptibility tests.• Completed the initial inert segment stacking operation.• Scheduled the design certification review <strong>and</strong> operations turnover for 1999.Contacts: W.C. Jones (William.Jones-3@ksc.nasa.gov) <strong>and</strong> A.J. Bradley, MM-G3, (407) 867-4181Participating Organizations: Dynacs Engineering Co., Inc., NASA PK-H, <strong>and</strong> United <strong>Space</strong> Alliance133/134
<strong>Research</strong> <strong>and</strong> <strong>Technology</strong> <strong>1998</strong>Electronics <strong>and</strong>InstrumentationThe Electronics <strong>and</strong> Instrumentation<strong>Technology</strong> program at the John F.<strong>Kennedy</strong> <strong>Space</strong> Center (KSC) supportsthe development of advancedelectronic technologies that enhance safety<strong>and</strong> quality, decrease launch vehicle <strong>and</strong>payload ground processing time <strong>and</strong> cost,<strong>and</strong> improve process automation. Theprogram includes the application ofapplied physics <strong>and</strong> chemistry <strong>and</strong> electrical<strong>and</strong> electronic engineering, particularlyin the areas of sensors, data acquisition<strong>and</strong> transmission, advanced audiosystems, digital computer-controlledvideo, contamination <strong>and</strong> gas detectioninstrumentation, field inspection <strong>and</strong>nondestructive testing, <strong>and</strong> circuit monitoringinstrumentation. The near-termprogram focuses on <strong>Space</strong> Shuttle, payloads,<strong>and</strong> <strong>Space</strong> Station ground processingenhancement by developing instrumentsin monitoring, testing, <strong>and</strong> vehicleprocessing. The long-term program isdeveloping technology for support offuture space vehicles, payloads, <strong>and</strong>launch systems by advancing the state ofthe art in launch vehicle <strong>and</strong> payloadprocessing electronics <strong>and</strong> instrumentationto reduce costs <strong>and</strong> improve safety.135
Electronics <strong>and</strong> Instrumentation<strong>Space</strong> Shuttle Integrated Vehicle HealthManagement (IVHM) Flight ExperimentThe IVHM Human Exploration<strong>and</strong> Development of <strong>Space</strong>(HEDS) <strong>Technology</strong> Demonstration(IVHM HTD) flight experimentwas the first KSC designed<strong>and</strong> built payload. Its purposewas to demonstrate competingmodern, off-the-shelf sensingtechnologies in an operationalenvironment to make informeddesign decisions for the eventualorbiter upgrade IVHM. There arethree objectives of IVHM:1. More autonomous operation inflight <strong>and</strong> on the ground,which translates to reducedwork load on the groundcontroller team. Near Earthspace operations provide theluxury of having a groundteam evaluate vehicle data tomake real-time decisions. On aMars mission for example,there is a 40-minute time delayto send <strong>and</strong> receive a message.Therefore, future vehicles willrequire more autonomouscapabilities.2. Reduced ground processing ofreusable vehicles due to increasedperformance of systemhealth checks in flight ratherthan back on the ground.3. Enhanced vehicle safety due tothe ability to monitor systemhealth even inside the harshenvironment of an enginecombustion chamber as well asprediction of pending failures.The “integrated” piece ofIVHM is the total integration offlight <strong>and</strong> ground IVHM elements.The four elements offlight IVHM are advanced lightweight/low-powersensors,distributed data acquisitionarchitecture, data processing, <strong>and</strong>mass storage. The three elementsof ground IVHM are evolvedcontrol room architectures,advanced applications, <strong>and</strong>automated ground processingsystems. While incorporation ofan IVHM architecture into a newvehicle is a complex process initself, implementation of IVHMinto the <strong>Space</strong> Shuttle programmust deal with additional considerationssuch as not impacting theflight manifest, cost/paybackanalysis, evaluation of military<strong>and</strong> commercial off-the-shelf(COTS) components, <strong>and</strong> vehicleretrofit installation considerations.The first IVHM HTDflight experiment was successfullyflown on Discovery on STS-95 from October 29 to November7, <strong>1998</strong>. The second IVHM HTDflight experiment will re-fly allelements as well as additionalsensing systems on STS-96 with aplanned launch date of May 13,1999.During cryogenic propellantloading in the terminal launchcountdown, the IVHM datastream was routed out of theorbiter’s T-0 umbilical for transmission,processing, <strong>and</strong> viewingin the Launch Control Center(LCC) via a new Ethernet networkinstalled in the MobileLauncher Platform, using existingfiber-optic lines connecting thelaunch pad with the LCC <strong>and</strong>using the new Checkout <strong>and</strong>Launch Control System (CLCS)elements. The IVHM processorautonomously began recordingdata at T-10 seconds prior to136
<strong>Research</strong> <strong>and</strong> <strong>Technology</strong> <strong>1998</strong><strong>Space</strong> Shuttle main engine start.Data was recorded during ascent<strong>and</strong> on-orbit during daily 1-hoursnap-shot periods. The processorwas dumped to the CLCS afterthe orbiter l<strong>and</strong>ed <strong>and</strong> was rolledinto its Orbiter Processing Facilitybay. Flight data evaluation of thefirst flight experiment is underway,<strong>and</strong> a preliminary assessmentis that the system had 100percent performance. The followinglists contain the demonstratedtechnologies <strong>and</strong> the organizationsresponsible for their development.IVHM HTD-1• Micro-electromechanicalsystems (MEMS) hydrogendetection – LeRC, Case WesternReserve University/Makel(G. Hunter)• Galvanic cell oxygen detection– KSC• Main propulsion system (MPS)vacuum-jacketed (VJ) linepressure sensing – KSC• RS485 smart sensor technologyfor hydrogen detection, oxygendetection, <strong>and</strong> VJ pressure –KSC• MPS helium leak detectionusing thermal flow technology– KSC• Integration/flight certificationtesting (thermal, vacuum,vibration, radiation, EMI, <strong>and</strong>EMC) of COTS conductioncooled VME bus architecture,flash memory, PowerPC processor,IRIG interface card, <strong>and</strong>all sensors – KSC• Data processing softwarearchitecture (scheduler, internalhealth checks, <strong>and</strong> data acquisition)using VxWorks – KSC• Ethernet ground data processingsystem – KSCIVHM HTD-2• Hydrogen detection usingfiber-optic Bragg-Gratingtechnology – LaRC <strong>and</strong> Universityof Maryl<strong>and</strong> (K. Vipavetz)• Structural strain <strong>and</strong> temperaturedetermination using fiberopticBragg-Grating technology– Rockwell Science Center (B.Christian)• Distributed data processingusing X-33 Remote HealthNode technology – LockheedMartin, S<strong>and</strong>ers Division (R.Garbos)• Fiber Distributed Data Interface(FDDI) technology –Hampshire Vanguard <strong>Technology</strong>Associates (T. Hardy)• <strong>Space</strong> Shuttle Main Engine(SSME) pump vibration monitoringsystem with digitalsignal processing technology –MSFC (T. Fiorucci)Additional information isavailable on the World Wide Webat: http://www.ksc.nasa.gov/shuttle/upgrades/ksc/ivhm/data depot/ivhmhome.htmContacts: J. Fox (Jack.Fox-1@ksc.nasa.gov), R. Hanson, <strong>and</strong> S. Wilson, AA-D,(407) 867-2001Vacuum-Jacketed Line Smart SensorH 2 <strong>and</strong> O 2 Smart Sensors137
Electronics <strong>and</strong> InstrumentationOrbiter Jack <strong>and</strong> Leveling OperationsAfter l<strong>and</strong>ing, the orbiter istowed into the Orbiter ProcessingFacility (OPF) <strong>and</strong> positionedso the pair of nose l<strong>and</strong>inggear (NLG) tires <strong>and</strong> each pair ofmain l<strong>and</strong>ing gear (MLG) tires arecentered on a floor lift. The liftunder the NLG tires raises thenose of the orbiter until the pitchof the orbiter is horizontal; thenthe three lifts simultaneouslyraise the orbiter to a specifiedheight (the maintenance height)while maintaining the horizontalpitch. The proper maintenanceheight of the orbiter is criticalbecause the surrounding facilityplatforms are designed for thisheight. Once at the maintenanceheight, the orbiter jacks areinstalled <strong>and</strong> the lifts are loweredto the ground. During a typicalorbiter processing flow, the rearsupport of the orbiter is transferredfrom the aft jacks to theMLG floor lifts <strong>and</strong> then backagain while the forward jacksremain attached.These operations require aheight measurement accuracy of±1/4 inch. This is currentlyachieved with a set of calibratedmeasuring sticks to determine theheight at each of the four jackattach points. The disadvantagesto this measuring technique are(1) the sticks are long <strong>and</strong> thin<strong>and</strong> technicians have difficultymaintaining them vertical to theground, (2) the distance readvaries with the force the userexerts when pressing the rodagainst the orbiter, <strong>and</strong> (3) thistechnique is time consuming <strong>and</strong>uses a significant number ofpeople. Furthermore, the longsticks are awkward to h<strong>and</strong>le <strong>and</strong>there is potential for orbiter tiledamage when the top of the stickis raised to vertical. Due to thesedifficulties, a replacement to themeasuring sticks is desired.The key to solving this problemis the use of the Leica laserrangefinder. This device allows auser to aim a laser beam at atarget <strong>and</strong> read the distance tothat target to within ±1/8 inchfrom distances between 5 <strong>and</strong> 200feet. A system (see figure 1) wasdeveloped whereby four of theserangefinders were used, two tomeasure the height from the floorto the aft jack attach points <strong>and</strong>two to measure the height fromthe floor to the forward jackattach points. All four communicatetheir results to a centralcomputer on a desk located to theleft side of the orbiter midbody.Each of the Leica units is heldin a vertical orientation by analuminum framework. Theelectrical connection to the Leicarangefinder provides RS-232communication (9,600 baud) <strong>and</strong>power. The Leica rangefinder<strong>and</strong> its framework have beenattached to a triangular base witha bubble level, two tilt adjustmentscrews, <strong>and</strong> a fixed foot. The tiltadjustment feature allows compensationfor small variations inthe flatness of the floor of the OPFto ensure the laser beam pointsnear vertical.Figure 1. Four Leica Laser RangefindersThe signals from the rangefindersare brought back to thecentral computer. The softwarewas written in LabView, whichallows for direct control of an138
<strong>Research</strong> <strong>and</strong> <strong>Technology</strong> <strong>1998</strong>Figure 2. Computer Display of Leica Laser Rangefinder ResultsRS-232 as well as the Leica rangefinders. An imageof the orbiter is displayed with four bars (see figure2; note that no bars are visible) reaching from belowthe orbiter up to the jack attach points. The heightin inches from the floor to each jack attach point isshown <strong>and</strong> the bar is color coded to indicate thestatus of the measurement. Typically the bars arered if the distance is an inch or more too low, areyellow if the distance is within 1-1/4 inch too low,green if the distance is within 1/4 inch of the desireddistance, <strong>and</strong> flashing red if the distance ismore than 1/4 inch too high.If a Leica rangefinder returns an error conditionto the LabView software or if it does not respond atall, the software displays an error condition <strong>and</strong>counts the errors. It takes less than 3 seconds typicallyfor all four Leica rangefinders to perform adistance measurement <strong>and</strong> for the software toreceive <strong>and</strong> display these numbers. If, for somereason, the software detects a problem with aspecific Leica rangefinder, it displays a “Data DropOut” message in the error status window <strong>and</strong> doesnot display the distance data.A fifth mounted Leica rangefinder with fullcabling was provided as a spare. All five Leicasystems were fabricated so they are within a fewhundredths of an inch of each other in height <strong>and</strong>can be interchanged.Contact: C.B. Mizell (Carolyn.Mizell-1@ksc.nasa.gov), MM-H-A, (407) 867-7705Participating Organizations: United <strong>Space</strong> Alliance(M. McClure), PK-H (C. Davis), <strong>and</strong> Dynacs EngineeringCo., Inc. (B. Burns, W.D. Haskell, T.J. Opalka, J.D. Polk, <strong>and</strong>R.C. Youngquist)139
Electronics <strong>and</strong> InstrumentationLeak Detection <strong>and</strong> VisualizationUsing Laser ShearographyThere are currently over 12techniques used to detect <strong>and</strong>locate leaks in the various fluidsystems that are part of bothground <strong>and</strong> flight equipment inthe <strong>Space</strong> Shuttle program. Oftentimes, detection <strong>and</strong> location arecarried out by completely separatemethods that add both time<strong>and</strong> cost to the testing. A “fullfield” method for detecting,locating, <strong>and</strong> visualizing leakswas desired, <strong>and</strong> laser shearographyhas shown promise inthis respect.Laser shearography is aninterferometric technique, meaningit is sensitive to constructive<strong>and</strong> destructive interference fromphase differences in coherentlight. “Shearing” optics are usedto image multiple points of alaser-illuminated object onto asingle picture element or pixel. Ina real-time laser shearographysystem, like the one used in thisinvestigation, the phase informationat these points is collected bya video camera pixel array. At thebeginning of a test, an initialvideo frame (called the referenceframe) is captured <strong>and</strong> fromwhich all subsequent live framesare subtracted. Differences,caused by phase changes, betweenthe reference frame <strong>and</strong> thelive frame are displayed in liveshear images on a video monitor.Any change in the phase relationmeasured at an individual pixel,whether due to a path lengthchange of some of the lightinitially imaged on that pixel ordue to the bending of light causingmore or fewer object points tobe imaged onto that pixel, showsup in the live shear image as avariation in gray level. Lasershearography is, thereby, wellsuited to locate <strong>and</strong> measure veryslight out-of-plane displacementsor, as in this case, to locate substancesthat change the index ofrefraction in the object space.Two captured images of leaksare shown in the figures. Figure 1shows a very slight leak from anair duster can that is otherwiseinvisible to the naked eye. Theair from the can, which is colder<strong>and</strong> denser than the ambient air,can be seen to be flowing downwardin the image. Figure 2shows a leak from a calibratedhelium leak system of 2.8 x 10 -3c 3 /s at 1 atmosphere. In thisimage, the helium (which islighter than air) can be seen to beflowing upward.What appears as two leaks ineach of these images is actually asingle leak <strong>and</strong> its “shadow.” Thelaser illumination source waslocated approximately 1 inchabove the camera, which explainsthe shadow of the leak fixtureseen just below the actual leakfixture. The leak “shadow” wasproduced in a similar way. Lightfrom the laser had two opportunitiesto pass through <strong>and</strong> beaffected by the leak – once on itsway from the laser source to thebackground (located approximately3 inches away) <strong>and</strong> onceon its way from the backgroundto the camera. Since the laser waslocated above the camera, theupper indication is due to lightpassing through the leak afterbeing reflected off the background.The lower indication isdue to light passing through theleak before reaching the background.Where the two leakindications overlap is where lightpassed through the leak in bothdirections.It was determined that heliumleaks as small as 10 -3 c 3 /s at 1atmosphere could be detectedwithout additional image processing.Leaks were much moreapparent in the live video as oftenthe motion of the leak helped setit apart from background noise.Better results were obtained bycapturing reference frames atshort, regular intervals whichhelped eliminate the slow, constantincrease in noise caused byslight changes in the surroundingenvironment. Future plans forleak detection with laser shearographyinclude a probability ofdetection study of helium leaks inair <strong>and</strong> in a vacuum <strong>and</strong> studiesof other types of leaks in severaldifferent environments.Contact: J.D. Collins (David.Collins-1@ksc.nasa.gov), MM-G, (407) 867-7069Participating Organizations: I-NET,Inc. (S.M. Gleman) <strong>and</strong> DynacsEngineering Co., Inc. (J. Donahue, S.W.Thayer, <strong>and</strong> D.L. Thompson)140
<strong>Research</strong> <strong>and</strong> <strong>Technology</strong> <strong>1998</strong>Figure 1. Air Duster Can LeakFigure 2. Helium Leak 2.8 x 10 -3 c 3 at 1 Atmosphere141
Electronics <strong>and</strong> InstrumentationSupport of the Linear AerospikeSR-71 Experiment (LASRE)KSC has been launching vehiclesfor almost 40 years.The knowledge gained over thistime has proven to be of use toother NASA centers <strong>and</strong> supportcontractors. One such area is thatof checking vehicles for fuel leaksbefore launch. Recently, personnelfrom KSC were requested toassist Dryden Flight <strong>Research</strong>Center (DFRC) personnel in theireffort to determine if the LASREwas safe for flight. Because theengine used gaseous hydrogen<strong>and</strong> liquid oxygen for the fuel<strong>and</strong> oxidizer, the experimentcould not be flown until it wasdemonstrated to be free of leaks.KSC was contacted to assistDFRC because of difficultiesarising while trying to leak checkthe engine.The LASRE test plan includeda small half-span model of theX-33 Aerospike Engine mountedonto an SR-71 aircraft. Theengine was then to be flown to analtitude <strong>and</strong> test-fired. Theseexperiments would answerquestions about the performanceof the engine as well as how areusable launch vehicle’s engineplume would affect the aerodynamicsof its lifting body shape atspecific altitudes <strong>and</strong> speeds.However, before the engine couldbe fired at altitude, it had to beshown to be free of fuel <strong>and</strong>oxidizer leaks.In response to the request forsupport, KSC sent a mass-spectrometer-basedsystem, namelythe Interim-Hydrogen UmbilicalMass Spectrometer (I-HUMS),<strong>and</strong> personnel to DFRC to supportthe leak tests. I-HUMS wasdeveloped during the summer of1990 to help find the leaks on theorbiters for flights STS-35 <strong>and</strong>STS-38. Helium <strong>and</strong> hydrogenFigure 1. I-HUMS Under the SR-71 for Leak Checkswere the only gas species monitoredfor these experiments, eventhough the I-HUMS can monitoradditional gases. This reportcovers one of the two tests supportedby KSC. This test wasdeemed the most valuable.Figure 1 shows the I-HUMSattached to the LASRE during acold firing of the engine.The leak test performed onthe LASRE was based on theShuttle Aft Helium SignatureLeak Test (V1202), which iscurrently performed before eachlaunch. The entire system wascharacterized because the LASREhad no history or baseline. Thetest required the I-HUMS tomonitor helium at one samplelocation; the I-HUMS can supportup to 16 sample locations. Becausethe purge was not a simplein/out model, it also was characterized.This is due to the factthat the feed system is distributedthroughout the purged environment(see figure 2). Venting isthrough many tiny holes throughoutthe skin of the test article.Both of these characteristics madethe purge path unknown.The I-HUMS was used tomonitor the purge of the LASREwhile a calibrated helium leakrate was injected into multiplelocations in the test article. Theinjection of a known leak rate intoa known purge was used tocharacterize the engine purge.This characterization was subsequentlyused to determine theminimum signal that would bedetected for a given engine leak.A second calibrated helium leakrate was injected to enablequantitation of any engine leak.142
<strong>Research</strong> <strong>and</strong> <strong>Technology</strong> <strong>1998</strong>Purge SourcesEngineH 2 O Tanks, GH 2 TanksCanoeSample of the HeInjection LocationsMonitoringLocationFigure 2. Layout of LASRE Leak CheckingAfter the engine purge wascharacterized, the engine waspressurized with helium. TheI-HUMS was then used to monitorthe helium levels in the purgeuntil a level reading was reached.The helium pressure in the enginewas then increased to a higherpressure. The helium levels inthe purge were again monitoreduntil a stable reading wasreached. The recorded valueswere used to predict the operatingleak rate. The planned operatingtime of the engine duringaltitude tests was extremely short,less than 15 seconds, so that onlya fraction of the calculated leakrate would be introduced into thechamber during an actual flight.These tests demonstrated thatKSC has the knowledge <strong>and</strong>capabilities to help solve manyproblems at other centers. Afurther demonstration of theflexibility of the personnel <strong>and</strong>equipment at KSC is the fact thatthey will be used to support theX-33 launches.Contacts: R.J. Beil (Robert.Beil-1@ksc.nasa.gov), PK-G, (407) 861-3944;<strong>and</strong> F.W. Adams, MM-G2, (407) 867-4449Participating Organizations: DrydenFlight <strong>Research</strong> Center (N. Hass) <strong>and</strong>Dynacs Engineering Co., Inc. (T.P.Griffin <strong>and</strong> G.R. Naylor)143
Electronics <strong>and</strong> InstrumentationFerroelectric Camera for Infrared Fire ImagingInfrared cameras are currentlyused at the launch pads tomonitor hydrogen flow lines forfires. This is necessary becausehydrogen fires, like natural gasfires, emit very little visibleradiation <strong>and</strong> are virtually invisibleunder daylight conditions tothe human eye or to normalsilicon-based charge-coupleddevice (CCD) cameras. Thecurrently used infrared camerasare deteriorating <strong>and</strong> the manufacturer,Insight Vision, has goneout of business, resulting inexcessive maintenance costs <strong>and</strong>eventually, as spare parts run out,the loss of this capability. Inorder to deal with this problem, itwas decided to replace the oldinfrared cameras with new, stateof-the-artcameras. A low-costcamera was located that appearedto provide adequateinfrared images. This camera, aPalm IR 250 ferroelectric device,is popular as a nighttime peoplelocator used by law enforcementgroups <strong>and</strong> the Coast Guard. It isrugged, does not require cooling,<strong>and</strong> provides images in the 8- to12-micron region of the spectrum.One of these cameras was purchased<strong>and</strong> configured for fieldoperation at the launch pad withthe goal to produce an imageadequate to meet the monitoringneeds of operations personnel.Before purchasing the Palm IR250 infrared camera, severalversions were brought to KSC forfield testing. They producedgood images of the Shuttle on thepad from inside the perimeterfence <strong>and</strong> easily imaged hydrogenfire at the flame stack. Ast<strong>and</strong>ard hydrogen fire (about a1-foot-high flame) was set up atthe fire training facility <strong>and</strong> wasimaged from several distancesagainst a variety of backgrounds.In all cases, the images of the firestood out clearly <strong>and</strong> the performancewas acceptable to operationspersonnel. One camerawas aimed into the sun to see ifthe camera was damaged by abright exposure such as it wouldsee during a launch. The camerabecame saturated but recoveredquickly with no apparent damage.Based on these successfuldemonstrations, a Raytheon TIPalm IR 250 infrared camera wasprocured for the Optical InstrumentationLaboratory to useduring the STS-91 external tank(ET) tanking test <strong>and</strong> launch(May <strong>1998</strong>).In summary, the camera wasstrapped down to a plate with apower supply <strong>and</strong> microcontrollerstrapped down behind it. Thisplate sits on a set of six vibrationisolators attached to a slide railassembly welded to the backplate(see the photo). St<strong>and</strong>ard operationaltelevision (OTV) connectorswere placed on the backplatewith the pan-<strong>and</strong>-tilt signals fedthrough the camera housing to apan-<strong>and</strong>-tilt connector. A germaniumwindow was mounted inthe frontplate, allowing thecamera to look out of the housingin the 8- to 12-micron region. ABlue Earth <strong>Research</strong> microcontrollerwas programmed to allow theOTV analog voltage levels to beconverted into RS-232 comm<strong>and</strong>sto control the camera. Gain, level,auto/manual switching, <strong>and</strong>focus were provided as operatorcontrollablefeatures through thiscommunication system. Significanteffort went into ensuring thehousing was well sealed so itcould be pressurized to a fewpounds per square inch in thefield <strong>and</strong> would hold this pressurefor a period of days.United <strong>Space</strong> Alliance tested<strong>and</strong> verified the performance ofthe completely housed <strong>and</strong>configured camera system, <strong>and</strong>the system was installed onLaunch Pad 39A. The videosignal was sent through theLaunch Control Complex OTVrouting system.Initially, the camera wasaimed at a variety of objectsaround the pad <strong>and</strong> producedgood infrared images; however inthe cool early morning hours, thecamera showed a dark imagewith minimal imaging. This wasexplained as a limitation in thesensitivity of the camera. Earliertesting had not disclosed thisbecause the testing was doneduring warm daytime conditions.During a cool night when theambient temperature dropped,the camera had trouble seeingbackground objects <strong>and</strong> produceda dark image. This conditionwould make it difficult to locatethe position of a fire if backgroundobjects could not be seen.It was decided, however, that thePalm IR camera would be left inthe field for the ET tanking test<strong>and</strong> the launch.144
<strong>Research</strong> <strong>and</strong> <strong>Technology</strong> <strong>1998</strong>The camera performed well during the tests. Itproduced good infrared images of the orbiter before<strong>and</strong> during launch <strong>and</strong> was able to remain runningeven during launch. This was important becausethe existing Insight Vision cameras must be shutteredduring actual launch, which prevented monitoringthe area for fires during a short but criticalperiod. The Palm IR camera actually spotted a fireafter the launch; a patch of dried grass near the padhad caught fire during launch. Shortly after launch,the camera was brought back to the Optical InstrumentationLaboratory, <strong>and</strong> the decision was madethat a better (i.e., lower detection temperature)camera was required for fire imaging at the launchpad. Work is ongoing to choose such a camera <strong>and</strong>to procure one or more for field trials during 1999.Contact: C.B. Mizell (Carolyn.Mizell-1@ksc.nasa.gov),MM-H-A, (407) 867-7705Participating Organizations: United <strong>Space</strong> Alliance(D. Carter <strong>and</strong> D. Exley), MM-J1-A (L. H<strong>and</strong>), PK-G(K. Brock), <strong>and</strong> Dynacs Engineering Co., Inc. (R.B. Cox,W.D. Haskell, F. Lorenzo-Luaces, <strong>and</strong> R.C. Youngquist)145
Electronics <strong>and</strong> Instrumentation6U VME Universal Signal Conditioning Amplifier (USCA)Interface ModuleThe objective of this project is todevelop a 6U VME bus card<strong>and</strong> software to interface with theUSCA’s. The combination of the6U VME module <strong>and</strong> the hardwarewill allow users to developcustomized data acquisitionsolutions using USCA’s <strong>and</strong>commercial off-the-shelf 6U VMEhardware.The module will receive serialdata streams from the USCA’s,will decode <strong>and</strong> buffer the data,<strong>and</strong> will transport the data over aVME bus for data archival <strong>and</strong>transmission. The module willalso be used to communicatecomm<strong>and</strong>s to <strong>and</strong> receive statusinformation from USCA’s in thefield.Key accomplishments:• A low-speed prototype wasdesigned <strong>and</strong> built.• The development of aVXWorks driver for the cardwas started.Key milestone:• Complete the development ofthe 6U VME interface module<strong>and</strong> supporting hardware.Contact: C.M. Ihlefeld (Curtis.Ihlefeld-1@ksc.nasa.gov), MM-G2-A, (407) 867-6747Participating Organization: DynacsEngineering Co., Inc. (P.J. Medelius <strong>and</strong>J.J. Henderson)146
<strong>Research</strong> <strong>and</strong> <strong>Technology</strong> <strong>1998</strong>Medical Aeronautical Communications SystemKSC relies upon Department ofDefense helicopters to supportsearch, rescue, <strong>and</strong> medevacfor flight crew <strong>and</strong> personnelsupporting Shuttle programlaunches <strong>and</strong> l<strong>and</strong>ings. Thesehelicopters are normally configuredfor military combat missions<strong>and</strong> must be reconfigured rapidlyto support the NASA mission onlaunch <strong>and</strong> l<strong>and</strong>ing days. Communicationsare necessary withKSC medical, fire, safety, <strong>and</strong>rescue radio nets as well ashospital emergency roomsthroughout the state. However,military communications systemsaboard these helicopters are notcompatible.The Biomedical Laboratoryhas designed, fabricated, <strong>and</strong> putinto place a Medical AeronauticalCommunications System thatprovides (1) VHF-FM/simplexradio communications capabilityon all KSC radio nets; (2) UHF-FM/duplex communications tohospitals, the Launch ControlCenter (LCC) firing room, <strong>and</strong> theclinic; <strong>and</strong> (3) a seven-stationprivate/helicopter intercomsystem. This allows the physicianaboard the helicopter to talk withthe two assigned pararescuemenas well as the two patients. Theflight engineer also has access tothe system, <strong>and</strong> a spare access isprovided. The system has beenprogrammed to permit communicationson U.S. Coast Guardfrequencies for those helicoptersproviding Range Safety clearingof shipping assets in the solidrocket booster drop zones at sea.This system is battery operated<strong>and</strong> interfaces the helicopterintercom system with impedancethat makes it appear as a singleheadset. A unique externalantenna system is provided thatexchanges the st<strong>and</strong>ard hoisthook access door with a similarfunctioning structure whichexposes VHF <strong>and</strong> UHF antennasout of the bottom fuselage of theairframe. Testing <strong>and</strong> missionusage thus far aboard four HH-60G Blackhawk helicopters haveshown the system to be a significantimprovement over thepreviously disclosed portablesystem carried aboard thesehelicopters.Contacts: D.F. Doerr (Don.Doerr-1@ksc.nasa.gov), JJ-3, (407) 867-3152;<strong>and</strong> H.E. Reed, JJ-3-B, (407) 867-7551147
Electronics <strong>and</strong> InstrumentationPortable Magnetic Field Sensor forMeasuring Lightning EffectsThe objective of this project wasto design a reliable sensor formeasuring magnetic fields insidethe Payload Changeout Room(PCR) on each launch pad. Informationobtained by the sensorwill be used to determine themagnitude of the voltages inducedinto cables by the magneticfield generated by a lightningstrike. Depending on the distanceto the lightning strike <strong>and</strong>the area covered by the conductors,the induced voltage canreach several thous<strong>and</strong> volts for aduration of close to 100 microseconds.A complete magnetic fieldmeasurement requires the use ofthree orthogonally placed antennas.This requires the use of threedata conditioning, digitization,<strong>and</strong> storage channels. It is importantto keep the total powerconsumption to a minimum inorder to extend the lifetime of thebatteries in the sensor.The sensor was designed withthree data conditioning <strong>and</strong>digitization channels, with onlythe first channel continuouslypowered up. Under normaloperating conditions, data fromthe three orthogonal antennas issampled sequentially at a 1 megasample per second (MS/s) rate.Upon detection of a nearbylightning strike, the followingactions take place:1. The data from the preceding100 microseconds is stored.2. The power to digitizationchannels 2 <strong>and</strong> 3 is restored.3. The multiplexer stops alternatingamong the three channels<strong>and</strong> connects each antenna toeach digitization channel.4. The clock signal for all threedigitizers is set to 30 megahertz.5. Data is acquired for an additional100 microseconds at a 30-MS/s rate.6. The power to channels 2 <strong>and</strong> 3is removed.The data preceding the triggeris sampled at 1 MS/s, <strong>and</strong> thedata following the trigger issampled at 30 MS/s. The latencybetween the onset of the trigger<strong>and</strong> the sampling clock switch isin the order of a fraction of amicrosecond. This operationresults in most of the informationbeing sampled at the fast rate,thus preserving the data integrity.Since the sensor is never put intoa “sleep” mode, even magneticfields from a first lightning strikecan be acquired. A significantreduction in power consumptionis achieved by powering up onlyone digitizing channel <strong>and</strong> multiplexingall three measurementsthrough that channel <strong>and</strong> digitizingthe measurements at a reducedsampling rate.148
<strong>Research</strong> <strong>and</strong> <strong>Technology</strong> <strong>1998</strong>Key accomplishment:• The circuit schematic design was completed.Key milestone:• Continue monitoring induced magneticfields inside the PCR.Contact: C.M. Ihlefeld (Curtis.Ihlefeld-1@ksc.nasa.gov), MM-G2-A, (407) 867-6747Participating Organization: Dynacs EngineeringCo., Inc. (P.J. Medelius)149
Electronics <strong>and</strong> InstrumentationInline Gas Analyzer for Cryogenic HydrogenAprototype inline gas analyzer(IGA) for cryogenic hydrogenwas designed, constructed,tested, <strong>and</strong> temporarily installedat the hydrogen flare stack onLaunch Pad 39B. NASA’s intentis to use the IGA system to reducethe man-hour requirements <strong>and</strong>material costs of vehicle preparationsfor cryogenic fuel loading<strong>and</strong> safing during <strong>and</strong> after <strong>Space</strong>Shuttle launch operations. Withthe IGA system, measurements ofthe cryogenic operations can bemonitored from a remote, safelocation during hazardous operations.The current method fordoing these measurements is totake a melon sample for each testpoint <strong>and</strong> analyze it in the laboratoryusing a mass spectrometer<strong>and</strong> manual field verification ofgas concentrations. If the proto-type program is successful, thefinal design will be permanentlyinstalled at the hydrogen flarestack, the Mobile LauncherPlatform (MLP) liquid hydrogen(LH 2) high point bleed (backporch), <strong>and</strong> the Fixed ServiceStructure (FSS) gaseous hydrogen(GH 2) vent line at Launch Pads39A <strong>and</strong> 39B at KSC. The IGAcontains hydrogen, oxygen, <strong>and</strong>water sensors to monitor criticalconcentrations of each of thesematerials. The flow path of thesample gas is from the hydrogencryogenic line through the IGA<strong>and</strong> back to the cryogenic line(see figure 1). In addition to theconcentration data for hydrogen,oxygen, <strong>and</strong> water, the systemprovides calibration parameters,the ability to recalibrate thesensors, flow rates throughsensors, the temperature <strong>and</strong>pressure of the sample gas, <strong>and</strong>error data for essential components.The following are generalcharacteristics of the IGA:1. The hydrogen sensor canmeasure the concentration ofhydrogen at ±1 percent fullscale over the range of 0 to 10percent. It can operate over thetemperate range from -10 to 60degrees Celsius (°C) <strong>and</strong> canwithst<strong>and</strong> the sound <strong>and</strong>vibration conditions of aShuttle launch.2. The oxygen sensor can measurethe concentration ofoxygen at ±1 percent full scale<strong>and</strong> has a range of 0 to 2 percent.It can operate over thetemperature range from -10 to40 °C <strong>and</strong> be able to withst<strong>and</strong>the sound <strong>and</strong> vibration conditionsof a Shuttle launch.HydrogenCryogenicLineV6CVV2V3V4Flow 1Flow 2H 2O 23. The humidity sensor canmeasure the concentration ofwater at 125 ±10 parts permillion (ppm) <strong>and</strong> has a rangefrom 125 ppm to 4 percent. Itcan operate over the temperaturerange from -10 to 40 °C<strong>and</strong> withst<strong>and</strong> the sound <strong>and</strong>vibration conditions of aShuttle launch.SV SV Te PrV1PumpN 2CalV5Figure 1. Inline Gas AnalyzerFlow 3H 2 OV1 Isolation ValveV2 Back Pressure ValveV3 H 2 Flow Control ValveV4 O 2 Flow Control ValveFlowmeters 1, 2, 3SV 1 Helium ZeroSV 2 CALA microcomputer acquires thedata from the sensors <strong>and</strong> formatsthe data in a manner suitable fortransmission over a serial dataline. In addition, provisions aremade to allow for control ofsolenoid valves from a remoteterminal via the serial data line orlocally from the microcomputerusing pushbuttons. The microcomputerprovides 12-bit analog150
<strong>Research</strong> <strong>and</strong> <strong>Technology</strong> <strong>1998</strong>Figure 2. Inline Gas Analyzer With the Moisture, Hydrogen, <strong>and</strong> Oxygen Analyzerinputs, digital inputs, <strong>and</strong> digital outputs capable of driving the solenoid valves. The softwareallows the sensor data to be formatted <strong>and</strong> the controls <strong>and</strong> valve talkbacks to be processed <strong>and</strong>displays the results. The software also provides control via the serial port, which mimics thefunctions of the buttons <strong>and</strong> provides diagnostic functions. Figure 2 shows the installation ofthe inline gas sensor at the hydrogen flare stack at Launch Pad 39B.Key accomplishments:• A prototype IGA was designed, constructed, tested, <strong>and</strong> temporarily installed at the hydrogenflare stack at Launch Pad 39B.• The IGA was successfully used to monitor a storage tank loading operation <strong>and</strong> found transientsin moisture <strong>and</strong> oxygen previously unknown.Contacts: R.C. Young (Rebecca.Young-1@ksc.nasa.gov) <strong>and</strong> D.E. Lueck, MM-G2, (407) 867-4439Participating Organization: Dynacs Engineering Co., Inc. (C.F. Parrish, C.J. Schwindt, S.J. Klinko, <strong>and</strong> T.R.Hodge)151
Electronics <strong>and</strong> InstrumentationOrbiter Side<strong>Space</strong> Shuttle Orbiter toExternal Tank Mating ToolDuring <strong>Space</strong> Shuttle processing, the orbiter is joined to theexternal tank (ET) in a processcalled mating. This takes placewith both the orbiter <strong>and</strong> ET inthe vertical position. Two matingfixtures, located at the aft end ofthe orbiter <strong>and</strong> ET, are used in themating process. These fixturesare composed of ball-<strong>and</strong>-sockettypejoints with the ball ends onthe ET side <strong>and</strong> the socket receptacleson the orbiter side (seefigure 1). During mating, theorbiter is suspended by crane <strong>and</strong>slowly brought into contact withthe fixed ET. Once the two are incontact, bolts are attachedthrough the ball-<strong>and</strong>-socket jointto secure the orbiter to the ET.The mating operation iscurrently accomplished usingcaliper <strong>and</strong> eye-ball measurementsin an iterative approach,which carefully brings the orbiterBolt Clearance HoleFigure 1. Mating FixturesET Sideinto contact with the ET. Theorbiter is initially positioned atapproximately the correct height<strong>and</strong> then slowly moved towardsthe ET. As the orbiter gets closer,measurements are made todetermine if the two matingsurfaces are aligned. If they seemto be aligned, the orbiter ismoved slightly closer to the ET<strong>and</strong> more measurements aretaken. If they are not aligned, theorbiter is repositioned slightly<strong>and</strong> then rechecked. This processof checking for alignment, repositioning,<strong>and</strong> moving closer isrepeated until the orbiter <strong>and</strong> ETmating surfaces are brought intocontact <strong>and</strong> the two are secured.Due to the critical nature of thistask, a more precise guidingtechnique was desired. A laserbasedtargeting system wascreated that can be used to alignthe mating components withmore precision <strong>and</strong> ease thancurrently possible.The laser targeting system iscomposed of a laser mount thatgoes on the ET side <strong>and</strong> a targetthat goes inside the orbiter. Twosystems are required for eachmate, one for each side of the ET<strong>and</strong> orbiter. The targets, whichare made of a type of plastic, fitover the screws used to secure theattachment nut inside the orbiter.This nut is used to capture thebolt for connection to the ET. Thetargets are positioned to beperfectly centered with respect tothis bolt.The laser mounts (see figure2) attach to the back side of thebolt clearance holes in the ETfixtures. The mounts are designedto fit snugly within the152
<strong>Research</strong> <strong>and</strong> <strong>Technology</strong> <strong>1998</strong>can tell exactly, to within 1/16inch, how far out of alignment theorbiter is at any given time. Twosets are used to help ensure bothsides of the orbiter are at thecorrect height necessary for mating.Figure 2. Laser Mountclearance holes to provide thenecessary concentricity for thelaser. The laser is positionedwithin the mount to shine downthe center of the clearance hole<strong>and</strong> directly through the center ofthe bolt hole. When the orbiter iswithin range, a window cut intothe mount allows the user to lookdirectly down the bolt hole <strong>and</strong>into the aft compartment to seewhere the laser spot falls on thetarget. The target is equippedwith a graded scale so the userThis system has alreadyundergone preliminary testingduring the mating operation ofSTS-88. Targets were not able tobe installed, but the laser mountwas tested for fit <strong>and</strong> functionality.The laser mount was found to fitextremely well within the ETfixture <strong>and</strong> the laser spot could beeasily seen on the protectivebacking placed behind the attachmentnut inside the orbiter. Also,using the inner diameter of the nutas a reference, the laser spot wasused to roughly determine theposition of the orbiter. The positiondetermined in this fashioncorresponded well to the positiondetermined using the currentprocedure. A full test of thesystem is planned for the matingoperation of Columbia missionSTS-93.Contact: C.B. Mizell (Carolyn.Mizell-1@ksc.nasa.gov), MM-H-A, (407) 867-7705Participating Organization: DynacsEngineering Co., Inc. (R.B. Cox <strong>and</strong>J. Donahue)153
Electronics <strong>and</strong> InstrumentationMain Three Contamination Monitoring CartThe Contamination MonitoringLaboratory at KSC developeda system that provides threetypes of real-time molecularcontamination monitoring in onesystem for support of highlysensitive payload processing. Itincorporates an airborne hydrocarbonmonitoring system basedon Fourier Transform Infrared(FTIR) technology, real-timeoptical fallout monitors to monitorparticulate fallout, <strong>and</strong> SurfaceAcoustic Wave (SAW) nonvolatileresidue (NVR) monitorsfor sensing molecular contamination.The system consists of aportable cart suitable for use inclass 1, division 2, environments(see the figure) that is electromagneticinterference (EMI) shielded.The capability to monitorcontaminants is essential in orderto protect sensitive optical payloadsfrom performance degradationcaused by the deposition ofsurface films, other molecularcontamination, <strong>and</strong> particulatefallout. Commonly used hydrocarbonmonitoring instrumentation,such as flame ionizationdetectors, yields no informationabout the source or identity of thecompounds they detect. TheFTIR technology with its inherentability to discriminate a largenumber of compounds offers atremendous advantage over othertypes of instrumentation. Recentdevelopments in the areas of realtimedetection of particulatefallout <strong>and</strong> nonvolatile residueshave, for the first time, allowedcreation of an integrated instru-ment to provide fairly completemonitoring of the contaminationrisk to a payload during groundprocessing.The hydrocarbon monitoringsubsystem consists of two modifiedMIDAC FTIR instrumentsmounted in a cart; a computerproviding control, user interface,<strong>and</strong> communications; <strong>and</strong> asampling system. The graphicaluser interface runs on the cartcontroller computer, which has akeyboard, mouse, <strong>and</strong> monitor.The hydrocarbon portion of thecart is capable of measuring avariety of compounds <strong>and</strong> can bereconfigured to accommodatenew compounds of interest. TheMIDAC instruments were modifiedby the addition of a smallcomputer inside the instrumentcase that controls the operation ofthe FTIR <strong>and</strong> provides deconvolutionof spectral data. EachFTIR module sends gas concentrationdata to the cart controllercomputer, is equipped with a 1.8-meter gas cell, <strong>and</strong> runs at aresolution of 4 wavenumbers.The sampling system consists oftwo eductor pumps supplied bythe system purge gas. There arealso flow failure indicators thatare monitored by the cart controllercomputer. The FTIR modulemakes use of a classical leastsquare (CLS) algorithm in theanalysis of spectral data. Thetraditional CLS method has beenmodified by the use of baselinecorrection algorithms, whichcorrect errors due to instrumentwarmup, aging of the source, <strong>and</strong>degradation of the optics due tocontamination. This correction isaccomplished by performing aparametric shape fit for thebaseline using three parameters:bend, tilt, <strong>and</strong> offset.The NVR’s are monitoredwith a Femtometrics SAW devicethat consists of a control unitinside the purged cart <strong>and</strong> asensor head with an exposedquartz crystal to collect theresidue. The increase in mass dueto the residue deposition causes ashift in the resonant frequency ofthe crystal, which then can beused to quantify the residuemass. The SAW is extremelysensitive, roughly 100 times thesensitivity of a Quartz CrystalMicrobalance. A 50-hertz shift inthe frequency of the SAW crystalcorresponds to only 1 nanogramper square centimeter massdensity.Particulate fallout measurementsare made by optical falloutmonitors (OFM’s) that weredeveloped at KSC. These instrumentsmeasure the light scatteredfrom a specular surface by theparticles which l<strong>and</strong> on thatsurface. This instrument iscalibrated to read out in “percentarea coverage,” which is the totalfractional area of the witnessplate obscured by particles.The data from the two FTIRmodules, the two SAW devices,<strong>and</strong> the two OFM’s are integratedinto a single software packagethat runs on the cart controllercomputer. Here, the data arelogged in a disk file <strong>and</strong> presentedto the user in several154
<strong>Research</strong> <strong>and</strong> <strong>Technology</strong> <strong>1998</strong>FTIR 1CartStatusPCRorVPFFacilityMonitoringStationKSCAREAFTIR 2Serial LinkEthernetNVR 1NVR 2OFM 1OFM 2CartControllerComputerOtherInterestedPartiesInternet(by permission)LANContaminationMonitoringInstrumentsRemoteMonitoring StationContamination Monitoring Cart Data Flowforms, including tabular <strong>and</strong>graphical. The user can opt toview any or all the cart measurements.The cart controller softwarewas written in MicrosoftVisual Basic. All the data fromthe cart is put into a single datastream <strong>and</strong> sent via a serial link toa remote computer that can belocated in another building.Here, the data is presented in thesame way as on the cart controllercomputer, so the user at theremote site sees exactly the samedata in real time. This remotesystem also is configured as auser datagram protocol (UDP)server <strong>and</strong>, if connected to a localarea network that supports theInternet Protocol, can broadcastthe cart data in real time to manyremote users simultaneouslyanywhere in the world. Theseremote users can see the samescreens as the local users but canselect their own options for whichdata to view. The server can beconfigured to only allow certaindomains to access the informationso the availability of the data canbe restricted to only those whoare authorized to see it. This isthe same technology that is usedfor “Internet broadcasts” of video<strong>and</strong> audio. To view the data fromanywhere in the world, all that isrequired is the UDP client software(also written in Visual Basic)<strong>and</strong> a personal computer compatiblewith an Internet connection<strong>and</strong> authorization on the UDPserver to allow the user to connect.Contacts: J.S. Abernathy (Jean.Abernathy-1@ksc.nasa.gov), NN-M4,(407) 867-6152; <strong>and</strong> P.A. Mogan,MM-G2, (407) 867-9167Participating Organization: DynacsEngineering Co., Inc. (C.J. Schwindt <strong>and</strong>C.B. Mattson)155
Electronics <strong>and</strong> InstrumentationThermographic Inspection of SubsurfaceVoids in Composite StructuresComposite structures arebecoming more prevalent atKSC <strong>and</strong> in many high technologyindustries. The ability tonondestructively evaluate compositestructures to detect <strong>and</strong>locate surface <strong>and</strong> subsurfacedefects is, therefore, becomingincreasingly important. Infrared(IR) thermography can be extremelyuseful in this type ofnondestructive evaluation (NDE).Large temperature differencesin very hot objects can be seen aschanges in color, as in the color ofa flame or a star. In the sameway, slight temperature variations,at or about room temperature,can be seen as changes in theIR range of the electromagneticspectrum (wavelengths usually inFigure 1. Surface Variationsthe 1- to 20-micron range). Inthermography, detectors sensitiveto IR wavelengths are used toexamine the thermal behavior oftest objects. As an object’s temperaturechanges, the amount ofenergy it emits in the detectorrange also changes. Using anarray of detectors, an IR cameraconverts these differing energyoutputs to video images of differingcolors or gray scales.Many objects change temperatureinherently over time <strong>and</strong>can be easily studied by monitoringtheir behavior with an IRcamera. For objects that do notinherently change temperature,heat excitation can be used so thebehavior of the object duringcooling can be examined.Flashlamps were used as theheating source in all experimentsconducted for this report.Flashlamps emit a short burst ofmainly visible <strong>and</strong> IR radiation,part of which is reflected at theobject’s surface; a large part isabsorbed. The absorbed radiationis turned into heat at the object’ssurface, which increases itstemperature. After the flash, thesurface temperature slowlyreturns to ambient as the extraheat dissipates deeper into thetest object <strong>and</strong> out into the surroundingenvironment. Theamount of excitation energyinitially absorbed <strong>and</strong> the rate atwhich the surface returns toambient temperature can both beused to detect anomalies on thesurface of <strong>and</strong> within the testobject.Immediately after the excitationpulse (the flash), hotter orcooler areas show where more orless energy was initially absorbedby the object. Figure 1 shows anobject with a temperature gradientfrom top to bottom as well asa small “X” <strong>and</strong> a square (top left<strong>and</strong> right center, respectively)which were scratches in thesurface <strong>and</strong> several “hot spots”(lower left <strong>and</strong> center). Thesewere all caused by differences ina reflective surface coating on thetest object. Places that appeardarker in the image are actuallyhotter <strong>and</strong> represent areas thatwere not as completely coveredby the reflective coating.As the object cools, anomalieswithin the test object can bedetected through variations in therate of surface cooling. The156
<strong>Research</strong> <strong>and</strong> <strong>Technology</strong> <strong>1998</strong>dissipation of heat from the surface happensthrough three different routes: (1) from the surfaceinto the surrounding environment, (2) from hotterareas on the surface laterally to cooler ones, <strong>and</strong> (3)from the surface into <strong>and</strong> through the test object.Given the proper environmental <strong>and</strong> initial conditions,heat loss through the first two routes will befairly constant across the object’s surface. In thatcase, areas that exhibit anomalous cooling must bedue to variations in heat flow through the testobject.Figure 2. Subsurface DefectsThe rate of heat flow through the test object isdependent upon the path the heat must travel. Thepresence of good heat conductors or good insulatorsalong this path will affect how quickly the heat isable to leave the surface <strong>and</strong> how quickly thesurface can cool. For example, in these experiments,the presence of voids (air pockets) in the interior ofthe composite structure was of specific interest. Airis a better insulator than the materials that make upthe composite structure so heat flow is slower alonga path with an air pocket. This results in the surfaceabove the air pocket remaining at a higher temperaturethan the surrounding surface for a longer time.Hot spots that were not immediately visible whichappear during cooling could indicate possible voidswithin the structure. Figure 2 shows several indicationsof voids in a preprogrammed test panel. Boththe size <strong>and</strong> shape of the voids are clearly visible.The rightmost <strong>and</strong> bottom-center defects are both1/4 inch in diameter <strong>and</strong> the total field of view isapproximately 6 by 8 inches. The resolution ofthermography is one reason it has proven so effectivein this type of evaluation.Thermography is a fairly old field, yet improvementsare happening at an incredible rate. Theability of thermography to work so well withcomposite materials coupled with the dramaticincrease in IR detector capabilities suggests thatthermography will play a more important role inNDE in the immediate future.Contacts: C.B. Mizell (Carolyn.Mizell-1@ksc.nasa.gov),MM-H-A, (407) 867-7705; <strong>and</strong> C.K. Davis, PK-H, (407) 861-3636Participating Organization: Dynacs Engineering Co., Inc.(J. Donahue <strong>and</strong> S.W. Thayer)157
Electronics <strong>and</strong> InstrumentationAutomatic Calibration Station for the UniversalSignal Conditioning Amplifier (USCA)The goal of this project is todesign an automatic calibrationstation for the USCA. TheUSCA is a self-configuring amplifierdesigned to interface with avariety of transducers. Parameterssuch as gain, excitationvoltage, sampling rate, <strong>and</strong>filtering are automatically setbased on information stored in asmall memory device attached tothe transducer. The data on theTransducer Electronic Data Sheet(TEDS) is read by the USCAimmediately after the connectionto the transducer is detected.Calibration factors stored in theUSCA’s memory are used toensure the accuracy of measurementsis maintained withinspecifications.Following the manufacturingprocess, the USCA has to be fullycalibrated before deployment inthe field. The calibration has tobe repeated periodically (every 1or 2 years). The calibrationprocedure also has to be repeatedfollowing any repairs that involvecomponents associated with theanalog circuitry. The calibrationprocess includes measuring thereference voltages that the USCAuses for its self-calibration,measuring the precision resistorsused for current measurements<strong>and</strong> current excitation, correctingfor offsets, <strong>and</strong> others. Themanual process takes about 30minutes to complete when conductedby an experienced technician.The USCA requires certainparameters to be stored in itsnonvolatile memory in order toperform its continuous selfcalibration.These parametersinclude three reference voltages,zero offsets, current sensingresistor values, excitation resistordivider ratios, <strong>and</strong> input voltageresistor divider ratios. A combinationof custom-developedsoftware in the USCA <strong>and</strong> aLabView-based program runningon a personal computer is used inconjunction with an externalvoltage/current source to fullyautomate the calibration process.The automated calibration processperforms additional detailedtests that are not normally conductedduring manual calibration<strong>and</strong> is expected to take about 15minutes to completely calibrate aUSCA.Key accomplishments:• Started the design of theAutomated Calibration Station.• Developed a method to fullycalibrate a USCA without theneed to remove it from itssealed enclosure.Key milestone:• Evaluate the performance ofthe system <strong>and</strong> refine thesoftware if needed.Contact: C.M. Ihlefeld (Curtis.Ihlefeld-1@ksc.nasa.gov), MM-G2-A, (407) 867-6747Participating Organization: DynacsEngineering Co., Inc. (P.J. Medelius,J.D. Taylor, J.S. Moerk, J.J. Henderson,<strong>and</strong> J.A. Rees)158