2000-2001 - Kennedy Space Center Technology Transfer Office
2000-2001 - Kennedy Space Center Technology Transfer Office
2000-2001 - Kennedy Space Center Technology Transfer Office

Create successful ePaper yourself
Turn your PDF publications into a flip-book with our unique Google optimized e-Paper software.
Research and <strong>Technology</strong> <strong>2000</strong>/<strong>2001</strong>Research and <strong>Technology</strong><strong>2000</strong>/<strong>2001</strong> ReportJohn F. <strong>Kennedy</strong> <strong>Space</strong> <strong>Center</strong>
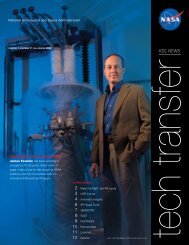
Research and <strong>Technology</strong> <strong>2000</strong>/<strong>2001</strong>ForewordAs the NASA <strong>Center</strong> of Excellence for Launchand Payload Processing Systems and launching spacemissions, the John F. <strong>Kennedy</strong> <strong>Space</strong> <strong>Center</strong> (KSC) isplacing increasing emphasis on advanced technologydevelopment. KSC’s dual mission includes spaceportand range technologies as well as space launch operations.To focus our technology development efforts,we have created a <strong>Space</strong>port <strong>Technology</strong> <strong>Center</strong> initiativewith a portfolio of technology developmentsthat will assist us in improving <strong>Space</strong> TransportationSystem safety, reducing the cost of access to space,and enabling greater commercial success of our spacelaunch industry. Our technology development activitiesencompass the efforts of the entire KSC team,consisting of Government and contractor personnelworking in partnership with academic institutionsand commercial industry. This KSC Research and<strong>Technology</strong> <strong>2000</strong>/<strong>2001</strong> Report demonstrates thesecontributions to the KSC mission.Dr. Dave Bartine, KSC Chief Technologist, (321)867-7069, is responsible for publication of this reportand should be contacted for any desired informationregarding the <strong>Space</strong>port <strong>Technology</strong> <strong>Center</strong> initiative.Roy D. Bridges, Jr.Directori/ii
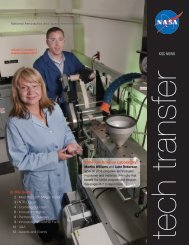
Research and <strong>Technology</strong> <strong>2000</strong>/<strong>2001</strong>CONTENTS (cont)Insight – A Web-Based Data Reporting and Collection System ...............................................................................................68Development of a Methodology and Hardware To Conduct Usability Evaluations of Hand Tools .......................................... 70Development of Human Factor Guidelines for Authentication With Passwords ......................................................................72Human Factors Analysis Leads to Breakthrough Designs in Foreign Object Debris Prevention ............................................. 74Vision <strong>Space</strong>port Model Development ...................................................................................................................................... 76Logistics Spares Model for Human Activity in Near Earth <strong>Space</strong> ............................................................................................ 78Payload Ground Handling Mechanism (PGHM) Project: J-Hook Automation Phase ............................................................ 79Range Technologies ............................................................................................................................................ 81Lightning Launch Commit Criteria ...........................................................................................................................................82Evaluation of a High-Resolution Numerical Weather Prediction Model Over East-Central Florida ......................................84Command, Control, and Monitoring Technologies ..................................................................................... 87Predictive Health and Reliability Management (PHARM) ......................................................................................................88Liquid Oxygen Sensor ...............................................................................................................................................................90Hydrogen Fire Detector .............................................................................................................................................................92Advanced Power Supply Development .....................................................................................................................................94Smart Current Signature Sensor ...............................................................................................................................................96Multisensor Array – Are More Sensors Better Than One? ......................................................................................................98Autonomous Flight Safety System (AFSS) .............................................................................................................................100Infinite Impulse Response Filters for Postprocessing Noisy Field Test Data .......................................................................... 102Wireless Sensor Communication .............................................................................................................................................104Evaluation of the Triboelectric Sensors in the Mars Environmental Compatibility Assessment Electrometer ...................... 106Assessment of Remote Sensing Technologies for Location of Hydrogen and Helium Leaks ................................................... 108Automatic Detection of Particle Fallout in Cleanroom Environments .................................................................................... 110GMT-to-MET IRIG Time Code Simulator ............................................................................................................................. 112Remote Access, Internet-Based Data Acquisition System ....................................................................................................... 114Portable Cart To Support Hypergolic Vapor Detection Instruments ...................................................................................... 116Personal Cabin Pressure Altitude Monitor and Warning System .......................................................................................... 118Integrated Network Control System ........................................................................................................................................120Advanced Hazardous Gas Detection System ..........................................................................................................................122Hazardous Gas Detection System <strong>2000</strong> .................................................................................................................................. 124Leak Detection Point Sensors for Gases .................................................................................................................................. 126iv
Research and <strong>Technology</strong> <strong>2000</strong>/<strong>2001</strong>CONTENTS (cont)Biological Sciences ............................................................................................................................................ 129Evaluation of Two Microgravity-Rated Nutrient Delivery Systems Designed for the Cultivation of Plants in <strong>Space</strong> ..........130Pilot-Scale Evaluation of a New <strong>Technology</strong> To Control Nitrogen Oxide (NO x )Emissions From Stationary Combustion Sources (Phase III) ................................................................................................. 132Earth Systems Modeling and Landscape Management ...........................................................................................................134Threatened and Endangered Species Monitoring ....................................................................................................................136Plant Lighting Systems ............................................................................................................................................................138Candidate Crop Evaluation for Advanced Life Support and Gravitational Biology and Ecology .......................................... 140Impact of Elevated Carbon Dioxide on a Florida Scrub Oak Ecosystem ................................................................................. 142Ground-Based Testbed for Evaluating Plant Remote Sensing Technologies andPlant Physiological Responses to Stressors ......................................................................................................................... 144Survival of Terrestrial Microorganisms on <strong>Space</strong>craft Components andAnalog Mars Soils Under Simulated Martian Conditions ................................................................................................. 146v/vi
Research and <strong>Technology</strong> <strong>2000</strong>/<strong>2001</strong><strong>Technology</strong> Programsand CommercializationIntroductionThe John F. <strong>Kennedy</strong> <strong>Space</strong> <strong>Center</strong> ’s (KSC) outstanding record ofachievements has earned it an honored place in history and an essentialrole in space transportation today. As NASA’s <strong>Center</strong> of Excellence forLaunch and Payload Processing Systems, KSC is increasing the momentumin space-faring technology development for current and future spaceports.The <strong>Space</strong>port <strong>Technology</strong> <strong>Center</strong> (STC) initiative carries out KSC’s rolewithin NASA to meet the goals of increased safety, reduced cost of spaceaccess, and rapid expansion of commercial markets by infusing spaceporttechnologies into all facets of recent and future <strong>Space</strong> Transportation Systems.KSC’s historic background as the nation’s premier launch site createsan ideal environment for the STC. The STC’s knowledge, expertise, facilities,and equipment provide technologies and processes to customers whopropose to build and operate spaceports on Earth, in orbit, and beyond.The STC is composed of three strategic lines of business: <strong>Space</strong>port Operations,<strong>Space</strong>port Design and System Development, and Range <strong>Technology</strong>and Science. KSC has unparalleled expertise in designing, building, andoperating a spaceport with all its complex systems.The thrust of STC technology development activity is concentratedin six <strong>Space</strong>port <strong>Technology</strong> and Science Thrust Areas — Fluid SystemTechnologies; <strong>Space</strong>port Structures and Materials; Process and Human FactorsEngineering; Range Technologies; Command, Control, and MonitoringTechnologies; and Biological Sciences. KSC’s leadership in incorporatingsafer, faster, cheaper, and more robust systems and technologies will pavethe way for future space industry. This report is organized by these six<strong>Technology</strong> and Science Thrust Areas.KSC aggressively seeks industry participation and collaboration in itsresearch and technology development initiatives. KSC also seeks to transferits expertise and technology to the commercial sector and academic community.Programs and commercialization opportunities available to Americanindustries and other institutional organizations are described in the<strong>Technology</strong> Programs and Commercialization <strong>Office</strong> Internet Web site athttp://technology.ksc.nasa.gov. Additional insight into KSC’s <strong>Space</strong>port <strong>Technology</strong><strong>Center</strong> can be found on KSC’s homepage at www.ksc.nasa.gov.vii/viii
Research and <strong>Technology</strong> <strong>2000</strong>/<strong>2001</strong>Figure 3. MIF Graphical User InterfaceKey accomplishments:• Developed the mathematical model ofinductance, magnetic field and force,and circuit model of driving impulsecurrent.• Implemented this model as a WindowsDLL object using Visual Fortran 90.• Interfaced the DLL with a WindowsGUI written under LabView.Contact: Dr. R.C. Youngquist(Robert.Youngquist-1@ksc.nasa.gov), YA-D2-C4,(321) 867-1829Participating Organization: Dynacs Inc. (Dr.C.D. Immer, Dr. J.E. Lane, and Dr. J.C. Simpson)Figure 4. MIF Plots of LOX Level Position and Velocity3
Fluid System TechnologiesMars In Situ Resource Utilization (ISRU) TestbedSeveral scenarios under considerationfor a manned mission to Marsinclude using natural resources availableon Mars to produce fuel andoxidizer for the return to Earth andoxygen for breathing air while onthe surface. The preliminary goal isto demonstrate the ISRU technologyprior to launching a manned mission.NASA at KSC is developing softwareto control the In Situ Propellant Production(ISPP) plant using a languagedeveloped at Ames Research <strong>Center</strong>.In support of the software development,KSC is also building anoperating laboratory-scale productionsystem to serve as a testbed (the ISRUTestbed) for evaluating the controlsoftware.One of the chemical processes proposedfor inclusion in ISRU is awell-known industrial process calleda Reverse Water Gas Shift (RWGS)reaction. To support development ofISRU technology, KSC is building anoperational laboratory-scale RWGSreactor that will demonstrate theRWGS process as well as evaluatethe feasibility of controlling theplant with an autonomous controller.NASA at KSC is using a model-basedreasoning language developed at theAmes Research <strong>Center</strong> to build theautonomous controller.The ISRU Testbed is a laboratory-scaleplant to produce waterand oxygen using hydrogen andcarbon dioxide as raw materials. OnMars, the carbon dioxide would beextracted from the Martian atmosphereand the small amount ofhydrogen would be supplied fromEarth. The hydrogen and carbondioxide are reacted on a catalyst athigh temperature in an RWGS processto create water and carbon monoxide.Electrolysis is then used toseparate the oxygen and hydrogenfrom the water. Oxygen is used forbreathing air or as an oxidizer in abi-propellant fuel system. The hydrogenis recycled back to the RWGS processto produce more water. Ideally,recycling the hydrogen will allow afixed amount of hydrogen carriedfrom Earth to be used to producean unlimited amount of water. Thecarbon monoxide is a waste productthat in the laboratory is vented to afume hood and on Mars is vented tothe atmosphere.In the ISRU Testbed, all theprocess variables (temperatures, pressures,flows, and gas composition)are instrumented electronically so theprocess can be controlled by theautonomous controller software. Processvariables can be changed, andfailure modes can be simulated tostudy both the normal and abnormaloperation of the RWGS process.In addition, the RWGS process foroxygen production can be characterizedand optimized for efficiency.On Mars, mass and power consumptionare critical elements of anysystem; therefore, efficient operationsand light weight are important considerationsin building a flightworthyISRU plant.6
Research and <strong>Technology</strong> <strong>2000</strong>/<strong>2001</strong>ISRU Reverse Water Gas Shift TestbedKey milestones:• May <strong>2000</strong>: Initial operation.• Oxygen production of 1 liter per minute.• Operational characterization underway.Contacts: W.E. Larson (William.Larson-1@ksc.nasa.gov), YA-D4, (321) 867-8747;Dr. C.F. Parrish, YA-D2, (321) 867-8763; Dr. D.E. Lueck, YA-D2, (321) 867-8764;D.B. Hammond, YA-D6, (321) 867-6464; C.M. Ihlefeld, YA-D5, (321) 867-6926; andS.J. Waterman, YA-D6, (321) 867-6688Participating Organizations: Dynacs Inc. (C.B. Mattson, J.D. Taylor, C.H. Goodrich, and T.R.Hodge) and Pioneer Astronautics (B. Frankie)7
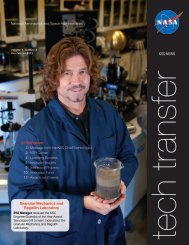
Fluid System TechnologiesSolenoid Inductance and B-Field CalculatorThe primary goal of this workwas to devise a computationally efficientmethod of estimating the inductanceof a solenoid that is arbitrarilyshaped, composed of circular currentloops, and not limited to a specificrange of solenoid geometry values(see figure 1). The key algorithmemployed in this work is the computationof all self- and mutualinductanceterms, since inductance isdefined as the integral of the productof the current density and the magneticvector potential, divided by thecurrent squared. The resulting setof equations can be efficiently implementedin a high-level language suchas C or Fortran in order to computethe total inductance of solenoids ofarbitrary configuration.A common method of computinginductance of a solenoid in manyengineering applications is to identifya handbook formula that most closelyresembles the particular solenoidgeometry at hand. Afterwards, whenbuilding the coil, a fine-tuning can beperformed by adding or subtractingloops of wire.For many applications, it is desirableto have a better method ofestimating the inductance beforereaching the build stage. That is theprimary motivation for the SolenoidInductance Calculator and its methodof using magnetic vector potential forproviding a more precise estimate ofinductance that is not limited to aspecific range of coil geometry values.2byad xxFour inductance calculations areperformed, the first three of which arebased on various handbook formulas.Model 4 is based on a first-principlesapproach in which the inductance iscomputed by means of a double summationof the magnetic field potentialbased on a circular wire loop.LzaM xd zbd zxM zThe mathematical model, consistingof solenoid inductance and threedimensionalB-fields (B x , B z , and|B|), was programmed using Windowsgraphical user interface andlinked as a Fortran Windows application(see figure 2). Magnetic fieldplots (see figure 3) are generatedby writing the field components inthe x-z plane (y=0), B x , B z , andB=(B x 2 +B z 2 ) 1/2 to three output filesand viewing with a general-purposeplotting package.Total Windings: M = M x M zTotal Length: L = (M z -1) d zFigure 1. Solenoid Geometry Model8
Research and <strong>Technology</strong> <strong>2000</strong>/<strong>2001</strong>Key accomplishments:10• Derived a closed-form mathematical expressionfor inductance of a solenoid composed of anycombination of concentric circular loops.• Derived a closed-form solution for the threedimensionalB-field of a solenoid (see the table).• Developed a Fortran Windows application toimplement the solenoid inductance and B-fieldequations.0.020.0150.010.0050-0.0050 1010Contact: Dr. R.C. Youngquist(Robert.Youngquist-1@ksc.nasa.gov), YA-D2-C4, (321)867-18290.020.010Participating Organization: Dynacs Inc. (Dr. J.E. Lane,Dr. J.C. Simpson, and Dr. C.D. Immer)-0.01-0.020 1000.020.0150.010.00500 10Figure 3. Solenoid B-Field Plots: Top, Bz(x,0,z); Middle,Bx(x,0,z); Bottom, |B(x,0,z)|Table 1. Circular Current Loop B-Field FormulasFigure 2. Solenoid Inductance and B-Field Calculator9
Fluid System TechnologiesBuffer Gas Acquisition and StorageThe Martian atmosphere consistsmostly of carbon dioxide (95.5 percent),nitrogen (2.7 percent), andargon (1.6 percent). These gases arenormally at pressures from 6 to 8 torr.Currently, there is a proposal to reacthydrogen that would be transportedto Mars with the atmospheric carbondioxide in order to produce oxygenand methane. The oxygen would beavailable for use as a propellant orfor use in life support. This productionprocess is currently receiving agreat deal of attention. The otheratmospheric gases present, argon andnitrogen, would also be needed toserve as purge gases or to mix withoxygen to form breathing air. One ofthe concerns in doing this, however,is the anesthetic quality that argoncan exhibit when used as a componentin breathing air. Therefore, anyseparation system must be able toseparate the three components to asatisfactory level. One method fordoing this is through the use of membraneswith selective permeability.This study examined several membranes,measuring the permeationrates of the carbon dioxide, nitrogen,and argon. The conditions for thisstudy were varied from -80 degreesCelsius to room temperature and 0.1to 3 bar. The concentrations weremeasured using a gas chromatographequipped with a thermal conductivitysensor. The tests were carried out inthe testbed illustrated in the figure.To date, the membranes haveshown general trends. The first ofthese is increased selectivity at lowertemperatures. The relative permeationrates also showed changes withtemperature.Key accomplishments:• Design and construction of a testbedfor the testing of membranes.• Initial set of membranes testedshowing increased selectivity atlower temperatures.Key milestones:• <strong>2001</strong>: Design of a multi-membranesystem to separate the Martianatmosphere into its components.Construction of a prototype multimembranesystem.• 2002: Testing of the prototypesystem in the Mars atmospherictest chamber.Contact: Dr. C.F. Parrish (Clyde.Parrish-1@ksc.nasa.gov), YA-D2, (321) 867-8763Participating Organizations: Dynacs Inc.(P.H. Gamble, T.R. Hodge, and L. Fitzpatrick),Florida Institute of <strong>Technology</strong> (P.A.Jennings), and Enerfex (R.A. Callahan)10
Research and <strong>Technology</strong> <strong>2000</strong>/<strong>2001</strong>WTMFCArgonCVXducerTo GCFCNitrogenCVMembraneFCCarbonDioxideCVTo GCTTo GCPCLegend:FCCVXducerWTMGCTPCPumpFlow ControllerCheck ValvePressure TransducerWet Test MeterGas ChromatographThermometerPressure ControllerVacuum PumpWTMPumpTestbed11
Fluid System TechnologiesMars In Situ Resource Utilization (ISRU) Oxygen ProductionISRU is one of the enabling technologies for Human Explorationand Development of <strong>Space</strong> (HEDS) missions. The atmosphereon Mars is nearly 95 percent carbon dioxide (CO 2 ), withnegligible oxygen. For a HEDS mission to Mars, an In SituPropellant Production (ISPP) plant is a key technology for manufacturingthe oxygen required by a Mars ascent vehicle, surfacepower, and life support. CO 2 can be catalytically reduced by avariety of chemical processes such as the reverse water gas shift(RWGS) reaction and the Sabatier reaction (equations 1a and1b). The subsequent electrolysis of water (equation 2), which isproduced in each of these reactions, generates oxygen.CO 2 + 4H 2 ßà CH 4 + 2H 2 O (Sabatier reaction)CO 2 + H 2 ßà CO + H 2 O (RWGS reaction)(1a)(1b)2H 2 O ßà 2H 2 + O 2 (water electrolysis) (2)Oxygen can also be obtained by the direct electrolysis of CO 2 :2CO 2 ßà 2CO + O 2 (CO 2 electrolysis) (3)The direct electrolysis of CO 2 was studied using zirconiabasedelectrolysis cells. Zirconia is a ceramic material thatbecomes conductive at high temperatures and will transportoxygen ions through the molecular lattice under the influence ofan applied electric field. At temperatures around 900 degreesCelsius (°C), substantial currents can be obtained, and CO 2 canbe electrochemically reduced to oxygen. However, the veryhigh temperatures of operation limit materials of construction toceramics since most base metals are quickly oxidized at thesetemperatures with high oxygen concentrations. Moreover, zirconiais quite fragile to thermal or mechanical shock, particularlyin the thin membranes used in these cells to lower the resistanceand decrease resistive losses in the cell. Any crack in the membranes(multilayered cells are required for large-scale production)will result in contamination of the product oxygen withCO 2 or carbon monoxide. Such contamination would render theoxygen unsuitable for breathing air, one of its intended uses.The zirconia cell operates at about 1.6 volts, consuming about 50percent more energy than theoretically required for this reduction.A High-Pressure Electrochemical ReactionChamber for Use With Liquid CO 2In spite of the shortcomings associated with the zirconia electrolysiscells, the advantages of the direct electrolysis of CO 2to generate oxygen are quite significant and, therefore, warrantfurther investigation and development. Numerous electrochem-12
Research and <strong>Technology</strong> <strong>2000</strong>/<strong>2001</strong>ical systems can be envisioned to formthe basis of a CO 2 electrolysis cell, andmany of these systems operate at considerablylower temperatures than zirconia-basedcells. Potentially applicablesystems include molten salts, nonaqueoussolvents, and low-temperature ionicconductors. Oxygen production inspace cabins via the direct electroreductionof CO 2 using molten carbonateelectrolytes was first consideredin the 1960’s. The molten carbonatesystem operates between 500 and 700°C, which in itself represents a significantimprovement of the zirconiasystem. Moreover, the molten carbonateelectrolysis cell would be analogousto the molten carbonate fuel cell, a technologythat is currently in full-scaleproduction of high-throughput systems.Thus, many of the issues concerningmaterials of construction have alreadybeen addressed. There are, in addition,several viable approaches for performingroom-temperature CO 2 electrolysis.Because of possible interferingreactions with proton reduction, aqueoussystems do not readily accommodatethe requirements for CO 2electrochemical reactions. While theseinterferences can be circumvented bya variety of methods, nonaqueous solventshave a broader electrochemicalwindow than the traditional watersystem, and such solvents [e.g., acetonitrile,propylene carbonate, and dimethylsulfoxide (DMSO)] have been appliedfor CO 2 electrolysis. Moreover, CO 2 hasa very high solubility in many of thesesolvents. In addition, there is agroup of chemicals, the so-called ionicliquids (IL), that are essentially roomtemperaturemolten salts. The highionic conductivity, high solubility tomany solutes, and broad electrochemicalwindow make the IL’s ideal for electrochemicalapplications.CO 2 electrolysis is a heterogeneous processthat requires the transport of CO 2 gas to a solidelectrode. Even in traditional liquid-phase electrochemistry,gaseous CO 2 must first dissolve inthe solvent and, even in the best solvent, thetypical CO 2 concentration at standard temperatureand pressure (STP) is less than 10 millimoles.The bulk concentration of CO 2 ultimatelylimits the rate of reaction. One unique approachto maximize the CO 2 concentration is to performelectrolysis directly on liquid CO 2 . Liquid CO 2is readily miscible in many of the nonaqueousand IL systems. At room temperature, CO 2 condensesat approximately 800 pounds per squareinch and has a concentration of approximately13 moles. Such high-pressure operation doesrequire special apparatus for performing electrochemicaloperations (e.g., feedthroughs for electrodesand sample inlet and outlet ports). Acustom-built test chamber was developed (seethe figure) and used for evaluating the feasibilityof liquid CO 2 electrolysis.Key accomplishments:• Set up and tested a molten carbonate electrolysiscell for CO 2 reduction at 600 °C.• Evaluated numerous nonaqueous solvents forCO 2 reduction.• Designed, built, and tested a high-pressurereaction chamber for evaluating electrochemicalapplications of liquid CO 2 . Several nonaqueoussolvent systems were screened foruse in liquid CO 2 .Key milestones:• Model and quantify the critical parametersthat control sustainable CO 2 reduction.• Down-select the most promising approach forscale-up.Contact: Dr. D.E. Lueck (Dale.Lueck-1@ksc.nasa.gov),YA-D2, (321) 867-8764Participating Organization: Dynacs Inc. (Dr. W.J.Buttner and J.M. Surma)13
Fluid System TechnologiesImplementation of New Scrubber Liquor for Nitrogen TetroxideScrubbers That Produces a Commercial FertilizerNASA, in conjunction with DynacsInc. and United <strong>Space</strong> Alliance, hasinstalled a prototype for the newscrubber liquor control system at theLaunch Pad 39A oxidizer scrubberfarm. The new system converts thenitrogen tetroxide (N 2 O 4 /NTO), thehypergolic oxidizer, into a fertilizer.The fertilizer produced is providedto the contractor who manages thecitrus groves at KSC. This is PhaseV of the project that seeks to complywith Executive Orders 12856 and12873, the Right-to-Know Laws andthe Recycling and Waste PreventionLaw. Hypergolic propellants are usedin spacecraft such as the <strong>Space</strong> Shuttle,Titan IV, Delta II, and othervehicles and payloads launched atKSC and Cape Canaveral Air ForceStation. Monomethylhydrazine(MMH), N 2 O 4 /NTO, and hydrazine(N 2 H 4 /HZ) are the main propellantsof concern. Fueling and deservicingspacecraft constitute the bulk of operationsin which environmental emissionsof nitrogen oxides (NO X ) occur.The scrubber liquor waste generatedby the oxidizer scrubbers (approximately311,000 pounds per year) isthe second largest waste stream atKSC. The disposal cost for this oxidizerscrubber liquor waste is approximately$0.227 per pound or $70,600a year.The new process converts thescrubber liquor into a high-gradefertilizer. The process reacts N 2 O 4with hydrogen peroxide and potassiumhydroxide to produce potassiumnitrate, a major ingredient incommercial fertilizers. This processavoids the generation of the hazardouswastes, which occur whensodium hydroxide is used as thescrubber liquor. A patent applicationthat covers the process has been filedwith the U.S. Patent and Trademark<strong>Office</strong>.The system was installed on Pad39A in March <strong>2000</strong> and was usedto support all the launches from thispad for the remainder of the year.During these support operations, severalthousand gallons of fertilizerwere produced that would haveotherwise been hazardous waste.During the year a need was identifiedto actively control the concentrationof the fertilizer being produced toeliminate the chance of precipitatingpotassium nitrate. This feature wasimplemented late in the year andhas resolved the issue of precipitation.Also during this prototypeimplementation phase, other difficultieswere encountered. These problemswill result in an evaluation ofthe prototype and the addition of featuresto solve the problems before fullimplementation of the system continues.Key accomplishments:• Developed a method to eliminatethe second largest waste streamat KSC (oxidizer scrubber liquorwaste).• Developed internal diagnostics thatmonitor the performance of thesystem.• Developed a production processfor potassium nitrate, a fertilizercurrently used by KSC for use onlawns and citrus groves.• Demonstrated that the process controlsystem is robust and can with-14
Research and <strong>Technology</strong> <strong>2000</strong>/<strong>2001</strong>Oxidizer Scrubber Farmstand field operations.• Installed the system at the Pad 39A oxidizer scrubber farm.• Supported three <strong>Space</strong> Shuttle launches using the new scrubbercontrol system.• Granted an exclusive license to a commercial company for thetechnology (it is pursuing its use at both foreign and domesticpower plants).Key milestones:• Address the user needs for additional features.• Test the new features before returning the prototype for implementationtesting.• Construct units for implementation at the remaining KSCsites.Contacts: Dr. C.F. Parrish (Clyde.Parrish-1@ksc.nasa.gov), YA-D4, (321)867-8763; and A.O. Kelly, PH-G, (321) 867-0252Participating Organization: Dynacs Inc. (P.H. Gamble, T.R. Hodge, P.W.Yocom, and S.L. Parks)15/16
Research and <strong>Technology</strong> <strong>2000</strong>/<strong>2001</strong><strong>Space</strong>port Structures and Materials<strong>Space</strong>port Structures and Materials include materials science andengineering and mechanical engineering skills, laboratories, andtestbeds necessary for design, analysis, operation, and maintenanceof a <strong>Space</strong>port’s unique facilities, structures, and support equipment.Activities/focus areas include the following:• Launch Structures and Mechanisms• Corrosion Science and <strong>Technology</strong>• Electromagnetic Physics• Nondestructive EvaluationThe goals and objectives of <strong>Space</strong>port Structures and Materialsinclude the following:• Ensure safe, efficient, and reliable structures techniques• Enhance reliability and reduce maintenance cost of infrastructure• Improve safety and reliability of operations through detection,mitigation, and prevention of electrostatic generation on equipment• Participate in development of specialty materials in support offuture structures and materials initiatives• Improve safety of operations and reduce inspection costsFor more information regarding <strong>Space</strong>port Structures andMaterials, please contact Karen Thompson, (321) 867-7051,Karen.Thompson-1@ksc.nasa.gov; Orlando Melendez, (321)867-6379, Orlando.Melendez-1@ksc.nasa.gov; or Carlos Calle,(321) 867-3274, Carlos.Calle-1@ksc.nasa.gov.17
<strong>Space</strong>port Structures and MaterialsUse of Computed Tomography (CT) for CharacterizingMaterials Grown Terrestrially and in MicrogravityThe NASA/KSC Industrial CTsystem is tasked to determine noninvasivelythe density and compositioncharacteristics at the mole fractionlevel of Earth-grown and microgravity-grownindustrial-grade crystallinematerials. Materials, such asmercury-cadmium-telluride used forinfrared camera detectors, can begrown in the absence of gravity (onthe <strong>Space</strong> Shuttle and eventually the<strong>Space</strong> Station) to a higher degree ofpurity than those grown on Earth.The typical analysis of mole fractionsof key elements that determinethe integrity and quality of thecrystal has been limited to invasivetechniques such as electron dispersivespectroscopy (EDS). Thesetechniques are time-consuming andworker-intensive. The NASA/KSCCT system produced viably similarresults by making tomograms (slicepictures) of the materials. By applyingtechniques of relating mass attenuationcoefficients to the CT data,Inspection of the OMEmole fraction composition of key elementsin the crystalline material canbe determined. To date, the correlationof CT results as comparedwith the EDS technique has been verygood.The use of CT for the task ofdetermining crystal composition willgreatly reduce the labor requirements(especially time) for analysis. Inaddition, the CT method is entirelynoninvasive and leaves the sampleintact. The crystal samples are madeby melting the necessary materialsin tube-type “furnaces” and allowingthe subsequent solidification (crystallization)process to occur. This processwas tested on Earth and on the<strong>Space</strong> Shuttle and, in the future, willbe tested on the <strong>Space</strong> Station. Aprime advantage of using CT for theanalysis is that the material does notneed to be removed from the furnace.The CT system uses cobalt-60, anear monoenergetic energy source ofabout 1.25 megaelectrovolts (MeV) topenetrate the subject scanned. Thenby methods similar to the medical“CAT” scanners, it acquires data andreconstructs an image of a thin crosssection of the object. There is virtuallyno spatial (geometric) distortionin the resultant image as alwaysfound in conventional radiography oreven digital radiography. Since spectraleffects of the data acquisition arelow by using the cobalt source, theaccuracy of a correlation of imagedata (pixels) and true material densityis remarkably good. From thiscorrelation, the various mole fractionsof elements involved and their locationin a melt can be deduced. A CTinspection of a crystal melt encom-18
Research and <strong>Technology</strong> <strong>2000</strong>/<strong>2001</strong>passes the entire axial extent, whichmay be a rod of about 1-centimeterdiameter and 10 to 20 centimeterslong. CT data is acquired incontiguous slices (for example,every 1 millimeter along the crystalaxis). This project is ongoing andis funded under the NASA-98-HEDS-05 program for the next 3years.The NASA/KSC CT system wasalso tasked to perform numerousnoninvasive inspections of materialsand systems associated withthe aerospace program. Objects assmall as a watch and as large as theorbital maneuvering engine (OME)have been inspected for part fitand material integrity. The accompanyingfigures of an OME illustratesuch an inspection. Shuttletires, tiles, switches, relays, hydrogentanks, external tank quickdisconnect valves, “pogo” fuellines, OMS motor valves, andnumerous non-Shuttle objects havebeen inspected since the CT wasfirst tasked to service in 1985.While originally devised as a nondestructiveengineering tool forflaw detection, the CT has farexceeded its intended use by beingable to accurately provide internaldimensional and density analysisfor material components and theircomposition.CT Slice of OME Near the Exit NozzleContact: S.J. McDanels(Steven.McDanels-1@ ksc.nasa.gov), YA-F1-M1, (321) 867-3400Participating Organization: Wyle Laboratories,Inc. (H.P. Engel)OME Digital Radiogram19
<strong>Space</strong>port Structures and MaterialsDevelopment of Volatile Organic Compound CompliantPrimerless Silicone Coatings for Corrosion ControlNASA and other internationalspace organizations face the difficultchallenge of protecting launch padstructures from corrosion. Thin-gagesteel and aluminum structures, suchas protective bellows around drivemechanisms, flex repeatedly and consequentlyrequire highly flexible andadherent coatings. The aerospaceindustry has traditionally used paintshaving high volatile organic compound(VOC) content for protectingvehicles and support structures.State-of-the-art flexible paints employsolventborne rubber binder resins,which render the products highlyviscous and difficult to apply byspraying. Silicone-based paints areformulated to yield temperature- andweather-resistant coatings that preventcorrosion by forming effectiveelectrolyte barriers. However, siliconesare normally delivered fromorganic solvents and exhibit pooradhesion to unprimed metals.Formulation of anticorrosionpaints from silicone dispersion, stabilizedwith novel polymeric surfactantsand pigmented with nontoxicanticorrosive additives, may be thesolution to the limitations of conventionalsilicone coatings. Thelatter silicone-modified polymersyield emulsions that strongly adherethe coating to metal surfaces. Byforming a topcoat-bound primerlayer in situ, low-VOC coatingshaving simple application propertiesand outstanding corrosion resistancecan be formulated. Dispersions basedon silicones and polymeric surfactantsshould have significantly loweremissivity than conventional waterborneand solventborne products.Electrochemical Instrumentation20
Research and <strong>Technology</strong> <strong>2000</strong>/<strong>2001</strong>Electrochemical Cell for Coating CharacterizationSuccessful development and continued optimization of primerless silicone paints thatprovide increased levels of performance while minimizing VOC’s can benefit NASA’smissions by combating corrosion on both aerospace vehicles and launch equipment. Commercialpatents from this technology would enhance KSC’s ability to attract industrypartners for similar corrosion control applications.The newly developed VOC-compliant primerless silicone coatings for corrosion controlare currently being characterized at the KSC Corrosion <strong>Technology</strong> Testbed Facilities. Thetests involve exposure at the outdoor corrosion test site and investigation of the corrosionprevention mechanism by electrochemical techniques in the corrosion laboratory.Key accomplishments:• Phase I: Developed a formulation that yielded the best adhesion and corrosion-inhibitingproperties. Identified and tested new waterborne binder resins, corrosion inhibitors,and additives to improve the coating properties. The coating was reformulated to yieldtougher coating films while preserving the desirable adhesion, sprayability, flexibility,dry time, and corrosion inhibition exhibited by the starting formulations. The newformulation was used to prepare coated metal panels for outdoor testing at KSC.• Phase II: Advanced and refined the waterborne silicone coating technology developedin Phase I into a commercially viable family of coating products for providing long-termcorrosion protection for ferrous and nonferrous metallic substrates. The ultimate goalwas to provide an effective, environmentally sound method for protecting aluminum andsteel surfaces in a harsh marine environment without introducing additional pretreatmentand priming steps.Contacts: Dr. L.M. Calle (Luz.Calle-1@ksc.nasa.gov), YA-F2-T, (321) 867-3278; and L.G. MacDowell, YA-F2-T, (321) 867-4550Participating Organization: Cape Cod Research (F. Keohan)21
<strong>Space</strong>port Structures and MaterialsCharacterization of Molybdate Conversion Coatings forAluminum and Its AlloysChromate conversion coatingshave been used for the protection ofaluminum alloys for over 70 years.Although their efficiency in minimizingcorrosion attack is excellent, thereare health and safety concerns overtheir use because of their toxicity andcarcinogenic nature. NASA at KSChas used chromate-based coatings onmany of its spacecraft and desires toreplace these harmful chemicals withsafer coatings. Despite an extensiveresearch effort over the past decade,a completely satisfactory replacementfor chromate conversion coatings hasyet to be identified.An environmentally friendly aluminumcoating for Government andindustrial applications resulted fromcollaboration between Lynntech, Inc.of College Station, Texas, and KSC.Lynntech participated with KSC’sLabs and Testbeds Division under aSmall Business Innovation Research(SBIR) contract to develop a molybdate-basedconversion coating foraluminum and aluminum alloys.This innovation, referred to asMolyseal, is important because it containsmolybdate instead of chromate.Molybdate mimics chromate in manyof its applications, but it exhibits significantlylower toxicity. Tests demonstratedan exceptional corrosionprotection by the new coating preparedfrom formulations consistingof molybdates and several additives.Some Molyseal coatings outperformedthe chromate-based conversioncoatings in electrochemicalcorrosion-resistance tests and passeda standard 336-hour salt fog test.These results established a soundtechnical feasibility for this newmolybdate conversion coating.Lynntech applied for several patentsrelating to this technology andformed an alliance with multipleindustrial partners in the metal finishingindustry. Since Lynntech is atechnology innovation and develop--0.4-0.5Corrosion Potential (V sce)-0.6-0.7-0.8-0.9Formulation AFormulation BFormulation CFormulation DFormulation EFormulation FAluminum Alloy-1.0-1.10 20 40 60 80 100 120 140 160 180Time (hours)Corrosion Potential as a Function of Immersion Time in 5-Percent NaCl22
Research and <strong>Technology</strong> <strong>2000</strong>/<strong>2001</strong>300Counts<strong>2001</strong>0000 2 4 6 8 10Energy (keV)SEM Micrograph of Corrosion-Coated(Formulation A) Aluminum AlloyEDS Spectrum of Conversion-Coated(Formulation A) Aluminum Alloyment company, its goals are to move thisinnovation to the precommercial stage, secureappropriate patents rights, and then licensethe technology to an interested manufacturerfor entry into the commercial sector.Six proprietary formulations of the Molysealcoatings on aluminum alloy 2024-T3were characterized in the Corrosion <strong>Technology</strong>Testbed, Labs and Testbeds Division,by Electrochemical Impedance Spectroscopy(EIS), Scanning Electron Microscopy (SEM),Energy Dispersive Spectroscopy (EDS), andX-Ray Photoelectron Spectroscopy (XPS).EIS was used to investigate the corrosion-inhibitingproperties of the molybdateconversion coatings on aluminum alloy2024-T3 under immersion in aerated 5-percentsodium chloride (NaCl). Corrosionpotential and EIS measurements were gatheredfor six formulations of the coating at severalimmersion times for 2 weeks. Nyquist aswell as Bode plots of the data were obtained.The conversion-coated alloy panels showedan increase in the corrosion potential duringthe first 24 hours of immersion that later subsidedand approached a steady value. Corrosionpotential measurements indicated thatformulations A, D, and F exhibit a protectiveeffect on aluminum 2024-T3. TheEIS spectra of the conversion-coated alloywere characterized by impedance that ishigher than the impedance of the barealloy at all the immersion times. The lowfrequencyimpedance (Z lf ) [determinedfrom the value at 0.05 hertz (Hz)] forthe conversion-coated alloy was higher atall the immersion times than that of thebare panel. This indicates improvementof corrosion resistance with addition ofthe molybdate conversion coating. SEMrevealed the presence of cracks in the coatingand the presence of cubic crystalsbelieved to be calcium carbonate. EDS ofthe test panels revealed the presence ofhigh levels of aluminum, oxygen, and calciumbut did not detect the presence ofmolybdenum on the test panels. XPS indicatedthe presence of less than 0.01 atomicpercent molybdenum on the surface of thecoating.Contacts: Dr. L.M. Calle (Luz.Calle-1@ksc.nasa.gov), YA-F2-T, (321) 867-3278; andL.G. MacDowell, YA-F2-T, (321) 867-4550Participating Organization: Lynntech, Inc.23
<strong>Space</strong>port Structures and MaterialsHigh-Temperature Polyimide Foams, Cell Surface Area,and Flame RetardancyAromatic polyimides have beenused for applications in the aerospaceand electronics industries. Uniqueproperties, such as thermal andthermo-oxidative stability at elevatedtemperatures, chemical resistance, andmechanical properties, are common forthis class of materials. Newer to thearena of polyimides is the synthesisof polyimide foams. These polyimidefoams were developed by LangleyResearch <strong>Center</strong> for high-performanceapplications like the Reusable LaunchVehicle (RLV) program. Because ofa polyimide’s high operating temperature(approximately 260 degreesCelsius) and cryogenic insulation properties,structural polyimide foams canpotentially reduce the amount of ThermalProtection System (TPS) integrationstructure that is required on anRLV and the total amount of TPSrequired. The reduction in the TPSintegration structure would reduce thetotal weight of and cost to build an RLV.This would allow the maximum pay-NOOTEEK-HH and HL (ODPA/3,4'-ODA)NOOTEEK-LL, LH and L8 (BTDA/4,4'-ODA)NOOOOCOCTEEK-CL (BTDA/4,4'-DDSO 2 )OFigure 1. Chemical Structures of FoamsOOOOONNNOOSO 2nnnload weight to increase and make the vehicle more efficient forcommercial applications.It is also essential to the development and application of newmaterials for the next-generation vehicles to understand their fireperformance (fire performance is always a significant concernat KSC). In this research partnership, three different, closelyrelated polyimide foams are comparatively studied, including thermal,mechanical, surface, flammability, and degradation properties.Although polyimide properties were studied previously, the datarelates to films and not to foams. Foams have much more surfacearea and present a greater challenge to fire retardancy. Understandingdegradation and properties (such as flame retardancy)versus structure (foam versus solid) is fundamental to pioneeringresearch into polyimide foams and polymeric foams in general.Subtle differences in structure, varying densities, and cell surfacearea are researched to establish correlations to flame retardancy.Data gained from this research reveals vital information involvingfoam technology and flame retardancy.Chemical structure, densities, and cell surface area versus flammabilitydata are reported to validate the high performance of thesematerials. Other research indicated these materials can endure therigors of space and space-like environments. Flammability resultsindicate these materials are well suited for extremely combustibleenvironments and will maintain dimensional stability during exposureto high temperature and flames. Those properties also makethese materials top candidates for the aircraft and fire-resistantbuilding materials industries.The flammability properties were characterized using ignitability(NASA-STD-6001 and ASTM G72), Radiant Panel (ASTM E162),Oxygen Index (ASTM D2863), Cone Calorimetry (ASTM E1354),and LOX Mechanical Impact Testing (ASTM D2512). Stability anddegradation of the foams are being especially studied using theelevated temperatures of the Radiant Panel and the Cone Calorimeter.The structures seen in figure 1 indicate only subtle differencesin chemical composition among the three polymers. The tableprovides chemical names and densities of the different materialsstudied.The percentage of shrinkage and the charring phenomena of thedifferent foams reveal differences. It shows that density and chemicalstructure play a role, but importantly, cell surface area appearsto play the greatest role in the shrinkage, as observed in TEEK-HL[0.032 gram per cubic centimeter (g/cm 3 )] versus TEEK-HH (0.08224
Research and <strong>Technology</strong> <strong>2000</strong>/<strong>2001</strong>Foam,Density (g/cm 3 )TEEK-HH(0.082)TEEK-HL(0.032)TEEK-L8(0.128)TEEK-LH(0.082)TEEK-LL(0.032)TEEK-CL(0.032)Table 1. Foam Densities and DescriptionsDescriptionODPA/3,4’-ODA (4,4 oxydiphthalicanhydride/3,4-oxydianiline)ODPA/3,4’-ODA (4,4 oxydiphthalicanhydride/3,4-oxydianiline)BTDA/4,4’-ODA (3,3,4,4-benzophenenonetetracarboxylicdianhydride/4,4-oxydianiline)BTDA/4,4’-ODA (3,3,4,4-benzophenenonetetracarboxylicdianhydride/4,4-oxydianiline)BTDA/4,4’-ODA (3,3,4,4-benzophenenonetetracarboxylicdianhydride/4,4-oxydianiline)BTDA/4,4’-DDSO 2 (3,3,4,4-benzophenenonetetracarboxylicdianhydride/4,4-diaminodiphenyl sulfone)g/cm 3 ). (See figure 2.) When comparing cone calorimetrydata (peak heat release rate) and cell surfacearea, a qualitative correlation is also observed infigure 3. When comparing foams of the same densitiesbut with subtle differences in chemical structure,the greater cell surface area TEEK-HL exhibits significantshrinking and degradation over TEEK-LL orTEEK-CL. For foams of similar chemical structureand thus similar average rates of heat release, cellsurface area assumes a dominant role in fire performance.Because of the intrinsic flame-retardant propertiesof polyimides, this research has given insight into thedirect correlation of chemical structure, surface area,and flame retardancy of foams.Key accomplishments:25.0020.0015.0010.005.000.00TEEK-LLTEEK-CLTEEK-HLTEEK-HH(A)TEEK-HH(B)TEEK-L8TEEK-LH• First polymer developmental research alliancebetween KSC and a NASA research center (underthe auspice of the Dryden Memorial Fellowship).This collaborative research effort also includesnational and international experts from NASA andacademia.• Revelation of fundamental information involvingfoam technology and fire retardancy, labeling theresearch as pioneering in nature.• Presentation and publication with the AmericanChemical Society in <strong>2000</strong>, including a book chapteron fire and polymers.SA Avg. square meters/per gram (m 2 /g)Shrinkage %Figure 2. Surface Areas of Foams Versus Percent ShrinkageKey milestone:• Several more publications are scheduled for thenext year, including international publications.2520151050TEEK-HHTEEK-HLTEEK-L8TEEK-LHTEEK-LLTEEK-LC6050403020100Contact: M.K. Williams (Martha.Williams-1@ksc.nasa.gov),YA-F2-T, (321) 867-4554Participating Organizations: Langley Research <strong>Center</strong> (E.S.Weiser), Florida Institute of <strong>Technology</strong> (G.L. Nelson and J.R.Brenner), and White Sands Test Facility (J. Haas)SAPHRR/50Figure 3. Surface Areas of Foams Versus Peak Heat ReleaseRate at 50 Kilowatts per Square Meter (kW/m 2 )25
<strong>Space</strong>port Structures and MaterialsElectrostatic Properties of Materials in aSimulated Martian EnvironmentThe Electromagnetic Physics Laboratoryis engaged in experiments tolearn about the electrostatic propertiesof materials exposed to the Martianregolith. Several techniques arecurrently being used to measure thegeneration of electrostatic charge bycontact or friction between Martianregolith simulant particles and severalinsulating materials.Potential problems regarding thegeneration of static charge on somematerials stem from the compositionof the Martian soil and from theabsence of significant amounts ofwater on the surface or in the atmosphereof the planet. The surfaceof Mars is covered with a thin layerof fine dust particles of only a fewmicrons in diameter. Particles of thissize pose special problems becausethey have increased mobility whentransported by the wind, which canreach speeds of 30 meters per second.Electrostatic charges can be generatedwhen these fine particles are in contactwith solid surfaces.The project was initiated in March1998. A 40-inch-diameter by 60-inchlongvacuum chamber was acquiredin April 1998 and was modifiedfor KSC’s experimental needs. Thechamber operation was completelyautomated during the summer of<strong>2000</strong>. A robotic tester was designedto operate remotely in the vacuumchamber and is in its final stagesof development. A remotely controlledlinear rubbing machine wasconstructed and is in operation. AMartian regolith soil simulant wasobtained from Johnson <strong>Space</strong> <strong>Center</strong>to research the possible electrostaticcharging of Martian sands. The soilsimulant was prepared from volcanicash from the Pu’u Nene cinder coneon the island of Hawaii. Consequently,a prototype was designedand built for the soil simulant deliverysystem. An improved dustdelivery system was designed andrecently received by KSC’s laboratory.This system simulates the Martianatmospheric movement of the dustparticles to determine if there iselectrostatic charge generation onselected materials. The researchefforts in the upcoming year willfocus on mathematical simulationand analyses of the interaction ofmoving dust particles and stationarysurfaces, experimental studies ofthese interactions, testing of the materialsselected for future Mars missions,and testing of the simulant soiland materials at ambient conditionsas well as in the Martian environment.Key accomplishments:• Designed and fabricated Mars simulationchamber.• Procured and upgraded thevacuum chamber.• Performed total integrated automatedcontrol of the vacuum chamberoperation.• Obtained and analyzed the Martianregolith soil simulant.• Built and tested the first proof-ofconceptprototype and improvedthe system for soil simulant delivery.• Completed the robotic tester andlinear rubbing machine.26
Research and <strong>Technology</strong> <strong>2000</strong>/<strong>2001</strong>Electrostatics Robot• Participated in the design of the Mars Environmental Compatibility Assessment (MECA)electrometer.• Obtained a joint patent with the Jet Propulsion Laboratory for a unique electrometer design.• Presented several papers at the following conferences and journals:– Journal of Electrostatics– Annual Meeting of the American Physical Society– Meeting of the Aerospace and Test Measurement Division of the Instrumentation, Systems,and Automation Society– Institute of Electrical and Electronics Engineers (IEEE) Aerospace Conference– Nano<strong>Space</strong> <strong>2000</strong>Key milestones:• Mathematical simulation and analyses of moving dust particles.• Experimental studies of these interactions.• Testing of the materials selected for future Mars missions.• Testing the simulant soil and materials at ambient conditions as well as in the Martianenvironment.Contact: Dr. C.I. Calle (Carlos.Calle-1@ksc.nasa.gov), YA-F2-T, (321) 867-3274Participating Organizations: Florida Institute of <strong>Technology</strong> (Dr. J. Mantovani), Jet Propulsion Laboratory(Dr. M. Buehler), Swales Aerospace (Dr. C. Buhler), Wilkes University (A. Linville), YA-F2-T (Dr. R.H. Gompfand E.E. Groop), and YA-F1-T (D.C. Lewis and P.F. Richiuso)27
<strong>Space</strong>port Structures and MaterialsElectrostatic Properties of Lunar DustData from the Apollo program and recentlunar missions indicate electrostatic chargingand discharging phenomena take placeon the Moon. A horizon glow roughly1 meter above the surface of the Moonwas detected by Surveyor 5, 6, and 7 andmore recently by the Clementine spacecraft.Experiments on Apollo 17 detected evidenceof horizontal dust transport on thelunar surface. Dust dynamics such asthese are thought to be the result of electrostaticcharging of the dust particles createdby their interaction with the photoelectronlayer above the lunar surface.Electrostatic charge is transferredbetween two surfaces whenever a contactpotential exists between the surfaces. Asthe surfaces separate, the charge is drivenback across the interface to prevent thepotential from increasing. The maximumcharge that can be acquired by an isolatedsurface is limited by electrical breakdown.The potential at which electrical breakdownoccurs, as given by Paschen’s law, dependson the pressure of the mediumin which the solids are embedded.At the high-vacuum conditions ofthe lunar environment, this potentialcould be large for certain separationdistances.The Electromagnetic Physics Laboratoryis currently studying the extentto which electrostatic charge can begenerated and how it can accumulateon the lunar soil and dust particles.Lunar simulant samples prepared byJohnson <strong>Space</strong> <strong>Center</strong> from a volcanicash deposit near Flagstaff, Arizona,were received in KSC’s laboratory. Ascanning electron microscope analysisof this simulant was performedto characterize its composition. Thesimulant was exposed to high-electricfields under extreme low-humidityconditions to obtain values for itsGauss limit and to study its dischargecharacteristics. A typical decay curveis shown in figure 1. Charge-to-massFigure 1. Charge Decay for Lunar Soil Simulant28
Research and <strong>Technology</strong> <strong>2000</strong>/<strong>2001</strong>Figure 2. Rocking With Lunar Soil Simulant in Dry Air (760 Torr)ratios for these materials are also being determinedto understand the different electrostatic responsesof individual dust particles, larger clumps of particulatematter, and sand-like particles. Severalmaterials were also rubbed with the simulant todetermine their electrostatic response. Typical voltagesobtained are shown in figure 2.The findings from this research effort will providecritical information and techniques for thesuccessful operation of an extraterrestrial spaceport.The results could eliminate potential hazardsrelating to dust accumulation on equipment surfaces,astronaut suits, solar panels, habitat filters,thermal radiators, and other equipment that woulddegrade their performance or render them unusable.Commercial applications of the technologiesdeveloped could include the antistatic, paint, andgrain industries.Key accomplishments:• Acquisition of an environmental chamber and acharge-to-mass system.• Scanning electron microscope characterization oflunar simulant particles.• Determination of the electrostatic response oflunar simulant particles exposed to insulatingmaterials at low-humidity and low-pressure conditions.• Determination of the maximum charge andcharge relaxation times of lunar simulant dustparticles.• Determination of the charge-to-mass ratio of adistribution of lunar granular particles.Key milestones:• Experiment with actual lunar dust.• Determine the charge generated on dust particlesby photoemission due to ultraviolet absorption.• Expose materials to charged and unchargedlunar dust under simulated lunar environmentalconditions.Contact: Dr. C.I. Calle (Carlos.Calle-1@ksc.nasa.gov), YA-F2-T, (321) 867-3274Participating Organizations: Swales Aerospace (Dr. C.Buhler), Florida Institute of <strong>Technology</strong> (Dr. J. Mantovani),and YA-F2-T (E.E. Groop)29
<strong>Space</strong>port Structures and MaterialsMars Electrostatics ChamberTo fill the need for the increasedresearch activity around NASA’sexploration of Mars, the ElectromagneticPhysics Testbed at KSC activatedthe <strong>Center</strong> ’s first operationalMars environmental simulation process– the Mars Electrostatics Chamber.Several important environmentalcharacteristics of Mars were replicatedin this chamber, includingtemperature, pressure, and atmosphericcomposition. Existing andnewly acquired hardware was integratedwith a centralized controllerto bring about successful near-autonomousoperation.The Mars Electrostatics Chamberis 2 meters (m) in length, is 1.3m in diameter, and has a volumeof 1.5 cubic meters (m 3 ) (figure 1).The chamber has a 1.43- x 0.80-mExperiment Deck, a vacuum depressurizationtime of 20 minutes, and acontrolled repressurization time of 10minutes. It can be repressurized inan emergency in 10 minutes. AccessFigure 1. Mars Electrostatics Chamberports are provided for componentand peripheral device feed-through,existing pressure measurement, temperaturesignal lines, gas feedthroughs,and payload monitoring.The inside of the chamber is fittedwith a cooling shroud.The Mars Electrostatics Chamberhas an automated control system witha graphical user interface. The automationsystem consists of three majorsystems: pressure control, atmosphericcontrol, and temperature control.The atmospheric control systemis used to monitor and maintain thegases contained within the chamber.The pressure control system is used tolower the pressure of the chamber tothat of the Martian atmosphere. Thetemperature control system replicatestemperatures within actual minimumand maximum values that wouldbe experienced on Mars. A liquid/gaseous nitrogen supply and variousheating techniques were used toobtain this temperature range. Theoptimal control of extremely coldnitrogen was fundamental to the stabilizationof temperature within thechamber. After incessant testingand characterization, significant coolingimplementation design changes,and controller instrumentation modifications,the cryogenic supply wassuccessfully manipulated by a programmablecontroller system withappropriate programming. A coolingtest is shown in figure 2.A manual control panel was developedto add more flexibility to thechamber and as an alternative to thegraphical user interface. This panelallows experimenters to select individualsettings and perform manualtests while maintaining the safety30
Research and <strong>Technology</strong> <strong>2000</strong>/<strong>2001</strong>Figure 2. Cooling Test (07-21-00)Mars Electrostatics Chamber Operating CharacteristicsOperating Characteristics Minimum Typical MaximumOperating Pressure 0.2 torr 7 torr 760 torrOperating Temperature -120 °C -100 °C 200 °CPneumatic Line Pressure 760 kPa 860 kPaChamber Pressure130 kPaCooling Line Pressure1000 kPaBakeout Temperature 150 °C 200 °CBakeout Pressure0.5 torrassociated with an automated system. The chamber operating characteristicsare shown in the table.Experiments using the Mars Electrostatics Chamber are in progress.Contact: Dr. C.I. Calle (Carlos.Calle-1@ksc.nasa.gov), YA-F2-T, (321) 867-3274Participating Organizations: VirCon Engineering (R.K. Buchanan and A.C. Barnett) andYA-F1-T (D.C. Lewis)31
<strong>Space</strong>port Structures and MaterialsMartian Regolith Simulant Particle ChargingAirborne dust lifted into the Martianatmosphere by frequent dustdevils can be transported by strongsurface winds of daily occurrenceduring the Martian summer in thesouthern hemisphere. Dust and sandparticles lifted into the wind streamcan be carried for a distance, fallingback to the surface where they canpossibly kick up more particles, ina process known as saltation. Thesaltation action can create highlycharged particles leading to adhesionand discharge. Since wind gusts inthe Martian atmosphere can reachvelocities of up to 100 meters persecond, saltation and impact chargingcan be a significant issue in electrostaticson Mars.To measure the amount of electrostaticcharge generated on Martianregolith simulant particles, an apparatuswas built that measured thedegree of charging of the Johnson<strong>Space</strong> <strong>Center</strong> Mars-1 Martian Regolithsimulant particles as they cameinto contact with different materials.The particles were dropped down adeflection board under a 5-millibaratmosphere to simulate the averagepressure on the surface of Mars. Thesurfaces of the board were coveredwith copper, acetate, or glass sheets.It was speculated that the rolling,sliding, and bouncing of the particleswould result in a net charge transfer,which could be measured with aFaraday cup and electrometer. Theresults were consistent with the triboelectricseries and showed that theglass yielded a net positive chargeto the simulant. The copper and acetatematerials yielded a net negativecharge to the simulant. A schematicrepresentation of the experiment isshown in figure 1. Figure 2 shows theentire system in the vacuum chamber.Key accomplishments:• Design and construction of a saltationsimulator for low-pressuretesting.• Acquisition of data for electrificationof Martian simulant dust particlesin contact with three differentmaterials.Key milestones:• Improve the design of the system.• Implement a mechanism to dischargethe particles before theycome into contact with the materials.• Implement a corona-charging mechanism.• Introduce an ultraviolet lightsource.Contact: Dr. C.I. Calle (Carlos.Calle-1@ksc.nasa.gov), YA-F2-T, (321) 867-3274Participating Organizations: Florida A&MUniversity-Florida State University Collegeof Engineering (Dr. F.B. Gross and S.B. Grek)and YA-F1-T (Dr. R.L. Lee)32
Research and <strong>Technology</strong> <strong>2000</strong>/<strong>2001</strong>Particle-droppingapparatusDeflection board withcopper, plastic, orglass surfacesElectrometerFaraday Cup.124 nCFigure 1. Schematic Representation of the Particle Charging ExperimentFigure 2. Experimental Setup for the Particle Charging Experiment33
<strong>Space</strong>port Structures and MaterialsMars Dust Impact SimulatorDust in suspension in the Martianatmosphere can be transported bylarge occasional dust storms andby the more frequent dust devils.Moving dust particles can generateelectrostatic charges as they comeinto contact with surfaces. Winddrivenparticles can also collidewith each other, transferring chargebetween them at each collision. Suchcharge separation generates electrostaticpotentials that can damageequipment used on landing Marsmissions. Charged dust particles canalso adhere to solar cells and thermalradiator surfaces, degrading their performance.To quantify the electrostatic characteristicsof materials exposed todust particles similar in compositionto Martian dust, the ElectromagneticPhysics Laboratory and Dynacs Inc.are designing a system to simulatethe transportation of dust particlesat speeds comparable to the highestspeeds recorded on Mars duringa dust storm. Comparison of absolutephotometry of the Martian skyobtained by the Imager for MarsPathfinder with multiple scatteringmodels has shown the mean particleradius for airborne dust is 1.6 ±0.15micrometers (µm). The amount ofdust loading during a Martian dustdevil has been estimated to be 700times that of an ambient background.Maximum dust particle density hasbeen calculated to be <strong>2000</strong> particlesper cubic centimeter. The Vikingmission recorded wind speeds of 30meters per second (m/s).The Mars Dust Impact Simulatorwill use a piezoelectric device drivenby a signal generator to vibratethe particles, mechanically separatingthem and placing them under fluidizedconditions. Once the particlesare separated, the conductive impellerblades will thrust the particlesonto several surfaces backed by electrometersensors at velocities up to 30m/s, simulating the Martian winds.The motion of the particles will becontinuous, and the particles willimpact the materials at angles nearlyperpendicular to the surface. Thesimulator is small and is beingdesigned as a self-contained low-temperaturevacuum system. The temperaturesand atmospheric pressureson the surface of Mars will be reproducedusing a 100-percent carbondioxide atmosphere.Contact: Dr. C.I. Calle (Carlos.Calle-1@ksc.nasa.gov), YA-F2-T, (321) 867-3274Participating Organizations: Dynacs Inc.(T.R. Hodge) and YA-F1-M1 (V.J. Cummings)34
Research and <strong>Technology</strong> <strong>2000</strong>/<strong>2001</strong>Conceptual Design of Mars Dust Impact Simulator35
<strong>Space</strong>port Structures and MaterialsComposite Nondestructive Evaluation of BondedAssemblies for the <strong>Space</strong> Shuttle and <strong>Space</strong> StationComposite nondestructive evaluation(NDE) for the <strong>Space</strong> Shuttle willsolve a recurring problem – ambiguousor incomplete NDE inspections –by providing the capability for accurateand precise detection of defectsin bonded assemblies. This projectuses the two emerging methods ofshearography and thermography inconjunction with ultrasonics, all certifiedmethods at KSC. While bondedcomposites on the orbiter are numerousand plentiful, operational needshave directed this project first towardtwo specific areas – flight crew equipment(FCE) lightweight componentsand external tank (ET) spray-on foaminsulation (SOFI). Both Marshall<strong>Space</strong> Flight <strong>Center</strong> (MSFC) and Johnson<strong>Space</strong> <strong>Center</strong> (JSC) are closelyinvolved with this work.Shearography and thermographyare optical systems and do notrequire contact with the surface.Compared with conventional methods,their inspection rates are veryhigh. Shearography measures displacementsthat can correlate tostructural properties or disbonds.Thermography measures temperaturechanges that can correlate to voidsor disbonds. Comparing the resultsamong several methods ensures thebest inspection possible.The basic approach for eachapplication is to perform an assessmentusing commercial off-the-shelf(COTS) equipment to evaluate thesensitivity and accuracy of thesemethods. After an initial assessment,any needed improvements are developedby KSC, the manufacturer, orboth, if feasible. Incorporating themethod into an approved processrequires operator training and certification andequipment certification.The Flight Crew System is converting componentsfrom metal to composite (of graphite-epoxyskins and aluminum honeycomb core) as a weightsavingmeasure. Ensuring integrity of structure isimperative. Defining inspection intervals and contentprovides this surety. Since the components aredesigned for the life of the program, a reliabilitycenteredmaintenance approach will provide theremaining criteria to define intervals and content.During this year, recurring FCE inspections ofpallets used in the crew module and midbodyhave shown the need for NDE. The inspectionsprovide knowledge of the accuracy and sensitivityof shearography and thermography. In <strong>2001</strong>, KSCand JSC will define the inspection requirements.Then, NASA, Boeing, and United <strong>Space</strong> Alliance(USA) engineering will determine how to incorporatethese requirements into an operational process.The ET SOFI has a history of debonding, sometimesstriking the orbiter tile and causing damage.For this reason, shearography provides an opportunityto evaluate known areas of concern, to performacceptance testing of new SOFI materials at MSFC,and to be an alternative to the existing methods ofSOFI bond verification. MSFC and KSC developeda test plan to determine the accuracy and sensitivityof shearography for detecting SOFI disbonds.An initial assessment showed that a shearographyupgrade was necessary. The upgrade is underway,and testing is set to resume early in <strong>2001</strong>. (Seethe figures for a comparison of image quality.) Followingcompletion of testing, implementation willbegin as early as <strong>2001</strong>.Follow-on applications include additional FCEcomponents, orbiter structure, certain orbiter thermalprotection systems (TPS), orbiter tires, and leakdetection. Operational priorities will determine thepriority of these applications.This project will develop operator certificationand training with participation from USA and36
Research and <strong>Technology</strong> <strong>2000</strong>/<strong>2001</strong>Boeing. This project will coordinate with the CodeQ NDE committee, design centers, and USA toprovide the expertise necessary to incorporate thiscapability into Shuttle operations. Further, thereports and techniques developed will form thebasis of the NDE Standard Repair Manual andWeb-based training.Figure 1. External Tank SOFI Test Panel:Shearography Images of 0.25- and 1.5-Inch DefectsNDE, like any launch process, is an expertisethat makes KSC more marketable as a center ofexcellence. As is true with most launch processes,experience figures prominently towards expertise.KSC included NDE as a core capability for the<strong>Space</strong>port. Cape Canaveral Air Force Station andfuture launch vehicles and payloads are potentialcustomers, as is the aeronautics (aircraft) industry.Delta IV SOFI is an obvious application.Key accomplishments:• Initial assessment of FCE lightweight pallets,middeck accommodations rack, and tool storageassembly.• Follow-on inspections of FCE pallets.• ET SOFI for KSC and MSFC uses.• Shearography upgrade to provide additionalsensitivity for SOFI.• Initial implementation plan development.Key milestones:Figure 2. Graphite-Epoxy Test Panel WithImproved Shearography System• <strong>2001</strong>: Complete shearography upgrades. Completethe FCE pallet testing to determine inspectionintervals and the content. Complete the ETSOFI test plan to determine applications. InitiateFCE and ET SOFI implementation plans. Determinefollow-on application prioritization.• 2002: Develop techniques for most orbiter compositestructures.Contact: C.K. Davis (Christopher.Davis-1@ksc.nasa.gov),YA-E2, (321) 867-8804Participating Organizations: Boeing (A.M. Koshti), United<strong>Space</strong> Alliance (P.F. Vanaria), NASA PH-H (F.E. Santos),Marshall <strong>Space</strong> Flight <strong>Center</strong> (Dr. S.S. Russell, J.L. Walker,and S.G. Holmes), and Johnson <strong>Space</strong> <strong>Center</strong> (M. Havacianand T.S. Reese)37
<strong>Space</strong>port Structures and MaterialsLaunch Systems Testbed (LST)The Launch Systems Testbed is acombination of capabilities that includesspecialized personnel with structuraldynamics and launch environment analysisexperience; a launch environmentdatabase; launch environment predictionand structural analysis methodologies;a small-scale launch environmenttest capability; and an international consortiumof partners in Government, thespace launch industry, academia, andcommercial product vendors with acommon goal of enhancing the researchand development of vibroacoustics andstructural analysis in launch environments.All these are incorporatedunder one umbrella to meet the specificrequirements of customers worldwide,while promoting excellence in the fieldof acoustics, vibration, and structuraldesign and analysis associated with thelaunch of space vehicles.KSC and the adjacent Cape CanaveralAir Force Station are prime sitesfor performing launch system researchbecause of their history. The LST is theevolution of vibroacoustic research anddevelopment work performed at KSCover the last 15 years. Because of theunique nature of a launch environment,there is incomplete knowledge withinthe aerospace industry and the Governmenton the prediction of and structuralresponse to launch environments. Theproblem is acute for new launch systemsthat have never been launchedand require the design of reusable andsurvivable launch facilities with launchenvironment mitigating features.Initial plans call for designing andconstructing a test capability that can beconfigured to scale launch environmentsof future vehicles. The scaled launchenvironments will be used to predict thefull-scale launch environment. In addi-tion, the ability to perform scaled testing of launchpad structures, equipment, and exhaust ducts willbe included. This testing will seek to developnovel launch pad designs and verify designs understudy. LST projects focus on the following technicalareas: vibration response, acoustic suppressionsystems, exhaust plume modeling using computationalfluid dynamic (CFD) codes, flame trenchconfiguration optimization, scaling methodologies,assessment of composite structures, fatigue life prediction,hydrogen entrapment, and the effects ofliftoff on ground structures and support equipment.While developing potential customers withinthe space launch industry, the LST will providea one-stop shop for the assessment of advancedstructures and structural materials, including composite,inflatable, and other nontraditional structuresfor nonterrestrial launch systems. KSCpersonnel, in concert with other Government organizations,U.S. and international academia, andindustry, are developing the LST test infrastructureto analyze, design, and test innovative launchstructures, equipment, and environment attenuationsystems for future NASA space initiatives. TheLST will feature a one-of-a-kind, scaled, moving,combusting, and noncombusting supersonic jetplume test laboratory.Current work at the LST located in the KSC IndustrialArea includes:• Establishment of a scaled launch environmenttest facility to characterize acoustics, vibration,and the exhaust plume using KSC-developedcodes• Design and construction of a trajectory simulationmechanism (TSM) to simulate launch trajectoryeffectsContact: R.E. Caimi (Raoul.Caimi-1@ksc.nasa.gov), YA-F2-T, (321) 867-4655Participating Organization: Dynacs Inc. (Dr. R.N. Margasahayam)38
Research and <strong>Technology</strong> <strong>2000</strong>/<strong>2001</strong>C L84Test TrajectoryyRocketMotionx36066036-in72144-inNormal24-inSlow Downand24144Trajectory Simulation Mechanism (TSM)39
<strong>Space</strong>port Structures and MaterialsU.S. Army Corrosion-Retardant Additive TestingThe objective of this project is totest and analyze chloride rinse agents(CRA’s) for use on U.S. Army aircraft,missiles, and ground vehicle systemsand components. NASA and DynacsInc. are testing the effectiveness ofCRA’s to prevent or reduce corrosionof metals exposed to salt spray. Ninedifferent metals specified by the U.S.Army are presently experiencing aharsh, outdoor marine environmentat the NASA/KSC Beach CorrosionTest Site. Solutions of CRA’s aresprayed onto metal coupons eachweek. The coupons will be observedfor corrosion activity for 2 yearsusing several analytical measurementsin addition to visual observation.Research is also beingconducted to compare a new electrochemicalimpedance spectroscopysensor that operates in atmosphericconditions. The data collected withthis new sensor will be compared tovisual observations to evaluate thismethod as a tool for predicting corrosioninitiation.The present efforts are to:• Determine any adverse effects oftest products on test materialsand surfaces. NASA will definethe appropriate usage measuresto reduce or eliminate identifiedadverse effects.• Define the optimum methodologyfor applying test products on U.S.Army systems.• Conduct comparison testing ofproducts and report the findingsand recommendations. As a minimum,four CRA’s will be comparedto seawater, demineralized water,and no rinse as controls. Rustquantification will include visualobservation, weight loss, and pitanalysis.• Conduct test product off-gas analysisof test coupons, components,and materials.Key accomplishment:• Deployment of test stands and coupons.Key milestone:• Progress report on weight lossmeasurements of coupons.Contact: L.G. MacDowell(Louis.MacDowell-1@ksc.nasa.gov),YA-F2-T, (321) 867-4550Participating Organization: Dynacs Inc. (J.J.Curran, Dr. R.G. Barile, and R. Springer)40
Research and <strong>Technology</strong> <strong>2000</strong>/<strong>2001</strong>Metal Coupons for Chloride Rinse Agent TestingTest MatrixTopicTest DescriptionMetalsAluminum 2024-T3 with 8625 coatingAluminum 2024-T3 with 5539 coatingAluminum 7075-T6Magnesium 4377 with 3171 coatingSteel 4340PH 13-8 Mo high-strength steel (AISI type 13800)AM-355 CRT high-strength steel C-250 maraging high-strength steel, AISI grade 18 Ni (250)6Al-4V (Ti-6Al-4V), UNS R65400CRA’s and Controlsat Weekly RinsesCRA1234Controls:1. Seawater2. Demineralized water3. No rinseDilution Ratio With Demineralized H 2 O16:150:116:1200:1Test Material Configuration per MetalExposure PeriodsEvaluation MethodsFor each metal:6 coupons x (4 rinses + 2 rinse controls)+ 6 x 1 no rinse control = 42 coupons per metal3 coupons: 1 year; 3 coupons: 2 yearsVisual (weekly); corrosion sensor (monthly);Weight loss (1 and 2 years); metallurgical andoff-gas (1 and 2 years or as soon as failure occurs)41
<strong>Space</strong>port Structures and MaterialsCorrosion-Resistant Tubing for <strong>Space</strong> Shuttle Launch SitesThe existing 304 stainless-steeltubing at the Launch Complex 39launch pads is susceptible to pittingcorrosion that can cause cracking andrupture of the high-pressure gas andfluid systems. The failures can belife threatening to launch pad personnelin the immediate vicinity. Outagesin the systems where the failureoccurs can affect the safety of Shuttlelaunches. These failures have beendocumented in reports such as MSDReport 95-1M0040.Improved corrosion-resistanttubing systems will greatly enhanceboth personnel and Shuttle safetyconcerns. These new-generationmaterials will require less maintenanceover their lifetime and significantlyreduce costs associated withthese systems.Exposure of test articles at theKSC Beach Corrosion Test Site withconcurrent applications of acidic slurriesto simulate solid rocket boosterdeposits is underway. The performanceof the various tubing alloysfor corrosion resistance is being evaluatedin the Corrosion <strong>Technology</strong>Testbed Facilities.Benefits of this project include:• Corrosion-resistant tubing inlaunch pad applications that wouldgreatly reduce the probability offuture pitting corrosion failures.• Improved safety and lower maintenancecosts that would result fromusing the more corrosion-resistantalloys.• Increased reliability of all launchpad high-pressure gas and fluidsystems.Key accomplishments:• Identification of domesticfabricators/suppliers of seamlessand seamed annealed tubing ofcorrosion-resistant alloys.• Procurement of samples of thetubing for evaluation.• Fabrication of tubing test articles.Key milestones:• Determination of performance andcost benefits to recommend a newmaterial for Launch Complex 39applications.• Sponsorship of an informationalworkshop by the Nickel DevelopmentInstitute.Contacts: L.G. MacDowell(Louis.MacDowell-1@ksc.nasa.gov),YA-F2-T, (321) 867-4550; and Dr. L.M.Calle, YA-F2-T, (321) 867-3278Participating Organization: Dynacs Inc. (J.J.Curran, T.R. Hodge, and J. Staub)42
Research and <strong>Technology</strong> <strong>2000</strong>/<strong>2001</strong>Corrosion-Resistant Tubing Test Articles43
<strong>Space</strong>port Structures and MaterialsEvaluation of Corrosive Effects of De-Icing Chemicalson Steel Reinforcement in ConcreteThe NASA Corrosion <strong>Technology</strong>Testbed of the Laboratories and TestbedsDivision and Dynacs Inc. areevaluating the effect of a replacementfor de-icing salts on the embeddedsteel reinforcement in concrete. Presently,sodium chloride (NaCl) andpotassium chloride (KCl) salts areused to aid in the removal of icefrom state highways. These saltsare not materially or environmentallyfriendly and cause corrosion tobridges, roads, and associated structures.In addition, these salts affectthe growth of roadside trees and vegetation.The two replacement formulationsunder study are a byproductof feed used in the cattle industry.The byproduct, ICE-BAN, is basicallya corn alcohol with other chemicalsadded.The current effort utilizes a laboratorytest method based on the AmericanSociety for Testing and Materialsstandard ASTM G109, Determiningthe Effects of Chemical Admixtureson the Corrosion of Embedded SteelReinforcement in Concrete Exposedto Chloride Environments. These testguidelines are used to evaluate theeffect of de-icing chemical formulationson reinforcing steel in concrete.The ASTM G109 method is arelatively new method that is veryadaptable for other evaluations, suchas new reinforcing materials, newadmixtures, posttreatment corrosioninhibitingchemicals, new concretedesign, and new concrete materialtesting. The effect of each formulationis determined by electrochemicalmeasurements and autopsy ofthe reinforced concrete test blocksat the end of the test design cycle.The electrochemical measurementsinclude reference half-cell potentialsand corrosion data. To date, noadverse effects due to the treatmenthave been noted.Key accomplishment:• Proved that no adverse effectsoccur when ICE-BAN is used onconcrete surfaces.Key milestone:• <strong>2001</strong>: Autopsy concrete and photographembedded reinforcing steelfor potential long-term effects ofICE-BAN.Contact: L.G. MacDowell(Louis.MacDowell-1@ksc.nasa.gov),YA-F2-T, (321) 867-4550Participating Organizations: Dynacs Inc.(J.J. Curran and D.N. Bardel) and HITEC(A. Murphy)44
Research and <strong>Technology</strong> <strong>2000</strong>/<strong>2001</strong>Concrete Specimens Used for De-Icing Testing45
<strong>Space</strong>port Structures and MaterialsDevelopment of Liquid Applied Coatings forProtection of Steel in ConcreteCorrosion of reinforcing steel inconcrete is an insidious problemfacing KSC, other Government agencies,and the general public. Theseproblems include KSC structures,highway bridge infrastructures, andbuilding structures such as condominiumbalconies. Because of theseproblems, the development of a GalvanicLiquid Applied Coating System(GLACS) would be a breakthroughtechnology having great commercialvalue.Successful development and continuedoptimization of this breakthroughsystem would produce greatinterest in NASA/KSC for corrosionengineering technology and problemsolutions. Commercial patents onthis technology would enhance KSC’sability to attract industry partners forsimilar corrosion control applications.The present effort is directed at severalgoals:• Phase I concentrates on formulationof coatings with easy applicationcharacteristics, predictablegalvanic activity, long-term protection,and minimum environmentalimpact. These new coatingtraits, along with the electricalconnection system, will successfullyprotect the embedded reinforcingsteel through the sacrificialcathodic protection action of thecoating.• Phase II improves on a Phase I formulationthat includes optimizingmetallic loading and incorporatesa humectant for continuous activationof the GLACS.• Phase III includes developmentof optimum electrical connectionsthat leads to better sacrificial electronflow.Laboratory testing has shown thistechnology to be feasible. Presently,tests are being conducted at theNASA KSC Beach Corrosion Test Sitewith positive preliminary results. Inaddition, the generated data is beingcollected and remotely accessed fromoff-site locations.This new liquid applied materialssystem will protect existing KSCand NASA structures and have significantcommercial applications fortransportation infrastructure, marineinfrastructure, civil engineering, andconstruction industries.Key accomplishments:• Proved the feasibility of usingliquid applied coatings for protectionof embedded reinforcing steelin concrete.• Determined the optimum mix ratiofor specific liquid applied coatings.46
Research and <strong>Technology</strong> <strong>2000</strong>/<strong>2001</strong>Structural Concrete Specimens at Beach Corrosion Test SiteKey milestone:• <strong>2001</strong>: Move the liquid applied coatings testing from smallsizesamples (11 x 6 x 4.5 inches) to larger structures (4 feetx 4 feet x 7 inches). The new structure concrete design mixwill include chlorides to simulate a contaminated reinforcedconcrete structure.Contacts: L.G. MacDowell (Louis.MacDowell-1@ksc.nasa.gov), YA-F2-T,(321) 867-4550; and Dr. L.M. Calle, YA-F2-T, (321) 867-3278Participating Organization: Dynacs Inc. (J.J. Curran and Dr. R.G. Barile)47/48
Research and <strong>Technology</strong> <strong>2000</strong>/<strong>2001</strong>Process and Human FactorsEngineeringProcess and Human Factors Engineering (P&HFE) is a technicaldiscipline devoted to the science of process design, management,and improvement and to the optimization of operational phasesof complex systems by focusing on the interfaces among hardwareand software systems, processes, and humans in specificwork environments. The goals of this discipline are to enhancesafety, efficiency, and effectiveness and to improve quality.P&HFE is becoming an area of increased importance due tothe long-term operational phases of current and potential futurehuman space flight programs. The research and technologyaffiliated with P&HFE include:• Human Factors Engineering• Process and Operations Modeling, Simulation, and Analysis• Life Cycle and Risk System Assessment• Work Methods and Measurement• Scheduling and Capacity AnalysisFor more information regarding Process and Human FactorsEngineering, please contact Deborah Carstens, (321) 867-8760,Deborah.Carstens-1@ksc.nasa.gov, or Tim Barth, (321)867-6230, Timothy.Barth-1@ksc.nasa.gov.49
Process and Human Factors EngineeringDisconnect Automated Resource Tracking (DART) SoftwareThe Quick Disconnect (QD) Laboratoryprocesses quick disconnecthardware used to transfer pressurantsand hypergolic propellants intothe <strong>Space</strong> Shuttle’s Orbital ManeuveringSubsystem (OMS) pods andthe Forward Reaction Control System(FRCS). Hypergolics are extremelytoxic and corrosive chemicals. Asa result, QD’s must be regularlyrebuilt and inspected to maintainproper filtration and avoid hypergolicleaks or spills. The QD Laboratoryservices almost 2,000 items annuallythat require different levels of service.Prior to the installation of theDART software, the QD Laboratoryhad no effective tracking method. Ifmanagement wanted to know howmany QD’s were at Wiltech for cleaning,a technician had to physicallycount the QD’s on the shelves. Inaddition, there was no automatedtracking of QD’s by part number/serial number or problem reporting(PR) history. There was no real-timestatus information, no location information,and no configuration information.As a result, there was noconsistent internal tracking to assistscheduling and job planning.Using Oracle Developer 6.0 andIBM ViaVoice 7.0, the design teamsolved the QD Laboratory internaltracking problems by enhancinginternal controls in several differentways. Using a comprehensive inputscreen designed in Oracle Forms,the program tracks each individualQD refurbishment by status anddate. Forty automated reports provideinternal processing informationby status, type, PR history, andpriority. Where appropriate, thereports accept user-defined parameters.This information permits theeffective assignment of items to Partsand Materials Requests (PMR’s) andDisassembled QD Showing the Wide Variety of Components50
Research and <strong>Technology</strong> <strong>2000</strong>/<strong>2001</strong>Main QD Input Screen Tracks Both Current and Historical Datathe establishment of priorities. This greatlyenhances the efficiency of the QD Laboratory andassists in scheduling. For the first time, the DARTsoftware tracks the total processing flow within thelaboratory.The QD Laboratory now has real-time status,location, and configuration information. This notonly saves time, it helps ensure these componentsare ready to support vehicle processing whenneeded. The database also lists internal QD softgoods to allow tracking these items by lot and thenumber of cycles each QD and its related itemshave experienced. Artificial intelligence (AI) programmingtechniques color-code part numbers onthe input screen to match the color codes of Fuel,Oxidizer, and Clean Gas QD’s. Additional AI featuresprovide enhanced error checking when a newQD is entered into the program.As an added feature, the DART software developersdesigned the program to work effectivelywith voice recognition software. The program wasinstalled with IBM ViaVoice 7.0, which users foundto be both accurate and interesting to use. Thisadds convenience and flexibility to data input andupdate efforts. Management conservatively estimatesa savings of 500 hours per year.Key accomplishments:• <strong>2000</strong>: Software design and report design complete.Initial coding complete.Key milestones:• <strong>2000</strong>: Coding complete. System fully implemented.Contact: P.J. Bookman (Pamela.Bookman-1@ksc.nasa.gov),YA-C1, (321) 867-6210Participating Organization: United <strong>Space</strong> Alliance (R.M.Edwards and S.M. Schneider)51
Process and Human Factors EngineeringCartridge Automated Resource Tracking (CART) ProgramThe Lithium Hydroxide (LIOH) Laboratory refurbishes the EnvironmentalControl Life Support System (ECLSS) air purification cartridges used by the<strong>Space</strong> Shuttle flight crew during flight. These cartridges are a mission-criticalflight element. Every processing step and all chemical consumables must becarefully tracked and reported to NASA, Johnson <strong>Space</strong> <strong>Center</strong> (JSC), andUnited <strong>Space</strong> Alliance management.Previously, the LIOH Laboratory used a stand-alone database coded inMicrosoft FoxPro. The tracking program became operational in 1995 andserved the LIOH Laboratory well. However, the extraordinary technicaladvances in microcomputers/communications over the last 5 years made theFoxPro software obsolete.The FoxPro program was not on a server, so technicians had to retrieve datafrom a disk when working on different computers. The original program usedstandard VGA resolution, which severely limited the available screen “realestate.” This limitation required multiple input pages to contain the completeset of data inputs. Users had to constantly switch back and forth betweenthese pages to view all the required data.In addition, there was no way for the JSC counterparts (oranyone outside the LIOH Laboratory) to directly view cartridgeprocessing data. When an outside agency requestedcartridge processing information, technicians were requiredto run a report on the local computer, print it, and then faxthe report.To solve this problem, the team recoded the CART systemin the latest version of Oracle Forms, Reports and Graphics:Oracle Developer 6.0. Five years of lessons learned wereapplied. As a result, the LIOH Laboratory eliminated redundancies,simplified report formats, and restructured tabledependencies. The team maintained (and in many casesenhanced) the program’s original functionality and simultaneouslysimplified data input and screen displays. All criticaldata is now displayed on a single SVGA screen and isviewable at a single glance.STS-40 Pilot Sidney Gutierrez Changes the LIOHCanisters on the Middeck of ColumbiaThe processing data is kept on a central Oracle server,thus eliminating the previous disk-swapping required totransfer data between different computers. The server alsoprovides automatic backup and storage services. This notonly enhances data safety, it eliminates the need for LIOHLaboratory personnel to constantly produce multiple copiesof backup floppy disks.52
Research and <strong>Technology</strong> <strong>2000</strong>/<strong>2001</strong>In addition, the team designed aspecial Oracle form and publishedit on the World Wide Web. Thisgives outside agencies the abilityto select and view more than 20different reports (many with userdefinedparameters and some withembedded graphics) anywhere inthe world. The new Oracle trackingand reporting program is trulystate of the art. A sampling ofthe reports available includes CartridgeProduction and Manifestsfor Flight Crew, <strong>Space</strong> Hab, andthe <strong>Space</strong> Station Freedom. FloridaClean Air/Water Reports, whichdetermine the amount of tracechemicals released into the environment,are now available realtimeto Environmental Safety andHealth.The LIOH Laboratory developedmodern software capabilitiesand published them on the Web.This provides enhanced real-timereporting capability and simultaneouslyreduces the significant workhours expended to make themavailable. Using the CARTsoftware, the LIOH Laboratorywas able to maintain both productionand safety when the processingwork force was significantlyreduced.December 14. <strong>2000</strong> 12:16 PMCO AbsorberSerialno 00001 Pack Date 10/23/1997Test Test Date CFM DP UCL LCL G Fm A B C D E FAAABBBCCC01/01/<strong>2000</strong>06/08/<strong>2000</strong>11/10/<strong>2000</strong>01/01/<strong>2000</strong>06/08/<strong>2000</strong>11/10/<strong>2000</strong>01/01/<strong>2000</strong>06/08/<strong>2000</strong>11/10/<strong>2000</strong>Delta P0.170.160.1520.420.420.425.625.425.630.730.730.8.1539.1646.1544.1539.1742.1647.1535.1542.1544.7299.7299.7326.8778.8745.87871.0181.0181.020.3785.3785.3795.4328.4316.4331.482.482.482630.130.0829.930.130.0829.930.130.0829.9A A A B B B C C CTESTThe CART Software Automatically Generates a Wide Variety of Reports555555696969848383202020252525303030252525252525252525727571677170646968.62.6.4.75.7.45.9.8.45737471737271727471.2.2.2.2.2.2.2.2.2Weight2835 Original Weight2840 1st Flight2845 2st FlightDPKey accomplishments:• 1999: Software design and report design complete. Initial coding complete.Key milestones:• <strong>2000</strong>: Coding complete. System fully implemented.Contact: P.J. Bookman (Pamela.Bookman-1@ksc.nasa.gov), YA-C1, (321) 867-6210Participating Organization: United <strong>Space</strong> Alliance (C.L. Ehrenfeld and S.M. Schneider)53
Process and Human Factors EngineeringWireless <strong>Technology</strong> for Logistics ApplicationsDoor Portal With Two AntennasThe purpose of this project is tostudy the feasibility of replacing barcode technology with a next-generationsystem that does not requirehuman interaction. A radio frequencyidentification (RFID) system is beingdeveloped for this application. Atypical RFID system consists of threebasic parts: the database (if a centraldatabase is used), the reader, andthe transponder (Tag). Communicationis required between thetransponder and the reader andbetween the reader and a centralizeddatabase. Wireless technology is usedfor the transponder-to-reader communication.The reader-to-databasecommunication uses a serial interfaceand/or network technology.The RFID system technology iscurrently fragmented. There is nostandardization at any level. Atleast eight carrier frequencybands are in usearound the world, rangingfrom 100 kilohertzto 2.45 gigahertz. Manyof the product lines aresold as complete systemsand do not interfacewith others exceptat the database softwarelevel. There are competinghardware andsoftware products thatcan be used to createa system at virtuallyany level of commercialintegration.There are two maincategories of Tags –active and passive.Active Tags have a bat-tery power source, which limits theirmaximum life expectancy to about 6years. The battery makes the Tag substantiallylarger and more expensivebut gives the system a much longerread range. Passive Tags get theirpower from the reader ’s transmittedcarrier frequency. The Tag capturesthe energy transmitted from thereader and uses it to transmit backto the reader. The power-level limitationsof the reader ’s transmissionlimit the range. Compared to activeTags, passive Tags are inexpensiveand small and have no defined lifeexpectancy limits.The method being developed forthis project will track tagged propertyas it passes through portals at doorways.The portal will consist of a Tagreader with multiple antennas andseveral photocells and will detect theassets and the direction of movement.The portal reader will then transmitthis information to a central databasethat will show the item moved fromone location to another. A Tag readercould also be developed to specificallysatisfy KSC requirements. Themost promising frequency bands forthe operation of the system are beingevaluated by testing commercial offthe-shelf(COTS) products. Tag collisionresolution algorithms are alsobeing analyzed.A hand-held directional reader/locator, with an extended range tohelp locate lost tools, was developedand is being tested. This Tag locatorwill need to sense the presence ofa Tag and possibly estimate the distancefrom the locator to the Tag.54
Research and <strong>Technology</strong> <strong>2000</strong>/<strong>2001</strong>Prototype Yagi Directional AntennaKey accomplishments:• A portal with two antennas operating at 915megahertz was built and is undergoing testingand characterization.• A highly directional reader was prototyped andsuccessfully tested.• Software for the real-time update of Tag informationwas developed.Contacts: E.C. Green (Eric.Green-1@ksc.nasa.gov), YA-D2-E1, (321) 867-6534; and W.E. Roy, UB-D, (321)867-6069Participating Organization: Dynacs Inc. (J.D. Taylor, Dr. P.J.Medelius, J.J. Henderson, and Dr. C.T. Mata)Portal Response Plot55
Process and Human Factors EngineeringChange Management and Analysis Tool (CMAT)PortfolioAnalysis<strong>Technology</strong>DevelopmentRoadmapsA key characteristic that will distinguishsuccessful enterprises ofthe new millennium is the abilityto respond quickly, proactively, andaggressively to unpredictable change.Robust methods and tools to facilitatechange management are, therefore,essential for the modern enterprise.This project targets the technologygaps and challenges associated withstrategic change management: (1)lack of scientific methods for strategicchange management; (2) lack of information-integratedsoftware tools tosupport the change management process;and (3) lack of knowledge managementmechanisms that capture,store, and leverage corporate knowledgefor strategic planning and control.The project proposes to design,develop, and deploy a Change Managementand Analysis Tool (CMAT),an integrated software system thatfacilitates strategic change management.The project will defineCMAT application requirements atKSC, develop and validate a robustCMAT application, and commercial-GapAnalysisCMAT <strong>Space</strong>port <strong>Technology</strong> Assessment Framework<strong>Technology</strong>InsertionImpact Analysisize CMAT technology. Key projectinnovations include a novel adaptationand application of portfoliotheory for strategic decision support,a scalable simulation-based approachfor change impact assessment, and astructured knowledge-based methodfor strategic planning and changemanagement. CMAT is expected tosignificantly improve NASA’s changemanagement capability in the nearterm. To date, the main activities ofthe project include (1) defining focusapplication areas at KSC, (2) definingrequirements for the CMAT PortfolioAnalysis Tool, (3) defining the structureof a scalable simulation frameworkfor change impact assessment,and (4) gathering requirements anddata for a scalable range simulationmodel.Key accomplishments:• 1999: Successful completion of thePhase I SBIR project. Developmentof the CMAT prototype.• <strong>2000</strong>: Selection for Phase II SBIRresearch and development. Definitionof KSC focus areas.Development of a preliminarysimulation-based change impactassessment framework. Developmentof project portfolio analysisvisualization mechanisms.Key milestones:PortfolioAnalysisToolRange ChangeAssessmentToolCMAT Architecture<strong>Space</strong>portDecisionTools• <strong>2001</strong>: Completion of the scalablerange simulation model. Developmentof a prototype portfolioanalysis tool. Completion of thechange management method.Refinement of the simulation-basedchange impact assessment framework.56
Research and <strong>Technology</strong> <strong>2000</strong>/<strong>2001</strong>• 2002: Completion of the Phase II project.Completion of CMAT softwaretools. Development of a technologytransfer and commercializationapproach.Contact: T.S. Barth(Timothy.Barth-1@ksc.nasa.gov), YA-C, (321)867-6230Participating Organization: Knowledge BasedSystems, Inc. (Dr. P.C. Benjamin)57
Process and Human Factors Engineering<strong>Space</strong>port <strong>Technology</strong> <strong>Center</strong> and WorkInstruction Delivery InitiativeNASA’s new vision for KSCrequires that it create a <strong>Space</strong>port<strong>Technology</strong> <strong>Center</strong> (STC) to supportthe development and widespread useof new and existing technologies andto enable safe, reliable, and low-costaccess to space. There are six primarytechnology investment areas underthe STC concept:• Fluid System Technologies• <strong>Space</strong>port Structures and Materials• Process and Human Factors Engineering(P&HFE)• Range Technologies• Command, Control, and MonitoringTechnologies• Biological SciencesP&HFE provides a systemsapproach to design, management,and implementation of processes.P&HFE focuses on the interfaceamong workers, hardware, software,and the work environment. Thus,activities across KSC can benefit fromthe use of P&HFE technologies andprinciples. Furthermore, spaceportprocesses have many unique aspectsthat require development of innovativeP&HFE modeling and analysistechnologies. Hence, it is necessarythat KSC develop capabilities to testinnovative ideas and concepts. Suchcapabilities should lead to greaterinteraction and partnerships betweenKSC and academia, research centers,and industry.This effort seeks to investigatehow to establish a Process Engineer-ing <strong>Technology</strong> <strong>Center</strong> (PETC) thatwill disseminate existing technologiesused at KSC and, at the same time, bea testbed for the development of newP&HFE technologies. The PETC initiativeis envisioned as a multiphaseeffort. The initial phase will yielda blueprint for full-scale implementationand develop a testbed. ThePETC will support the KSC roadmapby providing not only a focal pointfor the <strong>Center</strong> ’s P&HFE technologydevelopment activities but also ashowcase for P&HFE technology successstories and current activities.Specifically, the primary objectives ofthis project are to:• Provide a focal area for visiting andin-house P&HFE technology developers• Develop a roadmap for the establishmentof P&HFE technology testbeds• Enhance reliance and teamworkwithin KSC’s P&HFE community• Develop a showcase supportingP&HFE education and awareness,new business development, andpartnershipsThe initial testbed is focused onWork Instruction Delivery (WID). Itseeks the introduction of wearablecomputers in Shuttle processingoperations. For the WID Testbed, variouscommercial off-the-shelf (COTS)delivery systems are being researchedand tested, including head-mounteddevices, voice-activated devices, andwearable computers in a wirelessenvironment. The experiments willlead to the following elements:58
Research and <strong>Technology</strong> <strong>2000</strong>/<strong>2001</strong>• An understanding of what types of devices are feasible toenable electronic delivery of the work instructions, includinghardware and software that can interact with KSC’s informationsystems as well as be comfortable and nonhazardous tothe technicians. Examples of these tools are head-mounteddevices, voice-activated devices, and personal monitors.• The design of a training program so the chosen technologiescan be used effectively by technicians.Key accomplishments (<strong>2000</strong>):• PETC Showcasing: Conceptualization of the PETC message inthe form of posters and pamphlets for success stories.• WID Testbed: Identification of hardware and software forexperimentation. Identification of Shuttle processing siteswhere the wearable and wireless technology may be introduced.Identification of partners among the contractors. Identificationof three case studies: <strong>Space</strong> Shuttle Main Engine(SSME) Processing, Sprayable Ablative Thickness Mappingfor Solid Rocket Booster (SRB) Structures, and Thermal ControlSystem (TCS) Blankets Processing. Identification of othersupport to expand experimentation. Acquisition of initialequipment. Continued testing of the acquired hardware andsoftware.Key milestones:• <strong>2000</strong>:– Spring: Initial research of hardware and software for WIDdone by students in the Applied Research in Industrial andSystems Engineering (ARISE) <strong>Center</strong> (NAG10-212).– June to December: Discussion of graphics to represent themessage of P&HFE. Graphics and pamphlets are in the finalstage of development.– September to December: Potential partners identifiedthrough various demonstrations and meetings.– October to December: Acquired hardware and software.• <strong>2001</strong>:– January to February: Testing of hardware and software.– February to June: Human factors study on the three selectedcases.– End of August: Analysis of findings and recommendations.Contact: M.M. Groh-Hammond (Marcia.Groh-Hammond-1@ksc.nasa.gov),PH-M1-B, (321) 861-0572Participating Organization: Florida International University(Dr. M.A. Centeno)59
Process and Human Factors Engineering<strong>Center</strong> for Applied Research in Industrialand Systems Engineering (ARISE)ARISE established a combinedresearch and educational program toattract and retain women, Hispanics,African Americans, and other individualsfrom minority groups to engineering.In the program, studentshave access to the tools necessary tostart and complete industrial and systemsengineering projects related toNASA operations and processes atKSC. Students participating in theprogram were:• Exposed to and trained in NASA’smission• Given seminars on a variety ofissues, including realities of theworkplace, diversity, and genderissues• Asked to participate in appliedresearch projects• Instructed on the benefits ofpursuing postgraduate studies toincrease their chances to succeed inthe workplace and to increase theirstature as role models for futuregenerations• Given a 4-week onsite internship tobecome acquainted with the variousKSC processes needed to completeprojects• Given a stipend during the academicyear and summer termsAn important objective of thiseffort was to foster partnershipsbetween Florida International University(FIU) in Miami, Florida, andNASA, as well as between FIU andlocal industry. The initial partners inthis effort were FIU and KSC. FIUwas the lead institution, and KSC providedsteering guidance and implementedsome aspects of the program.The initial timeframe of 2 yearswas extended for 1 additional year.During that time, various aspects ofthe partnership model were tested,rethought, and retested so it couldbecome an appropriate model forindustry-university partnerships.Several companies have participatedin this partnership, with two of themparticipating every semester.Key accomplishments:• 1997: Established the center.Selected, purchased, and installedhardware, software, and otherequipment. Developed a brochureand Web site(http://arisecenter.eng.fiu.edu) toadvertise the program. Selectedeight students for the program.Developed program activities.• 1998: Purchased computer equipmentand software. Conductedsix seminars. Students visitedKSC and participated in a 4-weeksummer internship. Curriculumintegration: five projects wereassigned; six students receivedcredit in the Project Managementclass for the projects, and two studentsreceived credit as part of atechnical elective course. Preparedand presented a proposal to localcompanies to encourage involvement.Continually updated theprogram Web site.• 1999: Purchased computer equipmentand software. Conducted 12seminars. Purchased NASA videosfor the center library. Continued60
Research and <strong>Technology</strong> <strong>2000</strong>/<strong>2001</strong>previously established programs. Established partnershipswith three local companies. Supported six master ’s theses.Maintained the program Web site. Published several papersand presented them in national and international forums.• <strong>2000</strong>: Conducted 12 seminars. These seminars will continuein <strong>2001</strong>. Continued established program components (see1998 and 1999 key accomplishments). Continued partnershipswith two local companies. Supported two master ’s theses.Continued Web site maintenance. Continued to publishpapers and present them in national and international forums.Key milestones:• 1998: Project discussion, development, and conference. Continuedindustrial portfolio. Published papers and developedWeb site.• 1999: Project discussion, development, conference, and seminars.Published conference papers and a journal paper. Completedsix master ’s theses.• <strong>2000</strong>: Project discussion and seminars. Published conferencepapers and a journal paper. Completed two master ’s theses.It is expected that partnership with local industry will continue.Contact: M.M. Groh-Hammond (Marcia.Groh-Hammond-1@ksc.nasa.gov),PH-M1-B, (321) 861-0572Participating Organization: Florida International University(Dr. M.A. Centeno and Dr. L.M. Resnick)61
Process and Human Factors EngineeringCable and Line Inspection Mechanism (CLIM)Biannual inspections of the sevenslide-wire ropes used in the EmergencyEgress System at Launch PadsA and B require inspection crews tovisually verify the integrity of thewire ropes as the crews are loweredin the slide-wire baskets. Becauseof the type of wire ropes used asslide-wires (i.e., stainless steel withlow carbon content), magnetic resonantdevices normally employed toinspect the wire ropes are inadequate.This worker-intensive and time-consumingoperation prompted a requestto the Automated Ground SupportSystems Laboratory to develop astand-alone system for automatedwire rope inspection. In addition, nomethod exists for inspection of thelightning wire ropes at each launchpad because of their inaccessibility.The wire rope failures to be identifiedby the automated system, inaccordance with the applicable operationsand maintenance requirementsdocument (OMRS File IV), are characterizedby frayed strands, bird nesting,stretching, and corrosion. Thewire ropes undergo periodic loadtesting and are man-rated by weightingthe egress baskets with sandbagsand sending them down the rope.Consequently, this is not a task forthe automated system. The inspectionteams rely on a visual inspectionof the surface of the ropes with acursory check of the rope diameterusing a go/no-go gage every 10 feet.The targeted ropes were identified tohave an inclination of no more than45 degrees, a length of approximately1,200 feet at 15 degrees, and a diameterof 1/2 to 3/4 inch.A production unit was built thatprovides a real-time video image anddiameter of the wire rope under testto an operator at the control station.Testing on a wire rope similar inangle and diameter to the egresssystem wire ropes shows a durationof 1,400 feet using 12-volt lead acidbatteries. Data showing cable diameteris recorded to permanent memoryin the on-board computer and canbe downloaded to the control stationposttest. Video is taped for playbackusing an off-the-shelf video recorder.Test runs for the unit were performedon a wire rope at Launch Pad A onthree occasions.Key accomplishments:• 1998: Tested the prototype unit.Manufactured the production unit.• 1999: Designed and built a productionunit.• <strong>2000</strong>: Operated unit on a padegress wire rope.Key milestones:• <strong>2001</strong>: Turn over the productionunit. Perform an acceptance test onthe Launch Pad B slide wires.Contacts: R.L. Morrison (Robert.Morrison-2@ksc.nasa.gov), YA-D5, (321) 867-6687;and T. Bonner, YA-D1, (321) 867-2553Participating Organizations: NASA YA-D2(M.D. Hogue), NASA PH-J (K.M. Nowak),Dynacs Inc. (L.M. Parrish), and United<strong>Space</strong> Alliance (G. Hajdaj)62
Research and <strong>Technology</strong> <strong>2000</strong>/<strong>2001</strong>CLIM Unit Mounted on a Wire RopeCLIM Unit Frame Without CoversDefect on a Wire Rope63
Process and Human Factors Engineering<strong>Space</strong> Shuttle Macro-Level ModelThe complex nature of Shuttle ground operationswith literally hundreds of interrelated deterministic andstochastic elements makes it a difficult system to analyze.On numerous occasions throughout the course ofthe Shuttle program’s history, the need to ascertain theexpected versus the planned flight rate and the effectsof modification to some aspect of the flight or groundelements upon flight rate has arisen. In the past,most assessments assumed green-light schedules withlittle accounting for the occurrence of such things aslaunch scrubs, diverted landings to California, fleetwidegroundings, and delays encountered in the various processingfacilities.A <strong>Space</strong> Act Agreement with the University of CentralFlorida was initiated in February <strong>2000</strong> to develop amacro-level simulation model of <strong>Space</strong> Shuttle processingat KSC. The primary objectives of this project areto act both as a proof of concept of the tools and techniquesof process modeling and as a testbed for variousimprovement strategies to reduce the cost of operations,meet schedules, increase the flight rate, improve safety,and increase supportability. Discrete event simulationmodeling was specifically chosen because it is flexible,able to model systems more precisely, capable of performing“what-if” analyses, and able to model the timedynamicaspects of the system under study. Becausethis type of modeling typically needs probabilisticinputs as a requirement for validity, a considerableamount of data acquisition and modeling was required(figure 1). The conceptual basis for the macro-levelmodel (figure 2) was also developed throughout thecourse of the project. The actual simulation modelwas built using the Arena simulation software package(figure 3).Density / Histogram OverplotDensity / Proportion0.200.150.100.05The validated simulation model is now acting as aspringboard from which numerous other opportunitiesare being studied. These include:• Ground Processing– Support of manifest planning– Flight element, facility, and ground support equipment(GSE) resource utilization and capacity assessments– Processing of change assessments– Expansion to include payload, range, and criticalKSC infrastructure elements• <strong>Space</strong>port Engineering and <strong>Technology</strong>– Integration into overall spaceport modeling effort– Baseline for next-generation Reusable Launch Vehicle(RLV) comparison– Demonstration by new RLV models of ground processingdependencies on launch vehicle architecture,ground systems capacity, and configuration– Comparison of competing RLV designs with respectto operational cycle parameters both during andafter the down-select processKey accomplishments:• Demonstrated tools and the approach for operationsprocess modeling.• Developed a valid simulation model of macro-levelShuttle processing.Key milestones:• Phase I, April <strong>2000</strong>: Overall modelstructure development.• Phase II, September <strong>2000</strong>: Detaileddevelopment and validation.• Phase III, <strong>2001</strong>: Experimentationand utility development.Contacts: M.J. Steele(Martin.Steele-1@ksc.nasa.gov), YA-D4,(321) 867-8761; C.D. Shelton, YA-A, (321)867-9139; G.R. Cates, PH-MI-C, (321)867-9102; and D. Correa, PH-M1-B, (321)861-66620.008.34 13.70 19.06 24.42 29.78 35.14 40.50Interval MidpointParticipating Organization: University ofCentral Florida (Dr. M. Mollaghasemi andDr. G. Rabadi)Figure 1. Data Modeling Using ExpertFit64
Research and <strong>Technology</strong> <strong>2000</strong>/<strong>2001</strong>Ferry FlightTAL Site to KSCMateto SCATAL SiteTurnaroundDescentPhaseLand atTAL SiteDFRCChosenNominal DescentLOVDescentPhaseTALATO(AOA)Legend:CoreModelPhase-ALandat DFRCDFRCTurnaroundLOVDescentPhaseKSCChosenRail RSRMSegments to KSCEOMDayRSRM SegmentTurnaround (Utah)Stay up 1extra dayRail RSRMSegments to UtahOn-OrbitPhaseRSRM / SRBDisassembly &Inspection (Hanger AF)Press toMECOSRBRetrievalIntactAbortPhase-BStart ofGroundOps FlowFlightEventMateto SCAFerry FlightDFRC to KSCETManufacturingOffload & SegmentInspection (RPSF)Segment Storagein Surge (RPSF)Aft BoosterBuildup (RPSF)SRB / SRMStacking (VAB)Aft SkirtTurnaround (ARF)Fwd AssyBuildup (ARF)FrustumTurnaround (ARF)Fwd SkirtTurnaround (ARF)AscentPhaseLaunchRTLSET Transportto KSCET Check-out(VAB)ET Mate andClose-out (VAB)MLP (VAB)Stacking PrepsMLPPark Site OpsMLP (Pad)Post Launch OpsRemovefrom SCALandat KSCModel Inputs- Historical data for:-- Processing flows in OPF, VAB, etc.-- Launch Day results-- Landings at KSC or DFRC- QRAS, PRA, etc., for flight eventsModel Outputs- Expected Flight Rate- Facility & Flight H/W Utilization %Landat KSC8thFlight?NoNormalOPF FlowSSMETurnaround(Engine Shop)OMS PodsTurnaround(HMF)Pre-PalmdaleOPF FlowOMS PodsOMDP (HMF)VAB SSVFlowPost-PalmdaleOPF FlowPadFlowRemovefrom SCAMateto SCANominal RTLS DescentScrubFlowScrub/DelayLaunchDayFerry FlightPalmdale to KSCFerry FlightKSC to PalmdaleMateto SCALOVRemovefrom SCAPalmdaleOMDPDescentPhaseFigure 2. Conceptual Flow DiagramMatchIf HB Res Number ==1ElseChooseAssignHigh Bay 1AssignHigh Bay 3ChooseReleasecell set ==1Check_out CellsDispose17ReleaseDelayCheck_out Cells 2Figure 3. ET Mate and Closeout Portion of Simulation Model in Arena65
Process and Human Factors EngineeringNASA/KSC Hazardous Observation and Abatement Tracking SystemThe Hazardous Observation and Abatement Tracking System(HOATS) was developed to support OSHA CFR 1960 and theNASA Policy Document making supervisors responsible for thesafety and welfare of their employees. A Web-based applicationwas needed that could record, review, analyze, and report theresults of the safety walk-down inspections. HOATS was createdto satisfy these requirements and show the NASA/KSC proactiveapproach to safety.Formerly, safety inspections in and around the workplace werethe responsibility of NASA’s safety organization. Safety inspectorsperformed the safety walk-downs and recorded the results on aform. The form required the inspector ’s name, date, name of theresponsible person, organization, mail code, location, safety issues,and corrective action (if needed). The completed forms were givento a designated individual to enter into an Excel spreadsheet. Thisdata was then compiled for reporting and trending purposes.Every employee at KSC is accountable for safety. New safetyrequirements now place responsibility on all NASA supervisors atKSC to perform monthly safety inspections within their work areas.The significance of this project is that it provides supervisorsthe capability to input their safety walk-down data via the Web.Access to HOATS is controlled by user name and password. TheHOATS application is a data management and reporting systemdesigned to record monthly safety inspections and generate reportsand graphs from this data. Many reports may also be viewed asExcel spreadsheets for additional calculation and trend analysis.HOATS has been operational for 2 years and upgraded with newand modified reports and software.Number of Occurrences<strong>2001</strong>80160140120100806040200604830139Egress routes Exits Extension cords Housekeeping Miscellaneous Power cords Top of cabinetsSafety Review Violations8741 34One of Many Graphs That HOATS Offers From the Reports/Graph LinkThe HOATS home page givesusers a brief introduction to thesystem, background, and necessarybrowser requirements. There isalso a Links Bar with hyperlinksto a help page, data entry page,monthly status page, reports, andgraphs. When the user clicks onthe Data Entry link, a JavaScriptcalls up the Maintain applicationbringing the user to the HOATSapplication main form. From thisform, the user may employ buttonsto scroll through existing records,enter a new record, or go to aSearch form. The Search formenables the user to search existingrecords based on one of four criteria:supervisor, directorate code,mail code, or report date. Akey advantage of this search capabilityis that it simplifies editingof records by grouping togetherrecords of a specific criterion. TheNew Record button brings up theHOATS Add/Entry form wherethe supervisor enters inspectiondata following the monthly safetywalk-down. The Monthly Statuslink on the HOATS home pageinvokes another JavaScript thatruns a monthly report. The userchooses a month from a dropdownbox, and an HTML window displaysthe number of safety reviewsperformed that month by thesupervisor for each directorate.The Monthly Status shows onlythe number of safety walk-downsperformed in each directorate anddoes not list details such assafety issues, locations, etc. TheReports/Graphs link allows theuser to choose from several realtimereports and graphs. Thesereports and graphs are much moredetailed, with many of the reports66
Research and <strong>Technology</strong> <strong>2000</strong>/<strong>2001</strong>drilling down to the actualrecord. Reports with archivedata are also available fortrending purposes.Key accomplishments:HOATS Home Page• September 1998: Developedan application using Cactus(now called Maintain) tocapture and store the dataand Web Focus for reportand graph generation.Microsoft FrontPage wasused as the Web front end.• November to December1998: Tested the prototypeand made modifications followingsupervisor trainingled by NASA Safety.• January 1999: HOATSbecame operational andwent on-line at KSC.• May <strong>2000</strong>: Demonstratedthe HOATS application at aTechnical Summit in PalmDesert, California.Key milestone:• <strong>2001</strong>: Establish a link withthe Goal Performance EvaluationSystem (GPES).Contacts: D.K. Ward(Deborah.Ward-1@ksc.nasa.gov),PH-B, (321) 867-0832; and Z. Serbia,TA-B1, (321) 867-1116HOATS Application Main FormParticipating Organization: InformationBuilders, Inc. (D. Haug and W.Villegas)67
Process and Human Factors EngineeringInsight – A Web-Based Data Reporting and Collection SystemA downsized workforce and the conversion to a performance-basedcontract challenged NASA’s mandate toprocess the Shuttle efficiently. In response, the InsightSystem is being developed (figure 1). This data accessand database system allows NASA’s reduced rank of engineersto more efficiently monitor contractor processes andvalidate the capability and stability of those processes. Thesystem uses cutting-edge, Web-enabled technologies andunique data warehouse architectures to assist engineers.The Insight System is being developed so the Governmentcan obtain the insight needed to effectively assess acontractor ’s performance. The system design was basedon the following requirements:• Commercial off-the-shelf (COTS) hardware and software(figure 2) (minimize maintenance and developmentcost)• Access to contractor data for surveillance activities– To validate contractor metrics– To build metrics not currently provided by the contractor– To identify metrics being collected but not needed• Access to NASA data for surveillance activities• Minimize data collection efforts through data sharing(team interdependence)• Provide access to data/information without controllingit• Automate report generation and notification– Reports available in 15 seconds or less– Notification when report indicates an out-of-limit condition• Reports– Available on-line and on demand– Flexibility in data formats– Modular (cut and paste)• Minimize resources required to develop, implement,and maintain the Insight MachineThis system makes Web-based reports by the Core Processavailable to users through their Web browser. Theuser has a choice of looking at the report through thebrowser or downloading the data in the report directlyinto an Excel format for further analysis. The system alsoallows selected individuals to run ad hoc reports in realtime. These reports may contain any combination of datafrom the following servers:• SPDMS (PRACA, IOS, ASRS, ALRUTS, OMRSD)• Amdahl (CMDS)• USA First Time Quality• PK NASA Engineering (PITA Sheets)• USA PeopleSoft and MAXIMOBecause of its flexibility in collecting and integratingdata from a variety of sources, this system is now beingupgraded to allow users to develop additional engineeringreports, over and above the initial metric requirements. Italso allows conversion of the collected data into differenttypes of databases. That is to say that SQL, Oracle, Access,and ADAbase data can be collected and converted into asingle data type such as SQL or Oracle. Forms can also begenerated to collect data not presently collected by othersources.Key accomplishments:• 1997: Established an implementation team. Initiallydeployed software to prove/demonstrate initial concepts(PRACA). Developed preliminary reports to stimulateuser thoughts on metric and report development.• 1998: Started development of automated metric reportsfor the user community. Placed developed reports online.Connected additional databases (First Time Quality,CMDS, IOS). Trained users on COTS software toallow for report generation by users. Investigated datawarehousing to improve system performance.• 1999: Identified and connected additional databases(PK, Maximo). Developed the NASA warehouse capability.Made a decision to provide customer developmentservices.• <strong>2000</strong>: Refined customer metric report requirements.Identified and connected the PeopleSoft database.Developed the NASA data warehouse capability andupgraded the hardware. Implemented data collectiondevelopment. Supported other customer requirements(CLCS, Safety, Close Call Accounting, and Project Management).Refined the Core Process Reporting Environment.Started development of additional engineeringand operational reports. Completed the strategic planningeffort and determined the next milestones.Key milestones:• <strong>2001</strong>: Implement Strategic Planning recommendations.Identify additional databases and connect to them.Develop the Report Builder Page prototype. Developthe Manage Reporter Environment Home Page toreplace the existing Core Process Home Page.Contacts: R.L. Phelps (Ronald.Phelps-1@ksc.nasa.gov), PH-B,(321) 867-0837; J.C. Mack, PH-B, (321) 867-0833; M.J. Walek,PH-B, (321) 867-8842; and D.K. Ward, PH-B, (321) 867-0832Participating Organization: Information Builders, Inc.68
Research and <strong>Technology</strong> <strong>2000</strong>/<strong>2001</strong>Figure 1. Insight System Information PipelineFigure 2. COTS Product Suite69
Process and Human Factors EngineeringDevelopment of a Methodology and Hardware ToConduct Usability Evaluations of Hand ToolsIn the past, a great deal of researchwas conducted to test the physicalattributes of hand tools, includingtests of hardness, load, heat tolerance,flammability, and solvent damage.This research is performed to determinehow the environment and theuser affected the tool. Much lessresearch has been done in the areaof usability engineering of hand tools.Usability engineering is concernedwith the effects the tools have on theuser in terms of performance, comfort,and the risk of injury. Thisresearch focused on developing themethodology and the hardware toconduct usability evaluations of handtools with the goal of reducing foreignobject debris (FOD), which mayalso result in reduced risk of injuryto the user. FOD, which is the debrisleft in or around flight hardware, isan important concern during the processingof space flight hardware. Justone small screw left unintentionallyin the wrong place could delay alaunch schedule, increase the cost ofprocessing, or cause a potentially fatalaccident.The usability of new hand toolswas determined based on the objectiveindicators of performance (thenumber of parts dropped) and efficiency(time to install a part). Inaddition, subjective data was collectedthrough posttest questionnaires,which related to the ease ofuse, the force required, comfort levels,the likelihood to drop parts, and thephysical characteristics of the handtools. To validate the methodology,participants were tested while performingtasks representative of thetype of work that might be donewhen processing space flight hardware.Test participants installedsmall parts onto the usability testingboard using their hands and twocommercially available tools.The methodology and usabilitytesting board can be used to testhand tools formally to show statisticallysignificant differences in performance.It can also be used informallyto gather information for new designsor to compare tools quickly. It allowsthe user to try the tool in a varietyof positions in a controlled environmentwhere there can be no damageto flight hardware. Tools can betested for several purposes, includingincreasing performance and efficiencyand reducing risk of injury to theuser.Key accomplishments and milestones:Technician at Usability Testing Board• <strong>2000</strong>: A testing methodology anda hand tool usability testing board70
Research and <strong>Technology</strong> <strong>2000</strong>/<strong>2001</strong>were developed. The methodology and hardwarewere used successfully by Boeing todevelop and test the usability of a prototypehand tool that was designed to reduce FODwhile installing small parts near the flight hardware.• <strong>2001</strong>: The methodology and usability testingboard are available for use in the developmentand testing of hand tools.Contact: D.H. Miller (Darcy.Miller-1@ksc.nasa.gov),YA-D4, (321) 867-8790Participating Organizations: YA-D1 (A.C. Littlefield), YA-F2-P (D.E. Rowell, K.L. Boughner, J.P. Niehoff, R.A. Breakfield,and R.P. Cartier), University of Central Florida, andBoeing (F.T. Chandler)Average Installation TimeSeconds<strong>2001</strong>5010050149.810887.50Tool ATool BHandInstallation MethodNumber of Parts Dropped# Parts Dropped140120100806040<strong>2001</strong>291Tool ATool BInstallation Method16HandRanking of Installation Methods2.00Ranking1.501.000.500.00Tool A Tool B HandOverall RankComfortLiklihood Not to DropPerceived SpeedHand Tool Usability Testing BoardInstallation Method71
Process and Human Factors EngineeringDevelopment of Human Factor Guidelinesfor Authentication With PasswordsThe world has been revolutionizedby the abundance of information thatmakes its way into the daily livesof individuals. With the expansionof technology, preoccupation withinformation as an individual, organizational,and societal resource isstronger than it has ever been in history.Users of technology are at riskof overloading human memory limitationsas the number and complexityof passwords, user ID’s, and otherelectronic identifiers increase. Therole that understanding human factor(HF) limitations plays in the developmentof a security policy from a passwordauthentication standpoint is inminimizing the demands that passwordsplace on the human memorysystem. The problem is defined to be“the identification and managementof vulnerabilities created by the proliferationof professional and personalauthentication needs in informationsystems.” This research focusedon the link between password andworkload issues relating to humanmemory limitations and addressedthe human side of information securitythrough the development of anHF systematic approach to securityprograms. This research helps thosewho design security policies by providingapplicable and simple guidelinesfor information system usersresulting in the following contributions:• Reduced vulnerabilities producedby information systems withinorganizations• Increased trust that can be placedin the users of information systemsThe objective of this research wasto measure and validate the impactof password demands as a meansof authentication. Through observationalanalysis, organizational policy,and retrospective analysis, a modelwas created to predict the effects of aparticular set of vulnerable conditionson the likelihood of error in an informationsystem. This research evaluatedhow passwords and humansaffect the security of information systemsand how human error in informationsecurity can be reduced oreliminated in systems. The modelhelps HF practitioners and informationtechnology (IT) professionalsdetermine the vulnerabilities thatpassword practices are placing ontheir information systems (see thefigure). The model enables researchersto identify specific passwordissues and workload issues thatmake a system vulnerable to securitybreaches. This research allowedthe development of HF guidelinesfor authentication with passwords tohelp mitigate the risks that resultwhen password demands exceedhuman capabilities. The HF guidelinesfor passwords enable an individualto choose a strong password(meaningful to the user) that isacceptable to the IT community yetdoes not exceed human memory limitations.This promotes organizationalsecurity by making information systemsmore difficult for hackers tobreach. Password guidelines that arewithin human memory limits helpusers follow the organization’s securitypolicies and avoid vulnerablepractices such as using the same passwordfor multiple systems or writing72
Research and <strong>Technology</strong> <strong>2000</strong>/<strong>2001</strong>Model to use in determining the vulnerabilities that passwordpractices are producing on information systems.PASSWORDISSUES• Too Many Passwords• Multiple Systems• Password ComplexityVULNERABILITIESIMPACTPOTENTIALLYINSECURESYSTEMWORKLOADISSUES• Weak Passwords• Common Passwords• Visible Passwords• Security Policies NotFollowed• User Overload of Information• Fatigue• StressSystem Vulnerabilities Modelpasswords on paper. The findings of the experiments indicated that adoption of thedeveloped guidelines can significantly reduce system vulnerabilities from human errorassociated with passwords. Through simple password guideline changes and employeepassword security training, organizations can better guard against human error whilemaintaining safe practices for user authentication that guard against external threats. Thesystematic HF approach to security programs presented as an outcome of this researchis a solution to one of the challenges brought about by the ever-increasing presence oftechnological breakthroughs in organizations.Key accomplishments:• November 1999: Analyzed preliminary research (password survey and experiment).• December 1999: Developed model to determine vulnerabilities that password practicesare producing on information systems.• May <strong>2000</strong>: Completed primary research analysis of the case study experiments andinformation security subject matter expert survey.Key milestone:• July <strong>2000</strong>: Completed development of human factor password guidelines.Contact: Dr. D.S. Carstens (Deborah.Carstens-1@ksc.nasa.gov), YA-D4, (321) 867-8760Participating Organizations: NASA KSC, University of Central Florida, SEBA Solutions Inc., and MississippiState University73
Process and Human Factors EngineeringHuman Factors Analysis Leads to BreakthroughDesigns in Foreign Object Debris PreventionA human factors process failuremodes and effects analysis completedin 1999 on the <strong>Space</strong> Shuttle DomeHeat Shield Installation Processfound there was a high potentialfor small parts to be dropped insidethe orbiter during installation andremoval and to become ForeignObject Debris (FOD). If FOD isnot recovered, the probability ofdamage to the orbiter during flightis increased. No satisfactory methodor tool existed to prevent droppingparts. Consequently, significant timespent locating lost or dropped partshas affected schedules and continuesto pose problems for Shuttle processing.These problems occur in allfacets of aerospace processing andaviation. Research has attributed 6.5percent of commercial inflight incidentsto the loss of small parts. Thus,prevention of FOD is crucial, and thereduction of dropped parts is a criticalelement in the prevention of FOD.FOD reduction in Shuttle processingwas the catalyst for the developmentof the Fastener Starter. TheFastener Starter is a small, lightweight,ergonomically designed toolthat securely holds small parts (e.g.,screws, bolts, washers, nuts, andother fasteners) and combinationsof parts during their installationinto and removal from space flightvehicles. The tool’s method offirmly gripping and releasing hardwarewithout the use of magneticsand its ability to accommodate a varietyof part sizes, types, and hardwarecombinations are just two of the featuresthat make the Fastener Starterunique.The Fastener Starter was developedby incorporating task requirements,user preferences, flighthardware constraints, and lessonslearned from evaluations of currentlyavailable tools. Technicians simulatinghardware installation tasks testedthe tool. The test evaluated the tool’sperformance (parts dropped) and thetechnician’s efficiency and subjectiverating of the tool. The usabilitytesting verified operational readiness,reliability, and user satisfaction withthe tool. Of those technicians tested,90 percent preferred use of the FastenerStarter over the current handinstallation methods.Key accomplishments:Technician Tests Fastener Starter by Simulating Hardware Installation Tasks• Fastener/Starter/Remover (patentpending).• Tote-All Bin/Portable HardwareBox concept (patent pending).74
Research and <strong>Technology</strong> <strong>2000</strong>/<strong>2001</strong>BinPortable Hardware BoxFastener Starter Holding a ScrewKey milestones:Fastener Starter Open• Phase I: Data collection (design requirements,constraints, and functions).• Phase II: Concept development.• Phase III: Prototype development.• Phase IV: Final design requirements, prototype,and report.Contacts: L.G. Kestel (Lisa.Kestel-1@ksc.nasa.gov), QA-D,(321) 867-8522; M.A. Davis, QA-D, (321) 867-8520;and D.H. Miller, YA-D4, (321) 867-8790Participating Organization: Boeing (F.T. Chandler,M. Arnett, M.E. Banks, H.L. Garton, R.L. Griffin,K.M. Krivicich, M.E. Shaw, and W.D. Valentino)75
Process and Human Factors EngineeringVision <strong>Space</strong>port Model DevelopmentAn analysis of the world’s spacetransportation systems reveals issueswith excessive costs, continual launchschedule delays, and failure of thesystems to achieve aircraft-like capability.None of the systems haveyet achieved a level of payload deliverycapacity needed to open spaceas a routine, affordable destination.Worldwide, the delivery tonnage ofpayloads to Earth orbit has failedto increase in accordance with manybusiness model predictions for over10 years, which reflects the impact ofextraordinary space transport costs.System affordability and increasedspaceport payload throughput isessential to the opening of space as aviable business frontier.With its mission of <strong>Space</strong> LaunchOperations and <strong>Space</strong>port and RangeTechnologies, KSC initiated a JointSponsored Research Agreement toexamine generic launch site operationsand infrastructure cost-drivingfactors. This agreement, whereinthe Government, industry, and academiapartners contribute resourcesto accomplish the project, has takenon the task of influencing spaceportsystem-design interfaces with launchvehicles of the future. The partnershipidentifies candidate technologiesthat have the potential to enable revolutionaryspaceports of the future toprovide effective and affordable spacetransportation.The partners formed a consortiumknown as the <strong>Space</strong>port SynergyTeam that consists of launch siteanalysts and engineers who havereleased an initial operations-costcore model. This innovative modelincorporates a database encompassinghistorical performance ofkey launch systems. Elements ofstrategic investments in spaceport/vehicle interactive technologies thathold promise to enable systems andoperations that lead to affordablespace transportation are being identified.As the model matures during <strong>2001</strong>into a commercial product, designcriteria for emerging concepts canbe entered and compared to knownoperations data embedded in themodel database. Estimates of spacetransportation infrastructure andoperational performance are then calculatedand presented in terms ofcapital investment costs, recurringcosts, and flight rate capability.For a wide variety of advancedlaunch vehicle concepts and technologies,the model is designed toidentify, at a top level of resolution,the magnitude of launch site facilityinfrastructure and acquisition costs,operational work force size and associatedcost levels, vehicle processingcycle times, and estimates of systemflight rates. The core model is comprehensivein scope and includes12 generic spaceport functional modules:payload cargo processing,traffic/flight control, launch facilities,landing/recovery, vehicleturnaround, vehicle assembly/integration, vehicle depot maintenance,spaceport support infrastructure,concept-unique logistics,operations planning and management,expendable elements, andconnecting infrastructure/community services.76
Research and <strong>Technology</strong> <strong>2000</strong>/<strong>2001</strong>Key accomplishments:• 1998: Modeling (prototype development andlaunch system templates), data collection, andvisualization technology proof-of-concept.• 1999: Implementation of modeling methodologyto a working application and visualization applicationmoved to a PC platform.• <strong>2000</strong>: Release 1 of the Vision <strong>Space</strong>port StrategicPlanning Tool completed for independent assessmentby Government, industry, and academia.Patent application completed for the modelingmethodology. <strong>Technology</strong> Assessment completedin support of NASA’s <strong>Space</strong> SolarPower (SSP) Exploratory Research and <strong>Technology</strong>(SERT) program. Candidate spaceporttechnology white papers evaluated by the spaceporttechnology assessment method. Customer/stakeholder interviews completed to determinedesired spaceport attributes. Utilized the prioritizedspaceport attributes and design features toperform the assessment.Key milestone:• <strong>2001</strong>: Continue to mature the Vision <strong>Space</strong>portStrategic Planning Tool by extending the modeloutput “figures-of-merit” indexes to quantifiablecost and cycle times. A second release is plannedfor this year.Contacts: C.M. McCleskey(Carey.McCleskey-1@ksc.nasa.gov), YA-C, (321) 867-6370;and E. Zapata, YA-C, (321) 867-6234Participating Organizations: Ames Research <strong>Center</strong>, Boeing,Command and Control Technologies Corporation, LockheedMartin <strong>Space</strong> Systems, and University of Central Florida/Institute for Simulation and Training77
Process and Human Factors EngineeringLogistics Spares Model for Human Activity in Near Earth <strong>Space</strong>The next generation of NASAmissions includes sending humansto the Moon, asteroids, Mars, andbeyond and returning them safely toEarth. Various mission architecturesare being developed for this class ofmission, and some missions requirethe crew to be away from Earthfor 2 to 3 years. Extended-durationmissions like these will require anunprecedented degree of crew selfsufficiency.In order to achievethis, the hardware must be bothhighly reliable and maintainable.Hardware may include spare partsfor surface exploration, habitation,and the spacecraft.A critical aspect of hardware maintenanceis to ensure the correct spareparts are available to the crew. Thelong duration of these missions, coupledwith the lack of opportunity forresupply and constrained mass andvolume allocations for spares, makesthis a difficult problem. Selecting thecorrect mix of spares may well makethe difference between mission successand failure.This project develops a methodologyand a model that will allowNASA to estimate the mass andvolume of spares required for a givenlevel of system performance. Thisin turn will help to determine ifthe current assumptions concerninglaunch vehicle sizing are correct andwhere to focus technology improvementefforts to the greatest advantage[e.g., improved line replaceable unit(LRU) failure rates, reduced LRUmass and volume, or alternate maintenanceconcepts]. The methodologyis flexible enough to accommodate avariety of human missions in NearEarth <strong>Space</strong>.The contractor, the Logistics ManagementInstitute in McLean, Virginia,has developed and delivereda model that estimates the sparesrequirements for such missions utilizingkey mission parameters, suchas the duration of mission phases,systems to be supported, configurationof those systems, and characteristicsof individual system components.The model uses an item-specific databaseextracted from Johnson <strong>Space</strong><strong>Center</strong> ’s Mars Reliability Block DiagramAnalysis database. Future modelingefforts may include streamlinedinterfaces or model enhancementsto include alternate maintenance orsupply concepts.Contacts: B.A. Moxon (Barbara.Moxon-1@ksc.nasa.gov), PH-N5, (321) 861-5374;and R.A. Cunningham, YA-D4, (321)867-8754Participating Organization: Logistics ManagementInstitute (R. Kline, T. Bachman, andT.J. O’Malley)78
Research and <strong>Technology</strong> <strong>2000</strong>/<strong>2001</strong>Payload Ground Handling Mechanism (PGHM) Project:J-Hook Automation PhaseThe J-hook study is the next phasein the PGHM Automation Project.The PGHM is a large steel structurethat provides gross movements as itholds the payload and rolls towardthe orbiter. The J-hooks are mountedto the PGHM with the payload supportedby a hook at four points. Thehook provides finite movement forfinal installation, with a 3-inch rangeand 0.005-inch accuracy. The PGHMwas automated in <strong>2000</strong> and is operationalat Launch Pad B; Pad A willbe done at the next available opportunity.Options to automate the currentJ-Hook system are now being considered.The current system’s movingpower is operated by a technician“controller” at a manual hydrauliccontrol panel some distance fromthe J-hook, where another technician“spotter” gives verbal feedback onthe hook position. The on-site movedirector assimilates all the ongoingcommunications and gives the commandsfor movement of the hooks.This operation is communicationandmanpower-intensive, requiringas many as 16 J-hooks and 8control panels for some payloadconfigurations.The current system also has gaseousnitrogen accumulators to givethe hydraulic system some flexibility“compliance” so damaging reactionloads will not be applied by theJ-hook system to the payload ororbiter during loading. These reactionloads can be caused by windsway or overextension of a hook. Thehydraulics are operation- and maintenance-intensive.Options to be investigated forimproving the system include givingcontrol of the J-hook movement to the“spotter” by means of automated ormanual local controls, with the movedirector having overall control. Thiswould free up the human “controller”at the existing remote manualcontrol panel. Replacing the existingJ-hook hydraulic system with electromechanicalactuators for movementand using pneumatic pistons for compliancewould eliminate the powerhydraulics.Contact: T.H. Miller (Thomas.Miller-5@ksc.nasa.gov), YA-D1, (321) 867-2710Participating Organizations: NASA ShuttleProcessing Directorate, United <strong>Space</strong> Alliance,and Dynacs Inc.79/80
Research and <strong>Technology</strong> <strong>2000</strong>/<strong>2001</strong>Range TechnologiesThe space launch range element consists of the range support facilitiesand equipment required to provide control, supply measurement data, andensure safety of launch and test operations. Examples include range safetyanalysis data processing equipment, telemetry reception and processingequipment, command destruct systems, radar systems and displays, opticaltracking and recording equipment, control centers, and communicationssystems.Activities/focus areas include the following:• Weather Instrumentation and Systems• <strong>Space</strong>-Based Range Systems• <strong>Space</strong>port (Ground-Based) Range Systems• Decision Models and Simulation• Range Information Systems ManagementThe goals and objectives of the Range Technologies include the following:• Develop range systems that safely reduce cost while increasing launchand landing opportunities• Develop range systems that safely support multiple vehicles operatingsimultaneously• Develop range systems that support safe operations to multiple <strong>Space</strong>portsChallenges include determination of influencing phenomenon and sensordevelopment, accuracy and resolution of sensors and instrumentation, optimizationof functional allocations, distributed multiprocessing and supercomputingenvironment, and optimization of network architectureFor more information regarding Range Technologies, please contact RichardNelson, (321) 867-3332, Richard.Nelson-2@ksc.nasa.gov, or Edgar Zapata,(321) 867-6234, Edgar.Zapata-1@ksc.nasa.gov.81
Range TechnologiesLightning Launch Commit CriteriaLaunch vehicles are vulnerable totriggered lightning strikes like theone that destroyed the Atlas-Centaur67 in 1987. To prevent recurrence ofthat unfortunate event, a set of lightninglaunch commit criteria (LLCC)was established. These rules must besatisfied by clear and convincing evidencebefore a launch is permitted.The rules prohibit launching throughor near a variety of different kindsof clouds that may be electricallycharged. These rules are necessarilyextremely conservative because atmosphericelectricity is not well understood.This conservatism sometimesrestricts launching when conditionsare actually safe.The LLCC project will collect datausing a specially instrumented aircraftand ground-based instrumentationto improve the knowledge ofhow electric charges behave in thecloud types specified in the rules.With this knowledge, the rules will berevised to improve launch availabilitywhile maintaining or even increasingsafety. The aircraft will carry a fullsuite of cloud physics instrumentsplus a unique set of six electric fieldmills. The field mills will permit adirect measurement of the vector electricfields in clouds as a function ofthe size and shape of the cloud particlesand the relationship in spaceand time of the cloud to its associatedthunderstorm.Key accomplishment:• June <strong>2000</strong>: The first field campaigncollected several complete sets ofdata in thunderstorm anvil clouds.Key milestones:• February <strong>2001</strong>: The second fieldcampaign will collect data in thickclouds associated with cold fronts.• June <strong>2001</strong>: The third field campaignwill complete the collectionof data in the field.• June 2002: A presentation will bemade of proposed revisions to theoperational LLCC.Contact: Dr. F.J. Merceret (Francis.Merceret-1@ksc.nasa.gov), YA-D, (321) 867-0818Participating Organizations: More than 50people from at least 11 organizations are participatingin this project. Major scientificcontributors include Marshall <strong>Space</strong> Flight<strong>Center</strong>, National <strong>Center</strong> for AtmosphericResearch, University of North Dakota,National Oceanic and Atmospheric Administration(NOAA) Environmental TechniquesLaboratory, Air Force Research Laboratory,University of Arizona, and NOAA/Hurricane Research Division.82
Research and <strong>Technology</strong> <strong>2000</strong>/<strong>2001</strong>University of North Dakota Citation II Cloud Physics/Field Mill AircraftDuring a Field Mill Calibration Flyby at the Shuttle Landing Facility, June <strong>2000</strong>83
Range TechnologiesEvaluation of a High-Resolution Numerical Weather Prediction ModelOver East-Central FloridaWeather support of operations atKSC and Cape Canaveral Air ForceStation (CCAFS) requires detailedforecasts of winds, clouds, ceilings,fog, and hazardous weather suchas thunderstorms. Forecasting theseparameters for KSC/CCAFS is a challengingtask since the Central Floridafacilities are located in an environmentwhere there is an absence ofsignificant large-scale forcing, such ascold fronts during much of the year.Under these conditions, local factorssuch as land/water boundaries (seefigure 1), land use, vegetation typeand density, and soil moisture playa dominant role in determiningthe short-term evolution of weatherconditions. Guidance from current-generationglobal and regionalweather models is of limited value forthese forecast problems because thesemodels do not have sufficiently finespatial resolution to resolve smallscalefeatures that affect wind, temperature,and moisture patterns overEast-Central Florida.During 1999 and <strong>2000</strong>, the AppliedMeteorology Unit (AMU) evaluateda high-resolution configuration ofthe Regional Atmospheric ModelingSystem (RAMS) contained within theEastern Range Dispersion AssessmentSystem (ERDAS). ERDAS is designedto provide emergency response guidancefor operations at KSC/CCAFS inthe event of an accidental hazardousmaterial release or an aborted vehiclelaunch. In addition, RAMS outputcan serve as guidance for operationalweather forecasters at KSC/CCAFS.By running RAMS at sufficiently highspatial resolution, the model has thecapability to resolve the interactionsbetween river and sea breezes acrossKSC/CCAFS.Figure 1. A Plot of KSC and CCAFS Illustrating the Complex Land-WaterGeography That Influences Local Weather Patterns, Particularly During theSummer Months (Shaded Regions Denote Bodies of Water)The RAMS evaluation consists ofboth an objective and subjective verificationstrategy. The objective verificationinvolves computing modelpoint error statistics at a numberof observational sensors. However,when used alone, objective verificationis not sufficient to quantify theoverall value that fine-scale weathermodels add to the forecast process.Subjective verification is included toquantify the added value of modelforecasts for specific weather phenomenaof concern (such as sea84
Research and <strong>Technology</strong> <strong>2000</strong>/<strong>2001</strong>breezes, precipitation, and thunderstorms) during ground and spaceflightoperations.Figure 2 shows an example of a RAMS forecast wind field undera light and variable wind regime on 18 August <strong>2000</strong>, depicting thedetailed interactions between the river and sea breezes across KSC/CCAFS. Note the convergence of winds over KSC created by the interactingriver and sea breeze circulations. This case is an example ofthe many sea breeze forecasts that were verified on a local scale to determinesubjectively the quality of RAMS wind forecasts. The results fromthis verification strongly suggest that high-resolution RAMS forecastshave much greater skill in predicting the development and movement ofsea breezes compared to currentnational-scale weathermodels.Key accomplishments:• 1999: Developed a graphicaluser interface usedto verify RAMS forecastsagainst national and localobservational sensors inreal time.• 1999 and <strong>2000</strong>: Performedan evaluation of RAMS forboth the 1999 and <strong>2000</strong>Florida warm seasons andfor the 1999/<strong>2000</strong> Floridacool season.Key milestones:• <strong>2001</strong>: Final model evaluationresults and recommendationsfor improvedvisualization and forecastguidance using high-resolutionRAMS forecasts.Contact: Dr. F.J. Merceret(Francis.Merceret-1@ksc.nasa.gov),YA-D, (321) 867-0818Participating Organization:ENSCO, Inc. (J.L. Case)Figure 2. A Plot of the RAMS Forecast Surface Wind Field on 18 August <strong>2000</strong>,Illustrating the Interaction Between Local River and Sea Breezes85/86
Research and <strong>Technology</strong> <strong>2000</strong>/<strong>2001</strong>Command, Control, and MonitoringTechnologiesHighly integrated command, control, and monitoring systems will be neededin the future for order-of-magnitude reductions in the labor required to command,control, and monitor second- and third-generation space transportationsystems. In the future, labor-intensive subsystem control and monitoringfrom firing rooms and mission control rooms must give way to operationsconcepts similar to air traffic control towers. Technologies that allow moreground functions to be accomplished by onboard systems will be needed(more autonomous). This will require new architectures with advancedsensors and instrumentation technologies. The overall architectures willseamlessly integrate ground and flight functions with highly reliable anddependable parts and far fewer of them. The advanced systems will becharacterized by far less power and thermal demand, will need far fewercables and wires, and will provide greater insight into critical systems whilemaintaining system integrity.Focus areas include the following:• Highly Autonomous Command and Control Systems• System Health Management (ground and flight)• Sensors and InstrumentationThe goals and objectives of Command, Control, and Monitoring (CCM)include the following:• Reduce contribution of CCM systems to the cost per pound of payload toorbit• Increase safety by increased insight into and monitoring of critical systems(sensing) and CCM system reliability (need top-level metrics)For more information regarding Command, Control, and Monitoring Technologies,please contact Cary Peaden, (321) 867-9296, Cary.Peaden-1@ksc.nasa.gov; Carey McCleskey, (321) 867-6370, Carey.McCleskey-1@ksc.nasa.gov; or George Hurt, (321) 861-7271, George.Hurt-1@ksc.nasa.gov.87
Command, Control, and Monitoring TechnologiesPredictive Health and Reliability Management (PHARM)Operational costs associated with<strong>Space</strong> Shuttle component failures,repairs, and/or replacement processesare expensive. To help reducecost, a PHARM system (formerlyknown as Demand ManagementSystem) is being developed to identifycomponents trending toward failureand thus mitigate impacts tooperational testing and mission performance,as well as provide keyquantitative information required forproactive repair, replacement, andlogistical decisions. An OrbitalManeuvering Subsystem (OMS) VehicleHealth Management (VHM) testbedthat performs a complete automatedcheckout of a simulated OMShelium pressurization system wasdeveloped (see the figure). The testarticle uses qualification hardware inflight configuration. In the courseof the automated checkout, key datanecessary to predict future componentperformance is saved, correlated,and used to develop, prove, and demonstratePHARM technologies.This year PHARM had threeprimary tasks: enhance the <strong>Space</strong>craftTelemetry Analysis Tool (STAT),develop an application to automatePHARM prognostics, and developa Web-based system that interfaceswith multiple databases to acquireand disseminate relevant data associatedwith the unplanned repair process.These capabilities are essentialparts of an overall Informed Maintenance(IM) system.The first task was to implement theuser-requested STAT enhancements,which include an enhanced data filterinterface, the ability to save and loaddata sets, and simplified chart andgraph printing. The second task leveragedoff the Vehicle Health Managementdevelopment of an inflightcheckout of the OMS helium pressurizationsystem to process the testresult data produced by the passivehealth-monitoring node. This nodemonitors the system state and collectskey data necessary to predict system/component health. The new application,the Performance EvaluationModule (PEM), will process theinflight test data and generate reportsthat predict possible future failuresand identify limit violations and outof-characterperformances. The lastPHARM task was to design andimplement a Web-based tool, theInformed Maintenance InformationManagement (IM 2 ) system used toacquire and disseminate engineeringdata from multiple databases, includingthe Problem Resolution andTracking System (PRTS) and the VirtualProblem Resolution Team (VPRT)Web sites in support of the unplannedmaintenance process.PHARM demonstrated three basicconcepts that are the building blocksfor an IM system. These systems(STAT, PEM, and IM 2 ) mitigateimpacts to ground processing andthe unplanned maintenance process.STAT proved to be a valuable tool forsystems engineering during criticaloperations such as launch. With theenhancements made to STAT, engineeringcan now retrieve and analyzehigh-speed telemetry data (100 hertz).STAT’s new data filtering interfaceenables engineering to have greatercontrol over the scope of the acquireddata sets, thereby enhancing theoverall productivity of the query process.These new capabilities assist inthe early detection of problems andanomalies. Corrective action can be88
Research and <strong>Technology</strong> <strong>2000</strong>/<strong>2001</strong>VHM OMS Helium Testbedscheduled into the planned maintenance processflow, thus essentially turning unplanned maintenanceinto planned maintenance.The PEM application was specifically designedto analyze large quantities of data from the inflightcheckout systems and to provide a summary reportthat identifies components trending toward failure,redline limit violation, and Statistical Process Control(SPC) violation or out-of-family operations.Forecasting potential failures will turn unplannedmaintenance into planned maintenance. With theunderstanding of a system’s/component’s performanceand not just a pass/fail criterion, engineeringcan use the PEM reports and analysistechniques as a decision tool to defer correctiveaction until a more opportune time, such asan Orbiter ’s maintenance downtime. An SPCviolation gives engineering advance insight intothe system’s/component’s out-of-family operatingcharacteristics. In statistical terms, this identifiesthe process as potentially being out of control.Engineering can use this information to proactivelyaddress the condition. The PEM application canalso be used to support unplanned maintenanceprocesses by providing performance data in supportof problem resolution.The IM 2 system provides engineering with a toolto access multiple data management systems andto acquire and disseminate data via the Web forexpediting maintenance decisions and processes.The greatest impacts to launch processing areunplanned maintenance processes. The primaryfunction of the PRTS and VPRT is to support theunplanned maintenance process. The PRTS providesnot only problem tracking but also a centralizedlocation where all relevant data associatedwith a particular problem can be stored. Combiningthe PRTS and the VPRT enables engineeringto support near-real-time problem resolution frommultiple locations.Contact: R.A. Cunningham (Robert.Cunningham-1@ksc.nasa.gov), YA-D4, (321) 867-8754Participating Organization: Boeing – Florida <strong>Space</strong> ShuttleOperations (J.M. Engle and W.C. Atkinson)89
Command, Control, and Monitoring TechnologiesLiquid Oxygen SensorThe objective of this project is todesign a liquid oxygen (LOX) sensorcapable of measuring the amountof LOX with better than 1-percentaccuracy. The need to quantify theamount of LOX inside a containeror a pipe is well established. Thespace program requires the capabilityof monitoring LOX for use on liquidair packs, LOX flow lines, and LOXtransfer lines. In addition, interplanetaryflights will require thetransfer, storage, and handling of vastamounts of liquid oxygen. It isimportant to be able to measure theamount of LOX remaining in a container.Liquid oxygen exhibits paramagneticproperties. When the intensityof the magnetic field inside a substanceis greater than the field appliedin vacuum, the substance is calledparamagnetic, and the phenomenonof attraction of the substance towardregions of high magnetic intensity isobserved. The paramagnetic susceptibilityis independent of the magneticfield, although it can typicallyvary with temperature. Over theyears, several methods to measuremagnetic susceptibility were devisedand tested using uniform and nonuniformfield methods. However,classic methods are not directly applicablefor measurements of the relativelysmall paramagnetic propertiesof LOX in an environment such asthat encountered by the aerospacecommunity.Using low-frequency magneticfields, the paramagnetic properties ofLOX flowing inside a steel pipe canbe measured with relatively smallerrors introduced from the attenuationin the electrically conductivepipe. This nonintrusive measurementcan be demonstrated without disturbingthe flow of liquid oxygen. Forinstance, the inductance of a coilwrapped around a steel pipe changeswhen the pipe is filled with liquidoxygen. The skin depth of the pipeaffects the amount of magnetic fieldin the LOX; consequently, the changein inductance caused by the presenceof LOX is dependent on the skindepth. Since the skin depth is a functionof the conductivity of the material(stainless steel for this project)and a function of frequency, a directreading of the inductance alone isnot sufficient to characterize theamount of liquid oxygen within apipe. Another variable is introducedbecause the conductivity of the materialis a function of temperature.Several elements critical to the successfulcompletion of a field-deployablesensor had to be considered inthe design. Among the concernswere:• Temperature-induced drift had tobe eliminated or at least reducedsufficiently to allow for enoughsensitivity, resolution, and accuracyin the measurements.• The effects of eddy currents andthe attenuation caused by the skineffect had to be better understoodto be able to compensate for them.• The sensitivity of the sensor toother phenomena (such as thepresence of magnetic materialsand electronic circuitry inaccuracies)had to be characterized.The next-generation LOX sensorwill actively remove the effects of90
Research and <strong>Technology</strong> <strong>2000</strong>/<strong>2001</strong>Liquid Oxygen Sensortemperature drifts. To date, the sensor has demonstrated a sensitivityof about 10-percent LOX fill by volume, and significantimprovements are expected with better signal processing in thenext-generation prototype.Key accomplishments:• Developed and tested a prototype sensor.• Modeled the circuitry to understand the effects of eddy currents.• Developed an algorithm for real-time temperature compensation.Contact: Dr. R.C. Youngquist (Robert.Youngquist-1@ksc.nasa.gov), YA-D2-C4, (321) 867-1829Participating Organization: Dynacs Inc. (Dr. P.J. Medelius, J.S. Moerk, andDr. C.D. Immer)91
Command, Control, and Monitoring TechnologiesHydrogen Fire DetectorThe <strong>Space</strong> Shuttle uses a combinationof hydrogen and oxygen as fuelfor its main engines. Liquid hydrogenis pumped to the <strong>Space</strong> Shuttleexternal tank from a storage tanklocated several hundred feet away.Any hydrogen leak could potentiallyresult in a hydrogen fire, which isinvisible to the human eye. It isimportant to detect the presence ofa small hydrogen fire in order to preventa major accident. Existing firedetectors, based on the detection ofinfrared (IR) radiation alone, are verysensitive to other sources of radiation,often misinterpreting them as firesand producing false alarms. Theobjective of this project is to developa device that is capable of detectingsmall hydrogen fires and insensitiveto nonflame radiation sources.A problem with the IR detectioncircuits found in typical commercialdetectors is they operate in the irradianceband from carbon dioxide,a byproduct of hydrocarbon flames.These units employ a flicker detectioncircuit, which is intended to avoidfalse alarms caused by hot objectsand solar reflection. However, thiscircuit is sensitive to changing reflectionssuch as the flame from a flarestack or changing shadows from personnelor animal movements nearby.This sensitivity results in false alarms.An advantage of combining ultraviolet(UV) and IR detection is thereduction of false alarms caused bynonflame sources that emit UV radiationonly (such as lightning and weldingarcs).A reliable hydrogen fire detector,based on the simultaneous monitoringof UV and IR radiation at two dif-ferent wavelengths, was developed atKSC. During the research phase ofthe project, measurements of UV andIR radiation were taken using smallhydrogen flames and the large flarestack in the background. Based onthe results of these measurements,custom digital signal processing algorithmswere devised to determinewhether the radiation was froma hydrogen fire or an extraneoussource. These algorithms preventthe occurrence of false alarms whilemaintaining the required sensitivityfor the fire detection.The sensitivity required for properoperation of the sensor at differentdistances can vary by several ordersof magnitude. In the first prototype,the sensors were configured formanual adjustment of the gain intheir front-end stages. This resultedin sensors being disassembled andthen reassembled every time sensitivitychanges were required. Thelatest version of the sensor now incorporateselectronic gain control foradjusting the sensitivity of the amplifiers,either under control of a hostcomputer or from its own embeddeddigital signal processor.Real-time digital filtering and crosscorrelation are used to determine thepresence of a fire within the detector’s field of view, while discriminatingfrom radiation from manmadesources or solar reflections. Theresulting sensor can detect the presenceof a small hydrogen flame, evenwhen reflections from the large flarestack are received. Several of thesedetectors have been prototyped andare currently being tested at the <strong>Space</strong>Shuttle launch pads.92
Research and <strong>Technology</strong> <strong>2000</strong>/<strong>2001</strong>Hydrogen Fire DetectorThe algorithms developed for the hydrogen fire sensor greatlyenhance the current technology by allowing a smart decision tobe made regarding the presence of a fire. The detector unit wasdesigned to incorporate all the components needed for fire detectionin a single enclosure, including UV and IR detectors, lenses,amplifiers, converters, and a digital signal processing unit. Theunit is capable of interfacing with a computer to allow changesin the cross-correlation thresholds. Variants of the algorithm caneasily be downloaded to the sensing unit for field-testing andfine-tuning purposes.Key accomplishments:• Designed and built five prototype sensors.• Conducted laboratory testing of sensors.Contacts: A.R. Lucena (Angel.Lucena-1@ksc.nasa.gov), YA-D2-E1, (321)867-6743; and G.A. Hall, YA-D2-C4, (321) 867-1830Participating Organization: Dynacs Inc. (Dr. P.J. Medelius, J.D. Taylor, J.A.Rees, and J.J. Henderson)93
Command, Control, and Monitoring TechnologiesAdvanced Power Supply Development<strong>Kennedy</strong> <strong>Space</strong> <strong>Center</strong> has partnered with the Universityof Central Florida and Electrodynamics Associates,Inc. to develop an advanced power supplyprototype. This project targets declining power qualityin Shuttle ground data processing centers and therebyimproves power system performance.The quality of electrical power was never more criticalto NASA than it is today. This is because of not onlythe widespread use of sensitive electronic equipment butalso the increased dependency on this equipment’s continuousand troublefree operation. The most significantthreat to power quality comes from the nonlinear powersupplies used in virtually every piece of data processinghardware at KSC. These power supplies inject largeamounts of current harmonic distortion throughout thepower distribution system. High harmonic distortioncommonly causes erratic equipment operation and insome cases results in fire and/or electrical shock hazards.This type of equipment at KSC is rapidly increasing,and the total harmonic distortion on the powersystem is on the rise. As a direct result, power qualitysurveys reveal high levels of harmonic distortion inmany Shuttle program main data processing centers.As current harmonics increase the root mean square(RMS) value of the current waveform, they do notdeliver any real power in watts to the load. As aresult, new system designs must account for higher harmonicdistortion levels by the use of larger distributionhardware (K-factor-rated transformers, larger conductors,larger breakers, etc.).The use of this advanced power converter eliminatesthe additional stresses on the power distribution systemcaused by harmonic distortion. As a result, new powerdistribution designs will not require derating for harmonicloads and will therefore save on overall projectcosts. Further, in existing power distribution systems,this technology can significantly reduce the load on theelectrical system. Harmonic currents account for a fullthird of the RMS current in some Shuttle processingcenters.A new prototype was developed to meet the targetspecifications. The circuit topology provides for aunique blend of efficiency, reliability, and energy density.The proposed circuit topology is a single-stage processorand is therefore more efficient than the two-stagetopologies available. Furthermore, since the topologyuses a single solid-state switch, reliability is increased.Finally, since the unit utilizes the circuit’s parasitic elementsrather than employing additional discrete components,energy density is improved.T 1D 1is(t)i L1(t)i l (t)i L(t)L1Cs2v Cs 2(t)D3i D3(t)v l (t)v 1(t)vds(t)SD2C fR L VoTri L2(t)v Cs 1(t)Cs1L2Schematic Diagram of Advanced Power Supply94
Research and <strong>Technology</strong> <strong>2000</strong>/<strong>2001</strong>The new topology combines one flyback converterand one forward converter using only one switch andone control circuit. The main advantages of the newtopology include:• Higher efficiency, since part of the input energy istransferred directly to the load• A smaller output filter capacitor, since the capacitorcurrent is composed of two components with cancellation• Use of low-voltage components, since the direct current(dc) bus voltage is limited by the flyback converterA 150-watt, 28-volt (V) dc output hard-switching prototypewas constructed. Its efficiency ranges from 80 to85 percent under universal input voltage (85 to 260 Vac), and the power factor exceeds 0.975 under all conditions.Commercial packaging and control design areexpected to produce further improvement.This KSC-sponsored effort promises to bring technologythat previously had been solely the subject ofresearch in the commercial market. As a result, thenew design has the potential to be better than any commerciallyavailable design and be reduced in cost.Key accomplishments:• 1999: Shuttle <strong>Technology</strong> <strong>Transfer</strong> Research (STTR)Phase I – Feasibility Study and Circuit Topology Evaluation– Selected target topology for development based onefficiency, energy density, reliability, and simplicity.– Developed target specifications by review of commerciallyavailable units.• <strong>2000</strong>: STTR Phase II – Simulation and Testbed Development– Topology design and modification completed forhard-switching topology.– Soft-switching design under evaluation.• <strong>2001</strong>: STTR Phase II – Prototype Development– Breadboard prototype constructed and refined.– Prototype meets or exceeds all target specifications.– Prototype turned over to the power supply companyfor industry printed circuit board design,layout, and packaging.Key milestones:• <strong>2001</strong>: STTR Phase II – Commercial Prototype Development– Commercial packaging of the prototype, includingthe addition of standard power supply protectionfunctions and control circuitry.– Benchtop testing of the commercial prototype.– Field testing at KSC.Contacts: M.A. Cabrera (Manuel.Cabrera-1@ksc.nasa.gov), PH-J,(321) 861-3283; and C.J. Iannello, PH-J, (321) 861-3276Participating Organizations: University of Central Florida (Dr. I.Batarseh) and Electrodynamics Associates, Inc. (J. Vaidya)Performance Data 2InputVoltage85115130150175200225OutputVoltage27.1128.1228.1928.2128.2328.2528.26InputPower175.3184.5183.8183.0182.6183.0183.5OutputPower141.7153.2153.9154.2154.4154.6154.7Voltage AcrossStorage Capacitor132152164181202222242PowerFactor0.9960.9780.9900.9910.9890.9890.988Efficiency(%)80.883.083.784.284.584.584.3Notes:1. Switch frequency is 70 kilohertz(kHz).2. Using MPP core as the flybacktransformer T 1 core, turn ratio is33:8.3. Flyback inductor is 96 microhenry(µH), Tr turn ratio is 0.333,and output inductor is 16 µH.25028.26184.5154.72630.98683.827528.30186.1154.62790.98483.195
Command, Control, and Monitoring TechnologiesSmart Current Signature SensorThe Advanced Sensors Development Laboratory ofthe NASA Instrumentation Branch was tasked with thedevelopment of a solenoid valve current sensor thatmeets the following requirements:• Monitor the desired parameter without interferingwith Orbiter systems (be noninvasive)• Monitor the parameter and predict the performanceand health of the device. Ultimately, predict a failurebefore it happensCommonly, the parameters monitored in a solenoidvalve are voltage and current. Since the current sensorhas to be noninvasive, the magnetic field generated bythe solenoid current was selected as the parameter tobe monitored.The design presented here monitors the solenoidvalve’s electrical current for health status and prediction.Both the steady-state and the turn-on and turn-offtransitions of the current signal are monitored. Theon/off transitions contain characteristic peaks and valleysthat repeat every cycle. The peaks and valleys arelike a signature with defined times, current magnitude,and shape. As electrical and/or mechanical degradationoccurs in the solenoid valve, the signature changesboth in time and magnitude, thus becoming a clearindicator of potential problems.The sensor is composed of a signal acquisitionassembly and a signal conditioner and controllerassembly. The signal acquisition assembly contains themagnetic and temperature sensors. It also contains themagnetic flux concentrator as well as a shielding cagefor the magnetic sensor. The magnetic sensor selectedis a linear Hall Effect sensor. The output voltage islinearly proportional to the surrounding magnetic field.To maximize the magnetic field (flux) in the Hall Effectsensing area, a flux concentrator is used. To preventexternal magnetic field interference, a magnetic shieldingcage is built around the sensor. One of the majorobstacles encountered when using Hall Effect sensorsis their dependence on the environment’s temperature.As temperature changes, drifts in the offset voltageand sensitivity of the sensor can be observed. Furthermore,the measured drifts, although predictable foreach sensor, change from sensor to sensor. This designapproaches this problem in a unique way. The designpresented here is able to compensate in real time forthese parameter variations.The signal conditioner/controller assembly will providethe following functions: (a) amplification ofthe low-level signal from thesignal acquisition assemblyto a manageable level, (b)continuous real-time temperaturecompensation of sensoroffset and sensitivity (gain)drift, (c) real-time in-circuitcalibration of the current signaturesensor, (d) real-timecurrent signature analysisand trend analysis, and (e)alert/annunciation if functionaldegradation of thevalve occurs or a failureexists in the valve.Solenoid Valve Electrical Current Turn-On TransitionValve health analysis andfailure prediction will beperformed using softwarealgorithms residing in themicroprocessor controllermodule. Information on thecharacteristics (signatures) ofthe current signal will be96
Research and <strong>Technology</strong> <strong>2000</strong>/<strong>2001</strong>extracted from the analogsignal and compared withstored parameters of a typicalsolenoid behavior forthat species of valve. Thecomparisons performed willbe graded as nominal, borderline,or failure. Anaccount of these results willbe stored and forwarded tothe user for further action.Current (Amp)2.5002.0001.5001.000Timing Chart for Valve Turn-Off Cycle0.<strong>2000</strong>.000-0.200-0.400-0.600A simple algorithm wasdevised to detect specificcharacteristics in the currentsignal. A derivative likereal-time calculation appliedto the time-domain signalallows the peaks and valleysof the current signal to bedetected and time-tagged bylooking for the signal transitionsfrom positive to nega-0.5000.000tive and vice versa (zero-crossing transitions).Signal slope and steady-state values are alsomonitored to complete the characterization ofthe current signature.Key accomplishment:• Continuous real-time compensation ofoffset and sensitivity (gain) drifts over awide temperature variation.Key milestones:100.0101.6103.2104.8106.4108.0109.6111.2112.8114.4116.0117.6119.2120.8122.4124.0125.6127.2128.8130.4132.0133.6135.2136.8138.4140.0141.6143.2144.8146.4148.0149.6151.2152.8154.4156.0157.6159.2Time (msec)Solenoid Valve Electrical Current Turn-Off Transition-0.800-1.000-1.200Signal Conditionerand ControllerAssembly Prototype• Perform a real-time current signature analysisand trend analysis (<strong>2001</strong>).• Develop the capability for real-time calibrationof the current signature sensor (<strong>2001</strong>).• Develop a valve signature database andthe capability to inform the user if functionaldegradation or failure of the valvehas occurred (2002).Contact: J.M. Perotti (Jose.Perotti-1@ksc.nasa.gov), YA-D2-E1, (321) 867-6746; and A.R.Lucena, YA-D2-E1, (321) 867-6743Sensor AcquisitionAssembly PrototypeParticipating Organization: Dynacs Inc. (B.M.Burns)97
Command, Control, and Monitoring TechnologiesMultisensor Array – Are More Sensors Better Than One?Common sense seems to suggestthat multiple sensors are better thanone and, if so, how much better? Thegoal of this project is to design andimplement a test to answer this questionand to help quantify the relationshipbetween the number of sensorsand the associated improvement insensor life and reliability.Multiple sensors can be implementedin numerous ways, the mostdirect of which is to simply increasethe number of sensors of a particulartype at the measurement site.Another method, which takes advantageof the reduced size of microelectronicsensors, is to pack severalsensors onto a single circuit board.Going one level smaller, multipleintegrated circuit (IC) sensors composedof single die (small rectanglesof silicon containing the transducercircuitry) can be crammed into asingle IC package. Finally, multiplesensors can be fabricated directlyonto a single die using advancedtechnologies such as microelectrome-chanical systems (MEMS). Whateverthe technique used to implement amultisensor array (MSA), the questionstill remains: “Is it better and, ifso, how much better?”A first step at answering this questionis to create a type of computerexperiment, referred to as a MonteCarlo simulation. An array (or cluster)of N sensors undergoes randomfailures, such that the statistical meanof the failure mode remains constant(zero mean drift). A life extensionfactor (LEF) is defined as a percentageof the life of a single sensor. Whenthe LEF is plotted as a function of N(the number of sensors of the array), amaximum LEF of 3 is reached beyondN > 30, as shown in figure 1.The next step following the computerexperiment is a test using realdevices. For this, an array waschosen of pressure sensors attached toa single circuit board, approximately1-inch square, and containing eight8-lead circuit-mount packages. ToCluster Lifetime (% of single element lifetime)300250<strong>2001</strong>50LifetimeAverage ErrorError Max/MinNotes: Each point is 20 experiments,elements are 1% devices,rejection tolerance is 5%.54321Measurement Error (%)20 40 60 80 1000Figure 1. Monte Carlo Simulation of Multisensor Array98
Research and <strong>Technology</strong> <strong>2000</strong>/<strong>2001</strong>accelerate sensor failures, the environment temperatureis raised to 125 degrees Celsius (°C). Every24 hours, all sensors are returned to an ambienttemperature of 27 °C and measured at ambientpressure. Once a week, a pressure calibration ismade of all eight sensors at five pressures: 3, 6, 9,12, and 15 pounds per square inch absolute (psia).The test continues until all but two sensors havefailed or until the elapsed test time exceeds 1000hours. Figure 2 shows the pressure vessel containingthe MSA under test, which sits in the temperaturechamber.Using the initial pressure calibration, the MSAunder test is processed with a multisensor arrayalgorithm (MSAA) and compared to the measurementerror of each individual sensor. This is identicalto the processing used in the Monte Carlosimulation. Other algorithms may be tested andevaluated as well.When more than one test temperature is used(more than one test group), an Arrhenius modelanalysis can be performed. Using data from eachof several groups, an activation energy can beextracted using the Arrhenius equation. Usingstandard statistical methods, a calibration error dis-tribution (which is a function of time and temperature)will be estimated. The drift of the meanand variance of this distribution will be determined(drift of mean corresponds to systematic failuremodes; increase in variance corresponds to randomfailure modes).Key accomplishments:• Developed and tested a Monte Carlo simulationto quantify the relationship between the sensorlife (length of time between maintenance calibrations)and the number of sensor array elementsunder the assumed constraint of zeromean output drift.• Designed and implemented a test to measure therelative LEF of multisensor arrays using a singleaccelerated life test.• Specified a test to estimate the absolute LEF of amultisensor array of a specific sensor model andtype using multiple accelerated temperatures.Contact: J.M. Perotti (Jose.Perotti-1@ksc.nasa.gov), YA-D2-E1, (321) 867-6746Participating Organization: Dynacs Inc. (A.J. Eckhoff, Dr.C.D. Immer, and Dr. J.E. Lane)Model for Estimating Absolute LifetimeFigure 2. Temperature and Pressure Chambersfor Testing MSA99
Command, Control, and Monitoring TechnologiesAutonomous Flight Safety System (AFSS)VehicleDataManual System(today)InertialGuidanceTelemetryRadarTransponderFlightTerminationReceiverDecoderIt costs about $700,000 to operatethe range tracking and telemetryequipment during a typical rocketlaunch (Delta 2 class). NASA is lookingfor ways to reduce these operationalcosts for future launch systems.The AFSS concept offers an autonomousvehicle capability that coulddramatically reduce these costs byeliminating the range safety “redbutton” on the ground and, thereby,reduce the people, displays, computers,radar, and radio frequency(RF) links associated with the operationof that button. Can such anautonomous system meet the rigorousreliability requirements andbe economical? Can it adequatelyreplace the human in the loop? Theobjective of the AFSS project is toanswer these questions by developingand thoroughly evaluating a prototypesystem, first by ground testingand later by flight testing as an advisorysystem.Autonomous System(future)GPSReceiverNavigationAlgorithmsInertialSensorsFlightTerminationFlightTerminationDecisionLogicVehicle DataThe AFSS technical approach isto devise onboard software logicthat emulates the human decisionprocess. The logic would use statevector data derived independentlyfrom dual-phenomena measurements[global positioning system (GPS) andinertial navigation system (INS)] onthe vehicle. Data from multiple GPS/INS units provide a reliable capabilityto track the vehicle’s position, velocity,attitude, and angular rates duringsafety-critical flight phases. MultipleAFSS processors would host the decisionlogic software, and two deadmanswitches would be configured to providefail-safe redundancy.Using flight path deviation allowancesand range safety limit zonesstored in the AFSS processors, thesoftware is able to accurately assesscurrent vehicle “state vector” andmake future flight predictions soappropriate decisions can be maderegarding flight continuation, anintact abort, or termination. The softwarewould also ensure valid datais being used to determine the flightbehavior and manage the response toAFSS failure modes. The deadmanswitch logic, implemented by hardware,would automatically initiatethe appropriate termination or abortaction if the AFSS “goes brain dead”(i.e., data is lost or becomes totallyambiguous for a predetermined timeperiod).Mission FlightControl <strong>Office</strong>r• Cost Reduction• Reliability Improvement• Global CoverageKey accomplishments:• Requirements, preliminary design,and decision logic simulation on adesktop work station.100
Research and <strong>Technology</strong> <strong>2000</strong>/<strong>2001</strong>AmberTimeIPPlannedOverflightBuffer• IP Location: The AFSS advises or initiates flight terminationor abort if the predicted Impact Point (IP) penetratesany red zone.• IP Ground Speed: The AFSS advises or initiates flighttermination or abort if the ground speed is below a predeterminedlimit while in the yellow (planned overflight)buffer zone.• Amber Time: In the event the AFSS data is lost orbecomes totally ambiguous, a timer in the deadmanswitch delays any irreversible action regarding flighttermination or abort for a safe time period based ontime-to-endangerment calculation. This protects againstany temporary glitches and provides time to gather databefore termination is executed.Example Decision Logic AlgorithmsAFSSIntegration• Interfaces• I/O Control• Auto-Test• Security• RedundancyManagementDecisionLogicAFSS SoftwareDataValidationI/FGPS/INSHardwareDeadman SwitchI/FRS LimitsComplianceFlight Termination / Intact AbortKey milestones:• 2002: Evaluation of a single-string and multistring AFSS breadboard in the George C. Marshall <strong>Space</strong>Flight <strong>Center</strong> (MSFC) Simulation Laboratory. Design of a high-fidelity AFSS flight test article.• 2003: Evaluation of an AFSS flight test article via a ground test in the MSFC Simulation Laboratory.• 2004: Evaluation of an AFSS flight test article via a flight test on a to-be-determined aircraft.• 2005: Evaluation of an AFSS flight test article via a flight test on a to-be-determined X-vehicle.Contact: R.A. Nelson (Richard.Nelson-2@ksc.nasa.gov), YA-E6, (321) 867-3332Participating Organizations: MSFC (K. Schrock and L. Brandon) and Lockheed Martin <strong>Space</strong> Systems Co. – Astronautics(S. Haley)101
Command, Control, and Monitoring TechnologiesInfinite Impulse Response Filters for PostprocessingNoisy Field Test DataAcquiring field test data can be a challengingtask, and preparation for such an event is oftenfilled with last-minute test plan changes. One ofthe paramount decisions a field experimenter mustmake is what strategy to use for filtering field data.On one hand, a good strategy is to prefilter thedata before acquisition so the collected data has animproved signal-to-noise ratio (SNR). An opposingstrategy is to collect raw data, including noise,then filter the data back in the laboratory. Thelatter strategy has a great advantage in that it mayremove some of the burden from the experimenterin preparing and executing the field test, since collectingraw, unfiltered data is generally a mucheasier task.Figure 1 is a scatter plot of noisy pressure dataacquired from a wind tunnel test of an experimentalNASA hurricane wind sensor that measuresorthogonal components of wind. The vertical axisof the plot is unprocessed sensor data, while thehorizontal axis represents reference pressure datafrom a pitot tube. In this application, the North-South (NS) axis is aligned to the free stream of thewind tunnel. The East-West (EW) axis is transverseto the flow. Since there is a slight dependency ofthe EW axis with wind tunnel speed as indicatedby the pitot tube pressure (P d ), it suggests that theorthogonal flow sensor was not precisely aligned inthe tunnel. The data is further corrupted by broadbandnoise, which decreases somewhat with frequency.The data was acquired without prefilteringat a rate of sample frequency (fs) = 1000 hertz (Hz).It is expected that the sensor data versus referencepressure data should follow a straight line or onewith some weak power-law dependence. As canbe seen in figure 1, noise (broadband in this case)severely corrupts the data. An obvious solution isto postfilter the data.A first-order digital low-pass filter is constructedby implementing a running average on a streamof sampled data using one previous input andone previous output for each new input sample.Because of the use of a previous output, this typeof filter is called a recursive filter or an infiniteimpulse response (IIR) filter. An impulse responseis the characteristic filter output caused by an inputcomposed of a single pulse (1 followed by all 0’s).The impulse response is infinite in duration, andthe IIR filter can be modeled by the resistor capacitor(RC) circuit. (See figure 2.)RNS-Linear Fit: S = 2.3955 + 0.17763 P dV 1CV oStrain Voltage, S [V]2.552.500 = 1 RCFigure 2. RC Low-Pass Filter Network2.45EW-Linear Fit: S = 2.4962 - 0.01410 P d0.6 0.7 0.8 0.9Pitot Tube Pressure, P d [V]x(n)z -1 z -1 y(n)Figure 1. Wind Sensor Strain Gage VoltageVersus Pitot Tube PressureFigure 3. Digital Low-Pass Filter Network102
Research and <strong>Technology</strong> <strong>2000</strong>/<strong>2001</strong>The basic components of the digital filternetwork, as shown in figure 3, are the multiplier(triangle), adder (circle), and delayelement (rectangle). When using a general-purposeprogrammable digital signalprocessor (DSP) implementation, these componentscorrespond to key instructions ofthe DSP’s instruction set. Typically in apure hardware or DSP implementation, themultiplier and adder are combined into asingle unit, the accumulator.In order to implement a digital IIR filter,a difference equation is used. As shown inthe table, x(n) is the current input sample;x(n-1) is the previous input sample; y(n-1)is the previous output; and y(n) is the newfiltered output. The filter coefficients α andγ are also defined in the table. These coefficientformulas result in a tunable IIRfilter response, which is inherently stableover the entire digital frequency range, 0to the Nyquist frequency (one-half of thesample frequency). Even though stabilityis robust, care must be taken since stabilitywill degrade with decreased numerical precision(number of bits used to represent thecoefficients and the filter states).Key accomplishments:Strain Gage Voltage, S [V]Table 1. 1st Order IIR Low-Pass Filter Formulasy(n) = α[x(n) + x(n-1)] + γ y(n-1)cos θγ =cα = (1-γ)/21+ sin θ cwhere, θ ≡ 2πf | f s θ c ≡ 2πf c | f s2.552.502.450.6 0.7 0.8 0.9Pitot Tube Pressure, P d [V]Figure 4. Figure 1 Processed With 1st Order IIR Filter θc=0.02π• Smoothed the noisy wind tunnel testdata with first- and second-order recursiveaveraging, based on tunable IIR filteralgorithms.• Showed that best results were obtainedwith a first-order filter and a normalizedfrequency between 0.02π (figure 4) and0.002π (figure 5).• The optimized IIR postfilter can bedirectly replaced by an equivalent RC orresistance capacitor inductor (RCL) prefilter.Strain Gage Voltage, S [V]2.552.502.45NS-Linear Fit: S = 2.3945 + 0.17923 P dEW-Linear Fit: S = 2.4962 + 0.01413 P dContact: J.A. Zysko (Jan.Zysko-1@ksc.nasa.gov),YA-F, (321) 867-7051Participating Organization: Dynacs Inc. (Dr. J.E.Lane)0.6 0.7 0.8 0.9Pitot Tube Pressure, P d [V]Figure 5. Figure 1 Processed With 1st Order IIR Filter, θc=0.002π103
Command, Control, and Monitoring TechnologiesWireless Sensor CommunicationCurrent and future design goals inthe aerospace sensors and transducersfield call for the development ofnew sensing devices that require lesselectrical power, occupy less space,and weigh less. Self-calibration,self-health assessment, processing ofraw data at the sensor level, andalternate data transmission methodsare desired to provide the user withinformation in a more efficient way.The Instrumentation Branch of theNASA <strong>Space</strong>port Engineering and<strong>Technology</strong> Directorate at <strong>Kennedy</strong><strong>Space</strong> <strong>Center</strong>, along with Dynacs Inc.,was tasked to investigate new waysto design and develop transducerswith these characteristics. As partof the initial efforts to acquire theskills and new technologies for suchpursuits, the Transducers DevelopmentGroup began investigating theuse of wireless communications at thesensor level.The group investigated differentapproaches for wireless communication;the proposal of suitable datatransmission methods, depending ondifferent KSC launch operations environments;and the demonstrationof initial prototype wireless sensorcommunication modules. Hopefully,this ongoing effort will result inthe design and integration of anadvanced data processing and wirelesscommunication system incorporatedin the transducer electronicsdesign itself.From a technology survey thatsummarized available and emergingwireless hardware and implementationtechnologies, basic communicationschemes and commerciallyavailable hardware were selected.Supportive electronics, necessary tooperate both the wireless transceiverand the attached sensor, weredesigned. Custom software was alsodesigned to configure each remotetransceiver module and the centraldata transceiver system and to operatethe polling-method communicationsof the operating system.Commercially available 433-megahertz(MHz) radio transceivers wereselected and integrated with powerand memory electronics to form smallwireless communication modules thatattached directly to existing sensors(figure 1). Communication betweenthe central transceiver system andremote transceiver modules wasachieved over a distance of approximately100 meters with only 10 milliwatts(mW) of output power.Key accomplishments:Figure 1. Transceiver Module Electronics WithTemperature SignalWireless communication moduleswere successfully developed anddemonstrated in a direct-pollingsystem in four different configurations(figure 2):104
Research and <strong>Technology</strong> <strong>2000</strong>/<strong>2001</strong>Figure 2. Wireless Communication Sensor and Transceiver Module Configurations• In-line module that utilizes 28-volt (V) directcurrent (dc) power, feeds 28 V dc through tothe transducer, and accepts a 0- to 5-V dc inputfrom the transducer for conversion to the wirelesstransmitted data.• Voltage or current transducer transceivermodule that utilizes the external power necessaryfor the end-item transducer and acceptseither a voltage or a current input signal fromthe transducer for conversion to the wirelesslytransmitted data.• Integrated sensor/transceiver module that containeda wireless communication assemblyincluded with a temperature signal conditionerand enclosed within an explosionproof housing.• Battery-operated transceiver that utilized 9-V dcbatteries to demonstrate a self-contained, battery-powered,wireless sensor data transmitter.Key milestones:• <strong>2000</strong>/<strong>2001</strong>:– Expand for other communication scenarios toinclude a local sensor communication network,a long-range transmitter/repeater network, anda multipath/multireceiver network.– Improve software for communication errorrecovery.– Develop high-level, in-sensor data processingsystems.– Investigate system enhancement possibilitiesusing Bluetooth standard wireless products.Contacts: J.M. Perotti (Jose.Perotti-1@ksc.nasa.gov), YA-D2-E1,(321) 867-6746; and A.R. Lucena, YA-D2-E1, (321) 867-6743Participating Organization: Dynacs Inc. (M.N. Blalock, A.J.Eckhoff, Dr. J.E. Lane, and Dr. P.J. Medelius)105
Command, Control, and Monitoring TechnologiesEvaluation of the Triboelectric Sensors in the Mars EnvironmentalCompatibility Assessment ElectrometerThe Mars Environmental CompatibilityAssessment (MECA) Electrometerwas designed jointly at the JetPropulsion Laboratory and at theElectromagnetic Physics Laboratoryat KSC to be a flight instrument on afuture unmanned Mars mission. TheMECA Electrometer was designedprimarily to characterize the electrostaticproperties of insulating materialsthat would come into contactwith the soil of Mars. The materialswere selected based on their usein previous space missions. Thefive insulators chosen for the MECAElectrometer were: fiberglass/epoxy,polycarbonate (known as Lexan TM ),polytetraflouroethylene (Teflon TM ),Rulon J TM , and polymethylmethacrylate(Lucite TM or PMMA).The triboelectric sensor array consistsof five (6.35-millimeter-diameter)circular patches of the insulatingFigure 1. MECA Electrometermaterials placed above metal electrodes.The five individual electrodesare connected to independent electrometercircuits. The five outputsare collected via a serial connectionto a controlling computer. The tribosensorsare housed inside the MECAElectrometer, whose case is made oftitanium of a volume of approximately50 cubic centimeters and atotal mass of approximately 50 grams.The power consumption is less than250 milliwatts. Figure 1 is a photographof the MECA Electrometer.Figure 2 is a simplified representationof the circuitry for one tribosensor.Figure 3 shows a typical output ina low-pressure carbon dioxide (CO 2 )atmosphere.The five circular patches shownin figure 1 are the five types ofinsulators used in this project. Theelectrometer ’s circuitry, below thepatches, measures the amount of electriccharge that develops on the insulatorsurfaces after the electrometeris dragged through the Martian soilsimulant. The two openings shownabove the five insulators in figure 1are the local electric field sensor onthe left and the ion gage (IG) on theright. The temperature sensor is adedicated integrated circuit chip thatis mounted inside the case and is notshown in figure 1.A thorough evaluation of the sensitivityof the tribosensors was performed.It was determined that thegain in the current electrometer circuitryshould be programmable tocompensate for a variety of surfaceconditions that might be encounteredon Mars.106
Research and <strong>Technology</strong> <strong>2000</strong>/<strong>2001</strong>C = 1nFTriboelectric SensorElect. Charge, QInsulator MaterialElectrode (metal)VoltageV = Q/CFigure 2. Tribosensor CircuitryKey accomplishments:• The triboelectric sensors were tested with Martiansoil simulant in dry air and under a low-pressureCO 2 atmosphere.• The gain of the tribosensors was 0.25 nanocoulombper volt (nC/V) as measured at the output andfound to be too low to measure the maximumcharge that can accumulate on the materials.Key milestone:• Enhancements to this instrument.Contact: Dr. C.I. Calle (Carlos.Calle-1@ksc.nasa.gov), YA-F2-T,(321) 867-3274Participating Organizations: Florida Institute of <strong>Technology</strong> (Dr.J. Mantovani), Wilkes University (A. Linville), and YA-F2-T(E.E. Groop and Dr. R.H. Gompf)Figure 3. Typical Output in a Low-Pressure CO 2 Atmosphere107
Command, Control, and Monitoring TechnologiesAssessment of Remote Sensing Technologies for Location ofHydrogen and Helium LeaksThe objective of this research effortis to reduce the cost of leak detection,location, and measurement by anorder of magnitude. The objectiveof the initial phase of this researcheffort was to evaluate remote sensingtechnologies for location of leaks ofgaseous molecular hydrogen (H 2 ) andgaseous helium (He) in air for spacetransportation applications. Thisresearch investigated remote sensingtechniques rather than in situ techniques.An in situ technique is onethat measures at the location of thesensor, while a remote technique isone that measures at some distanceaway from the sensor itself.Eleven specific techniques were evaluated:• Passive Sonar• Active Sonar• Differential Absorption Lidar(DIAL)• Fourier Transform Infrared (FTIR)Spectroscopy• Spontaneous Raman Spectroscopy• Coherent Anti-Stokes Raman Spectroscopy(CARS)• Rayleigh Doppler• Indirect Thermal• Rayleigh Intensity• Schlieren Imaging• ShearographyA full report was produced inwhich the principle of each techniqueis briefly described and a bibliographyis provided listing references thatdescribe each technique in detail. Theapplicability for location of H 2 andHe leaks is discussed for each technique,with emphasis on the sensitivity,spatial resolution, and constraints(cost, size, field of view, ease ofuse, etc.). Quantitative models forexpected performance are includedfor most of the techniques. The technologicalmaturity of each techniquefor application to determining locationof H 2 and He leaks is assessed interms of the appropriate NASA <strong>Technology</strong>Readiness Level (TRL). Theresults of these evaluations are summarizedin the table.The objective of Phase 2 is toadvance all techniques to the TRL 4level to enable an informed comparisonof all eleven techniques. Therefore,this Phase 2 effort will advancethe Rayleigh Doppler technique fromits current TRL 1 to TRL 3 or 4,along with advancing four other techniquesfrom the current TRL 3 to TRL4. In Phase 3, one or more of themost promising techniques would beadvanced to the TRL 6 or higher levelto provide for program acquisitionand implementation.Contacts: R.E. Rhodes (Russell.Rhodes-1@ksc.nasa.gov), YA-C, (321) 867-6298; andC.K. Davis, YA-E2, (321) 867-8804Participating Organization: Florida <strong>Space</strong>Institute (R.G. Sellar)108
Research and <strong>Technology</strong> <strong>2000</strong>/<strong>2001</strong><strong>Technology</strong> Evaluation SummaryTechniqueDistinguishingCharacteristicMeasurementApplicabilityTRLPassive SonarTurbulent airflow(ultrasound)Acoustic intensity (passive)DemonstratedLow spatial resolutionSensitivity depends on pressure and aperture4Active SonarSpeed of soundPhase of acoustic waves (active)Low spatial resolutionSensitivity limited by clutter3DIALAllowable energy levelsAbsorption of radiation at characteristicwavelengths (active)None – absorption lines only in vacuumultraviolet (UV)-FTIRAllowable energy levelsEmission of radiation at characteristicwavelengths (passive)None – absorption lines only in UV-Raman –spontaneousAllowable energy levelsShift in wavelength of inelasticallyscattered radiation (active)H 2 : Sensitivity of 2% demonstratedHe: None – monatomic therefore no vibration6Raman –CARSAllowable energy levelsShift in wavelength of inelasticallyscattered radiation (active)H 2 : Sensitivity of 10 parts per million (ppm)demonstratedHe: None – monatomic therefore no vibration3RayleighDopplerMolecular/atomic velocitiesShift in wavelength of elasticallyscattered radiation (active)Theoretically applicable for both H 2 and He1IndirectThermalTemperatureVariation in temperature of solidscaused by nearby cryogenic gas orexpanding gas (passive)Clutter limited?3RayleighIntensityMolecular/atomic crosssectionIntensity of elastically scatteredradiation (active)Limited by Mie scattering (particulates)Clutter limited?3SchlierenIndex of refractionRefraction of radiation caused byspatial variations in index of refraction(active)Sensitivity limited by clutter:1° ~ 346 ppm H 21° ~ 461 ppm He4ShearographyIndex of refractionPhase (path length) of transmittedradiation (active)Sensitivity limited by clutter:1° ~ 346 ppm H 21° ~ 461 ppm He5109
Command, Control, and Monitoring TechnologiesAutomatic Detection of Particle Fallout in Cleanroom EnvironmentsDetecting particle fallout contaminationis important for a variety ofreasons, not only in the aerospaceindustry but also in a growingnumber of other areas. Particle contaminationcan degrade the performanceof the optics on a satelliteor even prevent its mechanical partsfrom functioning properly. Particlesdeposited on surfaces can ruin surfacefinishes such as paint or epoxy.The particles can contaminate thecleanliness of prepackaged foods,medicines, or medical instruments.Particle fallout contamination caneasily ruin computer chips duringthe manufacturing process or evenduring packaging.Traditionally, measurement of particlefallout contamination levels in afacility is accomplished by placing awitness plate for several weeks in thearea where particle fallout is to bemeasured and then transporting it toa laboratory where particles are manuallycounted under a microscope.This process is tedious, time-consuming,and prone to human error as wellas corruption caused by handling andtransporting the witness plates. Anautomated in situ approach to thesemeasurements using an AutomaticParticle Fallout Monitor (APFM) wasdeveloped. The APFM is a quantitative(it directly counts particles)particle fallout monitor that measuresthe size and number of particulatescollected on a witness surface representingcontamination that collectson surfaces at the point of use. TheAPFM can measure particles as smallas 5 micrometers in diameter and calculatetheir contribution to percentarea coverage (surface obscuration).The instrument correctly processesirregularly shaped particles as wellas fibers. The instrument providesa quantitative measure of the cleanlinessof a room in accordance withMIL-STD-1246.A prototype instrument wasdesigned, fabricated, and tested inthe NASA Contamination MonitoringLaboratory. The instrument was thentested alongside the standard 37-millimetergridded witness filters inthe Operations and Checkout (O&C)Building at KSC. The data given bythese two methods compared veryfavorably.The technology was licensed bythe Aerospace Engineering Group ofIDEA, LLC. NASA and IDEA thenembarked on a joint developmenteffort and produced the first commercialprototype instrument. Thisinstrument was then tested in the<strong>Space</strong> Station Processing Facility atKSC. The instrument was testedalongside several gridded 37-millimeterwitness filters as well as twowitness plates from an Estek siliconwafer scanner. The data from thesethree methods again matched closely.The APFM consists of a sensinghead and a main processing unit. Thesensing head, which can be locatedup to 100 meters from the main processingunit, contains a black witnesssurface on which particle contaminationdeposits through an openingin its top. The surface is imagedusing two cameras, one looking forlarge particles (up to 1,000 microns indiameter) and one looking for smallparticles (down to 5 microns in diameter).These images of the witnesssurface are transmitted to the mainprocessing unit.110
Research and <strong>Technology</strong> <strong>2000</strong>/<strong>2001</strong>The main processing unit receives images fromsensing heads attached to it (there may be multiplesensing heads attached to one processing unit). Itthen analyzes each of the images it receives forparticles. Identified particles are measured andcategorized into size bins. Over time, the accumulateddata gives information used in MIL-STD-1246cleanliness calculations, and the rate of change ofparticle accumulation gives information about howfast contamination is accumulating at the currenttime.The system also possesses its own ether port andan APACH web server so customers can monitorand retrieve fallout data remotely over a facility’sintranet or via the internet.Development and commercialization of thisinstrument are nearly complete. Testing demonstratedgood agreement between these measurementsand those made with other widelyaccepted measurement methods. The testing alsoadequately demonstrated the system’s primaryadvantage over existing methods – the completelyautomated detection, analysis, and reporting ofparticles onsite without the need for extrinsicequipment or facilities.Key accomplishments:• Assembly and checkout of first commercial prototype.• Assembly of second prototype unit.• Field testing at KSC verifying the instrument’smeasurements are valid and accurate.• Sale of first commercial units.Key milestones:• February <strong>2001</strong>: Extension of distance fromsensor head to controller to 100 meters.• March <strong>2001</strong>: Integration of a smaller system controller.• April <strong>2001</strong>: Improvement of graphical user interface.• May <strong>2001</strong>: Design and production of smallersensor heads.Contact: P.A. Mogan (Paul.Mogan-1@ksc.nasa.gov), YA-D2-C4, (321) 867-8574Participating Organizations: IDEA, LLC (H.E. Rice and T.J.Mallow) and Dynacs Inc. (S.J. Klinko)111
Command, Control, and Monitoring TechnologiesGMT-to-MET IRIG Time Code SimulatorNASA has two different upcomingflight projects incorporating an AirTransport Rack (ATR) that receivesand decodes Greenwich Mean Time(GMT) and Mission Elapsed Time(MET) from the Shuttle orbiter timingbuffer. A simulator is required to providean Interrrange InstrumentationGroup (IRIG) timing signal duringground testing of the ATR. The simulatorwill also provide and monitorpower for the ATR and communicatethrough the serial and Ethernet datalines that interface with the ATR.Simulation of these data streams isnecessary for electromagnetic interference(EMI), environmental, andfunctional testing.A unique requirement of this simulator(and the feature that makes thissimulator noteworthy) is the simulationof the time stream that the ATRwill be required to translate. Priorto launch, the ATR will be receivingthe IRIG standard time-distributionsignal, IRIG-B GMT, to time-stampdata and use for other counting functions.At T-0, the ground link is separatedfrom the Shuttle, and the timereference becomes the MET generatedonboard. This time code formatis specified in MC456-0051, OrbiterMaster Timing Unit Specification, section3.2.1.5.3. The Time TranslatorModule of the ATR is required to synchronizeto the change within 2 seconds.Since T-0 can occur anywherewithin the IRIG-B frame, the TimeTranslator Module should be testedas thoroughly as possible to ensureit synchronizes within the required2 seconds regardless of where thebreak occurs. In the past, testingof this function was limited to theplayback of files created using arecording oscilloscope. This simulatorwill enable exhaustive testingby allowing operators to insert theT-0 transition anywhere in the signalstream and, as a result, will providea higher confidence that the TimeTranslator Module will perform adequatelyduring launch. The figuresillustrate the requirements of theTime Translator Module and the taskof the simulator.Figure 1 represents 019:13:01:59.The differential timing signal generatedby this simulator only generatescodes in the binary coded decimal(BCD) time-of-year portion of thesignal. The control functions andtime of day in seconds are generatedas blank timing frames. (See IRIGStandard 200-98 published by Secretariat:Range Commanders Council:U.S. Army White Sands MissileRange, New Mexico 88002-5110:http://jcs.mil/RCC/ for furtherinformation about the IRIG standard.)Figure 2 shows a perfect transitionfrom 019:13:01:59 GMT to 000:00:00:00MET. The double index (see thearrow) indicates this transition. Inoperations, a perfect transition fromGMT to MET is almost neverreceived. As much as 2 seconds ofthe timing signal can appear to beskipped without an actual loss ofthe signal. Since the last part of allframes is blank (no control functionsor time of day) and the entire firstMET second consists of blank frames,it is impossible to tell exactly wherethe skipped signal occurs.Figure 3 is an example of the typeof faulty transitions from GMT toMET that can occur. In this case,112
Research and <strong>Technology</strong> <strong>2000</strong>/<strong>2001</strong>IRIG-G Timing Signal4.02.00.0-2.0-4.00 25 50 75 100 125 150 175 200 225 250 275 300 325 350 375 400 425 450 475 500 525 550 575 600 625 650 675 700 725 750 775 800 825 850 875 900 925 950 975 999Figure 1. Signal Represents 019:13:01:59IRIG-G Timing Signal4.02.00.0-2.0-4.0500 550 600650 700 750 800 850 900 950 1000 1050 1100 1150 1200 1250 1300 1350 1400 1450 1499Figure 2. Transition From 019:13:01:59 GMT to 000:00:00:00 METIRIG-G Timing Signal4.02.00.0-2.0-4.01950 <strong>2000</strong> 2050 2100 2150 2200 2250 2300 2350 2400 2450 2500 2550 2600 2650 2700 2750 2800 2850 2900 2950 3000 3050Figure 3. Faulty Transitions From GMT to METthe 019:13:01:59 starts (left arrow) and nearly completes,but MET 000:00:00:01 starts (right arrow)without the double index pulse. In many of thetransitions, it appears the last GMT second hasbeen extended, but because the blank frames lookthe same as MET 000:00:00:00, there is no way totell. The simulator can replicate these transitionglitches and be used to test a given IRIG-B decoderto verify it performs within specifications.The abrupt change from GMT to MET and theoften missing double index pulse at the start of asecond cause many IRIG-B decoders to report theincorrect time until they have synchronized to thenew signal. The current requirement is for theIRIG-B decoder to report the correct MET within 2seconds of the GMT-to-MET transition. The simulatorwill enable testing of any IRIG-B decoder toverify it can synchronize to the signal within 2seconds of the GMT-to-MET transition.Key accomplishment:• Developed and tested the simulator.Contact: S.B. Wilson (Scott.Wilson-1@ksc.nasa.gov), YA-E6,(321) 867-3326; and R.J. Beil, PH-G1, (321) 861-3592Participating Organization: Dynacs Inc. (B.M. Burns, Dr.P.J. Medelius, J.S. Moerk, A.J. Eckhoff, J.D. Taylor,J.J. Henderson, and J.A. Rees)113
Command, Control, and Monitoring TechnologiesRemote Access, Internet-Based Data Acquisition SystemCurrent outreach efforts for KSC’sBeach Corrosion Test Site require allexperimentation and data collectionbe conducted by onsite personnel ona real-time basis. This restricts theamount of work conducted at the sitebecause of personnel constraints. ARemote Access, Internet-Based DataAcquisition System will establish abasis for the Corrosion <strong>Technology</strong>Testbed to allow personnel and customersto conduct their experimentsfrom remote locations using the Internet.This state-of-the-art pathfinderacquisition system could be utilizedas a model for other NASA andKSC laboratories to directly developtheir capabilities without the resultingimpact to personnel and travelexpenses. In addition, successfuldevelopment and continued optimizationof this system will producegreat interest in NASA/KSC for corrosionresearch, corrosion exposurecontracts, and industry partnerships.The benefits of this project include:• Showcasing NASA/KSC’s outreachefforts through interactivityand state-of-the-art innovative technologies.• Establishing a Corrosion <strong>Technology</strong>Testbed for use by other NASAlaboratories.• Allowing direct outreach of theKSC Beach Corrosion Test Site tocustomers around the country andaround the world.• Allowing customers to conductcorrosion research without thetravel requirements to the exposuresite.• Allowing business expansion at thesite without the direct need foradditional personnel.• Developing network solutions toallow remote operation of experimentand data collection systems.• Developing software with securityfeatures that allow outside customersto have data access at a KSCsite.• Testing the resulting systems toprove feasibility and optimize userinterface and expansion capabilities.This interactive system will havesignificant commercial applicationsfor outreach to corrosion research laboratories,the corrosion control industry,Government laboratories, paintsand coatings industries, and themarine technology industry.Key accomplishments:• Installed a 50-data-channel networkfrom the exterior exposuresite to the interior of the KSC BeachCorrosion Test Site for monitoringremote access corrosion experiments.• Created an accessible Web site tointeract with the KSC Beach CorrosionTest Site experiments.• Integrated software and hardwareto provide a secure and reliablesystem to monitor and control dataacquisition computers.• Developed data acquisition softwareto interface with the Internet.• Collected data from 15 remoteexperiments proving the concept.114
Research and <strong>Technology</strong> <strong>2000</strong>/<strong>2001</strong>Contacts: L.G. MacDowell (Louis.MacDowell-1@ksc.nasa.gov),YA-F2-T, (321) 867-4550; and W.L. Dearing, YA-D6,(321) 867-3280Participating Organization: Dynacs Inc. (J.B. Crisafulli andJ.J. Curran)115
Command, Control, and Monitoring TechnologiesPortable Cart To Support Hypergolic Vapor Detection InstrumentsThe processing of payloads at KSCrequires the handling of hypergolicpropellants used to control the payloadwhile in orbit. These propellantsare toxic and workers in an areamust not be exposed to concentrationsgreater than those allowed byKSC regulations. To ensure the safetyof people working around a payloadafter it has been loaded with fuel,the air in the work area is monitoredto detect concentrations close to theallowed limit. The limit is 0.01 partper million (ppm) for hydrazine fuelsand 1 ppm for nitrogen tetroxide(N 2 O 4 ) oxidizer.The MDA Single Point Monitor(SPM) is an instrument used to monitorthese vapors. It is designed tobe permanently mounted in a hazardousenvironment on a wall or apanel. To use the instrument effectivelyin a payload processing facility,the instrument needs to be close tothe payload being monitored. TheSPM was mounted on a small laboratorycart to make the instrumentmobile and to provide more audibleand visible alarm signals. The cartprovides power and purge gas to thesensor and accepts the sensor alarmrelay closures to activate a beaconand buzzer mounted on the cart. TheSPM cart is a small stainless-steellaboratory cart modified to add anelectrical enclosure, an explosionproofannunciator, and a three-colorbeacon. This cart is designed tooperate in a hazardous environment.All the enclosures are NEMA 4/4Xtype, purged with nitrogen gas. Theelectrical power is interlocked to thepurge switch that interrupts power tothe SPM if the purge pressure fails.The SPM purge switch will not interruptpower to the alarms or the alarmrelays inside the SPM. There is asecond purge pressure switch insidethe cart enclosure that is closed whenthe purge pressure exceeds 0.5 inch ofwater column. This switch interruptspower to all circuits in the cart andthe SPM when purge pressure fails.The SPM cart provides two annunciators– a beacon that produces threedifferent colors and a buzzer that produces89-decibel sound measured ata distance of 10 feet. The beacon ismounted on a stanchion on one endof the cart at about a 5-foot elevation.The stanchion is a conduit that carriesboth electrical power and purge gaspressure to the beacon. The buzzeris mounted on the top shelf of thecart, which is connected to the controlenclosure by a tube that carries bothelectrical power and purge gas pressureto the buzzer. The beaconis green and steady during normaloperation, serves as a pilot light forthe cart, and can be seen from a distanceas an indication that power tothe SPM is on. In the event of apower loss, blown fuse, or loss ofpurge, the beacon goes out and theSPM stops operating. In the eventof an instrument alarm signal fromthe SPM, the beacon changes to flashingyellow. This occurs when theSPM internal health checks detect afailure condition such as the lossof the sample flow or out-of-tape.When the SPM detects a concentrationof fuel or oxidizer vapor inexcess of the preset alarm limits, thebeacon changes to flashing red andthe buzzer sounds.116
Research and <strong>Technology</strong> <strong>2000</strong>/<strong>2001</strong>Key accomplishment:• Designed and constructed twoSPM carts.Key milestone:• Two SPM carts supported theMars Odyssey payload and arecurrently in use in the <strong>Space</strong>craftAssembly and EncapsulationFacility II.Contact: J.T. Hueckel (John.Hueckel-1@ksc.nasa.gov), VB-E2, (321) 476-3657Participating Organization: Dynacs Inc.(C.B. Mattson, P.W. Yocom, T.R. Hodge,S.L. Parks, D.N. Bardel, and Dr. B.J.Meneghelli)The SPM is located at the right side of the top shelf. The power and alarmcontrols are located in the box on the left side, with the beacon on top. The powercord is coiled and stowed on the bottom shelf when not in use.117
Command, Control, and Monitoring TechnologiesPersonal Cabin Pressure Altitude Monitor and Warning System<strong>Kennedy</strong> <strong>Space</strong> <strong>Center</strong> has developedan aviation/aerospace safetydevice designed to warn crewmembersof a potentially dangerous ordeteriorating cabin pressure condition.About the size of a large pager,the Personal Cabin Pressure AltitudeMonitor and Warning System operatesindependently of other aircraft/spacecraft systems and tracks thepressure conditions of the local environment.The monitor warns (bymeans of audio, vibratory, and visualalarms) of the impending danger ofhypoxia when cabin pressure hasfallen to preprogrammed thresholdlevels. A lighted digital screen displaysa text message of the warningand annotates the pressurization conditioncausing the alarm.The current model contains a miniature,but highly accurate, pressureCabin Pressure Altitude Monitortransducer. Its readings are furtherenhanced by employing a collocatedtemperature sensor to thermally compensatethe device. The unit ismicroprocessor based and is usedto interface the sensors, displays,and alarms as well as operate theembedded code to solve the mathematicalalgorithm that converts theindicated pressure readings to altitude.Through panel-switch selection,the user can choose the units ofthe altimeter to be displayed (i.e., feetor meters), the units of temperature(degree Celsius or Fahrenheit), andwhether to indicate the altitude aboveground level (AGL) or above meansea level (MSL). When the device isused as an altimeter, the user can alsoselect the current altimeter (pressure)setting for either pressure altitude orindicated altitude display. The usercan further choose which set of FederalAviation Administration (FAA)flight rules the unit is to monitor –either commercial [Federal AviationRegulation (FAR) Part 121/135 ornoncommercial (FAR Part 91)] operations.Hypoxia is a state of oxygen deficiencyin the blood, tissues, and cellssufficient to impair functions of thebrain and other organs. Because thepartial pressure of oxygen is reducedas altitude increases, hypoxia is aconcern to flight crews when flyingabove 10,000 feet cabin pressure altitude.The symptoms of hypoxia oftengo unrecognized because the brain isthe first organ to be affected. Oncehypoxia occurs, it is difficult, andoften impossible, for the person toacknowledge the situation or to takecorrective action. In the early stages,there is considerable loss of judgmentand cognitive ability. Performance118
Research and <strong>Technology</strong> <strong>2000</strong>/<strong>2001</strong>can seriously deteriorate within 15 minutes at altitudesas low as 15,000 feet. The ability to takeaction is lost in 20 to 30 minutes at 18,000 feet andin 5 to 12 minutes at 20,000 feet. At 35,000 feet,the time of useful consciousness is a mere 30 to 60seconds.Throughout aviation history, there have beennumerous incidents in which aircraft crewmembersand/or passengers have been incapacitated byhypoxia. The most compromising condition leadingto hypoxia is not the immediate and recognizablerapid decompression, but one in which a slowyet significant leak has developed in the pressurizedcabin or cockpit of an airplane. With crewmembersand passengers unaware, they may eithersimply fall asleep or be otherwise unknowinglyincapacitated. Though many aircraft are fitted withcabin pressurization, monitoring, and alerting systems,there are situations in which the onboardsystem fails or is misconfigured, rendering theoccupants or crew totally unaware of a deteriorating,low-oxygen environment. Another situation isone in which the pilot either knowingly or unwittinglyventures too high for too long in a nonpressurizedaircraft.The aviation application for the monitorincludes monitoring and protection for both scenarios.For pressurized aircraft, the invention providesan independent warning of cabin pressurealtitude when a cabin leak or other reason for pressurizationloss might go undetected. For nonpressurizedaircraft, the monitor tracks the time andaltitude profile of the cockpit in accordance withprescribed regulations and provides a warning tothe crew when supplemental oxygen is to be used.Human space operations can also benefit fromthe innovation in Low-Earth-Orbit (LEO) vehiclessuch as <strong>Space</strong> Shuttle, <strong>Space</strong> Station, and Mir, aswell as long-duration interplanetary vehicles andfuture planetary habitats. The proposed groundbasedapplications include the Mars simulationchamber at KSC and the various pressure/vacuumtest chambers at NASA’s <strong>Space</strong> Flight and Research<strong>Center</strong>s. Applications in its existing form, beyondaviation and aerospace, include use as an altimeterand thermometer for mountain climbers and asa barometer and thermometer for meteorologicalmeasurements. With the selection of a differentpressure transducer and modification to the software,the device could be used to track the pressure,depth, and time profiles in human-tendedunderwater habitats and hyperbaric chambers.The cabin pressure monitor has undergone afast-track development effort in <strong>2000</strong>, going fromconcept to flight demonstrator units in less that 9months. The flight units were tested in the laboratory,in an altitude chamber where normal ascentand rapid decompression profiles were flown, andin various pressurized and nonpressurized aircraft.The technology was introduced to the public in thesummer at the Experimental Aircraft Association(EAA) Airventure <strong>2000</strong> airshow held in Oshkosh,Wisconsin. An industry briefing followed in Octoberwith commercialization efforts well underway.Key accomplishments:• Developed first- and second-generation workingprototypes for general and commercial aviationuse.• Tested demonstrator units in the laboratory, analtitude chamber (including explosive decompression),and a variety of aircraft environments.• Introduced the unit to the public at the EAAAirventure <strong>2000</strong> air show in Oshkosh, Wisconsin.• Applied for a NASA patent.• Held an industry briefing and initiated technologytransfer and commercialization efforts.Contact: J.A. Zysko (Jan.Zysko-1@ksc.nasa.gov), YA-F, (321)867-7051Participating Organizations: YA-D2-E1 (J.M. Perotti andC. Amis) and Dynacs Inc. (A.J. Eckhoff, Dr. P.J. Medelius,R.T. Deyoe, and J.S. Moerk)119
Command, Control, and Monitoring TechnologiesIntegrated Network Control SystemThe Integrated Network Control System (INCS) is ahighly reliable and highly automated network systemthat sends data and commands between the ShuttleLaunch Control <strong>Center</strong> (LCC) and the hardware enditems. INCS will bridge modern industry automationtechnologies with customized aerospace industry communicationprotocols and associated legacy end itemequipment. The INCS design is meeting several challengesincluding connectivity with 40,000 end itemslocated within 28 separate ground systems, all dispersedto 10 facilities over 16 square miles. The INCS designmust also provide data reliability, integrity, and emergencysafing systems to ensure successful and safelaunch operations.Ground control and instrumentation systems forthe <strong>Space</strong> Shuttle Launch Processing System (LPS)use custom digital-to-analog hardware and softwareconnected to an analog wire interconnect distributionsystem. Loss of a data path during critical operationsboth before and immediately after launch would greatlycompromise safety. To enhance safety, data integrity,and network connectivity, INCS design uses three separatenetworks: (1) the Command and Control Network,(2) the Emergency Safing Network, and (3) the HealthManagement Network.For both the command and control bus and theemergency safing bus, INCS chose a redundant medianetwork topology. Unlike most control networks, thisunique network can transmit or receive identical dataover two separate paths at the same time. Therefore,loss of communication over one channel would notaffect operations on the other. The data can also bescheduled, thereby easily prioritizing time-critical overnoncritical data, while providing absolute assurancethat critical measurements arrive on time. This greatlyreduces startup, configuration, and validation test timesbecause data is typically prioritized using software interruptsthat increase engineering, testing, and softwaredebug times.The network topology uses a quad redundant, fiberoptic,fault-tolerant ring for long-distance distributionover the LCC, Mobile Launcher Platforms (MLP’s),Orbiter Processing facilities (OPF’s), and two launchpads. Shorter distances will accommodate redundantmedia with coaxial cable (two per channel) for distributionover system and subsystem levels. The networkwill reduce cable and wiring for ground processing overthe Launch Complex 39 area by approximately 80 percentand cable interconnects by 75 percent. This willenhance processing by reducing maintenance and troubleshooting.To achieve critical data integrity and not burden thecontrol network with increased traffic, the Health ManagementNetwork is separate from the Command andControl bus. Over Ethernet, unscheduled data fromthe backplane of the local gateways will pass detailedparameters of end items, such as motor drives, softstarts, valves, switches, process controller, and sensors.The Health Management Network is used to configurethe system and monitor the health and availability ofthe entire network and most end items. By integratingalarm, system, and network information onto a singlescreen, the user could receive instant problem notificationand the exact location anywhere on the network.Since one end item can have as many as 400 parameters,it is essential and beneficial that large amounts of informationcan be utilized for many purposes while notinterfering with critical process control.Process enhancements are achieved through quicklypinpointing problems and enhanced remote controlcapabilities. These include open-wire detection of varioussensors, override of instrumentation anomalies,remote reset of fuses, and in-depth health information ofvarious end items.The INCS network health information system wouldbe useful for test facilities and prototype flight supportsystems in which fast startup times, accurate instrumentation,and versatility may be desired. Multiple configurationsand measurements can be brought online,configured, and integrated onto a graphical screenwithin a few days. Changes such as scaling, zero andspan calibrations, process control tuning, and parameteradjustments can be made in real time. New end itemscan be configured, brought online, and communicatingwithin minutes. Remote and local automated controlis available through distributed controllers and peer-topeercommunications. Design and network versatility isachieved using a gateway chassis capable of many configurations.The control chassis can be: (1) a networkbridge, bridging various network protocols, or a controlgateway; (2) a process controller with PID control loopsand input/output (I/O) devices; (3) simple remote I/Ocontrol; or (4) any combination of the three.This provides design flexibility and versatilitybecause many configurations are available to the user atany time, now or in the future. The network bridge will120
Research and <strong>Technology</strong> <strong>2000</strong>/<strong>2001</strong>serve to provide connectivity to the system end items,accommodating both new and legacy (old) equipment.To preserve network integrity, INCS prefers to limit theuse of network protocols. INCS is also developing adriver for the Institute of Electrical and Electronics Engineers(IEEE) 488 used for the Range Safety and Telecommunicationssystems.At the LCC, a VME-based interface bridge was developedto map data from the INCS Command and Controlbus to the custom 1553 Manchester-II Shuttle GroundData bus. The interface bridge was designed to workwith both software control systems used in the firingrooms of the LCC – the existing Command Control andMonitor System (CCMS) and the new Checkout andLaunch Control System (CLCS), when implemented.This provides the dual benefit of being able to implementINCS at any time and to transition to eithersystem with minimal impacts. The INCS would be thefirst large-scale network control and health managementsystem for the <strong>Space</strong> Program and one of the largestfully integrated control networks in the world.Key accomplishments:• Proof-of-concept document and system-level specificationsigned and released.• Comprehensive cost estimate and master schedulecompleted.• Database of 40,000 I/O points, the associated enditems, distributors, cables, etc., built.• Basic design and architecture with equipment locationlist and single-line diagram of system layoutcompleted.• Environmental testing of hardware field vibrationtesting and vibrational analysis of remote distributors(Node Boxes) installed on both pads and 1 MLP 80percent completed.• Successful testing of VME-based interface bridge connectedto CCMS in firing room 3.• Emergency safing system design using active standbywith safety and reliability assessment 80 percent completed.• INCS demonstrator located in LCC and successfultesting of fiber modems for long-distance fiber transmissionlosses over multimode and singlemode fibercompleted.Key milestones:• Complete development and testing of active standbyfor the VME-based interface bridge. Release ofmaster transition plan document. Successful end-toendtesting from the LCC to Launch Pads A and B.Contact: W. McClellan (Wayne.McClellan-1@ksc.nasa.gov),PH-F, (321) 861-3704Participating Organizations: United <strong>Space</strong> Alliance (K.J.Ahrens, R. Brown, and N. Mizell) and Dynacs Inc.(S.J. Romine)By distributing data over the network, as opposed to wiring through terminal boards, the dual-channelredundant media network module on the left easily replaces the roomfull of terminal distibutors (center).On the right is an open terminal distributor showing cable and wiring.121
Command, Control, and Monitoring TechnologiesAdvanced Hazardous Gas Detection SystemNASA routinely employs instrumentationfor monitoring areaswithin the <strong>Space</strong> Shuttle for leaksin the cryogenic fuel system. Targetgases of interest include hydrogen(the cryogenic fuel), oxygen (the cryogenicoxidizer), helium (an area purgegas), and argon (a marker for ambientair leaks) in a nitrogen background.To date, quadrupole-based residualgas analyzers (RGA’s) and fixedsector mass spectrometers are locatedbetween 200 and 400 feet from thevehicle sampling locations becauseof ruggedness requirements and sizelimitations. Recent efforts focused onevaluating and testing a variety ofnovel and/or miniaturized mass analyzersfor possible use in supportingfuture launches. The mass spectrometerswill be placed close to the vehicleto eliminate the need for thelong sample lines. This close proximitywill improve the response timeand sensitivity of the instrument and,at the same time, will necessitatemaking the instruments smaller andmore rugged. Sensor and spectroscopyinstrumentation were consideredbut mass spectrometry (MS)appears to be the best suited forthis application. MS instruments currentlybeing evaluated include allof the commonly known mass analyzers[i.e., quadrupole, sector, timeof-flight(TOF), quadrupole ion trap,and Fourier transform ion cyclotronresonance (FT-ICR)] as well as noveland/or hybrid designs (i.e., multiquadrupole,cycloidal focus, and acylindrical crossed electric/magneticsector). Each of these instruments isbeing characterized through ongoinglaboratory tests using gas standards.The aim of this research is to deter-mine which mass analyzer technologyis best suited for this application.The instrumentation must detectconcentrations of hydrogen andoxygen as low as 25 parts-per-millionby volume (ppmv) and argon concentrationsas low as 10 ppmv. Inaddition, the instrumentation musthave a linear dynamic range of fourorders in magnitude and provide aunit mass resolution across this range.The system deployed on the Shuttlelaunch pad should be low in volumeand weight, be rugged enough towithstand the strong vibrations thatoccur during Shuttle launches, provideresponse times of less than 5seconds, and supply updated concentrationdata every second.For these experiments, the quadrupoleRGA was used as the standardagainst which the other mass spectrometerswere compared. QuadrupoleRGA instruments are widelyused for detecting low levels of permanentgases for various processmonitoring applications and, therefore,are able to meet many of thedesired performance criteria. Theycan have computed accuracies towithin 2 percent, which is well withinthe 10-percent performance specification.They are not small or ruggedenough, however, for the stated application.In addition, the update rate istoo slow.Several different quadrupole iontrap instruments coupled to varioussample introduction systems werealso tested. Commercial quadrupoleion trap instruments were notdesigned for permanent gas analysisand are not capable of scanning122
Research and <strong>Technology</strong> <strong>2000</strong>/<strong>2001</strong>below mass to charge (m/z) 10. Some of the originalresearch on quadrupole ion traps showed thatthey can indeed be used to detect hydrogen andhelium, and research is in progress to make the necessaryhardware modifications to the commercialinstruments to achieve this end.Two other instruments showing promise for thisapplication are a prototype double-focusing electric-magneticsector and TOF instruments. Thissector instrument is a substantially miniaturizedmass analyzer that easily fits in the palm of ahand. Results from this instrument indicate limitsof detection (LOD’s) as low as 9 ppmv (see thetable). The TOF instrument gave marginal LOD’sbut poor response times. Future work on the inletsystem may address this.Representatives of two additional MS technologies,FT-ICR and multiquadrupole arrays, haveshown less-than-promising results. Poor performanceof the FT-ICR system was attributed largelyto the engineering design. A small ion cell anda poorly devised vacuum system explain the highLOD’s and extremely slow response times. It isunlikely the high vacuum requirements for thisinstrument are compatible with miniaturization orwith the high sample pressures and flow rates nec-essary for fast response times. The multiquadrupolesystem provided better performance butexhibited high limits of detection. In addition,the system displayed poor sensitivity, specificallytowards oxygen.A comparison of the various figures of meritand other specifications from the mass analyzersevaluated to date are shown in the table. Thequadrupole RGA instrument has yielded the bestperformance to date. It can rapidly achieve operatingpressures and operational specifications withina few minutes after power-up and has provenreliability. The quadrupole ion trap instrumentsrequire further development to access the lowmasses necessary for this application and areaffected by operating conditions such as temperatureand pressure. The dual-sector and TOF instrumentsalso show promise but likewise requirefurther research and engineering to meet therequirements for this application.Contacts: F.W. Adams (Frederick.Adams-1@ksc.nasa.gov),YA-D2-E2, (321) 867-6671; and D.W. Follistein, YA-D2-E2,(321) 867-6683Participating Organization: Dynacs Inc. (Dr. T.P. Griffin, A.Ottens, and CR. Arkin)Comparison of Selected Performance Specifications From theVarious Mass Spectrometers Evaluated to DateType of Mass AnalyzerLimit of Detection (ppmv)Hydrogen Helium Oxygen ArgonMassRange(m/z)DataUpdate(s)Volume(cc)QuadrupoleQuadrupole Ion TrapDual SectorCycloidal FocusTOFMultipoleFT-ICR1.8--1731254> 500> 50000.2--79718~ 500> 50001.661937204>> 500> 210000.639317>> 500> 50002 - 10010 - 6002 - 502 - 502 - 502 - 50--6< 1~ 1~ 301~ 7.5--50,500107,600N/A54,700121,80035,100104,800123
Command, Control, and Monitoring TechnologiesHazardous Gas Detection System <strong>2000</strong>The <strong>Space</strong> Shuttle uses liquid hydrogen andliquid oxygen as the fuel and oxidizer, respectively,for the main engines. Because of the hazards associatedwith these commodities, it is important toensure the main engines do not leak. From thebeginning of the <strong>Space</strong> Shuttle program, mass spectrometershave been used to monitor for cryogenicfuel leaks. Mass spectrometry is the only technologyproven to monitor all necessary gas constituentsat the required limits of detection [low partper million (ppm)]. Currently, four mass spectrometer-basedsystems are used for each launch:Prime Hazardous Gas Detection System (HGDS),Backup HGDS, Portable Aft Mass Spectrometer,and Hydrogen Umbilical Mass Spectrometer. Dueto the age of the Prime and Backup HGDS’s, longdowntimes are a frequent occurrence, extensivemaintenance is required to keep them operational,many of the system components are obsolete, andoverall system performance is degrading. Also,these four systems contain eight-bit control systemsthat require a unique and cumbersome data monitoringsystem. A new gas detection system wasFigure 1. HGDS <strong>2000</strong>needed to improve operational performanceand system maintainability.The replacement system is the HazardousGas Detection System <strong>2000</strong>shown in figure 1.Many features of the new HGDS<strong>2000</strong> were not in the previous systems.These features include theMultiple Detector Sample DeliverySystem, control of the inlet pressure,use of an inexpensive (less than$6,000) quadrupole mass spectrometer,new pump technologies for backingas well as for transport (whichalleviates the need for costly, hazardouspump oil), and expanded monitoringand control systems. The useof the latest technologies in massspectrometry and pumps yields aquieter, more robust system thathelps to improve astronaut safety, aswell as safety for engineers and techniciansoperating the system. Thisis the first system designed from theground up with the full redundancyand functionality necessary for criticality1 ground support equipment(GSE). The system is capable of monitoringgases in helium, nitrogen, orair backgrounds. The mass spectrometerenables near-simultaneous(within the speed of the electronics)monitoring of all gas constituents ofinterest. All these features contributeto achieving limits of detections in thelow-ppm range with a response timeof less than 10 seconds.Figure 2 depicts an overview ofthe entire HGDS <strong>2000</strong>. The MultipleDetector Sample Delivery System isused to deliver gas samples to theinlets of two independent mass spectrometers.All aspects of the operationof the system are controlledthrough the VME system with addi-124
Research and <strong>Technology</strong> <strong>2000</strong>/<strong>2001</strong>Figure 2. Block Diagram of HGDS <strong>2000</strong>tional control and communication cards, asrequired. Gas concentrations are reported in bothppm and percent (%). Information is sent topersonal computers (PC’s) connected to the VMEby an independent, redundant network. All userinteraction is performed using the PC.The system is fully redundant and meets allrequirements for GSE. This includes ruggednessto withstand launching on the Mobile LauncherPlatform (MLP), ease of operation, and minimaloperator intervention. User inputs are through thePC using mouse and keyboard commands. Theinterface is intuitive and easy to operate. The projectis a successful demonstration of using commercialoff-the-shelf (COTS) items along with in-housedesigns to produce a system that is uniquely suitedfor on-line gas monitoring. Though this system iscurrently optimized for detecting cryogenic leaks,many other gas constituents could be monitoredusing the HGDS <strong>2000</strong>.Contacts: C.A. Mizell (Carolyn.Mizell-1@ksc.nasa.gov),YA-E6, (321) 867-8814; and G.S. Breznik, PH-M2, (321)861-3958Participating Organization: Dynacs Inc. (Dr. T.P. Griffin,G.R. Naylor, W.D. Haskell, and R.J. Hritz)125
Command, Control, and Monitoring TechnologiesLeak Detection Point Sensors for GasesThis is a research and developmentproject to design and fabricate pointgas sensors and to identify commercialpoint sensors for leak detection.Ultimately, these sensors willbe used for locating propellant leaksin ground support equipment (GSE),the <strong>Space</strong> Shuttle aft engine compartment,and future-generation spacecraft.In order to verify candidatesensor performance, a multipurposePoint Sensor Test Platform was tobe designed, fabricated, and verified.All sensor testing will be conductedaccording to a new guideline documentbeing produced in the project(KSC-YA-5381, KSC Gas DetectionInstrumentation Test and QualificationGuideline).A comprehensive survey was conductedto determine which sensorsare commercially available and whichsensors are in an active developmentproject. A broad search was conductedto include propellant gasesand contaminants, purge gases, andthose gases associated with Mars insitu propellant production. In particular,the gases of interest werehydrogen, oxygen, nitrogen tetroxide,monomethylhydrazine, nitrogen,argon, helium, water vapor, carbondioxide, and carbon monoxide.The Point Sensor Test Platform,formerly called Bantam X, has beencompleted and is housed in the EngineeringDevelopment Laboratory at<strong>Kennedy</strong> <strong>Space</strong> <strong>Center</strong>. An environmentalchamber has the capability oftesting at temperatures from -60 to+100 degrees Celsius, pressures from20 to 1000 torr, and various gas concentrationswith up to five gas cylindersalong with a sixth cylinderfor zero gas. LabView softwareenables essentially automated controland sequencing of various test conditionsand simultaneously acquires thetest data.The work currently in progressincludes:• Final modifications of the PointSensor Test Platform to includedynamic testing of sensor timeresponse and drift stability.• Documentation, manuals, parts list,and drawings.• Validation of the Point Sensor TestPlatform hardware and softwareperformance.This program will provide the followingbenefits:• Establish a KSC standard for sensortesting.• Qualify sensors for realistic flightand ground support environmentalconditions.• Establish a baseline for sensordevelopment and availability.• Shorten vehicle-processing time inthe long range.Contacts: J.M. Perotti (Jose.Perotti-1@ksc.nasa.gov), YA-D2-E1, (321) 867-6746;G.A. Hall, YA-D2-C4, (321) 867-1830; andP.A. Mogan, YA-D2-C4, (321) 867-8574Participating Organization: Dynacs Inc.(J.J. Randazzo, Dr. C.D. Immer, Dr. R.G.Barile, and A.J. Eckhoff)126
Research and <strong>Technology</strong> <strong>2000</strong>/<strong>2001</strong>Point Sensor Test Platform127/128
Research and <strong>Technology</strong> <strong>2000</strong>/<strong>2001</strong>Biological SciencesBiological Sciences is the science core competency area for the <strong>Space</strong>port <strong>Technology</strong><strong>Center</strong>. This has the vision of achieving a better understanding of managingbiological and ecological systems for applications in space and on Earth. Toaccomplish this vision, research and technology development will be performedto develop a baseline data set for biological system stability and capabilityfor missions beyond low Earth orbit (for example, bioregenerative life supportsystem), to develop an understanding of the fundamental issues with biologicalorganisms in microgravity, to assess environmental impacts on new and oldlaunch sites on Earth and eventually other planetary bodies, and to ensure ourecosystem at KSC is understood, managed, and protected.Activities/focus areas include the following:• Bioregenerative Life Support• Basic Biological Research• <strong>Space</strong>port Ecosystem SciencesThe goals and objectives of Biological Sciences include the following:• Perform fundamental research in bioregenerative life support and plantresponses to microgravity as part of the Advanced Life Support (ALS) andFundamental Biology Programs• Conduct a controlled biological systems research and development effort thatwill generate the research data and technology required to build functioningbioregenerative life support systems for long-duration space missions• Improve KSC research and technology capabilities to meet operationalrequirements in the areas of environmental compliance and laboratory supportof flight experiments• Provide the scientific understanding and technologies needed to support thesound management and conservation of our <strong>Space</strong>port <strong>Technology</strong> <strong>Center</strong> ’secological resourcesFor more information regarding Biological Sciences, please contact CristinaGuidi, (321) 867-7864, Cristina.Guidi-1@ksc.nasa.gov, or Dr. William Knott,(321) 867-6987, William.Knott-1@ksc.nasa.gov.129
Biological SciencesEvaluation of Two Microgravity-Rated Nutrient Delivery SystemsDesigned for the Cultivation of Plants in <strong>Space</strong>There is a need for microgravitybasedplant culture nutrient deliverysystems (NDS’s) for both bioregenerativeAdvanced Life Support andplant research functions. The provisionof adequate levels of water(without causing waterlogging) andoxygen to the root zone is the mostcrucial component deterring majoradvancements in this area. Thedominance of the surface tension ofwater under microgravity conditionshas often been found to lead toeither severe waterlogging or excessivedrying in the root zone. Consequently,differences in plant growthresponses between spaceflight experimentsand their ground controls areexpected based merely upon differencesin moisture distribution patternsbetween the two conditions.This project addresses the question of “comparability of environmentalconditions” between the spaceflight and ground controlexperiments for both a porous tube plant NDS and a substratebasedNDS by employing three different wetness-level treatmentsfor both of these approaches. It is anticipated thatdifferent preset wetness levels than those used on Earth will berequired to support optimal plant growth in space. Dry seedswill be loaded 3 days prior to orbiter liftoff, and the systemwill be initiated by the crew on-orbit. A minimum of 72 wheat(Triticum aestivum) seeds (for each of the two NDS’s) will beimbibed and germinated on-orbit. A time-lapsed video recordingof the plants will monitor the growth over time. At recovery,the plants will be measured, and tissue will be analyzed for geneexpression and stress-associated metabolites.The Porous Tube Insert Module (PTIM) prototype apparatus(see the figures) is the testbed for the development of experimentalprocedures for this spaceflight experiment. PTIM provideswater delivery to both a series of “naked” porous tubes andporous tube/substrate compartments. PTIM software will allowthe crew to interact with the PTIM system’s watering initiationprotocols. The PTIM incorporates several types of sensors (e.g.,pressure and moisture) to determine the wetness levels bothon the “naked” porous tubes and within the three substratecompartments of the module.Key accomplishments (<strong>2000</strong>):As part of the Year 1 Development Phase of the project, thefollowing tasks were accomplished:PTIM Model Top View• Identified basic hardware configuration options.• Performed ground studies to define experimental methodsand requirements.• Developed and undertook science testing with the PTIM prototypeapparatus.Key milestones:PTIM Model Bottom View• <strong>2001</strong>: Perform KC-135 testing of critical hardware designs.Conduct a high-fidelity science verification test using theflight hardware configuration.• 2002: Complete flight hardware fabrication. Conduct a highfidelitypayload verification test using flight hardware.• 2003/2004: Conduct a spaceflight experiment on the <strong>Space</strong>Shuttle.130
Research and <strong>Technology</strong> <strong>2000</strong>/<strong>2001</strong>PTIM Functional DiagramThe photo to the left shows wheat plantsgrown for 18 days on the PTIM prototype unit.The left half of the unit contains six poroustubes at varying pore sizes ranging from 0.2to 0.3 micrometer, each of which received nutrientsolution at a rate of 1 milliliter per hour.The right half of the unit consists of threesubstrate compartments that received differentvolume injections of water daily.Contacts: G.J. Etheridge (Guy.Etheridge-1@ksc.nasa.gov), YA-A, (321) 867-6369; and Dr. J.C.Sager, YA-D3, (321) 476-4270Participating Organizations: Dynamac Corporation(Dr. H.G. Levine and Dr. T.W. Dreschel), Bionetics Corporation(H.W. Wells and K.A. Burtness), and BioServe<strong>Space</strong> Technologies (Dr. A. Hoehn)131
Biological SciencesPilot-Scale Evaluation of a New <strong>Technology</strong> To Control Nitrogen Oxide(NO X ) Emissions From Stationary Combustion Sources (Phase III)NO X emissions from combustion sources suchas power plants and incinerators have become anincreasing environmental concern during the pastseveral decades. In a cooperative agreement for apilot-plant study, NASA, the University of CentralFlorida (UCF), and EKA Chemicals, Inc., have beenexperimenting for the past 3 years with relativelynew and economically attractive methods of oxidizingthe NO X emissions with hydrogen peroxide(H 2 O 2 ). Using a 35-million British thermal unit(Btu) natural-gas-fired industrial boiler onsite atKSC, nitric oxide (NO) and sulfur dioxide (SO 2 )were injected into a portion of the flue gas prior tothe experimental equipment in order to simulate arange of exhaust streams encountered in stationarycombustion sources. Several methods were used toactivate the H 2 O 2 into hydroxyl radicals, which canthen oxidize the NO to nitrogen dioxide (NO 2 ) andwater-soluble species (HNO 2 and HNO 3 ). Thesewater-soluble species are then scrubbed, resultingin a nitrogen-rich waste stream that can be sentto a treatment facility or used as a commercial fertilizeradditive. A data acquisition system withLabView software is used for system controls, datarecording at key points, and automated emergencyshutdown.Phase I used thermal activation by injectingH 2 O 2 into the flue gas stream at an optimumtemperature of about 930 degrees Fahrenheit (°F).Since the KSC boiler breech exhaust gas temperaturewas 340 °F, an inline natural gas burner wasadded to raise the temperature at the H 2 O 2 injectionpoint to simulate other sources. Phase I dataconfirmed conversion values above 90 percent forNO to NO 2 and water-soluble species (HNO 2 andHNO 3 ) using molar ratios of H 2 O 2 :NO slightlyabove 1.0. The H 2 O 2 :NO ratio is economically crucialfor the commercial application of this method.Phase II used ultraviolet (UV) radiation for activationof H 2 O 2 so lower flue gas temperatures (400°F) could be used at the injection point. The scrubberwas also modified to improve scrubber pH andtemperature control and to increase system captureof NO 2 . The results were inconclusive; however,further testing is planned in Phase III key milestones.Phase III implements (1) a 3000-watt,2450-megahertz (MHz) microwave unit designed,built, and installed by Litton Systems, Inc., ElectronDevice Division, to activate the H 2 O 2 in place ofthe UV unit and (2) an innovative experimentalpiping system design to make it easier to achievethe desired temperature in the reactor. The microwaveidea and technology were introduced to theproject by Tiberian Technologies, a new industrialpartner in Phase III. The temperature parameterwas controlled via a flue gas mixture from theboiler breech and combustion chamber to achievethe nominally required 400 °F reactor inlet temperature.Figure 1 shows the Phase III design configuration.While Phase III modifications were in progress,Dynacs KSC Digital Media Laboratory designedand completed a simulation module that can bepresented in multimedia formats depicting the conceptualapplication of the NO x emission controls.This presentation format can be used in commercialmarketing of this technology (figure 2).Key accomplishments:• 1997: Completed Phase I design, installation,and preliminary testing.• 1998: Completed Phase I testing, data analysis,and reports. Presentations at the Air and WasteManagement Association’s (AWMA’s) sectionmeetings.• 1999: Completed Phase II design, testing, dataanalysis, and reports. Presentations given at theAWMA Annual Conference and AWMA Floridasection meeting. Modified system and reranshort grouping of Phase I level tests for repeatabilityverification and speciation studies.• <strong>2000</strong>: Completed Phase III design and installation.Presentation given at the AmericanInstitute of Chemical Engineers Annual Conference.Developed 3-D computer rendering of132
Research and <strong>Technology</strong> <strong>2000</strong>/<strong>2001</strong>SO 2NO xWater SupplyMicrowaveREACTORFanVentH 2 O 2BalanceWaterSupplyWaterSupplyBOILERWasteWaterSCRUBBERDrainSamplePortFigure 1. Phase III Schematica proposed installation of theNO x control system in a typicalpower plant.Key milestones:Figure 2. Conceptual Application of NO x ControlsContact: M.M. Collins (Michelle.Collins-1@ksc.nasa.gov), YA-D3, (321)867-6987Participating Organizations: University of Central Florida (Dr. C.D. Cooper andDr. C.A. Clausen, III), Florida Institute of <strong>Technology</strong> (Dr. M. Pozo de Fernandez),EKA Chemicals, Inc. (J. Tenney and D. Bonislawski), Tiberian Technologies(S. Beers and A. Gravitt), Litton Systems, Inc., Electron Device Division (G.Schaeffer), and Dynacs Inc. (C.R. Nelson)• <strong>2001</strong>: Phase III testing, dataanalysis, reports, and presentationsat technical forums. FurtherPhase II testing usingthe UV unit and modifiedscrubber using new scrubberliquor technology (see KSCResearch and <strong>Technology</strong> 1998Annual Report, “Installation ofa New Scrubber Liquor for theNitrogen Tetroxide ScrubbersThat Produces a CommercialFertilizer”).133
Biological SciencesEarth Systems Modeling and Landscape ManagementLand management practices in many ecosystems,including KSC, are based on controlledburning for habitat maintenance and reductionof wildland fuels. Available ecosystem modelsand fire and smoke models provide some guidance;however, no system exists that incorporatesthese tools with operational schedules such as payloads,vehicle processing, current meteorologicaldata, and remotely sensed data for use in decisionsupport and risk assessment.The approach involves development of a diverseset of information tools including rule-based expertsystems, numerical models, time series analysis,and fusion of a variety of data collection systemsand databases such as fire prescriptions and fuelsdata, ecological and fire models, real-time meteorologicaldata, and high-resolution aerial imagery.The project will:• Provide data and information to optimize themanagement of resources at KSC and the MerrittIsland National Wildlife Refuge.• Incorporate NASA remote sensing and advancedGeographic Information System (GIS) technologyinto local scale decisionmaking processes.• Provide information and methods to reduce thepotential for wildfires at KSC.• Enhance NASA capabilities to comply with Federaland state environmental laws such as theEndangered Species Act.Key accomplishments:• 1996: Obtained a high spectral resolution imageof the KSC area using the NASA Airborne Visibleand Infrared Imaging Spectrometer (AVIRIS)sensor. Initiated development of a deterministicmodel for estimating plant canopy biochemicaland biophysical characteristics.• 1997: Conducted an experimental controlledburn at KSC in association with the U.S. Fish andWildlife Service (USFWS), Los Alamos NationalLaboratory, U.S. Air Force, and Los AngelesCounty Fire Department to develop data onfire spread, intensity, and smoke production.Obtained high spatial resolution images (1 to 2meters) of the KSC area. Obtained field measurementsof plant canopy biophysical and biochemicalfeatures and plant canopy and leafspectral characteristics for model developmentand parameterization.• 1998: Initiated development of a Web-baseddecision support tool that integrates payloadschedules, Shuttle operations schedules, facilitylocations, and controlled burn prescriptions tominimize conflicts and maximize managementof wildland fuels and wildlife habitat. Integratedplant biophysical features such as leafarea, leaf angle distribution, canopy closure,canopy height, and bottom reflectance into atwo-flow irradiance model for radiative transferin plant canopies.• 1999: Enhanced fire management informationdevelopment and transfer with the Fire Managementand Analysis Network (FireMAN).Acquired high-resolution Light InterferometricDetection and Ranging (LIDAR) data for developmentof a three-dimensional landscape model.• <strong>2000</strong>: Conducted radiometric analysis of plantand soil moisture content. Acquired base-widehigh-resolution color infrared orthophotography.Generated three-dimensional virtual landscapesin GIS. Initiated development of a high-resolutionfire-weather information system.Key milestones:• 1996: Initiated GIS database integration inORACLE and development of image processingmethods for the use of high-resolution data inwildlife habitat mapping.• 1996: Presented two papers at the Eco-InformaConference in Orlando, Florida, on remote sensingmodeling in plant canopies.• 1997: Coordinated a multiagency experimentalcontrolled burn to obtain data on fire and smokebehavior in coastal environments.• 1998: Enhanced communications betweenUSFWS and NASA Shuttle and Payloads Operationsthrough development of a Web-based sup-134
Research and <strong>Technology</strong> <strong>2000</strong>/<strong>2001</strong>High-Fidelity Spatial Model Derived From LIDAR, Aerial Photography,Virtual Objects (Trees), and Planimetrics (Buildings)(Observer Is Looking Southeast Toward the O&C Building andKSC Headquarters)Percent ReflectanceCoastal Soil0.70.60.50.40.30.20.10350 850 1350 1850 2350Wavelength (nm)DryWetRadiometric Analysis Reveals Differences in Spectral Characteristicsof Soils in Relation to Moisture Contentport system for controlled burns at KSC.• 1999: Initiated a multiagency effort to support fire management and response activities with NASA,the U.S. Air Force, County Emergency Management, and the Florida Division of Forestry.• <strong>2000</strong>: Incorporated high-resolution, three-dimensional/rapid time series data into operational applications.Contact: Dr. W.M. Knott (William.Knott-1@ksc.nasa.gov), YA-D3, (321) 867-6987Participating Organization: Dynamac Corporation (R. Schaub and C.R. Hall)135
Biological SciencesThreatened and Endangered Species MonitoringThe biological diversity of KSC is greater than that ofnearly all other Federal facilities. Under the EndangeredSpecies Act and the National Environmental PolicyAct, operations require evaluation and impact minimization.Approximately 100 wildlife species at KSCand the associated Merritt Island National WildlifeRefuge are species of conservation concern. Monitoringfocuses on combining field and remote sensing datawith predictive/interpretive models on marine turtles,gopher tortoises, indigo snakes, wading birds, shorebirds,scrub jays, beach mice, and manatees. These studiescontributed to more than 25 scientific journal articlesand were used to develop rangewide species recoveryefforts.The influences of habitat features on abundance anddemographic success are quantified at different spatialscales. Sequences of aerial photography are used toinvestigate how different land use practices influencehabitat suitability and population parameters. Simulationmodels are used to quantify the influence ofland use, habitat quality, population size, and catastropheson populations. The studies are currently beingapplied across larger geographic areas through collaborativearrangements with other agencies and privatefoundations. Most studies are focused on Central Florida’sAtlantic Coast. However, one study area rangesfrom San Francisco to Baja in order to support NASAenvironmental management concerns at Vandenberg AirForce Base, California. Results show launch effectsare insignificant compared to larger scale ecosystemand population processes that need to be consideredmore carefully. Collaboration with an internationalteam of scientists was also conducted to review similarapproaches worldwide for purposes of summarizing thestate of the science and knowledge gaps that preventgreater application of population modeling techniques.The results were summarized for a book on landscapeecology and biological conservation.The table provides a validation of Florida scrub jaydemographic predictions based on KSC studies. Thetable shows trends in the number of breeding pairson the mainland in South Brevard County. Most territorieswere tall or irregularly burned except at theSebastian Buffer Reserve, where there has been frequentfire. Valkaria also has much tall scrub, but colorbandingstudies show population declines were buffered byimmigration. Studies of large-scale population processesshow jays have greater propensities to move fromsmall fragments into larger fragments, such as Valkaria.These studies also show recolonization of restored scrubis influenced by the reluctance of male Florida scrubjays to move great distances. Therefore, the spatial andtemporal implementation of restoration strategies mustconsider habitat potential and the existing populationdistribution. Knowledge gained by restoration strategiesat KSC and on the mainland will be complimentarybecause the replication of a restoration across a range ofdifferent landscape arrangements and land use historieswill enhance the ability to predict and interpret results.Figure 1 represents one possible Markov chain modelfor scrub habitat dynamics at KSC by assuming currentfire management will continue. The boxes representfour classes of Florida scrub jay territories (25-acre landscapeunits). The annual transition probabilities are calculatedfor several Florida scrub jay population centersat KSC. Only the “short and optimal mix” territory classhas reproductive success rates that exceed the mortalityrates. These population sources can sustain a portion ofthe scrub jay population residing in suboptimal habitat(the three other territory classes). Minimizing extensivepopulation decline requires increasing the proportion ofBreeding Pairs of Scrub Jay on the Mainland in South Brevard CountyLocationSouth Beach Conservation Areas and Habitat FragmentsMalabar Scrub SanctuaryJordan Sanctuary and Mitigation AreasValkaria Scrub SanctuaryBabcock Mitigation AreaMicco Scrub SanctuaryPalm Bay Habitat FragmentsSebastian Buffer ReserveTotals1993261024247155311170<strong>2000</strong>5292213181171136
Research and <strong>Technology</strong> <strong>2000</strong>/<strong>2001</strong>0.06All Short(170 cm)0.670.03Figure 1. Markov Chain ModelTall Mix0 10 20 30 40 50YearsAll TallFigure 2. Predicted Population Trends Basedon Habitat Quality• 1991: Developed habitat maps of the most importantareas at KSC for scrub jays, wading birds, and otherspecies.• 1992: Developed a scrub restoration and monitoringprogram.• 1993: Developed a wetlands restoration programplan.• 1994: Developed a KSC biological diversity evaluationsummary.• 1995: Developed techniques to map habitat suitability.• 1996: Developed models to predict demographic successusing maps.• 1997: Tested the ability of maps and models to predictpopulations.• 1998: Developed rapid assessment tools for environmentalmanagers.• 1999: Developed procedures to incorporate uncertaintyinto decisionmaking.• <strong>2000</strong>: Developed procedures to project landscapechanges.Key milestones:• 1995: Summarized population and habitat statustrends for gopher tortoises, wading birds, and scrubjays.• 1996: Developed a scrub jay population recoverystrategy.• 1997: Published biological diversity prioritizationanalyses.• 1998: Published habitat analysis procedures.• 1999: Published population risk modeling procedures.• <strong>2000</strong>: Expanded studies to investigate larger-scalepopulation processes.Contact: Dr. W.M. Knott (William.Knott-1@ksc.nasa.gov),YA-D3, (321) 867-6987Participating Organization: Dynamac Corporation (D.R.Breininger)137
Biological SciencesPlant Lighting SystemsPlants use visible irradiance asan energy source to produce foodthrough photosynthesis for spaceinhabitants. The low electric powerconversion efficiencies demonstratedby conventional lighting technologieswould be prohibitive to growingplants on a large scale in space.Hence, current lighting research forspace-based plant culture is focusedon development of advanced lightingtechnologies that have a high electricalefficiency and appropriatespectral output for photomorphogenicrequirements. Accordingly,light-emitting diodes (LED’s) andmicrowave lamps are promisingtechnologies being developed toefficiently generate photosyntheticradiation. LED’s can illuminate nearthe peak light absorption regionsof chlorophyll while producing virtuallyno near-infrared radiation. Thesulfur-microwave electrode-less highintensitydischarge (HID) lamp usesmicrowave energy to excite sulfurand argon, which produces a brightcontinuous broad-spectrum whitelight. Compared to conventionalbroad-spectrum sources, the microwavelamp is highly efficient andproduces limited amounts of ultraviolet(UV) and infrared radiation. Thework in the KSC Life Sciences SupportProgram in association with theJohnson <strong>Space</strong> <strong>Center</strong> Advanced LifeSupport (ALS) Program gives insightinto the feasibility of using LED’sand/or microwave lamps as innovativealternative light sources for plantbiomass production.Within the ALS Program, saladtypeplants represent crops that couldprovide a portion of fresh food aswell as psychological benefits to thecrew aboard future space transporta-tion vehicles. Laboratory data generatedwith salad-type crops in thepresence of various lighting sourceswill provide important informationfor modeling and development forfuture missions. Work was completedwith spinach, radish, and lettuceplants grown in the presence of 9different lighting sources for 28 dayswith different photoperiods. Threelamp banks represented broad-spectrumwhite light sources (microwave,high-pressure sodium, and cool-whitefluorescent). Current testing alsoincludes six separate LED arraysfilled with a given wavelength of red[664, 666, 676, 688, 704, and 735 nanometers(nm)] LED’s. Each LED arraycontains single rows of blue LED’s(474 nm) evenly distributed withinthe multiple rows of red LED’s.Key accomplishments:• 1998: NASA NRA Solicitation98-HEDS-01 grant to DynamacCorporation for salad-type plantlighting research. Published fourresearch papers on lightingresearch findings with LED’s.• 1999: Began experiments withsalad-type plant growth withLED’s and microwave lamps.• <strong>2000</strong>: Completed initial salad-typeplant growth studies with LED’sand microwave lamps. NASANRA Solicitation 98-HEDS-01 grantto Dynamac Corporation extendedthrough <strong>2001</strong>.Key milestone:• <strong>2001</strong>: Complete testing ofexpanded salad crop list withLED’s, sulfur-microwave, and conventionallighting technologies.138
Research and <strong>Technology</strong> <strong>2000</strong>/<strong>2001</strong>Root Zone of Radish Plants Growing in a Hydroponic CultureSystem Located Under a Sulfer-Microwave HID LampContacts: Dr. W.M. Knott (William.Knott-1@ksc.nasa.gov),YA-D3, (321) 867-6987; Dr. R.M. Wheeler, YA-D3, (321)476-4273; and Dr. J.C. Sager, YA-D3, (321) 476-4270Participating Organization: Dynamac Corporation (Dr. G.D.Goins)139
Biological SciencesCandidate Crop Evaluation for Advanced Life Supportand Gravitational Biology and EcologyThe primary objective of this task is to define theenvironmental conditions and horticultural methodsto optimize edible biomass production and lifesupport functions in candidate crop species. Environmentalconditions include carbon dioxide (CO 2 )concentration, light quality and quantity, temperature,relative humidity, and nutrient media elementalconcentrations. An important considerationof this task involves screening different cultivars(cv.) of candidate crops and the compilation of cropgrowth data for inclusion in a crop handbook. Thiseffort uses a standardized testing procedure forcrop species recommended by a panel of plant scientistswho met at KSC in May 1997. Developmentof crop management strategies for reuse of nutrientsolutions with a special emphasis on biologicallyactive organic materials that may accumulate in thenutrient solution is being addressed. This includesthe coordination of NASA-supported tasks at theNew Jersey NASA-Specialized <strong>Center</strong> of Researchand Training (NJNSCORT) with tomato and saladcrops; Tuskegee University with peanut and sweetpotato;Utah State University with wheat, rice,and soybean; and NASA Research Announcement(NRA) grant recipients for other candidate crops.Other significant collaborations include CornellUniversity on studies with dry bean, snap bean,and spinach.The development of a bioregenerative life supportsystem requires that the horticultural methodologiesand the range of suitable environmentalconditions for various candidate crops be wellunderstood. In order to maximize the benefit tothe Advanced Life Support (ALS) Program, this isan integrated activity requiring coordination withseveral research organizations and ongoing ALStasks.The candidate crop research conducted at KSCduring <strong>2000</strong> included:• Beans: Full life-cycle tests examining the growthand yield characteristics of both dry beans (cv.Etna) and snap beans (cv. Hystyle) at CO 2 con-centrations of 400, 1,200, 4,000, 8,000, and 16,000parts per million (ppm) were completed. Thiseffort was in collaboration with Cornell Universityand Tuskegee University.• Spinach, radish, and lettuce: Tests were conductedthat measured photosynthetic efficiencyand photomorphogenic response of these saladcrops in the presence of narrow- and broadspectrumlighting emissions from various lamptechnologies. Lamps tested included light-emittingdiode (LED), sulfur-microwave, fluorescent,and high-pressure sodium (HPS). These plantgrowth studies were completed in collaborationwith the ALS Program, the KSC’s <strong>Center</strong> Director’s Discretionary Fund, the NRA grant toDynamac Corporation, and several universities.• White potato: Tests were conducted to determinemanagement approaches for reuse ofhydroponic nutrient solutions for successivegenerations of potato crops. Large-scale productionof potato was maintained to further characterizea tuber-inducing factor that accumulates inhydroponic nutrient solutions.• Wheat: Tests were conducted in collaborationwith the resource-recovery/water-recovery taskto determine the effect of different surfactantbasedgray water on the vegetative growth ofwheat. In addition, tests investigating the effectsof using recovered nutrients from leached freshor oven-dried composted inedible wheat biomasswere completed.Key accomplishments:• 1999: Completed experiments investigating theeffects on the growth of wheat by additions ofleachates to composted inedible wheat biomassto the hydroponic nutrient solutions. Completedexperiments investigating the dose-response ofgray water (Igepon) on the growth and yield ofwheat.• <strong>2000</strong>: Completed experiments investigating the140
Research and <strong>Technology</strong> <strong>2000</strong>/<strong>2001</strong>effects of super-elevated CO 2 onthe growth and stomatal conductanceof bean. Completed experimentsinvestigating the effectsof growing wheat hydroponicallyon recovered nutrients from freshor oven-dried compost leachates.Completed experiments investigatingthe growth and yield of wheaton anionic, nonionic, and amphotericsurfactants. Defined croptestingobjectives consistent withnear-term Mars mission scenarioswith the ALS BIO-Plex Salad CropTiger Team. Nine peer-reviewedmanuscripts, two book chapters,and seven NASA Technical Memorandawere published.Key milestones:• <strong>2001</strong>: First edition of the crophandbook for ALS candidate crops.Completion of tests examining theeffects of super-elevated CO 2 onthe growth and stomatal conductanceof bean, lettuce, and radish.Completion of onion and radishcultivar evaluation as part of thesalad crop inclusion in the BIO-Plex.• 2002: Completion of testsinvestigating the environmentalresponses of onion and radish todefine crop requirements for theBIO-Plex. Preintegration testing ofother salad crop species for theBIO-Plex.Joseph Anfield of Tuskegee University Performs Stomatal ConductanceMeasurements on Beans Grown at 8,000 ppm CO 2 as Part of a CollaborativeEffort With NASAContact: Dr. J.C. Sager (John.Sager-1@ksc.nasa.gov), YA-D3, (321) 476-4270Participating Organizations: Dynamac Corporation(Dr. G.W. Stutte, Dr. G.D. Goins,and N.C. Yorio), Utah State University (Dr.B. Bugbee), Cornell University (D. DeVilliers,C.F. Johnson, and Dr. R.L. Langhans),Rutgers University (Dr. H. Janes), andTuskegee University (Dr. D. Mortley and J.Anfield)Dr. Gregory Goins of Dynamac Corporation Examines HydroponicallyGrown Lettuce Plants That Were Produced With the Newly DevelopedSulfur-Microwave Lamp141
Biological SciencesImpact of Elevated Carbon Dioxide on a Florida Scrub Oak EcosystemRising atmospheric carbon dioxide (CO 2 ) has thepotential to stimulate carbon accumulation in ecosystemsthrough direct effects on photosynthesisand growth of plants. It is not clear if in thelong term (years to decades) CO 2 stimulation ofplant growth would add significant amounts ofanthropogenic carbon (either as woody tissue orsoil carbon) to ecosystems (removing it from theatmosphere) because growth of native species isoften limited by the supply of water and nutrients,particularly nitrogen. This is an important questionin determining whether there will be an acclimationof natural ecosystems to rising atmosphericCO 2 . It is also a fundamental question in evaluatingglobal climate change. In 1990, KSC and theSmithsonian Environmental Research <strong>Center</strong> conducteda pilot study to evaluate the feasibility ofresearch on these fundamental questions within theFlorida scrub oak ecosystem at KSC. The successof that pilot study resulted in a proposal that wasfunded by the Department of Energy to set up afield study site at KSC. Since May 1996, 16 opentopchambers (see figure 1) have been operated ina scrub oak ecosystem at KSC at normal ambientor elevated (normal ambient plus 350 parts permillion) atmospheric CO 2 . After 2-1/2 years, thecombined effect of elevated CO 2 on shoots, roots,microbial biomass, and soil carbon yielded a stimulationof 500 grams per square meter in ecosystemcarbon.Results of the research to date were reportedin 17 scientific papers (with an additional 14 inreview) and presented at numerous national andinternational meetings. Over the next 3 years, thestudy will focus on:• Physiological responses and acclimation to highCO 2• Growth in roots and shoots• Effects of CO 2 on the plant and ecosystem waterbalance• Source of nitrogen required to supply theapproximately 80-percent stimulation of newplant growth• Net ecosystem carbon assimilation by using thelarge open-top chamber (see figure 2) as a gasexchange cuvette• Measurement of ecosystem gas exchange in thechambers exposed to normal ambient CO 2 withthe net ecosystem gas exchange determined byeddy flux measurements• Construction of a carbon budget based on ecosystemgas flux and the pools of carbon in plants,microbes, and soilThe Florida scrub oak ecosystem at KSC hasa number of unique features as a study site fordetermining the impacts of elevated atmosphericCO 2 :• The fire return cycle in Florida scrub is about 10years.• This system is about to enter a canopy closure.• The major oaks are clonal, permitting environmentx genotype experiments.• Scrub oak is low in stature permitting many replications.• This ecosystem is subtropical and metabolicallyactive.• This system has all the essential elements offorest ecosystems: a large woody component,deciduous leaves, perennial growth, a largebelow-ground biomass, and a mature nutrientcycle with root closure.The work to date indicates the scrub oak ecosystemresponded vigorously to the elevated CO 2treatment since the outset of the study in May 1996.A large stimulation of growth was expected afterthe site was initiated following a controlled burn;and this has happened – rising from 44 percent thefirst year to nearly 80 percent for both shoot andfine-root biomass the fourth year. On the otherhand, the reduction of evapotranspiration with aconsequent increase in soil water was a surprise, aswas the magnitude of the increase in the standingcrop of nitrogen in the biomass. While the sourceof water has been identified (using stable isotopes)as being primarily ground water, the source of142
Research and <strong>Technology</strong> <strong>2000</strong>/<strong>2001</strong>the additional nitrogen needed to supply thelarge stimulation in the biomass of shoots androots has yet to be determined. Support for thisproject comes from NASA, the Mellon Foundation,the National Science Foundation, the SmithsonianInstitution, and the Department of Energy.The main effects of elevated atmospheric CO 2 are:Figure 1. Location of the Elevated CO 2 Study Site Nearthe Apollo Visitors <strong>Center</strong> East of State Road 3 (The BoardWalk, 16 Chambers, and Support Trailers Are Visible in ThisOrthophoto)• Acclimation of photosynthesis in subdominantsQ. geminata and Q. chapmanii but not indominant species, Q. myrtifolia; small reduction(17 percent) in respiration per unit biomass.• Stimulation of growth of shoots increased from44 percent in 1996 to 75 percent in 1999;increased growth of roots 80 percent in 1998.• Relatively smaller stimulation of leaf area (15 to30 percent) than shoot biomass.• Stimulation of net ecosystem gas exchange by200 percent in 1996 reduced to 70 percent in1999; increased ecosystem respiration per unitof ground area.• Reduced stomatal conductance, stem flow, andevapotranspiration; increased volumetric soilwater.• Increased nitrogen fixation by increasedgrowth of legume, Gallactia Elliottii.• Total ecosystem carbon increased 500 gramsper meter squared, primarily in fine roots.Contact: Dr. W.M. Knott (William.Knott-1@ksc.nasa.gov),YA-D3, (321) 867-6987Participating Organizations: Smithsonian Institution (Dr.B.G. Drake, Dr. G. Hymus, Dr. J. Li, D. Johnson, andT. Snead), Old Dominion University (Dr. F. Day),Dynamac Corporation (Dr. R. Hinkle), Northern ArizonaUniversity (Dr. B. Hungate), University of Nevada at Reno(Dr. D. Johnson), University of Illinois (Dr. S.P. Long),Smithsonian Environmental Research <strong>Center</strong> (Dr. P. Megonigal),University of South Florida (Dr. P. Stiling), andNASA (Dr. S. Dore)Figure 2. Open-Top Chambers at KSC143
Biological SciencesGround-Based Testbed for Evaluating Plant Remote SensingTechnologies and Plant Physiological Responses to StressorsRemote sensing methods for determining biomass,water status, photosynthetic rates, tissuechemical concentrations, and biophysical featuresof vegetation are recognized as important objectivesfor research in agriculture, terrestrial ecology,and earth system science. One problem facingplant researchers in these areas is the inability toprecisely control the physiological status of testplants grown in conventional soil or hydroponicconditions. In addition, no system exists that willallow researchers to precisely control and monitorroot water potentials, nutrients delivered, tracechemicals, toxic chemicals, or exposures in thecase of toxicity testing. To address these issues,the patented Porous Tube Plant Nutrient DeliverySystem (PTPNDS) was integrated and expanded.The PTPNDS was previously developed at KSC toprovide water and mineral nutrients to the roots ofplants in microgravity.The initial system that was constructed consistsof 24 porous tube units, configured in three setsof eight tubes to allow for experimental replicationof treatments. Each set is connected to a manifoldthat is connected to an individual standpipe tocontrol the applied water potential (hydraulicpressure) of that set of tubes. The system was constructedwithin a controlled-environment chamberthat controls temperature to within ±0.5 degreeCelsius. Plant lighting consists of four to eight400-watt metal fixtures providing approximately350 to 700 micromoles per second per square meterat canopy height. The nutrient solution reservoiris a tank holding 100 liters of solution, which ispumped to the standpipes using a submersiblepump. The flow of solution through the tubes isaccomplished by a gravity siphon established atthe downstream end of the tubes, which drain intoa common drainpipe that returns the solution tothe reservoir. In the current configuration, all theplants receive solution from a common reservoir.The standpipes are adjusted vertically to imposevarying applied water potentials to the roots. Initially,as wide a range of water potentials as ispractical will be imposed among the three levels.As data is obtained, continued studies will determinehow small the difference can be and still beresolved by the instrumentation.Fitting From Nutrient SupplyOuter Open Tubular Support With SlotPorous Ceramic Filter TubeWhite/Black PolyethyleneWhite/BlackPolyethyleneAir <strong>Space</strong>for Roots2.1 cm ID2.3 cm OD<strong>Space</strong>for SeedsOuter Open Tubular Support With SlotPorous Ceramic Filter TubeNutrient SolutionFitting to Pump andNutrient SupplyAssembled Cross SectionConstruction and Components of the Microporous Tube System144
Research and <strong>Technology</strong> <strong>2000</strong>/<strong>2001</strong>Key accomplishments:• <strong>2000</strong>: Utilized materials on hand, existingfacilities, and manpower provided by theSummer Industrial Fellowship for Teachersprogram to build the prototype system. Conductedan initial plant growth experiment todefine system performance parameters utilizingwheat and radish as test crops. Submitteda proposal to the Florida <strong>Space</strong> ResearchInstitute to obtain additional funding (theproposal was not selected for funding). Submitteda proposal to the <strong>Center</strong> Director ’sDiscretionary Fund for funding. Submittedan abstract for presentation at the <strong>2001</strong> FloridaAcademy of Sciences annual meetingdescribing the system and initial data.Key milestones:Radish and Wheat Plants Being Grown on the Porous Tube System• <strong>2000</strong>: Constructed and tested the prototypesystem. Developed proposals to obtain funding.• <strong>2001</strong>: Develop a second-generation systemfor additional performance testing. Collectinitial experimental data on plant physiologyAverage Percent Water Content of Plant MaterialFrom a Preliminary Study Using the Porous Tube SystemPlant PartRadish bulbsRadish rootsRadish topsWheat rootsWheat topsApplied Water Potential-5.0 cm H 2 O-2.5 cm H 2 O-0.5 cm H 2 O-5.0 cm H 2 O-2.5 cm H 2 O-0.5 cm H 2 O-5.0 cm H 2 O-2.5 cm H 2 O-0.5 cm H 2 O-5.0 cm H 2 O-2.5 cm H 2 O-0.5 cm H 2 O-5.0 cm H 2 O-2.5 cm H 2 O-0.5 cm H 2 OPercent Water90.6391.1892.9193.0393.8194.9486.3487.0387.9393.6193.3299.5048.1952.8457.16and remote sensing signatures. Publish orpresent results to the scientific community.• 2002: Refine the system design and addadditional monitoring, control, and datacollection systems. Conduct additionalexperiments to characterize system performanceutilizing native species and/orcrop plants. Produce drawing of the tubesystem, photos of the system with plants,and the results of grow-out.Contact: Dr. W.M. Knott (William.Knott-1@ksc.nasa.gov), YA-D3, (321) 321-6987Participating Organization: Dynamac Corporation(Dr. T.W. Dreschel and C. Hall)Note: The plants were grown on three sets of eighttubes for 10 weeks at an applied water potential of-0.05 centimeter (cm) water (H 2 O), and then thewater potential on two sets was changed 2 weeksprior to harvest. In this case, the differences were notsignificant but indicated a possible trend. In futurestudies, plants will be cultured during the entire lifecycle at different applied water potentials.145
Biological SciencesSurvival of Terrestrial Microorganisms on <strong>Space</strong>craft Componentsand Analog Mars Soils Under Simulated Martian ConditionsActivities that are critical to the success of theMars sample-return missions include modeling themicrobial ecology of outbound spacecraft and predictingwhether terrestrial microorganisms mightsurvive and replicate on Mars. If terrestrial microorganismspresent on spacecraft surfaces surviveand replicate on Mars, then their presence onoutbound spacecraft might affect the success ofthe sample-return missions. Several studies inthe literature support the conclusion that microorganismscan easily survive in extraterrestrial environmentsif they are shielded from ultraviolet (UV)irradiation from the Sun. However, no studieshave appeared in the literature that accurately simulatedthe survival of terrestrial microorganismson spacecraft surfaces under realistic conditions oftemperature, gas composition, pressure, and UVirradiation expected on Mars. Such informationwill be significant in the near future as spacecraftsanitation and processing procedures are developedfor the 2003 and 2005 Mars landers.The MSC is a stainless-steel low-pressure cylindricalchamber with internal dimensions measuring1.5 meters in length by 1 meter in diameter.The MSC is configured with a liquid-nitrogen(LN 2 ) jacket within the chamber. The LN 2 jacket’sprimary function will be to reduce the thermalloadingfrom the external wall of the chamberand, thus, enhance the low-temperature control ofexperimental hardware assembled on the flat workingsurface of the chamber. Control of atmosphericpressure will be achieved by a solenoid-actuatedcontrol system connected to a bottled gas mixturethat simulates the Martian atmosphere. Bottled gasmixtures will contain carbon dioxide (95.3 percent),nitrogen (2.7 percent), argon (1.7 percent), oxygen(0.2 percent), carbon monoxide (0.07 percent), andwater (0.03 percent). The gas composition used inthese experiments is based on the results of the twoViking missions.Key accomplishments (<strong>2000</strong>):The primary objective of this research is todevelop an empirically derived model of thesurvival of terrestrial microorganisms (found onspacecraft surfaces) under robustly simulated Martianconditions in order to predict whether spacecraftcontaminants will survive on Mars. Lethaldose rates (LD 99 ) of microorganisms will be calculatedto predict the biocidal effects of UV irradiationon Mars for different landing sites anddifferent mission scenarios. A second objective isto determine the minimum environmental conditionsrequired for microbial replication on Mars.These results will be used to predict forward contaminationrisks to rover landing sites and Marsglobal environments. Research will test microbialsurvival under various conditions of UV irradiation,gas pressure, oxygen partial pressures, anddust layers under simulated Martian conditions.Experiments will be conducted in the Mars SimulationChamber (MSC) operated by the BiologicalSciences Branch of the Engineering and ScienceDivision (see the figure).• Design of a Mars normal UV-irradiation lightsource was completed. The UV light source willbe installed on the MSC in the Operations andCheckout Building. The UV lighting system willproduce a Mars normal spectrum (200 to 1200nanometers) that will be delivered to the experimentalhardware in the chamber through a seriesof fiber-optic bundles.• Design and fabrication of several pieces ofresearch equipment were completed. Theresearch equipment will be used to control andmodify the spectral quality of light strikingspacecraft components within the MSC.• Laboratory procedures for the growth, manipulation,and assay of bacterial species intended forthis project were completed.Key milestones (<strong>2001</strong>):• All equipment will be installed within the MSCbeginning in March.• Experimental chamber calibration tests will becompleted by May 1.146
Research and <strong>Technology</strong> <strong>2000</strong>/<strong>2001</strong>• Three experiments are scheduled:– Survival of the bacterium,Bacillus subtilis, on the surfacesof several spacecraftcomponents– Effects of dust on the protectionbacteria present on spacecraftat the time of landing onMars– Effects of direct versus diffuseUV irradiation on bacterialsurvival on spacecraft componentsContact: Dr. W.M. Knott(William.Knott-1@ksc.nasa.gov), YA-D3,(321) 867-6988Participating Organizations: AmesResearch <strong>Center</strong> (R. Mancinelli, L. Rothschild,and C. McKay), Jet PropulsionLaboratory (R. Kern), and Dynamac Corporation(A.C. Schuerger)(a)(b)(c)(d)(e)(f)(g)(h)The Mars Simulation Chamber (MSC)Two 450-watt Xenon-arc lamps will be used to generate a Mars normallight environment including the production of high levels of UV light.The outer shell of the MSC.The bacterial samples are placed on this surface and exposed to Marsnormal levels of pressure, gas composition, temperature, and UV light.The metal supports above the surface where the bacteria will be placed areused to support the fiber-optic bundles that will hang down from the top ofthe chamber. The fiber-optic bundles will collect light from the Xenon-arclamps and direct it toward the bacteria sitting on item labeled “c.”Liquid nitrogen is required to lower the temperature of the experiments to-85 °C (-121 °F) inside the chamber. This simulates the low temperaturesencountered on Mars at night. The daytime highs for Mars are between-10 and +10 °C (around 20 to 45 °F).The Mars Simulation Chamber has an automatic control system that canbe used to simulate a diversity of Mars surface conditions.The blue tank contains the “Mars gas” mix. It is composed of carbondioxide (95.3%), nitrogen (2.7%), argon (1.6%), oxygen (0.13%), andwater vapor (0.03%).The liquid nitrogen cold-plate uses liquid nitrogen from the tanks outsidethe chamber to accurately control temperature in the Mars SimulationChamber.147/148